11email: mariavittoria.legnardi@phd.unipd.it 22institutetext: Istituto Nazionale di Astrofisica - Osservatorio Astronomico di Padova, Vicolo dell’Osservatorio 5, Padova, IT-35122 33institutetext: Research School of Astronomy and Astrophysics, Australian National University, Canberra, ACT 2611, Australia 44institutetext: Istituto Nazionale di Astrofisica - Osservatorio Astrofisico di Arcetri, Largo Enrico Fermi, 5, Firenze, IT-50125 55institutetext: Center for Galaxy Evolution Research and Department of Astronomy, Yonsei University, Seoul 03722, Korea 66institutetext: South-Western Institute for Astronomy Research, Yunnan University, Kunming, 650500 P. R. China
On the original composition of the gas forming first-generation stars in clusters: insights from HST and JWST
Globular cluster (GC) stars composed of pristine material (first-generation, 1G, stars) are not chemically homogeneous, as they exhibit extended sequences in the ”Chromosome Map” (ChM). Recent studies characterized 1G stars within the center of 55 Galactic GCs, revealing metallicity variations. Despite this progress, several unanswered questions persist, particularly concerning the link between the 1G metallicity spread and factors such as the radial distance from the cluster center or the host GC parameters. Additionally, it remains unclear whether the extended 1G sequence phenomenon is exclusive to old Galactic GCs with multiple populations. This work addresses these open issues, examining 1G stars in different environments. First, we combine Hubble Space Telescope (HST) and James Webb Space Telescope photometry of the GC 47 Tucanae to study 1G stars at increasing distances from the cluster center. We find that metal-rich 1G stars are more centrally concentrated than metal-poor ones, suggesting a metallicity radial gradient. Additionally, the two groups of 1G stars share similar kinematics. Since our analysis focuses on giant stars in the cluster center and M dwarfs in external fields, we discuss the possibility that the metallicity distribution depends on stellar mass. Subsequently, we analyze HST multi-band photometry of two simple-population clusters, NGC 6791 and NGC 1783, revealing elongated sequences in the ChM associated with metallicity variations. Finally, we investigate the 1G color distribution in 51 GCs, finding no connections with the host cluster parameters. These results shed light on the complex nature of 1G stars, providing insights into the GC formation environment.
Key Words.:
techniques: photometric - Hertzsprung-Russell and C-M diagrams - stars: abundances - stars: Population II - globular clusters: general - open clusters and associations: individual (NGC 6791)1 Introduction
The presence of multiple stellar populations in Galactic globular clusters (GCs) is now firmly established (see Bastian & Lardo, 2018; Milone & Marino, 2022, for recent reviews). This phenomenon generated several questions concerning the origin of GCs, many of which are still to be answered.
The ”Chromosome Map” (ChM; Milone et al., 2015) is a powerful tool for investigating stellar populations within GCs. It is a pseudo-two-color diagram extremely sensitive to the chemical composition of distinct stellar populations, thereby enhancing their separation. The standard vs. ChM (Milone et al., 2017) is derived from photometry in the F275W, F336W, F438W, and F814W bands of the Hubble Space Telescope (HST). This photometric diagram is particularly useful to separate stellar populations within the red-giant branch (RGB) or the upper main sequence (MS). The advent of the James Webb Space Telescope (JWST) allowed the construction of new ChMs, derived by combining optical and near-infrared bands of the HST and the JWST. As an example, recent works (Milone et al., 2023a; Ziliotto et al., 2023) introduced the vs. and vs. pseudo-two color diagrams, optimized to separate distinct stellar populations in the M-dwarfs regime at the bottom of the MS. Despite their differences, all ChMs exhibit two main groups of stars, called first- (1G) and second-generation (2G). 1G stars are composed of pristine material reflecting the chemical composition of their natal cloud, whereas 2G members exhibit various degrees of chemical enrichment.
In addition to their effectiveness in identifying and characterizing multiple stellar populations, ChMs also provide direct insights into the formation environment of GCs. In this context, a notable discovery based on RGB ChMs indicates that the 1G sequences in most Galactic GCs do not conform to simple stellar populations. Instead, they exhibit either a spread or a bimodality in the ChM (see Figs. 3-7 of Milone et al., 2017, for a comprehensive collection of ChMs in 57 GCs). This phenomenon is not limited to RGB stars, as Dondoglio et al. (2021) observed extended 1G sequences along the red horizontal branch (HB) in 12 clusters. More recently, the 1G color extension has been detected even in the ChMs of unevolved MS stars (Legnardi et al., 2022; Milone et al., 2023a), suggesting that chemical variations are likely imprinted in the environment where 1G stars originated.
In the standard ChM, 1G stars exhibit a significant dispersion in the direction of the x-axis while maintaining a relatively constant position along the y-axis. This observation implies a connection between the extension of 1G stars and variations in the effective temperature among stars with similar F814W magnitude. The spread in helium content can impact the effective temperature of stars, as initially observed by Milone et al. (2015) to interpret the extended 1G sequence that they observed in the ChM of NGC 2808. To account for this phenomenon, Milone et al. (2015, 2018b) explored various physical mechanisms and found that none of them could produce pure helium enrichment without concurrent changes in light elements. Alternatively, helium inhomogeneities may come from events that occurred in regions of the Universe where the baryon-to-photon ratio was significantly enhanced (e.g., Arbey et al., 2020).
The spectroscopic investigation by Marino et al. (2019a) suggested that variations in metallicity, rather than helium content, may be responsible for the extended color range observed in 1G stars. In their study, Marino and collaborators analyzed 18 1G stars within the Galactic GC NGC 3201 and observed a dispersion in [Fe/H] of dex. Recently, the photometric research by Legnardi et al. (2022) further supported this conclusion. To distinguish between helium and metallicity effects, Legnardi and collaborators introduced a pseudo-two-magnitude diagram aimed at maximizing the separation between stellar populations with varying iron content. Their analysis revealed a spread of [Fe/H], rather than helium (Y), among 1G stars in the two investigated targets, namely NGC 6362 and NGC 6838. Expanding this finding to a large sample of GCs, Legnardi et al. (2022) estimated that internal variations in iron content within the 1G of 55 Galactic GCs range from less than dex to dex and mildly correlate with GC mass.
As discussed by Marino et al. (2019a), unresolved binaries among 1G stars can provide extended sequences in the ChM and spurious lower metallicity abundances for stars with low values. However, they showed that very large fractions of binaries are needed to reproduce the observations, in contrast with what is observed in Galactic GCs and intermediate-age Magellanic Cloud (MC) star clusters (Milone et al., 2012a; Mohandasan et al., 2024). Hence, they concluded that very likely binaries provide a minor contribution to the color extension of the 1G (see also Kamann et al., 2020; Martins et al., 2021).
The discovery of chemical abundance variations among 1G stars provides the opportunity to constrain the formation mechanisms of the stellar populations in GCs (e.g., D’Antona et al., 2016). The observed [Fe/H] variations could be indicative of either chemical inhomogeneities within the original pristine material where the 1G population formed or the result of internal stellar feedback processes taking place within the clusters themselves (McKenzie & Bekki, 2021). Moreover, the evidence that 2G stars of NGC 6362 and NGC 6838 exhibit smaller metallicity variations than the 1G is consistent with the scenarios where 2G stars formed in a high-density environment in the cluster center (Legnardi et al., 2022). Finally, the color extension of 1G stars in the ChM would constrain the late stages of stellar evolution in star clusters. Indeed, the 1G stars of GCs with the same metallicity but different HB morphology span different ranges of [Fe/H] (Legnardi et al., 2022).
Despite extensive observational efforts, several aspects of the extended 1G sequence phenomenon remain unexplored. For instance, it is yet uncertain whether the metallicity distribution of 1G stars depends on factors such as the radial distance from the cluster center or other parameters associated with the host GCs. Similarly, the status of extended 1G sequences as a unique characteristic exclusive to Galactic GCs with multiple populations, or their potential existence in Galactic open clusters or massive intermediate-age star clusters in the MCs, remains unknown. This work aims to shed light on these points, thus providing a comprehensive analysis of chemical inhomogeneities among 1G stars in Galactic and extragalactic stellar clusters.
First, we study metallicity variations among 1G stars of the Galactic GC NGC 104 (47 Tucanae). In this context, 47 Tucanae is an ideal target. Indeed, the evidence that 2G stars are more centrally concentrated than the 1G (e.g., Milone et al., 2012b; Cordero et al., 2014; Dondoglio et al., 2021; Lee, 2022), indicates that this GC retains information on the radial distribution of its multiple populations at formation. Moreover, a recent spectroscopic analysis conducted by Marino et al. (2023) uncovered that 1G stars in 47 Tucanae display variations in [Fe/H] of the order of dex, thus corroborating previous findings obtained through photometry. The second part of the present research investigates whether clusters with no evidence of multiple populations exhibit an extended ChM sequence comparable to that of 1G stars in Galactic GCs. To do that, we focus on the Galactic open cluster NGC 6791, and the Large Magellanic Cloud (LMC) cluster NGC 1783. Finally, we come back to Galactic GCs looking for possible relations between the metallicity distribution of 1G stars and the main parameters of the host cluster.
The paper is organized as follows. Section 2 presents the datasets and the techniques employed to reduce them. Section 3 is dedicated to 1G stars of 47 Tucanae, whereas the two simple-population clusters investigated in this work and the Galactic GCs are the targets of Sect. 4 and 5, respectively. Section 6 provides the summary of this work together with conclusions.
2 Observations and data reduction
In the following, we describe the observations and the photometric and astrometric catalogs employed for this work. For simplicity, we discuss the data on 47 Tucanae, on the simple-population star clusters NGC 6791 and NGC 1783, and the other Galactic GCs, separately.
2.1 47 Tucanae
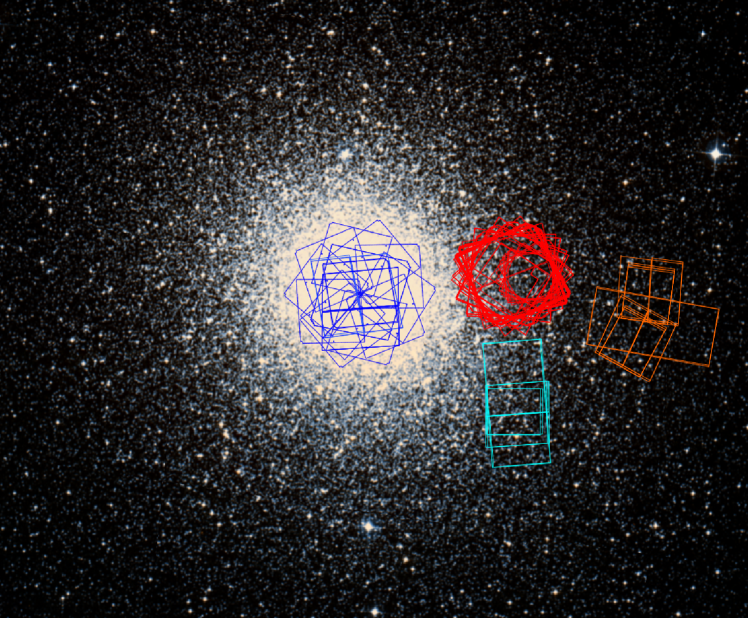
We analyzed the chemical composition and the internal kinematics of 1G stars in the Galactic GC 47 Tucanae by using data of four distinct regions, located at progressively larger distances from the cluster center. Figure 1 illustrates the footprints of the four regions discussed in this paper, including the cluster center and three external fields, denoted as A, B, and C, respectively.
The Central field (RA, DEC; blue footprints) covers the innermost region of arcmin2 within the cluster. In this area, we used the catalog by Milone et al. (2017), which includes photometry in the F275W and F336W bands of the Ultraviolet and Visual Channel of the Wide Field Camera 3 (UVIS/WFC3) and in the F435W, F606W, and F814W filters of the Wide Field Channel of the Advanced Camera for Survey (WFC/ACS) on board the HST. To study the kinematics of 1G stars in the core of 47 Tucanae, we took advantage of stellar proper motions from Libralato et al. (2022).
Fields A (RA, DEC; red footprints) and B (RA, DEC; cyan footprints) are located at distances of and arcmin west from the cluster center, respectively. For those regions, we relied on the photometric catalogs and proper motions derived recently by Milone et al. (2023a). Observations of field A were taken with the near-infrared channel of the Wide Field Camera 3 (IR/WFC3) through the F110W and F160W bands and with the WFC/ACS in the F606W and F814W filters. For field B, instead, Milone and collaborators used exposures collected through the near-infrared camera (NIRCam) on board the JWST. This field has been observed also with the UVIS/WFC3 in the F606W filter and with the IR/WFC3 in the F110W and F160W bands. We refer to the aforementioned papers and their respective references for details on the data reduction and the techniques used to measure stellar proper motions.
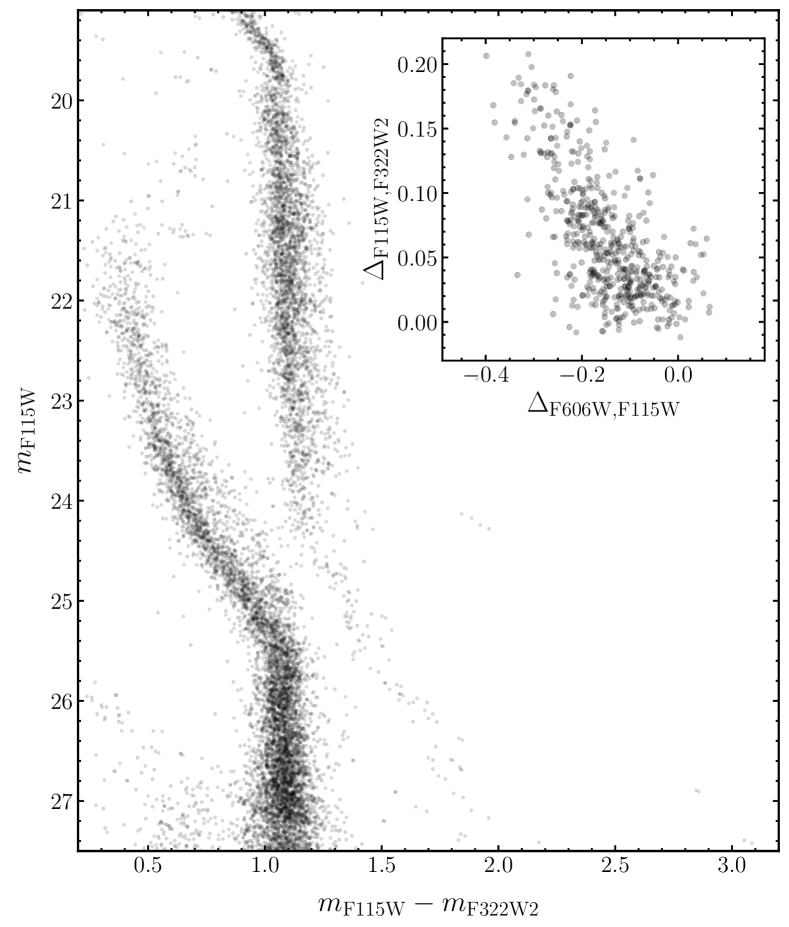
Finally, field C (RA, DEC; orange footprints) is located at a distance of arcmin west with respect to the cluster center. To investigate 1G stars in this outer region we used data obtained with the NIRCam/JWST as part of the GO-2560 program (PI: A. F. Marino), which includes images acquired with the F115W and the F322W2 filters. Moreover, we complemented these observations with HST exposures collected through the UVIS/WFC3 F606W and the IR/WFC3 F110W and F160W bands. The techniques adopted to reduce these observations, as well as to compute stellar proper motions, are described in Marino et al. (2024).
Figure 2 illustrates the vs. color-magnitude diagram (CMD) of 47 Tucanae derived by Marino et al. (2024) for stars within field C. In close analogy with Milone et al. (2023a), this photometric diagram has been used together with the vs. CMD to derive the vs. ChM, plotted in the inset of Fig. 2. Here, 1G stars lay in proximity of the origin, whereas 2G stars extend from ( to .
| DATE | N EXPTIME | INSTRUMENT | FILTER | PROGRAM | PI |
|---|---|---|---|---|---|
| 2013 August 17 | s | UVIS/WFC3 | F275W | 13297 | G. Piotto |
| 2014 April 26 | s | UVIS/WFC3 | F275W | 13297 | G. Piotto |
| 2009 October 04 | s | UVIS/WFC3 | F336W | 13297 | G. Piotto |
| 2013 August 17 | s | UVIS/WFC3 | F336W | 13297 | G. Piotto |
| 2014 April 26 | s | UVIS/WFC3 | F336W | 13297 | G. Piotto |
| 2013 August 17 | 72 s | UVIS/WFC3 | F438W | 13297 | G. Piotto |
| 2014 April 26 | 65 s | UVIS/WFC3 | F438W | 13297 | G. Piotto |
| 2009 October 08 | 30 s | UVIS/WFC3 | F814W | 11664 | G. Brown |
| 2009 October 07 | s | UVIS/WFC3 | F814W | 11664 | T. Brown |
| 2004 September 27 | WFC/ACS | F814W | 10265 | T. Brown |
2.2 Simple-population clusters
To investigate the extended 1G sequence in simple-population clusters, we selected two star clusters, namely NGC 6791 and NGC 1783, with available multi-band HST photometry.
-
•
NGC 6791 is an old ( Gyr, Brogaard et al., 2012) and massive (, e.g., Cordoni et al., 2023a) Galactic open cluster with a super-solar metallicity ([Fe/H], e.g., Boesgaard et al., 2009). In this work, we analyzed the innermost 2.7 2.7 arcmin2 area of NGC 6791 by using HST images collected with the F275W, F336W, F438W, and F814W filters of the UVIS/WFC3 and the F814W band of WFC/ACS. The main properties of these observations are summarized in Table 1. Additionally, to extend our analysis outside the HST field of view, we combined the catalogs of proper motions and stellar positions provided by Gaia Data Release 3 (Gaia Collaboration et al., 2021, DR3) with the ground-based photometry from Stetson et al. (2019).
To derive the astro-photometric catalog for the central region of NGC 6791 we used the computer program KS2 (see, e.g., Sabbi et al., 2016; Bellini et al., 2017; Milone et al., 2023b, for more details), which was developed by Jay Anderson as an evolution of the kitchen_sync software (Anderson et al., 2008). Together with photometry, KS2 also provides a collection of diagnostic parameters that we exploited to select a sample of well-measured stars, as in Milone et al. (2023b, see their Sect. 2.4 for details). Finally, we corrected magnitudes for the effects of differential reddening following the method by Milone et al. (2012a) and Legnardi et al. (2023).
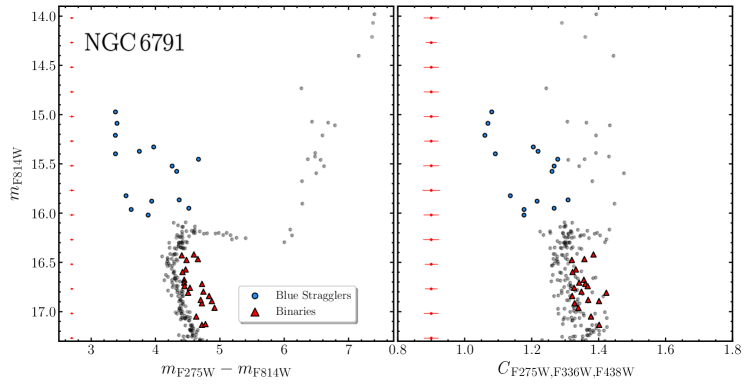
The left panel of Fig. 3 shows the resulting vs. CMD of NGC 6791 that we used to identify candidate binaries and blue stragglers. Similarly to photometric uncertainties, these objects contribute to the color broadening of evolutionary sequences in all CMDs. As an example, in the right panel of Fig. 3 we plotted the vs. pseudo-CMD where the candidate binaries (red triangles) populate the reddest part of the MS, whereas blue stragglers (blue points) exhibit bluer colors than RGB stars. The pseudo-color is sensitive to C, N, and O, thereby increasing the separation between stellar populations with different light-element abundances. The color broadening is comparable to that of observational errors alone, indicated by the error bars on the right panel. This result allowed us to conclude that NGC 6791 is a prototype of a simple-population cluster, thus corroborating previous results based on spectroscopy (e.g., Bragaglia et al., 2014; Villanova et al., 2018) and on near-infrared photometry of M dwarfs (Dondoglio et al., 2022).
To further investigate NGC 6791 over a wide field of view we combined the photometry in the U, B, V, and I bands derived by Peter Stetson (Stetson et al., 2019) together with the coordinates, proper motions, and parallaxes from the Gaia DR3 (Gaia Collaboration et al., 2021). Photometry was obtained through an analysis conducted by Peter Stetson using images gathered from diverse ground-based telescopes. The procedures and computer programs outlined by Stetson et al. (2005) were employed, and the derived photometric data were calibrated against the reference system established by Landolt (1992). We selected a sample of probable cluster members by using the proper motions and the stellar parallaxes from Gaia DR3 and the procedure by Cordoni et al. (2018). Photometry has been corrected for differential reddening (see Legnardi et al., 2023, for details).
-
•
NGC 1783 is an intermediate-age ( Gyr, Milone et al., 2023b) LMC cluster which shows no evidence of multiple stellar populations (Milone et al., 2020). We chose to analyze this object because it is the only simple-population MC cluster for which photometry in the UVIS/WFC3 filter F275W is available in the HST archive. In this work, we employed the catalog of NGC 1783 by Milone et al. (2023b), which includes photometry in the F275W, F336W, F343N, and F438W bands of the UVIS/WFC3 and the F435W, F555W, and F814W filters of the ACS/WFC. Further details about the dataset and the procedures applied to reduce it can be found in the paper by Milone and collaborators.
To determine the photometric uncertainties in the HST dataset of NGC 6791 and NGC 1783 we carried out artificial-star (AS) tests following the method by Anderson et al. (2008). In a nutshell, we generated a list including coordinates and fluxes for 100,000 stars. To do that, we assumed the same radial distribution for the ASs as the one measured for real stars. Moreover, we estimated the magnitudes of ASs by employing a set of fiducial lines derived from the observed CMDs.
To reduce ASs, we used once again KS2 and repeated the procedure described above. Subsequently, similar to our approach with real stars, we took advantage of the various diagnostic parameters provided by KS2 to select a sample of well-measured sources.
2.3 Galactic globular clusters
Legnardi et al. (2022) extensively investigated 1G stars in 55 Galactic GCs based on the ChMs of their RGB stars and inferred their internal metallicity variations. In this work, we further used the same dataset to derive the metallicity distributions of 1G stars and examine whether the color distribution of the 1G sequence is connected to some parameters of the host GCs.
3 An in-depth analysis of first-generation stars in 47 Tucanae
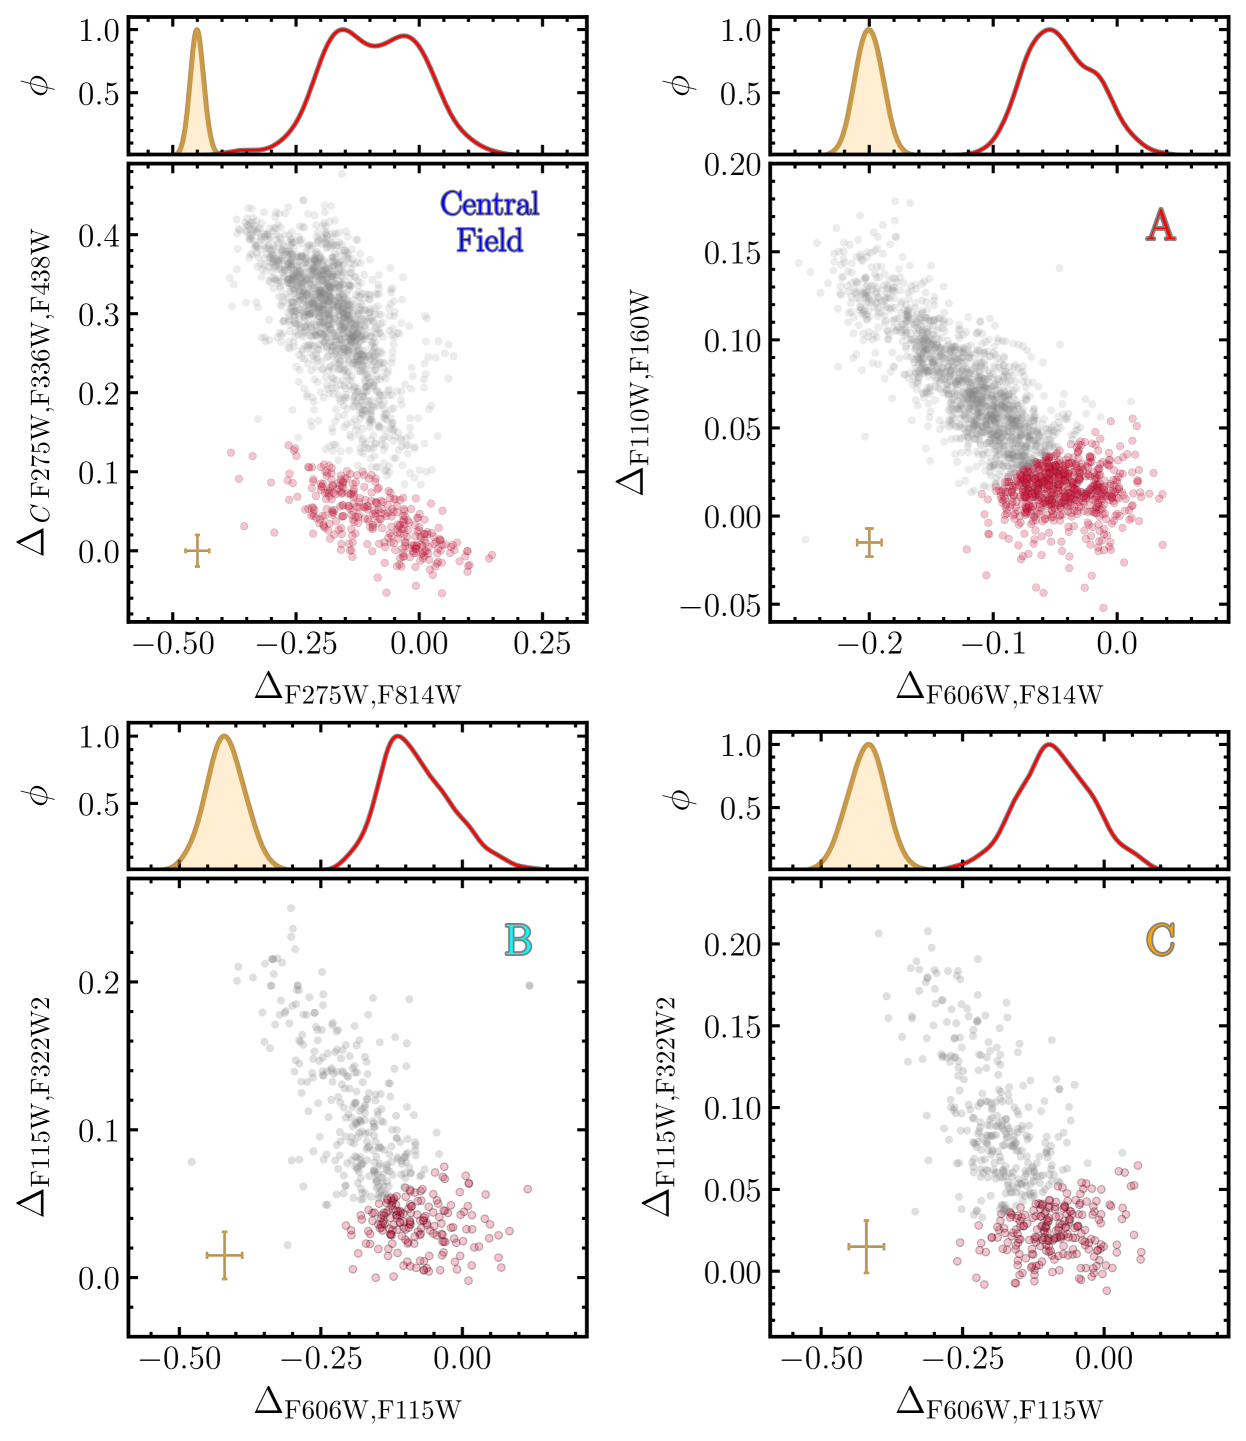
To study 1G stars at progressively larger distances from the center of 47 Tucanae we used the ChMs illustrated in Fig. 4. The vs. ChM of the central field is constructed for evolved RGB stars, whereas the vs. and the vs. ChMs are derived for M dwarfs below the MS knee.
As discussed in previous works (Milone et al., 2017, 2023a), the stars of all ChMs are distributed in two main populations, 1G and 2G, marked with red and gray colors, respectively. To identify 1G and 2G stars in the ChMs of RGB and M-dwarf stars, we adopted a similar selection as Milone et al. (2017, see their Fig. 3) and Milone et al. (2023a, see panel b of their Figs. 14 and B2), respectively111The vs. ChM of field C closely resembles that of field B, hence we used the same criterion for both regions.. In all ChMs, 1G stars lay in proximity of the ChM origin, whereas the 2G sequence extends towards high (, ) and low (, ) values, and exhibits hints of stellar overdensities, especially in the ChMs for M dwarfs.
A visual inspection at Fig. 4 reveals that the 1G stars of 47 Tucanae define an extended sequence along the x-axis of all ChMs. The width of the (, ) pseudo-color for 1G stars is much wider than observational errors alone and is associated with star-to-star metallicity variations (Legnardi et al., 2022; Marino et al., 2023). Additionally, the pseudo-colors of 1G stars exhibit complex distributions, as suggested by the corresponding kernel-density distributions plotted in the upper panels of Fig. 4. Clearly, the 1G kernel-density distribution of the central field shows two peaks located at and mag, respectively. In the M-dwarf ChMs, instead, the frequency of 1G stars reaches its maximum at and mag, gradually declining towards the origin. The vs. ChM exhibits hints of an additional peak at mag.
In the following, we further investigate the 1G stars of 47 Tucanae. Specifically, in Sect. 3.1 we use the pseudo-color broadening observed along the x-axis of the ChMs to derive the metallicity distribution of 1G stars at distinct radial distances from the cluster center and investigate the radial behavior of metallicity variations within the 1G. In Sect. 3.2 we exploit the proper motion catalogs introduced in Sect. 2 to study the internal kinematics of 1G stars.
3.1 The radial distribution of metallicity variations among first-generation stars
To infer the [Fe/H] distribution of 1G stars at different radial distances from the core of 47 Tucanae we applied a similar approach to that described in Legnardi et al. (2022), which is based on the method originally developed by Cignoni et al. (2010; see also Cordoni et al. 2022) to derive the age of young star clusters through the MS turn-on.
First, we generated a grid of simulated ChMs, where all stars share the same helium and light-element contents but have different metallicities. In close analogy with Legnardi et al. (2022), we simulated N stellar populations with [Fe/H] ranging from [Fe/H] to [Fe/H], where [Fe/H] (from Harris, 1996, 2010 update). Then, we combined the simulated ChMs to derive the (, ) histogram distribution. To do that, we multiplied the ChM of each population for , a scaling coefficient that ranges from 0 to 1 and tells how much the population contributes to the final combined (, ) distribution. Finally, we compared the resulting simulated histogram with the observed one by minimizing the Poissonian given by the equation:
| (1) |
where and are the bin values of the observed and simulated 1G stars, respectively. For the minimization, as in Cordoni et al. (2022) and Legnardi et al. (2022), we used the geneticalgorithm Python public library222https://pypi.org/project/geneticalgorithm/.
As an example, the top panels of Fig. 5 compare the ChM of 1G stars in the central field (red points in panel a) with the ChMs of simulated 1G stars (panels b and c). All stars in the ChMs of panel b share the same iron abundances of [Fe/H] and , respectively, whereas the ChM plotted in panel c provides the best match with the observed one. The comparison between the observed and the best-fitting pseudo-color distribution is illustrated in panel d. Similar comparisons for 1G stars within fields A, B, and C are provided in panels e, f, and g, respectively.
Figure 6 illustrates the resulting histograms of [Fe/H] variations among 1G stars in the cluster center, fields A, B, and C, together with their corresponding kernel-density distributions. The [Fe/H] distributions for red giants and M dwarfs span similar intervals of dex, ranging from [Fe/H] to , and exhibit a main peak at [Fe/H].
To compare the cluster center with the external regions, in panels A, B, and C we plotted the kernel-density distribution of the relative iron abundances of 1G stars within the central field (red-dashed line). Clearly, the latter shows a secondary peak centered at [Fe/H] that gradually becomes less evident moving towards the outer fields.
To further investigate the 1G metallicity variations within the cluster, we calculated the average value of the [Fe/H]1G distribution, [Fe/H], for each of the four analyzed fields, that we plotted as a function of the radial coordinate in Fig. 7. On the bottom axis, we normalized the radial coordinate to the half-light radius from Baumgardt & Hilker (2018, ). Conversely, on the top axis, we converted the radial coordinate in parsec by assuming a distance of 4.41 kpc (Baumgardt & Hilker, 2018).
The radial distribution of [Fe/H] suggests a concentration of more metal-rich 1G stars in the innermost cluster regions, whereas in the outer fields, 1G stars have lower average iron content. To demonstrate that this result is not affected by the adopted 1G samples, we repeated the analysis based on 1G stars identified in ChMs that maximize the separation between distinct stellar populations. Our analysis confirmed that we obtained consistent results when deriving [Fe/H] variations from these new samples of 1G stars. As an example, for M dwarfs within field A, we selected 1G stars in the vs. ChM (see Fig. 8 of Marino et al., 2024), finding that the average [Fe/H] variation differs just by dex from the original value. Similar results have been found for field C, where we used the vs. ChM (see Fig. 9 of Marino et al., 2024) to identify a new sample of 1G stars.
However, it is important to note that the outcomes for the central field are derived from RGB stars, while in the other fields, we focused on analyzing M dwarfs. Consequently, it cannot be ruled out that the observed difference in metallicity between the central and external fields may be influenced by the varying stellar masses within these regions.
3.2 Internal kinematics of first-generation stars
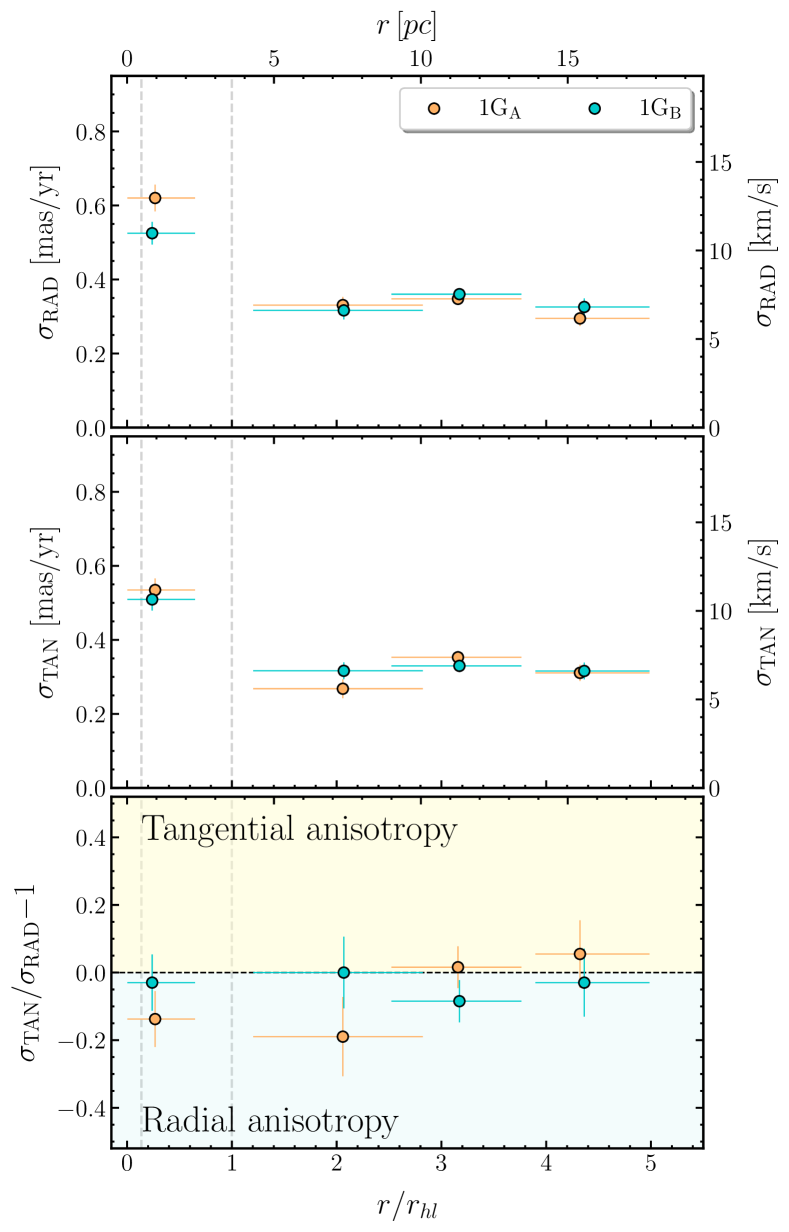
To investigate the 1G kinematics, we first identified two groups of 1G stars based on the direction of their color extension in the ChM, with the criteria that each sample includes approximately half of the 1G members. The two sub-groups of 1G stars, namely 1GA and 1GB, are marked with orange and cyan points in the ChMs of Fig. 8. We then computed the radial () and tangential () velocity dispersions of 1GA and 1GB following the procedure described in Cordoni et al.(2023b; see also Cordoni et al., 2020b, a), which is based on the minimization of the log-likelihood function by Bianchini et al. (2018). We estimated the corresponding uncertainties through the MCMC algorithm emcee (Foreman-Mackey et al., 2013), as in Cordoni et al. (2023b).
The resulting radial and tangential velocity dispersion profiles are illustrated in the upper and middle panels of Fig. 9, respectively. Additionally, we calculated the anisotropy parameter, , that we show as a function of the radial coordinate in the lower panel of Fig. 9, where the horizontal dashed line corresponds to an isotropic stellar system. In each panel, orange and cyan points correspond to 1GA and 1GB stars, respectively, while on the bottom axis, the distance from the cluster center is normalized to the half-light radius from Baumgardt & Hilker (2018, arcmin). On the top axis, instead, we converted the radial coordinate in parsec by assuming a distance of 4.41 kpc (Baumgardt & Hilker, 2018). To ensure having enough statistics, we treated each of the analyzed fields as one circular bin so that the resulting dynamical profiles are populated by four points for each 1G group. The horizontal bars associated with each point indicate the extension of the corresponding radial interval.
Our analysis of 1G stars in 47 Tucanae reveals that 1GA and 1GB stars share similar radial and tangential velocity dispersion profiles, ranging from mas/yr ( km/s) close to the cluster center to mas/yr ( km/s) at a radial distance of . The only exception is represented by the innermost region, where the radial velocity dispersion of 1GA stars is slightly larger than that of 1GB members. The anisotropy profile in the bottom panel of Fig. 9 demonstrates that 1G stars exhibit, on average, an isotropic motion, thus confirming previous results in the literature (Richer et al., 2013; Milone et al., 2018a; Cordoni et al., 2020a). Moreover, 1GA and 1GB stars show no significant difference in their level of anisotropy.
To test whether our selection of 1G sub-samples affected the results, we identified two new groups of 1GA and 1GB stars according to the metallicity distribution derived in Sect. 3.1. Then, we recomputed the velocity dispersion and anisotropy profiles finding consistent results with the original ones. Overall, metal-rich and metal-poor 1G stars exhibit isotropic motions with no significant differences in their radial and tangential velocity dispersion profiles.
The fact that the 1G groups of 47 Tucanae have different radial distributions but similar kinematics would deserve further investigation. Indeed, stellar populations with different radial distributions typically exhibit different kinematics (see, e.g., Richer et al., 2013; Milone et al., 2018a; Cordoni et al., 2020a, for the case of 1G and 2G stars in 47 Tucanae). More data are needed to better constrain the kinematics of 1G stars with different metallicities, whereas dynamic simulations are crucial to shed light on the initial configuration and the dynamic evolution of metal-rich and metal-poor 1G stars in 47 Tucanae.
4 Simple-population clusters: NGC 6791 and NGC 1783
So far, the color broadening of the 1G sequence has been detected only in Galactic GCs with multiple stellar populations. To verify whether this phenomenon depends on the occurrence of multiple stellar populations, in the following we analyze two simple-population clusters, namely NGC 6791 and NGC 1783.
4.1 The extended stellar population of NGC 6791 and NGC 1783
To investigate whether chemical anomalies similar to the ones detected within the 1G of Galactic GCs are common also in simple-population clusters, we derived the vs. ChMs of NGC 1783 and NGC 6791 by extending the method by Milone et al. (2017) to the two analyzed targets.
As an example, to derive the ChM of NGC 1783 we first selected RGB stars with mag. Then, we defined the blue and red boundaries of the RGB in the vs. pseudo-CMD and the vs. CMD. To do that, we divided the sample of selected stars in magnitude bins of size 0.2 mag and for each bin we calculated the 4th and the 96th percentile of the color and pseudo-color distribution. These quantities have been interpolated with the mean magnitude of each bin to derive the fiducial lines that mark the blue and red RGB envelopes. Finally, we took advantage of Eqs. (1) and (2) of Milone et al. (2017) to compute the and pseudo-color. A similar procedure has been used to derive the ChM of NGC 6791, but in this case we considered RGB stars with mag.
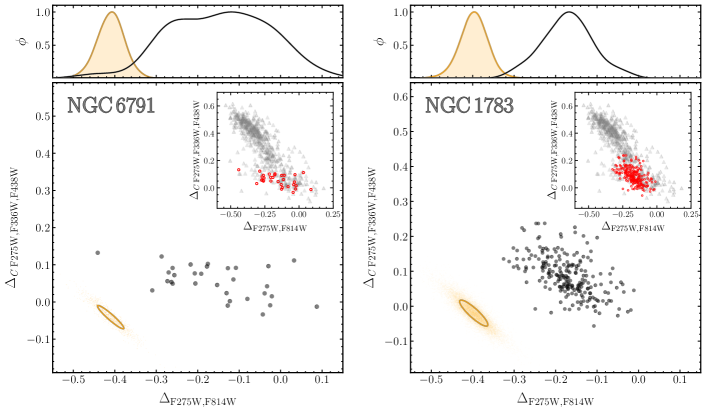
Results are illustrated in the left and right panels of Fig. 10, where we show the ChMs of NGC 6791 and NGC 1783, respectively. In the bottom-left corner of each panel, we plot the distribution expected for a simple stellar population, derived by using ASs, and the ellipse that includes the of the simulated points. Additionally, the top panels of each figure report the kernel-density distribution of observed (black line) and simulated (orange line) stars.
Similarly to the 1G sequences of Galactic GCs, which move from the origin of the ChM to high and low values, the ChMs of NGC 6791 and NGC 1783 exhibit a single stellar population that starts in proximity of ( and extends to ( and (, respectively. The insets of Fig. 10 reinforce this visual impression, as the ChMs of the two investigated targets overlap with the 1G sequence of NGC 6624, which is one of the most metal-rich Galactic GCs ([Fe/H] dex, Harris, 1996, 2010 updated) with available ChM.
As suggested by the corresponding kernel-density distribution in the top panels of Fig. 10, the ChMs of both clusters display an extended sequence in the direction of the pseudo-color. To estimate the contribution of observational errors to the observed color spread, we quantified the color spread of observed and simulated stars in the ChMs of the two investigated targets. We found that the observed color spread of NGC 6791 (=0.1290.018 mag) and NGC 1783 (=0.0580.003 mag) are larger than the corresponding color elongation of a simulated simple stellar population (=0.030 mag and 0.032 mag, respectively).
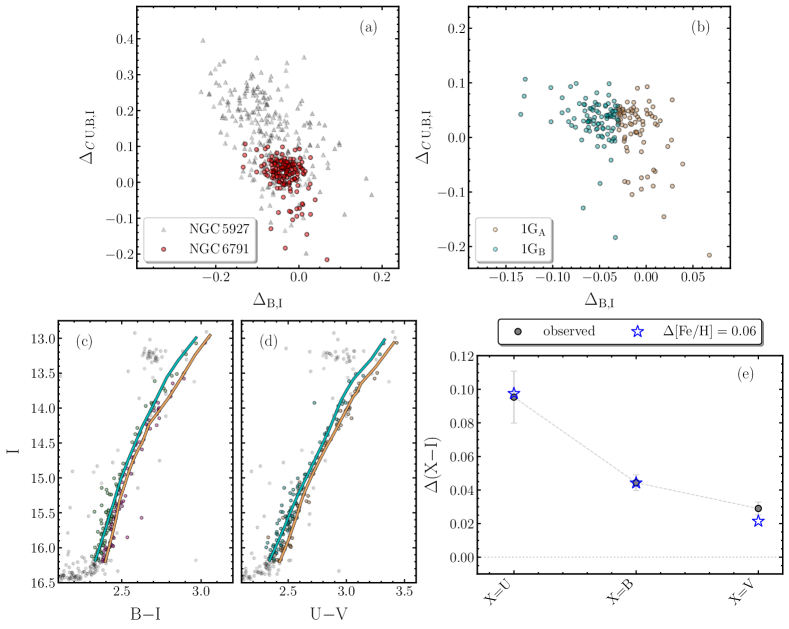
To increase the number of available stars in NGC 6791 and study 1G RGB stars within 10 arcmin from the cluster center, we derived the vs. ChM from ground-based photometry, which is based on the color and the pseudo-color (Jang et al., 2022). A visual inspection at panel a of Fig. 11, where we show the resulting ChM superimposed to the one of NGC 5927 ([Fe/H] dex, Harris, 1996, 2010 updated) derived by Jang et al. (2022), reveals that NGC 6791 exhibits a single stellar population which aligns with the 1G of NGC 5927. This result allowed us to confirm that NGC 6791 is a simple-population cluster.
To further investigate the presence of metallicity variations in NGC 6791, we extended to these clusters the procedure used by Milone et al. (2010, see also , ) to demonstrate that NGC 6752 hosts multiple populations. As illustrated in panel b of Fig. 11, we first identified two groups of stars in the vs. ChM, namely 1GA and 1GB, with the criteria that each sample includes about half of the total number of stars. We then analyzed the distribution of these two groups of stars in CMDs constructed with combinations of filters that are not used to derive the ChM. Panels c and d of Fig. 11 show the I vs. BI and the I vs. UV CMDs where we used orange and cyan colors to identify 1GA and 1GB stars, respectively. As highlighted by the corresponding fiducial lines, the two groups of stars remain well separated in both diagrams, thus corroborating the conclusion that the color differences between 1GA and 1GB stars with similar luminosity are intrinsic.
To quantify the metallicity difference between the two selected groups of NGC 6791 stars, we compared the observed stellar colors with the solar-scaled isochrones from Dotter et al. (2008) that provide the best fit to the I vs. BI CMD. Specifically, we assumed metallicity corresponding to [Fe/H]=0.4 dex, age=8.5 Gyr, distance modulus, (mM)0=13.5 mag, and reddening, =0.1 mag. We selected the two groups of 1G stars identified in panel b of Fig. 11 in the I vs. XI CMDs, where X=U, B, and V, and we derived the corresponding fiducial lines. Subsequently, we calculated the (XI) color difference between the 1GA and 1GB fiducials at a reference magnitude of I15.0 mag. Results are illustrated in panel e of Fig. 11, where we compare the observed color differences between 1GA and 1GB stars with those derived from the best-fitting isochrones. We found that the selected groups of NGC 6791 stars are consistent with a difference in iron abundance of [Fe/H] dex, which provides a lower limit to the maximum iron variations within NGC 6791. In summary, results from ground-based photometry of NGC 6791 confirm the conclusions that we obtained from HST data that this cluster is composed of 1G stars alone, which are not chemically homogeneous.
Our analysis on NGC 6791 and NGC 1783 suggests that the extension of the sequence observed on the ChM of the two simple-population clusters has an intrinsic origin, which is related to star-to-star metallicity variations. Therefore, this phenomenon is not necessarily associated with the occurrence of multiple stellar populations in GCs.
4.2 Metallicity variations within NGC 6791 and NGC 1783
Recent work, based on the color width of RGB stars (W) of 55 Galactic GCs, reveals that the maximum [Fe/H] variations among 1G stars, [Fe/H], range from less than to dex (Legnardi et al., 2022). In the following, we estimate the maximum [Fe/H] spreads of NGC 6791 and NGC 1783 by adapting the procedure of Legnardi et al. (2022) to the two investigated targets.
For each cluster, we first computed the intrinsic pseudo-color extension. To do that, in close analogy with Milone et al. (2017), we subtracted the color errors in quadrature to the observed pseudo-color width, defined as the difference between the 90th and the 10th percentile of the distribution. As suggested by the visual comparison of the ChMs in Fig. 10, the intrinsic width of NGC 6791 (W mag) is consistently larger than that of NGC 1783 (W mag).
Subsequently, we used the relation between the color and metallicity from Dotter et al. (2008) to transform the color extension in [Fe/H] variations, in the assumption that the color spread observed on the ChM is entirely caused by iron spreads. We found that NGC 6791 exhibits moderate [Fe/H] variations ([Fe/H]), whereas NGC 1783 is characterized by a smaller metallicity spread ([Fe/H]).
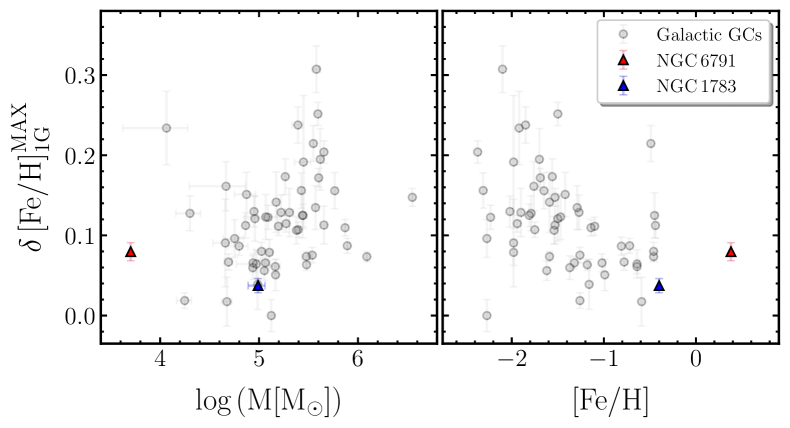
To compare NGC 6791 and NGC 1783 with the 1G stars of Galactic GCs, we plot in the left and right panels of Fig. 12 the 1G [Fe/H] variations as a function of the logarithm of the cluster mass (from Baumgardt & Hilker, 2018) and metallicity (from Harris, 1996, 2010 update), respectively. For NGC 6791 we used the present-day mass and the metallicity computed by Cordoni et al. (2023a) and Frinchaboy et al. (2013), respectively, whereas for NGC 1783 we exploited the values derived from Milone et al. (2023b) and Song et al. (2021).
In both panels gray dots correspond to the 55 Galactic GCs studied by Legnardi et al. (2022), whereas the filled triangles indicate NGC 6791 (red) and NGC 1783 (blue). The [Fe/H] values of Galactic GCs exhibit a mild correlation/anticorrelation with the cluster mass/metallicity. Both clusters follow the general trend of both relations, despite the large [Fe/H] variation observed among clusters with similar mass or metallicity.
5 First-generation stars in Galactic globular clusters
The 1G color broadening is a widespread phenomenon among Galactic GCs. However, the collection of ChMs by Milone et al. (2017, see Figs. 3-7) and Jang et al. (2022, see Figs. 12 and 13) reveal that the pseudo-color extension of 1G stars exhibit substantial variations among different clusters. By exploiting the color-metallicity relations by Dotter et al. (2008), Legnardi et al. (2022) converted the values into [Fe/H] variations for a large sample of 55 Galactic GCs. Similarly to the pseudo-color, the resulting values of [Fe/H] changes dramatically from one cluster to another, ranging from dex to dex (see Fig. 12 of Legnardi et al., 2022, for more details).
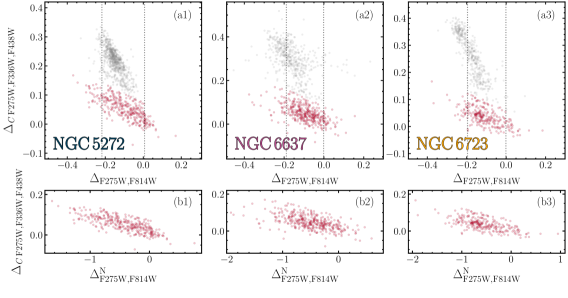
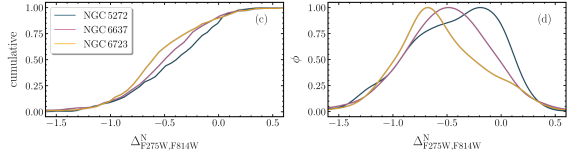
Additionally, we noticed that the ChMs of the 55 GCs studied by Legnardi et al. (2022) reveal different distribution of the 1G pseudo-color. This fact is illustrated in panels a1-a3 of Fig. 13, where we present the ChMs of NGC 5272, NGC 6637, and NGC 6723 that we consider as test cases. The red points represent 1G stars, while the vertical dotted lines indicate the 10th and the 90th percentiles of the 1G distribution. To properly compare the pseudo-colors of 1G stars in the different clusters, we normalized the pseudo-colors by the distance between the two vertical lines shown in the top panels of Fig. 13. Results are illustrated in panels b1-b3 of Fig. 13, where we show the vs. diagrams for 1G stars alone.
A visual inspection at the top and middle panels of Fig. 13 reveals that most 1G stars in NGC 5272 and NGC 6273 exhibit low and large values of , respectively. Consequently, the [Fe/H] distribution of their 1G stars is dominated by metal-poor and metal-rich stars, respectively. NGC 6637 represents an intermediate case. The differences among the pseudo-color distributions of 1G stars in the ChMs of NGC 5272, NGC 6637, and NGC 6723 are highlighted by the cumulative and the kernel-density distributions plotted in the bottom panels of Fig. 13.
In the following, we further investigate 1G stars in a large sample of 51 Galactic GCs. Specifically, in Sect. 5.1 we quantify the pseudo-color distribution, while in Sect. 5.2 we investigate possible relations with the main parameters of the host GC.
5.1 The color distribution of first-generation stars in 51 Galactic globular clusters
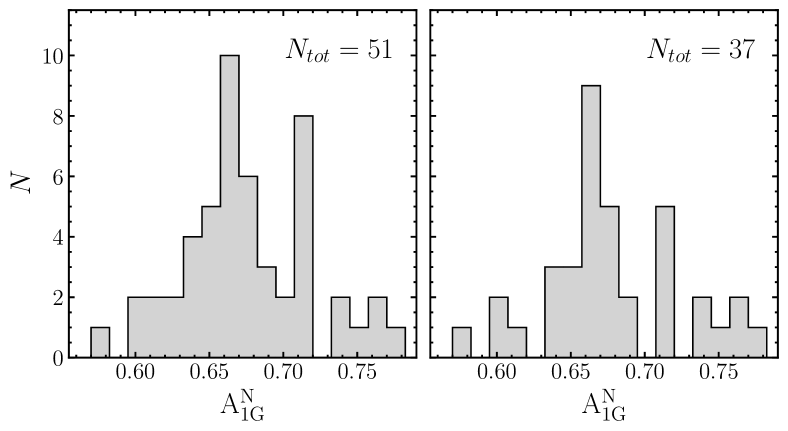
To parameterize the distribution of 1G stars, we calculated the area under the cumulative curve, denoted as A, for 51 Galactic GCs333We excluded from this analysis the clusters for which the ChM shows no appreciable separation between 1G and 2G stars, namely NGC 5927, NGC 6304, NGC 6388, and NGC 6441. Additionally, we excluded Centauri, due to the complexity of its ChM.. Results are listed in Table 2. As illustrated in the left panel of Fig. 14, where we show the histogram distribution of A, the values of A range from to mag, with large and low values indicating a predominance of stars with small and large values, corresponding to metal-poor and metal-rich stars, respectively. The distribution exhibits a main peak around A mag plus a tail towards large values of A. When we limited the analysis to the GCs with wide 1G sequences and where the 1G stars are clearly separated by the 2G in the ChM444The selected clusters have [Fe/H] and 1G pseudo-color extension, , larger than 0.074 mag., we obtained the same qualitative result. This conclusion is supported by the similarity between the A histogram distributions derived for all clusters and the selected GCs alone (left and right panels of Fig. 14, respectively).
5.2 Relations between the first-generation color distribution and the parameters of the host cluster
To test whether the distribution of metal-rich and metal-poor 1G stars can be influenced by the global parameters of the host GC, in the following we investigate the relation between A and the main GC parameters. Our analysis includes metallicity ([Fe/H]), reddening (), absolute visual magnitude (), central surface brightness (SB0), central stellar density (), ellipticity (), concentration (c), and specific RR Lyrae density (SRR) from the 2010 version of the Harris (1996) catalog. Additionally, we used various parameters from Baumgardt & Hilker (2018), including total cluster mass (M), mass-to-light ratio in the V band (M/L), core density (), half-mass-radius density (), half-mass relaxation time (), slope of mass function (MF slope), mass fraction of the remnants (), central velocity dispersion (), central escape velocity (), and mass segregation parameter inside the core () and half-mass–radius ().
GC ages have been taken from Marín-Franch et al. (2009, hereafter MF09), Dotter et al. (2010, hereafter D10), VandenBerg et al. (2013, hereafter V13), and Tailo et al. (2020, hereafter T20), whereas the fraction of binaries in GCs comes from Milone et al. (2012a), as measured within the core (fbin,c), between the core and the half-mass radius (fbin,hm), and beyond the half-mass radius (fbin,ohm).
Moreover, we took advantage of the initial mass of the cluster (Mi), the distance from the Galactic Center (RGC), the mean heliocentric velocity (RV), the apogalacticon and the perigalaticon radius (Rapog and Rperig) from Baumgardt et al. (2019). HB parameters, such as the 1G and extreme-2G mass loss ( and ), the difference between the two (), and the 1G and 2Ge average HB mass ( and ), have been computed by Tailo et al. (2020), while the RGB width in (WF275W) and in (WC,F275W), the RGB width of the 1G in (W), the RGB width in without [Fe/H] dependency (WC,F275W), and the fraction of 1G stars (N1G/NT) have been derived from Milone et al. (2017).
We used the mean and maximum internal helium enhancement (Y2G,1G and Ymax) together with the internal helium variation within the 1G (Y1G) from Milone et al. (2018a). The remaining parameters, namely the HB ratio (HBR), the F606WF814W color distance of the red HB from the RGB (L1), the HB F606WF814W color extension (L2), the RGB width in with and without [Fe/H] dependency (WC,F336W and WC,F336W), the internal metallicity variations within the 1G ([Fe/H]), the mean differential reddening variation () have been taken from Mackey & van den Bergh (2005, HBR), Milone et al. (2014a, L1 and L2), Lagioia et al. (2019, WC,F336W and WC,F336W), Legnardi et al. (2022, [Fe/H]), and Legnardi et al. (2023, ), respectively. Finally, we also included the mass of 1G stars (M1G) and the dynamical age of the cluster (Age/), computed by using the fraction of 1G stars (Milone et al., 2017) and the half-mass relaxation time (Baumgardt & Hilker, 2018), respectively.
To estimate the statistical correlation between A and the parameters listed above, we calculated the Spearman’s rank coefficient (RS) and the corresponding p-value, which indicates the significance of the correlation. Results are listed in Table 3, where we provide RS, the p-value, and the number of freedom degrees for each couple of quantities. Intriguingly, A exhibits no significant correlation with the considered parameters. We repeated this analysis after dividing the investigated targets in M 3- and M 13-like clusters according to the morphology of their HBs 555We defined M 3- and M 13-like GCs objects with L and L, respectively (see Legnardi et al., 2022, for details).. We found no strong correlation between A and the global GC parameters neither for the M 3-like nor the M 13-like GC groups. While the maximum iron variation within 1G stars correlates with GC mass (Legnardi et al., 2022), the result of this analysis implies that the relative abundance of metal-rich and metal-poor 1G stars within a cluster is not influenced by the intrinsic properties of the host GC.
| Cluster ID | A | Cluster ID | A | Cluster ID | A |
|---|---|---|---|---|---|
| NGC 0104 | NGC 5986 | NGC 6584 | |||
| NGC 0288 | NGC 6093 | NGC 6624 | |||
| NGC 0362 | NGC 6101 | NGC 6637 | |||
| NGC 1261 | NGC 6121 | NGC 6652 | |||
| NGC 1851 | NGC 6144 | NGC 6656 | |||
| NGC 2298 | NGC 6171 | NGC 6681 | |||
| NGC 2808 | NGC 6205 | NGC 6717 | |||
| NGC 3201 | NGC 6218 | NGC 6723 | |||
| NGC 4590 | NGC 6254 | NGC 6752 | |||
| NGC 4833 | NGC 6341 | NGC 6779 | |||
| NGC 5024 | NGC 6352 | NGC 6809 | |||
| NGC 5053 | NGC 6362 | NGC 6838 | |||
| NGC 5272 | NGC 6366 | NGC 6934 | |||
| NGC 5286 | NGC 6397 | NGC 6981 | |||
| NGC 5466 | NGC 6496 | NGC 7078 | |||
| NGC 5897 | NGC 6535 | NGC 7089 | |||
| NGC 5904 | NGC 6541 | NGC 7099 |
| Parameter | A | Parameter | A | Parameter | A |
|---|---|---|---|---|---|
| Age (MF09) | WF275W | ||||
| Age (D10) | WC,F275W | ||||
| Age (V13) | WC,F275W | ||||
| Age (T20) | WC,F336W | ||||
| Y2G,1G | WC,F336W | ||||
| Ymax | W | L1 | |||
| Y1G | L2 | ||||
| [Fe/H] | SRR | ||||
| fbin,c | SB0 | N1G/NT | |||
| fbin,hm | c | RV | |||
| fbin,ohm | HBR | ||||
| MF slope | |||||
| M/L | |||||
| Rapog | [Fe/H] | Fremn | |||
| RGC | Rperig |
6 Summary and Discussions
It is now widely accepted that the 1G stars within GCs commonly display variations in metallicity from star to star, leading to prolonged sequences in the ChMs of MS and RGB stars (e.g., Legnardi et al., 2022; Lardo et al., 2022; Marino et al., 2019a, b, 2023; Tailo et al., 2019). While the metal content of 1G stars has been thoroughly examined in the central regions of an extensive sample encompassing 55 GCs, several unresolved questions persist. As an example, the radial behavior of the metallicity variations within the GCs is still unexplored. Moreover, the sample of studied clusters is entirely composed of old Galactic GCs with multiple stellar populations and ages of more than 12 Gyr (e.g., Dotter et al., 2010; Tailo et al., 2020). Hence, we do not know whether metallicity variations are a peculiarity of old Milky Way GCs or are also present in Galactic or extragalactic star clusters younger than 12 Gyr. Finally, the relations between the metallicity distributions of 1G stars and the main parameters of the host clusters are poorly studied. In this work, we investigated these open issues by providing an in-depth analysis of 1G stars in different environments, including Galactic and extragalactic star clusters.
Our first analysis was focused on 47 Tucanae. This dynamically young Galactic GC is an ideal target to investigate the radial behavior of 1G stars with different metallicities. Indeed, the fact that its 2G stars are significantly more centrally concentrated than the 1G, suggests that the stellar populations of 47 Tucanae retain a memory of their initial distribution during the cluster formation. Specifically, we used HST and JWST data to study 1G stars in the cluster core and three external fields, located at , , and arcmin from the cluster center, respectively. The results can be summarized as follows:
-
•
We derived the ChMs of RGB stars in the central field and of M-dwarf stars in the external fields. We detected a well-elongated 1G sequence in each ChM, which is not consistent with a chemically homogeneous stellar population.
-
•
We took advantage of the pseudo-color elongation along the x-axis of the ChM to infer the [Fe/H] distribution of 1G stars. All the distributions span similar intervals, included between [Fe/H] dex and dex, and display a major peak at [Fe/H] dex. The [Fe/H] distribution of the cluster center shows an additional peak centered at [Fe/H], which gradually disappears moving outwards. This fact suggests that 1G stars richer in metals are more centrally concentrated than the metal-poor ones.
-
•
We identified two main groups of metal-rich and metal-poor 1G stars in the four studied fields and used stellar proper motions to investigate their internal kinematics. We found that both groups of 1G stars share similar radial and tangential velocity dispersion profiles and are characterized by isotropic motions.
McKenzie & Bekki (2021) used hydrodynamical simulations to reproduce a giant molecular cloud forming GCs in a high-redshift dwarf galaxy. The simulated clusters exhibit star-to-star metallicity variations of dex, which are consistent with the [Fe/H] spread that we observe among 1G stars in 47 Tucanae (see also Legnardi et al., 2022; Marino et al., 2023). Such metallicity variations are due to the merging of gas clumps and self-enrichment processes. Intriguingly, the evidence of a small increase in the fraction of metal-rich stars in 47 Tucanae is consistent with the properties of most forming GCs simulated by McKenzie & Bekki (2021), where the metal-rich stars are more centrally concentrated than the metal-poor ones.
We notice that while the metallicity distribution of the central field significantly differs from those of the external fields, we detect a less pronounced metallicity gradient only when we consider the three external fields alone. In particular, the average metallicity variations among the 1G stars of these fields differ by only. Since the results for the central field are obtained from RGB stars, whereas the conclusions of the external regions are derived from M dwarfs, an alternative explanation is that the observed metallicity-distribution differences in the central and external fields are not due to a radial gradient but reflect different mass functions for the groups of stars with different metallicities.
Recent works have suggested that the properties of stellar populations with different light-element abundances do not significantly depend on stellar mass. This conclusion is based on the evidence that stars with different masses in various GCs, including 47 Tucanae, share the same [O/Fe] abundances and that their 1G and 2G stars have similar mass functions (Milone et al., 2014b, 2019; Dondoglio et al., 2022; Marino et al., 2024). The potential influence of stellar mass on the observed variances in the metallicity distributions of 1G stars would not alter these conclusions. It is worth noting that the distinct mass functions among groups of metal-poor and metal-rich stars within the 1G do not significantly affect the mass functions and the oxygen abundances of 1G and 2G stars666In the scenarios based on multiple generations, the 2G stars formed from material that is polluted (in light elements) by the ejecta of more massive 1G stars. A mass-function difference between the 1G metal-rich and metal-poor stars would affect the amount of metal-rich and metal-poor polluters. However, due to the small metallicity difference between these two groups of stars, the chemical composition (i.e., the abundances of He, C, N, O, Mg, and Al) of their ejecta is nearly identical. In the scenarios based on accretion, all GC stars formed in the same star-formation episode. The chemical composition of the 2G stars is due to accreted polluted material in the early stages of star formation. Also in this case, we do not expect that the mass functions of the groups of metal-rich and metal-poor 1G stars would affect the accretion process..
To investigate whether the 1G color extension phenomenon occurs only in clusters hosting multiple stellar populations or not, we analyzed HST multi-band photometry of two simple-population star clusters, namely the Galactic open cluster NGC 6791 and the LMC cluster NGC 1783. The main outcomes of this second analysis include:
-
•
We derived the standard vs. ChM for RGB stars in NGC 6791 and NGC 1783. The ChMs of both clusters exhibit one sequence of stars alone, which resembles the 1G sequence of GCs with multiple populations. This fact confirms that both clusters are consistent with simple populations with homogeneous nitrogen abundances. The evidence that NGC 6791 hosts stars with different metallicities is confirmed by wide-field ground-based photometry in the U, B, V, and I bands.
-
•
The F275WF814W color extension of both NGC 6791 and NGC 1783 is much wider than the color spread due to the observational errors alone. Hence, we concluded that extended sequences in the ChM are not prerogatives of 1G stars in GCs but are also present in simple-population clusters.
-
•
We estimated the maximum [Fe/H] variations among the stars of NGC 6791 and NGC 1783, by assuming that iron spreads are the main drivers of the color extension observed on the ChM. We found that NGC 6791 exhibits a moderate [Fe/H] variation ([Fe/H] dex), whereas NGC 1783 shows a much smaller iron spread ([Fe/H] dex). Such metallicity variations are comparable to those observed in metal-rich GCs with similar masses.
Based on a sample of 51 ChMs studied by Legnardi et al. (2022), we noticed that the pseudo-color distribution significantly changes from one cluster to another. In some GCs, including NGC 2808 and NGC 6723, most 1G stars have small values. Hence, the [Fe/H] distribution of their 1G stars is dominated by metal-poor stars. Conversely, other clusters, such as NGC 5272 and NGC 3201, host larger fractions of metal-rich stars with large values of . To parameterize the color distribution of 1G stars, we computed the area under the cumulative curve of the normalized distribution, A. Intriguingly, the values of A exhibit no significant correlation with any of the 53 analyzed parameters of the host cluster. This fact could indicate that the relative numbers of metal-rich and metal-poor 1G stars do not depend on the properties of the host GC.
Acknowledgements.
We thank the anonymous referee for various suggestions that improved the quality of the manuscript. This work has been funded by the European Union – NextGenerationEU RRF M4C2 1.1 (PRIN 2022 2022MMEB9W: ”Understanding the formation of globular clusters with their multiple stellar generations”, CUP C53D23001200006), from INAF Research GTO-Grant Normal RSN2-1.05.12.05.10 - (ref. Anna F. Marino) of the ”Bando INAF per il Finanziamento della Ricerca Fondamentale 2022”, and from the European Union’s Horizon 2020 research and innovation program under the Marie Skłodowska-Curie Grant Agreement No. 101034319 and the European Union – NextGenerationEU (beneficiary: T. Ziliotto).References
- Anderson et al. (2008) Anderson, J., King, I. R., Richer, H. B., et al. 2008, AJ, 135, 2114.
- Anderson et al. (2009) Anderson, J., Piotto, G., King, I. R., et al. 2009, ApJ, 697, L58.
- Arbey et al. (2020) Arbey, A., Auffinger, J., & Silk, J. 2020, Phys. Rev. D, 102, 023503.
- Bastian & Lardo (2018) Bastian, N. & Lardo, C. 2018, ARA&A, 56, 83.
- Baumgardt & Hilker (2018) Baumgardt, H. & Hilker, M. 2018, MNRAS, 478, 1520.
- Baumgardt et al. (2019) Baumgardt, H., Hilker, M., Sollima, A., et al. 2019, MNRAS, 482, 5138.
- Bellini et al. (2017) Bellini, A., Milone, A. P., Anderson, J., et al. 2017, ApJ, 844, 164.
- Bianchini et al. (2018) Bianchini, P., van der Marel, R. P., del Pino, A., et al. 2018, MNRAS, 481, 2125.
- Boesgaard et al. (2009) Boesgaard, A. M., Jensen, E. E. C., & Deliyannis, C. P. 2009, AJ, 137, 4949.
- Bragaglia et al. (2014) Bragaglia, A., Sneden, C., Carretta, E., et al. 2014, ApJ, 796, 68.
- Brogaard et al. (2012) Brogaard, K., VandenBerg, D. A., Bruntt, H., et al. 2012, A&A, 543, A106.
- Cignoni et al. (2010) Cignoni, M., Tosi, M., Sabbi, E., et al. 2010, ApJ, 712, L63.
- Cordero et al. (2014) Cordero, M. J., Pilachowski, C. A., Johnson, C. I., et al. 2014, ApJ, 780, 94.
- Cordoni et al. (2018) Cordoni, G., Milone, A. P., Marino, A. F., et al. 2018, ApJ, 869, 139.
- Cordoni et al. (2020a) Cordoni, G., Milone, A. P., Mastrobuono-Battisti, A., et al. 2020a, ApJ, 889, 18.
- Cordoni et al. (2020b) Cordoni, G., Milone, A. P., Marino, A. F., et al. 2020b, ApJ, 898, 147.
- Cordoni et al. (2022) Cordoni, G., Milone, A. P., Marino, A. F., et al. 2022, Nature Communications, 13, 4325.
- Cordoni et al. (2023a) Cordoni, G., Milone, A. P., Marino, A. F., et al. 2023a, A&A, 672, A29.
- Cordoni et al. (2023b) Cordoni, G., Marino, A. F., Milone, A. P., et al. 2023b, A&A, 678, A155.
- D’Antona et al. (2016) D’Antona, F., Vesperini, E., D’Ercole, A., et al. 2016, MNRAS, 458, 2122.
- Dondoglio et al. (2021) Dondoglio, E., Milone, A. P., Lagioia, E. P., et al. 2021, ApJ, 906, 76.
- Dondoglio et al. (2022) Dondoglio, E., Milone, A. P., Renzini, A., et al. 2022, ApJ, 927, 207.
- Dotter et al. (2008) Dotter, A., Chaboyer, B., Jevremović, D., et al. 2008, ApJS, 178, 89.
- Dotter et al. (2010) Dotter, A., Sarajedini, A., Anderson, J., et al. 2010, ApJ, 708, 698.
- Foreman-Mackey et al. (2013) Foreman-Mackey, D., Hogg, D. W., Lang, D., et al. 2013, PASP, 125, 306.
- Frinchaboy et al. (2013) Frinchaboy, P. M., Thompson, B., Jackson, K. M., et al. 2013, ApJ, 777, L1.
- Gaia Collaboration et al. (2021) Gaia Collaboration, Brown, A. G. A., Vallenari, A., et al. 2021, A&A, 649, A1.
- Harris (1996) Harris, W. E. 1996, AJ, 112, 1487.
- Jang et al. (2022) Jang, S., Milone, A. P., Legnardi, M. V., et al. 2022, MNRAS, 517, 5687.
- Kamann et al. (2020) Kamann, S., Giesers, B., Bastian, N., et al. 2020, A&A, 635, A65.
- Lagioia et al. (2019) Lagioia, E. P., Milone, A. P., Marino, A. F., et al. 2019, AJ, 158, 202.
- Landolt (1992) Landolt, A. U. 1992, AJ, 104, 372.
- Lardo et al. (2022) Lardo, C., Salaris, M., Cassisi, S., et al. 2022, A&A, 662, A117.
- Lee (2022) Lee, J.-W. 2022, ApJS, 263, 20.
- Legnardi et al. (2022) Legnardi, M. V., Milone, A. P., Armillotta, L., et al. 2022, MNRAS, 513, 735.
- Legnardi et al. (2023) Legnardi, M. V., Milone, A. P., Cordoni, G., et al. 2023, MNRAS, 522, 367.
- Libralato et al. (2022) Libralato, M., Bellini, A., Vesperini, E., et al. 2022, ApJ, 934, 150.
- Mackey & van den Bergh (2005) Mackey, A. D. & van den Bergh, S. 2005, MNRAS, 360, 631.
- Marín-Franch et al. (2009) Marín-Franch, A., Aparicio, A., Piotto, G., et al. 2009, ApJ, 694, 1498.
- Marino et al. (2019a) Marino, A. F., Milone, A. P., Sills, A., et al. 2019a, ApJ, 887, 91.
- Marino et al. (2019b) Marino, A. F., Milone, A. P., Renzini, A., et al. 2019b, MNRAS, 487, 3815.
- Marino et al. (2023) Marino, A. F., Milone, A. P., Dondoglio, E., et al. 2023, ApJ, 958, 31.
- Marino et al. (2024) Marino, A. F., Milone, A. P., Legnardi, M. V., et al. 2024, ApJ, 965, 189.
- Martins et al. (2021) Martins, F., Chantereau, W., & Charbonnel, C. 2021, A&A, 650, A162.
- McKenzie & Bekki (2021) McKenzie, M. & Bekki, K. 2021, MNRAS, 507, 834.
- Milone et al. (2010) Milone, A. P., Piotto, G., King, I. R., et al. 2010, ApJ, 709, 1183.
- Milone et al. (2012a) Milone, A. P., Piotto, G., Bedin, L. R., et al. 2012a, A&A, 540, A16.
- Milone et al. (2012b) Milone, A. P., Piotto, G., Bedin, L. R., et al. 2012b, ApJ, 744, 58.
- Milone et al. (2014a) Milone, A. P., Marino, A. F., Dotter, A., et al. 2014a, ApJ, 785, 21.
- Milone et al. (2014b) Milone, A. P., Marino, A. F., Bedin, L. R., et al. 2014b, MNRAS, 439, 1588.
- Milone et al. (2015) Milone, A. P., Marino, A. F., Piotto, G., et al. 2015, ApJ, 808, 51.
- Milone et al. (2017) Milone, A. P., Piotto, G., Renzini, A., et al. 2017, MNRAS, 464, 3636.
- Milone et al. (2018a) Milone, A. P., Marino, A. F., Mastrobuono-Battisti, A., et al. 2018a, MNRAS, 479, 5005.
- Milone et al. (2018b) Milone, A. P., Marino, A. F., Renzini, A., et al. 2018b, MNRAS, 481, 5098.
- Milone et al. (2019) Milone, A. P., Marino, A. F., Bedin, L. R., et al. 2019, MNRAS, 484, 4046.
- Milone et al. (2020) Milone, A. P., Marino, A. F., Da Costa, G. S., et al. 2020, MNRAS, 491, 515.
- Milone & Marino (2022) Milone, A. P. & Marino, A. F. 2022, Universe, 8, 359.
- Milone et al. (2023a) Milone, A. P., Marino, A. F., Dotter, A., et al. 2023a, MNRAS, 522, 2429.
- Milone et al. (2023b) Milone, A. P., Cordoni, G., Marino, A. F., et al. 2023b, A&A, 672, A161.
- Mohandasan et al. (2024) Mohandasan, A., Milone, A. P., Cordoni, G., et al. 2024, A&A, 681, A42.
- Richer et al. (2013) Richer, H. B., Heyl, J., Anderson, J., et al. 2013, ApJ, 771, L15.
- Sabbi et al. (2016) Sabbi, E., Lennon, D. J., Anderson, J., et al. 2016, ApJS, 222, 11.
- Song et al. (2021) Song, Y.-Y., Mateo, M., Bailey, J. I., et al. 2021, MNRAS, 504, 4160.
- Stetson et al. (2005) Stetson, P. B., Catelan, M., & Smith, H. A. 2005, PASP, 117, 1325.
- Stetson et al. (2019) Stetson, P. B., Pancino, E., Zocchi, A., et al. 2019, MNRAS, 485, 3042.
- Tailo et al. (2019) Tailo, M., D’Antona, F., Caloi, V., et al. 2019, MNRAS, 486, 5895.
- Tailo et al. (2020) Tailo, M., Milone, A. P., Lagioia, E. P., et al. 2020, MNRAS, 498, 5745.
- VandenBerg et al. (2013) VandenBerg, D. A., Brogaard, K., Leaman, R., et al. 2013, ApJ, 775, 134.
- Villanova et al. (2018) Villanova, S., Carraro, G., Geisler, D., et al. 2018, ApJ, 867, 34.
- Ziliotto et al. (2023) Ziliotto, T., Milone, A., Marino, A. F., et al. 2023, ApJ, 953, 62.