Unveiling the Bulge-Disc Structure, AGN Feedback, and Baryon Landscape in a Massive Spiral Galaxy with Mpc-Scale Radio Jets
Abstract
This study delves into the bulge-disc components and stellar mass distribution in the fast-rotating, highly massive spiral galaxy 2MASX J23453268-0449256, distinguished by extraordinary radio jets extending to Mpc scales. Using high-resolution multi-wavelength Hubble Space Telescope (HST) observations and multi-parameter panchromatic spectral energy distribution (SED) fitting, we derive estimates for the star formation rate, total baryonic mass in stars, and warm dust properties. Our findings, validated at a spatial resolution of approximately 100 pc, reveal a pseudo-bulge rather than a classical bulge and a small nuclear bar and resonant ring, challenging conventional models of galaxy formation. Additionally, the lack of tidal debris and the highly symmetric spiral arms within a rotationally supported stellar disc indicate a tranquil coevolution of the galactic disc and its supermassive black hole (SMBH). Significantly, the galaxy exhibits suppressed star formation in its center, potentially influenced by feedback from the central accreting SMBH with powerful radio jets. Detailed multi-wavelength studies of potential star-forming gas disclose that, while hot X-ray gas cools down in the galaxy’s halo, new stars do not form in the center, likely due to feedback effects. This study raises questions about the efficient fueling and sustained collimated jet ejection activity in J2345-0449, underscoring the imperative need for a comprehensive understanding of its central black hole engine properties, which are presently lacking. The exceptional rarity of galaxies like 2MASX J23453268-0449256 presents intriguing challenges in unraveling the physical processes responsible for their unique characteristics.
keywords:
galaxies: ISM Galaxy: formation galaxies: spiral Galaxy: fundamental parameters galaxies: individual: 2MASX J23453268-04492561 Introduction
Explaining the mechanism of galaxy formation in the Universe across cosmic eons in the framework of widely accepted Concordance Lambda Cold Dark Matter (CDM) Cosmology, is one of the prime goals of astronomy research. Since there may be several competing physical processes responsible for the observed galaxy properties, identifying and relating them to galaxy formation models is an exceptionally important goal. A major mystery is how galaxies convert their baryons into stars and why do some galaxies are still busy forming new stars while others have virtually shut down their stellar factory. Observations show that the Star Formation Rate (hereafter SFR) reached it’s peak at ‘cosmic high noon’ near red shifts when galaxies were rapidly building up their stellar masses by converting cosmic baryons to stars and, subsequently, over the next few billions of years the star formation went down drastically. Eventually, by the present era, most of the massive galaxies have stopped growing (Brinchmann et al., 2004; Renzini & Peng, 2015), having entered a life of apparent quiescence (Behroozi et al., 2010, 2019; Dhiwar et al., 2023; Moster et al., 2013). Nevertheless, for reasons still unknown, in our local universe, some low-mass galaxies are still actively forming stars, while the majority of massive galaxies with halo masses display a strikingly low specific star formation rate (where sSFR = SFR/stellar mass) compared to less massive galaxies (see reviews by Alexander & Hickox (2012) and Wechsler & Tinker (2018)).
Why this is so and who were the progenitors of these massive local galaxies are still open questions. It is likely that their formation history may go as far back as in redshift (about Gy after birth of Universe), in the era of re-ionization, when their ancestors started to grow in mass, as well as vigorously formed new stars from cosmic baryons, infalling and condensing around their primordial dark matter halos. Puzzlingly, JWST has uncovered some extremely massive (stellar mass ) galaxies existing even at very early epochs (; Labbé et al. (2023)). By the time when the Universe was about three billion years old, half of the most massive galaxies were in place as compact proto-galaxies, having already exhausted their fuel for star formation. Of the rest half, about per cent galaxies assembled before the peak of the cosmic star-formation, while per cent galaxies formed later (Madau & Dickinson, 2014). Observations reveal that at higher red shifts () most of them were harbouring intense nuclear starbursts and possibly they ultimately grew into the most massive local galaxies seen today through mergers with other galaxies (Saha et al., 2021), and by means of gravitational accretion from cold gas filaments of the cosmic web (Wang et al., 2019). Understanding how this remarkable transformation happened and what physical factors were responsible to bring about this change has been an enduring quest - which also brings forth some of the most widely debated key questions in galaxy formation (for reviews, see Vogelsberger et al. (2020) and Somerville & Davé (2015)).
In the above scenarios, the Circum-Galactic Medium (hereafter CGM) of galaxies plays a decisive role in determining, at all cosmological epochs, how galaxies acquire, eject, and recycle their gas; which in turn are the most important physical ingredients in determining how the galaxies should evolve, how much star formation will take place, and eventually how much of the baryonic gas will be quenched (prevented from forming stars), or recycled back to the galaxy. Along with the unseen, gravitationally dominant dark matter, the CGM is an extremely dynamic environment reposing a complex mix of baryons existing in diverse phases of temperature, density and metal content, presenting an extremely important, but perhaps the least understood aspect of galaxy formation (see the reviews Tumlinson et al. (2017), Donahue & Voit (2022) ). Among the many interesting and challenging questions that the CGM poses, one of the most perplexing ones has been the so-called the ‘missing baryons’ problem. Indeed the term ‘missing baryons’ is a misnomer, but it emphasises the fact that even in deep multi-wavelength observations of galaxies, the total detectable baryonic mass falls far short (by 50 to 80 per cent) of the cosmic baryon fraction of as expected in CDM cosmology based on Big Bang nucleo-synthesis and Cosmic Microwave Background constraints (Komatsu et al., 2009; Dunkley et al., 2009). A number of theories and computer simulations have tried to explain where do these baryons may reside and why only a small fraction of the baryons in galactic halos condense into stars, or why by present era () the star formation efficiency (empirically defined as ) reaches a peak of about per cent for typical galaxies. Whereas for very massive galaxies (halo mass ), beyond the peak, the rapidly declines to only per cent at (Schaye et al., 2015; Behroozi et al., 2010, 2019; Moster et al., 2013). It is likely that AGN (Active Galactic Nuclei) feedback could be the main agency responsible for this steep decline in SFR of highly massive galaxies, but we need to understand if that is the only factor (Bluck et al., 2022). On the other hand, a similar decline in SFR is seen on the opposite, lower mass end of the peak (), which is mainly attributed to supernova feedback, as it is more effective in less massive galaxies.
The promising agents of AGN feedback are the mass accreting supermassive black holes (SMBH) growing at the centre of galaxies (Magorrian et al., 1998) which occasionally turn into powerful engines (Lynden-Bell, 1969) that can potentially heat and even expel the gas of their host galaxies, thereby affecting the star formation process (Somerville et al., 2008; Di Matteo et al., 2005; Beckmann et al., 2017; McNamara & Nulsen, 2012). It is now widely recognized that in our local Universe, such SMBHs of masses lurk in the nuclei of almost all massive galaxies (see Kormendy & Ho (2013) for a review). Moreover, AGN feedback of accreting BHs is likely to be more effective in massive galaxies because a remarkably tight coupling exists between the mass of the black hole and the galaxy’s bulge mass or with its’ total stellar mass/luminosity, which further suggests that; (a) mass of the central SMBH will be higher in massive galaxies and in bulge dominated galaxies, and so will be its energetic output and its impact on the surrounding media, (b) the star formation rate and the final mass of the galaxy somehow has been symbiotically regulated by the growing black hole over the cosmic eons, e.g., (Magorrian et al., 1998; Gebhardt et al., 2000; Häring & Rix, 2004; Marconi & Hunt, 2003; Gültekin et al., 2009a; Sahu et al., 2019).
The physical mechanism that links the SMBH mass to the galactic bulge and disc properties is still poorly understood, but AGN energy driven feedback - either via the mechanical power of the narrow radio jets (Bridle & Perley, 1984; Saikia, 2022) or through a broad pressure-driven hot wind/outflow (and radiation flux) on the surrounding medium - plays a major role in regulating the growth of the black hole and may affect the star formation rate and growth of the host galaxy. In recent years we have learned that SMBHs are the essential ingredients shaping the lives of galaxies across cosmic time (excellently reviewed in Kormendy & Ho (2013) and Alexander & Hickox (2012)). Nevertheless, there is little understanding of exactly how the black holes of AGN are fuelled and how the radio jets or the hot outflows deposit energy to their surroundings; the energy that is transferred to the different gas phases, and what are the physical conditions when significant positive or negative feedback on star formation rate is produced (see reviews by Fabian (2012) and King & Pounds (2015)). Despite numerous efforts to observe SMBH engines in the process of quenching star formation, conclusive evidence for such a process remains elusive, particularly in the nearby Universe (Martín-Navarro et al. (2018)). However, the strong impact of AGN feedback via radio jets on the hot intracluster medium (ICM) is observed directly through X-ray observations of the dark cavities and non-thermal plasma bubbles found around the central galaxies of cool-core galaxy clusters and groups in X-ray images (Bîrzan et al., 2004).
Lastly, leading galaxy formation theories, e.g. (White & Rees, 1978; White & Frenk, 1991; Fukugita & Peebles, 2006; Sommer-Larsen, 2006) postulate a warm-hot X-ray halo (or a ‘corona’ first mentioned by Spitzer (1956)) containing a large fraction (at least per cent) of cosmic baryons in highly massive galaxies. To validate galaxy formation models and make a census of all cosmic baryons, sensitive X-ray or UV observations of circum-galactic halos are necessary. It has been proved very challenging to detect the hot, baryon-filled coronae around even in very luminous spirals and ellipticals with our present telescopes due to sensitivity limitations. Nevertheless, in past decade using the Chandra and XMM-Newton telescope, such coronae have been robustly detected in a small number of massive galaxies, e.g., (Dai et al., 2012; Mirakhor et al., 2021; Walker et al., 2015; Anderson & Bregman, 2011; Anderson et al., 2016; Bregman et al., 2018; Bogdán et al., 2013), but independent constraints on their temperature, density, and metallicity from soft X-ray or UV spectroscopy is still lacking. These galaxies have provided compelling evidence for the existence of hot, low-metallicity atmospheres of gas that could originate with accretion from the IGM and subsequent heating to the virial temperature of the halo via accretion shocks. However, the fraction of baryons residing in the hot coronal phase and its dependence on stellar and halo mass and how they are affected by the AGN feedback of the central black hole and the galactic star formation processes are not well determined and poorly understood (Donahue & Voit (2022)).
Evidently, to further the field it is necessary to understand how SMBHs have grown over cosmic time, how do they accrete gas (both the rate of accretion, as well as the source of this gas) to create their relativistic jets and hot winds, and finally, their impact on the surrounding molecular gas and the star formation activity. The baryon budget and star formation rate are the two vital properties of galaxies that are significantly affected by AGN feedback which needs much better understanding. The quenching of star formation in massive galaxies is one of the core predictions of the AGN feedback hypothesis, yet it is also one of its aspects that are very little understood (see (Harrison, 2017)). Some previous studies focus on gas removal in the host galaxies of very powerful AGN as the main feedback mode (Laha et al., 2021), however, in contradiction some observations show that quasar-like outflows alone are not sufficient to understand AGN feedback: Neither do even the most extreme outflows in very powerful AGN result in a significant reduction in star formation rate (e.g., (Stanley et al., 2015)), nor do many of the most frequent, medium to low-power AGN show strong outflow signatures. Thus, in spite of the popularity of AGN feedback hypothesis, its central prediction – the direct physical link between the energy injection by the AGN and star formation remains a subject of several contradictions yet it provides many new, vibrant ideas for explorations (Morganti, 2017).
Our prime focus is on a detailed exploration of active galaxies with massive black holes and jets, specifically examining their feedback impact on the interstellar medium and the extended baryonic matter of the host galaxy. We are particularly intrigued by the prospect of identifying clear counter examples—instances of powerful jets originating from an accreting supermassive black hole (SMBH) formed under highly unusual conditions. One such remarkable case under scrutiny here involves a Mpc-scale radio galaxy hosted by a luminous, quiescent massive spiral disc without a classical bulge, exhibiting no major signs of disturbances. Investigating such scenarios allows for a direct test of AGN feedback. Moreover, within this galaxy, we aim to uncover the precise physical factors influencing the launch of relativistic jets in powerful radio galaxies (Bridle & Perley, 1984), marking the first instance of such knowledge. This unique and rare galactic configuration serves as an exceptional test-bed, offering valuable insights into the role of relativistic jets in the evolution of galaxies.
Hereafter, in this paper we use redshift and CDM cosmological parameters; km/sec/Mpc, , and . This results in an image scale of 1.48 kpc per arcsec. The luminosity distance to J2345-0449 in this model is 353.0 Mpc and the angular size distance is 305.2 Mpc. Magnitudes are quoted in the AB system and mass and luminosity are given in terms of solar mass (where g) and solar luminosity (where erg s-1) where possible.
2 2MASX J23453268-0449256: an enigmatic spiral galaxy
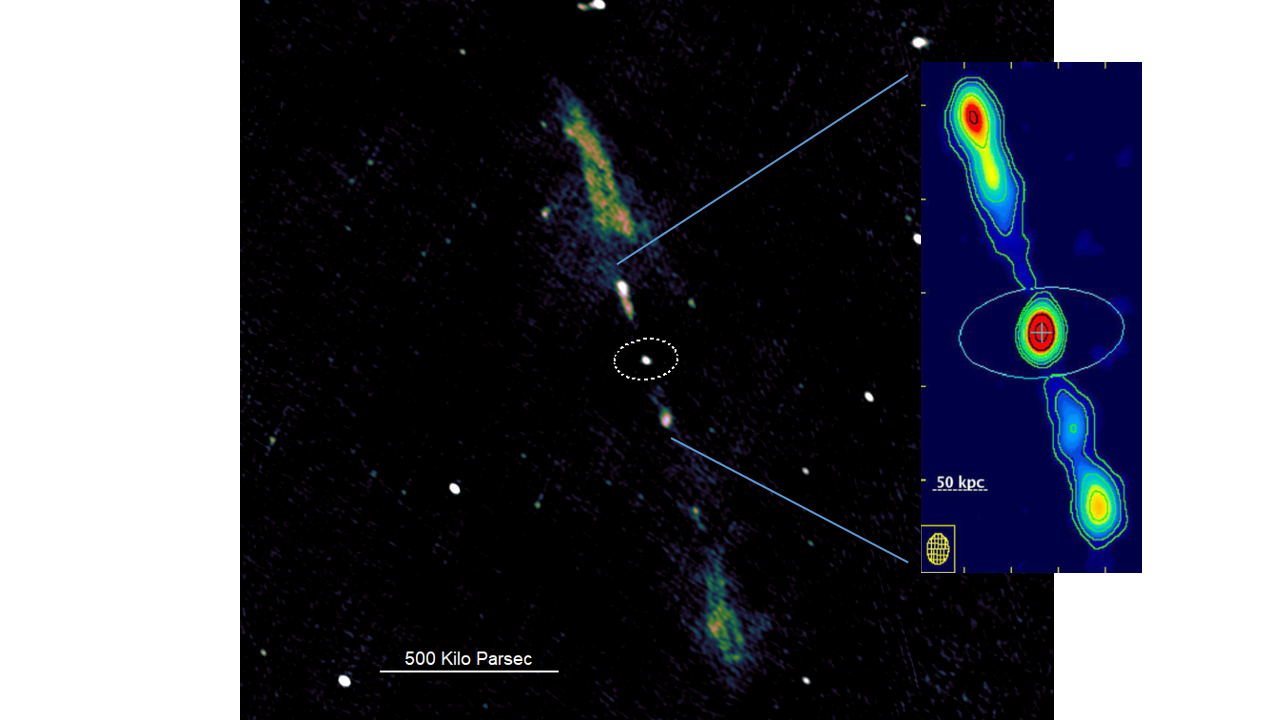
The focus of present paper, galaxy 2MASX J23453268-0449256 (hereafter J2345-0449) at redshift . J2345-0449 is known to be an extremely luminous (optical r band: =-23.26, near-IR K band: = -26.15), isolated spiral galaxy which also hosts one of the largest and most powerful radio jet known till now, clearly powered by the AGN residing at the center of a spiral galaxy disc and not an elliptical galaxy (Bagchi et al., 2014). GMRT and VLA observations show that this giant radio source also exhibits a rarely observed ‘double-double’ radio morphology; viz. containing a nested pair of smaller (active/young), inner radio lobes, and a second pair of extended (relic/old), diffuse outer radio lobes, with the jet axis (in projection) nearly orthogonal to the host galaxy’s stellar disc (Fig. 1). The bipolar radio emission of outer lobes can be traced upto Mpc () and inner lobes upto kpc (), making it an example of class of rarely seen extreme sized active galaxies, called the Giant Radio Galaxies (GRG) whose radio jets may extend upto Mpc or more (Dabhade et al., 2020b, a), far beyond the optical host. The inner “active” radio lobes are of edge-brightened, Fanaroff–Riley class II morphology (Fanaroff & Riley, 1974), energized by the collimated jets shot out from the central nucleus. The outer lobes have peculiar long, filamentous, and diffuse morphology, possibly decaying relics of past jet activity (Fig. 1).
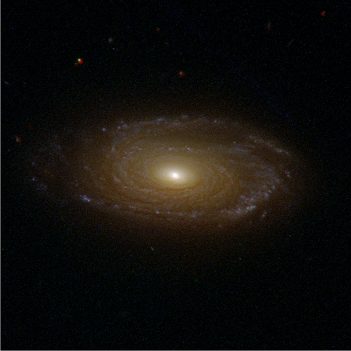
These bright and enormous set of radio jets and lobes mark J2345-0449 as a unique source even among very massive spirals and the rapidly growing examples of GRGs in the local Universe, which themselves pose many important astrophysical questions (Dabhade et al., 2023). Undoubtedly, this is a very unusual occurrence, since for reasons still unknown such large scale, powerful radio jets (typically on 100 kpc - 1000 kpc scale) are exclusively launched from bulge dominated elliptical galaxies hosting supermassive black holes (e.g. Matthews et al. (1964); McLure et al. (2004)) whereas the radio jet host of J2345-0449 is a spiral galaxy (Fig. 2). Consequently, such counter-intuitive AGNs challenge the standard paradigm of growth and co-evolution of massive black holes in bulges of galaxies (Magorrian et al., 1998; Gebhardt et al., 2000; Häring & Rix, 2004; Marconi & Hunt, 2003; Wu et al., 2022) and therefore, they are also of profound interest as they may be the ideal astrophysical models of the central engines of radio galaxies and their feedback signatures on stellar and gaseous matter of the galaxy.
Finding Mpc scale jets in a spiral galaxy is highly unusual in itself, but the galaxy itself is equally remarkable. Its general properties were discovered by Bagchi et al. (2014) and further investigated by Walker et al. (2015); Mirakhor et al. (2021) and Nesvadba et al. (2021). The WISE mid-IR colors suggest that some mild star formation is still occurring within its disc. It is located in a sparsely populated galactic environment devoid of bright galaxies. Having mag in SDSS r-band and in WISE 12 band, it lies at the very top of the luminosity function of red spirals. The galaxy’s systematic rotation speed is very high, with maximum flat rotation speed touching km s-1 at kpc radius (corrected for inclination angle deg.), which is exceptionally large among all spirals. Assuming Newtonian dynamics, this rotation speed implies a huge mass of within the virial radius of kpc, which mostly is comprised of dark matter, thereby making J2345-0449 one of the largest and most massive galaxies known in our local universe. Bagchi et al. (2014) found galaxy’s central velocity dispersion is km s-1, much higher than normal Milky Way like spirals and close to the highest velocity dispersion found among nearby E and S0 galaxies (van den Bosch et al. 2012).
As the mechanism of radio-mode suppression of star formation in massive galaxies is still unknown and there could be several ways to suppress star formation in early type galaxies, a powerful jet emanating in a massive spiral disc offers an important alternate probe of jet-related feedback. J2345-0449 is one such galaxy, with its nested pair of extended radio lobes and a smaller scale restarted radio source that is interacting with a molecular disc, injecting turbulence and affecting the star formation rate. Moreover, the large repository of warm/hot baryons discovered in the circum-galactic medium (CGM) of the galaxy and the cold molecular gas content in the inner disc further highlight its baryonic budget and feedback properties. Nesvadba et al. (2021) detected signatures of AGN feedback on the inner CO gas ring and suggested possible suppression of star formation on kpc scale at the center. From VLT/MUSE spectroscopy Drevet Mulard et al. (2023) concluded that more than per cent of the stellar mass is very old having formed 10 Gy ago in the disc and detected only a few young star-forming regions that formed My ago. Walker et al. (2015) and Mirakhor et al. (2021) using Chandra and XMM-Newton observatories discovered the galaxy’s extended soft X-ray (electron temperature keV or K) corona/halo of low metallicity () gas, which extends at least to r kpc galacto-centric radius, making J2345-0449 one of just a few spirals for which such large, extended, massive ionized gaseous halos have been directly detected via X-ray imaging. Extrapolating the gas mass profile out to the virial radius ( kpc) and accounting for the stellar and molecular gas masses of the disc, the baryon mass fraction was found to be , close to the universal baryon fraction expected in LCDM cosmology (Komatsu et al., 2009; Walker et al., 2015; Mirakhor et al., 2021).
Ground based (SDSS and CFHT) photometry showed that J2345-0449 may harbour a flattened pseudo-bulge rather than a typical ellipsoidal classical bulge, has no optically bright highly radiative AGN, and lacks obvious signs of mergers or interaction with any massive neighboring galaxy (Bagchi et al., 2014). Such rare, isolated and ultra massive galaxies (; Bagchi et al. 2014, Walker et al. 2015), located at the upper end of galactic mass spectrum are highly valuable laboratories to understand a more general astrophysical mechanism, allowing us to isolate specific processes that are challenging to study in the dominant galaxy population due to the coexistence of various potentially competing mechanisms producing similar effects. Consequently, J2345-0449 becomes a distinctive laboratory for investigating crucial aspects of bulge-disc stars, relativistic jet formation, AGN feedback, and the co-evolution of supermassive black holes and galaxies. These aspects, often difficult to probe in early-type galaxies, come to the forefront in this exceptional astronomical specimen.
In this paper we perform a detailed multi-wavelength, high resolution study of J2345-0449 with Hubble Space Telescope (HST). From optical and near IR imaging made with the Wide Field Planetary Camera 3 (WFC3) providing a significant high spatial resolution of (005 to 01 FWHM or pc), we quantify the star formation rate and interstellar dust properties in the disc. Furthermore, we unambiguously resolve the stellar and dust content organized in the bulge and disc components and determine the bulge-disc morphological and photometric parameters accurately, thereby vastly improving on the previous ground based studies. We also estimate the star formation rate in the disc and explore its implications in synergy with some of the important results from our previous investigations; of cold molecular gas content and its dynamics observed via the Carbon Mono Oxide (CO) lines, and the properties of an extended soft X-ray halo/corona detected in Chandra and deep XMM-Newton observations.
We present the detailed, best fitting spectral energy distribution (SED) model of J2345-0449 using all available observations across 0.1 to 500 wavelength range. We decompose the SED into star formation, ISM dust and AGN components. The SED fitting has been done using two different software packages; CIGALE and MAGPHYS, for cross checking, obtaining a number of key ISM and stellar parameters of the galaxy, such as its global star formation rate, stellar mass, dust mass, dust temperature and dust luminosity, gas mass, and the AGN fraction.
Finally, we examine the location of J2345-0449 on the star formation main-sequence and other well established scaling-relations governing the galaxies in local Universe with an aim to know how this exceptional galaxy compares with other ordinary galaxies. We also obtain a detailed census of all baryons in the disc and the circum-galactic halo and derive estimates of overall star formation efficiency and baryon fraction. Our studies enable probing the environment of the central black hole powering the powerful radio jets and investigate the feedback action of jets on the stellar disc and the surrounding circum galactic environment.
These multi-wavelength data set and the inferences constitute our first steps towards understanding the origin and evolution of this complex and enigmatic galaxy.
3 Description of HST Observations
Under HST GO program 14091 (PI: Aaron Barth) the spiral galaxy J2345-0449 was observed with WFC3 in three filter bands taken over two orbits on September 17, 2016. WFC3 offers a combination of broad wavelength coverage, wide field of view, and high sensitivity. WFC3 is capable of direct, high-resolution imaging over the entire wavelength range from 200 to 1700 nm by utilizing two optical/ultraviolet CCDs and a near-infrared HgCdTe array. WFC3 has a range of wide, intermediate, and narrow-band filters, which provide unmatched capability to investigating a variety of new astrophysical phenomena (https://hst-docs.stsci.edu/wfc3ihb).
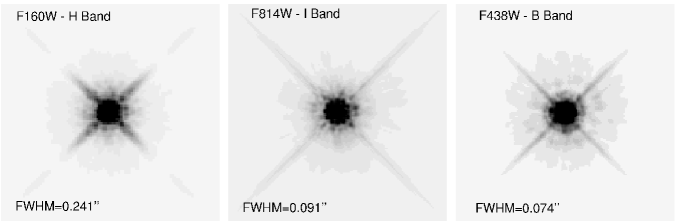
During observations, a series of three exposures were taken in each filter band, which are listed in Table.1. These exposures were offset by fractional-pixel shifts relative to each other using a three-point box dither pattern. The final images were constructed by combining these exposures, which allowed for the removal of cosmic-ray hits and hot pixels. In the UVIS channel, we used the F438W (B band) and F814W (I band) filters. The UVIS channel CCD has a pixel scale of 004 pixel-1. At a distance of 323 Mpc, a single pixel on UVIS subtends about 56 pc. The image plane point spread functions (PSFs) in Full Width at Half Maximum (FWHM) are; 0090 in F814W and 00744 in F438W filters. Since J2345-0449 has effective radii of a few kpc (1.081.4 kpc), WFC3 provides extremely good spatial resolution capability for a detailed study of its internal structure. In the IR channel, we used one wide band, F160W (H band) filter and the HgCdTe detector array that has somewhat coarser resolution than the UVIS, with pixel scale of 013 pixel-1 and PSF full width at half maximum (FWHM) of 0241. These high resolution data are a key element of our overall analysis, which enables us to achieve our science goals.
3.1 High resolution HST imaging for accurate bulge-disc decomposition
The exquisite spatial resolution offered by HST has some definite advantages over ground-based imaging. For example, for galaxies with a central bulge and strong light concentration, a surface brightness profile analysed in poor seeing conditions may give the illusion of a central light deficit. Atmospheric blurring affects the fitted light profile creating spurious break/flattening on its slope. The above effect is more pronounced when the true light concentration is on a scale comparable or below the seeing, which can mislead one to to believe on the detection of a depleted core, which can result from scouring of stars by mergers of binary super massive black holes. HST can largely mitigate this problem, while is also capable of showing a real depleted core if it actually exists, which can not be ruled out in this galaxy. Moreover, the simultaneous fits over a wide-wavelength range of HST images makes the bulge-disc decomposition more robust against any spurious effects.
The galaxy’s favorable inclination to the line of sight () has enabled a direct view of the well-developed bright spiral arms and dust features, as seen from the deep high-resolution optical images taken by HST presented here.
4 HST Data Analysis, Photometric and SED Model Fitting
For analysis of HST data we have followed the same procedure as described in Carson et al. (2015). The standard HST calibration pipeline was used for flat fielding, bias correction and dark current subtraction. In order to reject cosmic-ray hits and bad pixels and to correct for the geometric distortion introduced by the optics of HST and WFC3, the three offset exposures for each filter were combined into a final image using the PyRAF/STSDAS task AstroDrizzle, using a square kernel with pixfrac, exposure time weighting, and sky subtraction turned off. In addition, as part of the AstroDrizzle process, we re-sampled the IR images onto the UVIS grid, resulting in a uniform pixel size of 004 in all three bands.
We created a ‘natural’ looking tri-colour image of spiral galaxy J2345-0449 by superposing the HST WFC3 UVIS (F438W B and F814W I band) and IR (F160W H band) monochrome images. The color balance was adjusted by eye to give the most aesthetically pleasing effect. One can discern (Fig. 2) dark, winding dust lanes and blue star forming regions along spiral arms providing a detailed view of this enigmatic galaxy for the first time.
| Filter | Channel | Central Wavelength | Band Width | Exp. time |
|---|---|---|---|---|
| Å | Å | seconds | ||
| F438W | UVIS | 4326.5 | 197.30 | |
| F814W | UVIS | 8029.5 | 663.33 | |
| F160W | IR | 15369.0 | 2683.0 |
4.1 Surface Brightness Profile Fitting
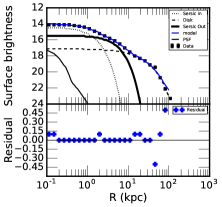
We used a composite of the Sérsic (Sérsic, 1963, 1968) and exponential functions to model the galaxy’s light profile, where the former models the bulge and the latter models the disc. In addition, to account for any point-like excess light at the center, an additional PSF model was used. A 2D model of the surface brightness profile was fit to each image using GALFIT version 3.0.4 (Peng et al., 2002, 2010). For each band image, we specified the components of the model surface brightness profile to fit to the image (e.g., Sérsic, exponential and PSF), and supplied initial estimates for the model parameters (e.g., position of the center of the profile, total magnitude, effective radius). For simplicity we did not attempt to fit non-axisymmetric features like spiral arms, dust-lanes, bars or resonant rings in our models, which then should be visible in residual images.
A model image based on above parameters is produced and then convolved with the corresponding WFC3 PSF. Finally, the of difference between the HSTinput image and model image is computed, and minimization of is achieved, yielding the best model parameters, using the Levenberg-Marquardt downhill-gradient algorithm. To properly weight each pixel in the calculation, we used the sigma image generated internally by GALFIT based on each input image. Although we used the pipeline, we vary the initial conditions of different parameters to check whether the final results correspond to a global minimum. We found that the final results are stable against different initial conditions.
Here, and are surface brightness at radius and respectively, is effective (half-light) radius, is the Sersic index, and is a dependent variable coupled to such that encloses half of total brightness (Ciotti & Bertin, 1999).
The exponential profile is defined as,
| (2) |
Here, and is disc the scale radius.
For each filter, simulated images of the HST/WFC3 PSF were generated using version 7.5 of the TinyTim software package, which creates a model HST PSF based on the instrument, detector chip, detector chip position, focus and filter used in the observations. As the data have three exposures for each filter with sub-pixel offsets, we produced three versions of each PSF on a sub-sampled grid with sub-pixel offsets, using the same three-point box dither pattern as the HST/WFC3 exposures to ensure that the model PSFs were processed in the same way as the HST images.
Each model PSF was convolved with the appropriate charge diffusion kernel in order to account for the effect of electrons leaking into neighboring pixels on the CCD. The PSFs were then combined and resampled onto a final grid with a pixel size of 004 in all bands using AstroDrizzle, with the settings described in Section 2.0. The resulting simulated model PSFs are shown in Fig. 3.
4.2 Bulge-Disc Decomposition and Best Fit Photometry
We used a pixel (), pixel () and pixel () fitting region centered on the brightest pixel in the H, B and I bands, respectively. The fitting region size is almost double as compared to the angular size of J2345-0449, whose effective radii is well under ( 1.4 kpc).
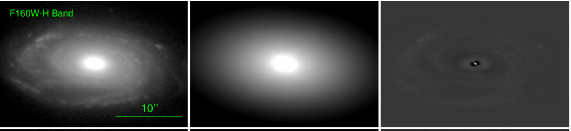
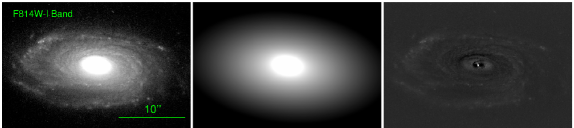
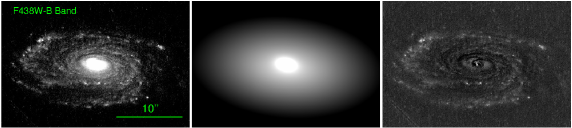
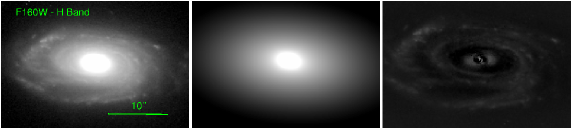
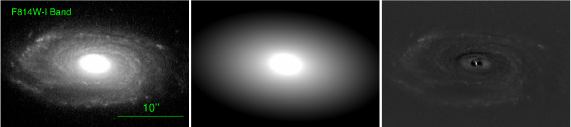
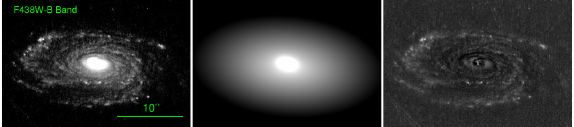
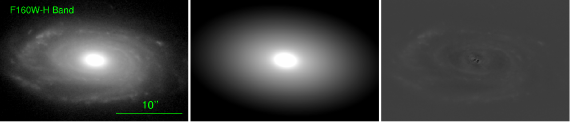
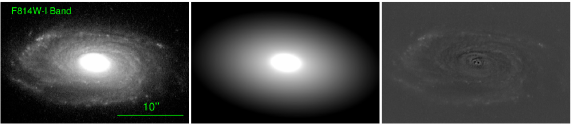
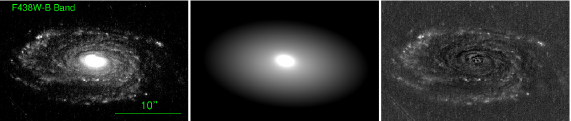
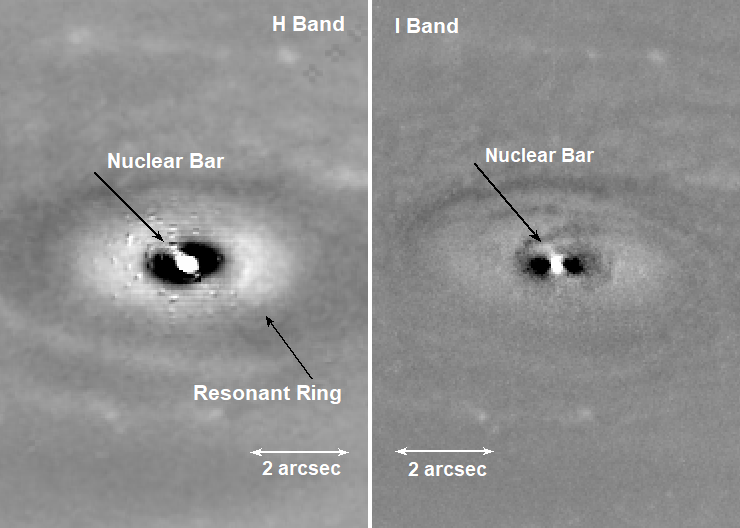
We experimented with different combination of functions available in GALFIT to fit to the WFC3 images. In first pass the simplest model A, with one Sérsic bulge and one exponential disc function is used to model the light profile of the J2345-0449. The best fit models in each filter and the residual images are shown in Fig. 4. Interestingly in the model A residual images shown in Fig. 10 one can see evidence for a small nuclear bar on ( pc) scale, spiral shaped dust lanes winding inwards, and a large resonant ring surrounding the nuclear bar. In addition due to higher dust extinction in I band, a dark disc shaped region surrounding the nuclear bar is more prominently visible in H-band image. We further discuss the implication of these structures below.
From Fig. 4 it is evident that the model A with one Sérsic bulge plus an exponential disc is promising but not enough to describe the innermost light profile seen in the target galaxy. There is an excess, compact light core and a stellar halo and ring seen at the central region of the galaxy which was not accounted for by the simple two component model. This excess light is not seen in previous photometric decomposition of this galaxy (Bagchi et al., 2014), but only visible here due to the exceptionally high spatial resolution of HST.
Next, in model B we added a PSF function to the simplest model of bulge and disc and fit this model to data. In this case, the fit results in improved , but even then the residual images shows some excess light and halo around the central AGN core region (Fig.6 right panels).
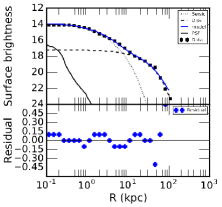
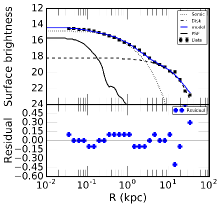
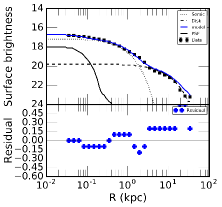
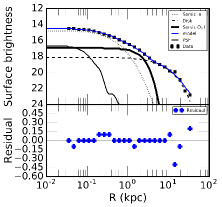
Finally, we tried a more complex model C with more sub-components. We used a combination of two Sérsic functions; an inner Sérsic1 and another outer Sérsic2 , plus one exponential function and one PSF function to fully account for the excess light at the center. This composite model provides very good fits to the F160W, F438W and F814W filter band images of this galaxy (Fig. 8) resulting in smallest . The three fitted models A,B, and C with the derived structural parameters and their respective values are tabulated in Table.4.
We also subtracted the best-fitted PSF, Sérsic and the exponential disc models from the observed images and searched for any bar-like stellar component in the host galaxy of J2345-0449. In addition, we looked for the presence of a double or multiple nuclei as a sign of mergers. As can be seen in the input data and the residual images, no evidence of a multiple nuclei is found in any of the HST bands, while a central nuclear bar and a stellar ring is found (Fig. 10)
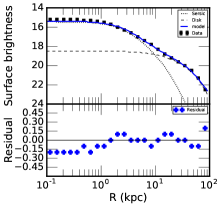
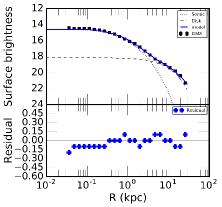
4.3 Obtaining Radial Surface Brightness Profiles
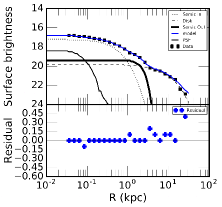
We fit elliptical isophotes (ellipses of constant surface brightness) to both the HST/WFC3 images and the PSF-convolved GALFIT model sub-components using the PyRAF/STSDAS routine Ellipse (Freudling, 1993), which is based on methods detailed by Jedrzejewski (1987). We also performed isophotal fits to the model PSFs in order to display their radial surface brightness profiles. Plots of the F160W, F814W and F438W filter radial profiles of the surface brightness for spiral J2345-0449 and residuals of fits are shown in Fig. 4, 6 and 8 panels showing the best fitting profiles corresponding to models A, B and C mentioned above. We caution that 1D radial profile plots is a powerful tool to visualize the goodness of photometric fits, however it is not useful to visualize non-axisymmetric features of the surface brightness (like a stellar bar), which are best seen on 2D images. We further discuss a non-axisymmteric nuclear bar structure below.
4.4 A Small Scale Nuclear-bar and a Resonant Ring
Fig. 4 and 6 reveal in their right panels – that is their residuals from the H, I and B images – a clear nuclear bar in the very center. This bar is surrounded by a bright ring, forming a circumnuclear disc. The latter is then embedded in a two-arms spiral on larger scales, which is somewhat flocculent, but still is the remains of a coherent density wave. There are clearly two external spiral arms, which look coherent over 180 degrees (see Fig. 2). The details of this nuclear bar and ring are better seen in the residual images of innermost region Fig. 10. Bars typically have a radial profile characterized by a Ferrers function or a Sérsic function with . We note, one of the inner components of a double Sérsic (plus one exponential function) GALFIT Model C indeed has inner Sérsic (Table.4); and the residuals seem to have removed the bar-like feature seen visually in the other models that did not include this extra component (Fig. 8).
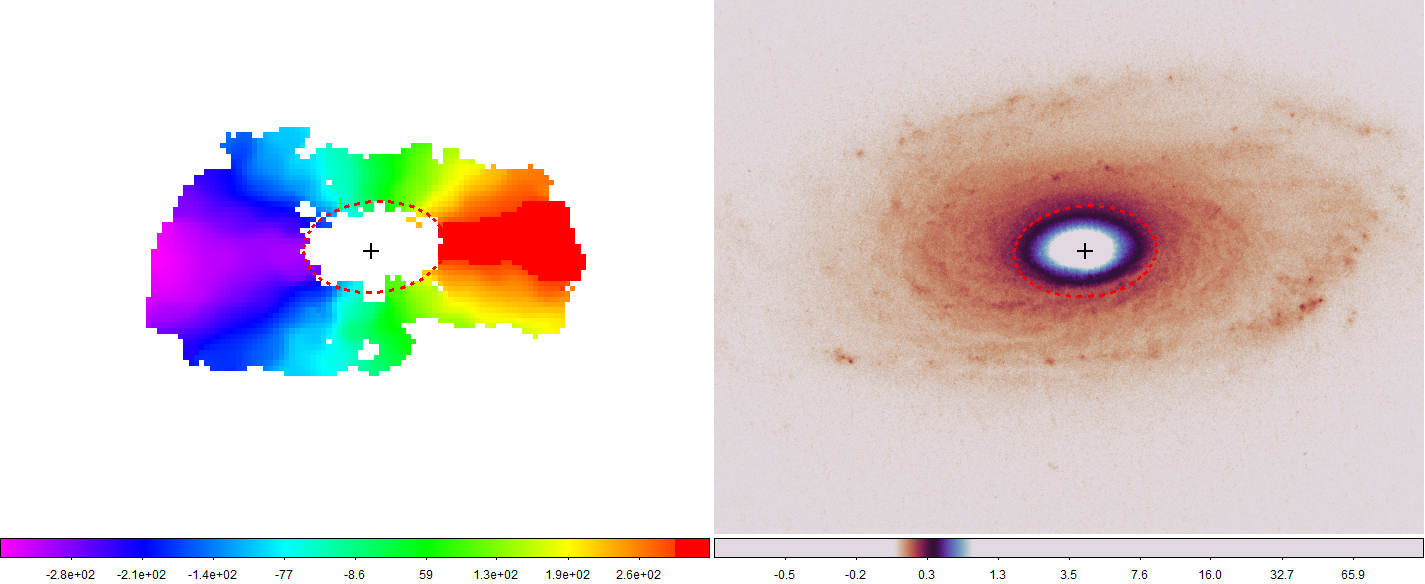
The nuclear bar, oriented at PA degrees, has a diameter of arcsec in projection. Since it is located near the minor axis, its intrinsic diameter is about 1.6 arcsec, or 2.4 kpc. This nuclear ring might be at the origin of the slight velocity residual from disc rotation along a similar PA in the MUSE H data cube (Fig. 12 of Drevet Mulard et al. (2023)). The nuclear bar is encircled by a nuclear stellar ring, of mean diameter of arcsec, or 4.4 kpc. The ring is clearly seen due to the very dark regions devoid of any light (stars) in the regions east and west of the nuclear bar. Since even in the NIR (H-band image) the region is very dark it is actually devoid of light and does not correspond to highly dust obscured regions. With dark void regions on each side, and with a ring outside the bar, they form a -shaped morphology.
Bars are dynamical structures in galaxies that can generate a variety of resonant phenomena, including Lindblad Resonances (LR), due to their gravitational influence on the surrounding stellar and gas populations. Lindblad resonances are locations within a galactic disc where the rotational frequency of stars or gas matches the frequency of the gravitational potential induced by the rotating bar. These resonances occur at specific distances from the center of the galaxy and are associated with the spiral density waves generated by the bar. Overall, the presence of a galactic bar can significantly influence the dynamics of stars and gas within a galaxy, and Lindblad resonances play a central role in mediating these interactions. Studying the connection between bars and resonances is essential for understanding the formation and evolution of galactic structure.
From what has been learned with numerical simulations of embedded bar decoupling, a nuclear bar forms usually inside the resonant ring of a primary bar. The ring is then both the inner Lindblad resonance (ILR) of the primary bar, and the UHR (ultra-harmonic) resonance near corotation of the nuclear bar (e.g. Buta & Combes (1996)). The common resonance occurs at the decoupling of a nuclear bar, embedded in a primary bar, to avoid chaos in stellar orbits, and ensure more stability of both bars (Friedli & Martinet, 1993).
There is no primary bar seen at the present epoch in the J2345-0449 galaxy, but it might have been destroyed by the gas infall to the center (e.g. Bournaud & Combes (2002)). Indeed, there has been a recent AGN activity in the galaxy, as witnessed by the giant radio jets. A primary bar, supported by a secondary bar, is the most efficient dynamical mechanism to drive the gas to the center, and to fuel the AGN (e.g. Combes et al. (2014)). The presence of a nuclear bar can affect how material is funneled towards the supermassive black hole, influencing its feeding rate and the resulting activity, such as the emission of powerful jets of particles and radiation.
This means that in past a primary bar likely existed with an ILR at 2.2 kpc radius, and then which gave birth to the embedded nuclear bar, and then it got dissolved. When gas has been driven in because of torques from the bar (due to strong tangential forces), then the gas torques also the bar (from the equality of action and reaction), and gives its angular momentum to the bar. This destroys the primary bar, as has been developed in models by Bournaud & Combes (2002) and Bournaud et al. (2005).
We proposes the AGN at the origin of the radio jet has been highly active in the past; and consumed and/or ejected all the central molecular gas. There is no longer cold gas left in the very center, but the disappeared primary bar might have played the major role in driving the gas to the center. Today we observe a large molecular ring, with CO emission (Fig. 14), with a mean radius of 6.6 arcsec, or 10 kpc (Nesvadba et al., 2021). This neutral gas ring could correspond to the OLR (Outer Lindblad resonance) of the past primary bar.
The observed bulge looks more like a pseudo bulge, which comes usually from a bar evolution, supporting that there existed a primary bar in the past, with a ring at its ILR. This also fits with the position of the galaxy in the green valley, after a star formation episode corresponding to the primary bar driving the gas inwards.
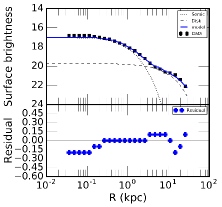
4.5 Spectral Energy Distribution (SED) Models
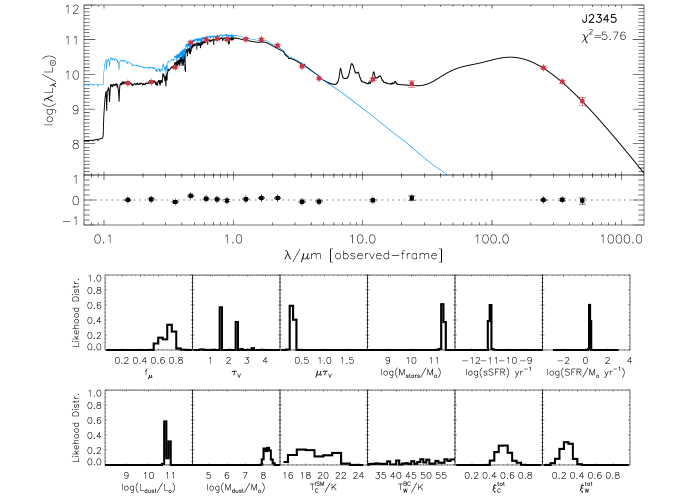
For the SED fitting and to investigate the various physical parameters of J2345-0449, such as the stellar mass, star formation rate, dust mass, dust temperature, dust opacity, dust luminosity, and contribution by AGN radiation to SED etc., we have made use of the publicly available spectral energy distribution fitting code MAGPHYS (Multi-wavelength Analysis of Galaxy Physical Properties) V 2.0 developed by da Cunha et al. (2010) to fit the available multi-band photometric data over the wide wavelength range from 912 Åto 1 mm. The input data spans from GALEX in UV, SDSS in optical, 2MASS in the near-IR, WISE in the mid-IR and Herschel in the far-IR. The best fitting parameters and SED model fit on photometric data points are tabulated in Table. 5 and shown in Fig. 11, respectively. In this figure, The black line is the best fit model SED and the blue line is the unabsorbed optical stellar model. The bottom panel shows the residuals of the difference between best-fit and the observed data points. The fit provides normalized likelihood distributions of best fit physical parameters which are given in Table. 5 and shown in Fig. 11. These parameters are as follows; (1) fraction of total dust luminosity contributed by dust in the ambient (diffuse) ISM ; (2) average V band dust attenuation, ; (3) total effective V-band absorption optical depth of the dust seen by young stars inside birth clouds ; (4) stellar Mass, ; (5) specific star formation rate, ; (6) star formation rate, ; (7) total dust luminosity, ; (8) total dust mass, ; (9) equilibrium temperature of cold dust in the ambient ISM, ; (10) equilibrium temperature of warm dust in the ambient ISM, (11) fractional contribution by cold dust in the total infrared emission, ; (12) fractional contribution by warm dust in the total infrared emission, .
The goodness of the fit can be judged from the with reduced for degrees of freedom (18 data points and 12 parameters for fitting), which indicates a very good fit. The best fit results of MAGPHYS are shown in Table. 6. The error bars indicated are within confidence interval taken between the 16th to 84th percentile range of the likelihood distributions of each parameter.
5 Results and Discussion
5.1 On the Bulge and Disc Morphology and Implications
High-resolution bulge-disc modelling of HST multi-wavelength images revealed that the Sérsic index of the bulge is , which essentially implies that the galactic bulge to be a pseudo-bulge having a disc-like exponential light profile rather than a classical bulge (see Table 4). However in H-band we find that the Sérsic index of the bulge is slightly larger (range of in models A, B and C). Evidently this is consequent to the fact that in near IR light the dominant population are old stars which have a larger scale height in the bulge compared to blue stars in the disc. It is to be noted that, empirically, for pseudo-bulges and classical bulges have , but the division is not perfectly bimodal with some degree of overlap between the two classes (Weinzirl et al., 2009; Fisher & Drory, 2008). The Sérsic index represents a pure exponential disc like profile and corresponds to the de Vaucouleurs elliptical galaxy like profile. While this is rather a simplified division, more observations and analysis are needed to investigate their physical details (Graham, 2016). Several previous observations have found that bulges may exhibit fairly complex composite structures with a mix of spherical/ellipsoidal, disc-like, or boxy/bar-like components, potentially showing a wide array of possible bulge morphology in the universe. Nevertheless, pseudo bulges are always systematically flatter than classical bulges and appear more disc-like in both their morphology and shape (Fisher & Drory, 2008).
We find that the typical scale length of the pseudo-bulge is much smaller when compared to the disc , which has , (Table 4), as one expects for pseudo bulges. To quantify the relative light distribution in bulge and disc components the bulge (B), disc (D) and total (T) luminosity were derived along with and measurements indicating bulge to disc and bulge to total (bulge+disc) luminosity ratios. It can be seen in Table 2 that our object has a maximum per cent contribution to the total intrinsic light accounted for H-band and only per cent contribution in B-band. About per cent fraction of the total SDSS g-band or r-band luminosity is contributed by the bulge. These numbers again indicates that this spiral galaxy has a pseudo-bulge rather than a classical bulge component. Galaxies with classical bulges generally have a much more centrally peaked light profile, contain a higher fraction of total light, and their Sérsic index is larger () than the pseudo-bulges (Fisher & Drory, 2008; Weinzirl et al., 2009; Fisher & Drory, 2011; Ray et al., 2022).
Here we consider the (B/T or B/D) ratio an important parameter (notably both are strongly colour dependent) of galaxy structure that is also well correlated with several other key physical quantities relevant in studies of galaxy evolution; such as the morphology, kinematics, stellar mass and star formation rate et cetera. The B/T is also directly related to the fraction of total light and mass contained in the bulge, which in turn tightly correlates with the mass of the central supermassive black hole of the galaxy (see Kormendy & Ho (2013) and references therein).
The above results of bulge-disc decomposition strengthen our previous lower spatial resolution study (Bagchi et al., 2014) where we concluded that J2345–0449 possibly features a pseudo-bulge, whose small Sérsic index and scale radius, and low bulge-to-total light ratio make it similar to pseudo-bulges observed in other galactic systems (e.g. Gadotti (2009)). Recent recognition of a high fraction ( percent ) of nearby spiral galaxies having no kinematically “hot" central bulge challenges the conventional ideas of hierarchical galaxy formation; i.e. how have so many bulgeless pure disc galaxies come to exist, despite the galaxy mergers known to occur (Weinzirl et al., 2009; Fisher & Drory, 2008, 2011)?. While classical bulges are possible products of galaxy mergers pseudo-bulges, seem to be still evolving, more likely as a result of their host galaxies’ slow internal evolution, which involves disc instabilities and angular momentum transfer.
At present very little is known about the formation mechanism and evolutionary path of such extremely massive disc galaxies, as they are found rarely, and moreover, not known to eject powerful relativistic jets on megaparsec scale, like those found in J2345-0449. Based on its structural and photometric properties discussed above, here we propose that the cosmic co-evolution of the galactic disc of J2345-0449 and the central SMBH driving the radio jets may have been primarily driven by external cold gas accretion and internal ‘secular’ processes (Kormendy, 2013) instead of recent major merger events. This is suggested by its fast rotating exponential disc-like pseudo bulge, the absence of close galactic neighbors and signature of tidal debris (e.g., stellar streams, plumes, or shells), and its stable, rotation supported massive stellar disc showing well-formed spiral arms. In a recent HST study of spiral host galaxies showing double lobed radio jets Wu et al. (2022) found that they have exceptionally weak bulges, as judged by the low global concentrations, small global Sérsic indices, and low bulge-to-total light ratios (median B/T = 0.13). With a median Sérsic index of 1.4 and low effective surface brightnesses, they are consistent with harboring pseudo bulges.
In the late stages, dynamically, a major merger of galaxies will inevitably create a prominent classical bulge and may exert a strong perturbation of the central black hole’s spin axis as it may be torqued by the gravitational influence of a second black hole nearby, and eventually both will merge in a single stable black hole of a larger mass, emitting nano Hertz frequency gravitational waves (EPTA Collaboration et al., 2023; Agazie et al., 2023; Reardon et al., 2023; Xu et al., 2023) during inspiral. On the contrary, in J2345-0449, a close alignment (within 10 degrees) of the inner and outer radio lobe pairs, and lack of violent merger signs, implies that the black hole’s spin axis, which in equilibrium state orients itself orthogonal (either parallel or anti-parallel) to the inner accretion disc spin direction because of the Lense–Thirring frame dragging effect (Bardeen & Petterson, 1975), has remained stable (non-precessing), at least between the two last episodes of jet triggering on timescales of yr. Thus, the jets are possibly emitted from a stable gyroscope, such as a rapidly spinning massive object, and present theories provide a framework of jet formation via a magneto-hydrodynamic (MHD) plasma mechanism (Blandford & Znajek, 1977; MacDonald & Thorne, 1982; Penna et al., 2013). All this suggests that the galactic disc and the central black hole might have a quiet evolution together, without upheavals of major mergers.
Recently Izquierdo-Villalba et al. (2019) studied evolution of L-Galaxies from the catalogues of merger-trees obtained by the Millennium (Springel et al., 2005) and Millennium II (Boylan-Kolchin et al., 2009) N-body simulations. They find that at early epochs () pseudo-bulges are the main type of galaxies at high stellar masses while classical bulges and ellipticals are the main ones for . While at low masses there is little evolution between and , at high masses by , bulged ellipticals are now the dominant galaxy population and pseudo-bulges have declined in number. This results from the hierarchical growth of structures: pseudo-bulges hosted in the most massive galaxies at high-z are subsequently destroyed by major mergers which turn galaxies into pure bulges. However, since massive galaxies of only make up per cent of bright galaxies in the local volume, pseudo bulge galaxies and those with no bulge are the dominant type of bright galaxy by number in local Universe (Weinzirl et al., 2009; Fisher & Drory, 2008, 2011). Contrary to the above findings, we find that J2345-0449 is a rare, highly massive galaxy ( in local universe () which apparently has managed to survive the destruction of its’ pseudo bulge by violent mergers, as it might have evolved predominantly through secular, disc driven processes - the same conclusion that we arrived at from other arguments.
Using IUCAA telescope spectrum we obtained the best-fit values of stellar velocity dispersion of the central region of bulge from fitting the Mg b ( Å) line, after correcting for the redshift and instrumental broadening, which gave with the slit oriented along the major axis and along the minor axis. Both values are spatially averaged over 5 pixels (2.35 kpc) centered on the galactic nucleus (Bagchi et al., 2014). This gives an extremely large dynamical mass of bulge , roughly within one scale radius kpc (We have further discussed the implication of this large bulge dispersion velocity and mass concentration below). The massive stellar and gaseous disc of J2345-0449 is clearly rotation supported, with , where is the rotational speed and is velocity dispersion of stars) and therefore, galaxy disc should be dynamically stable against gravitational instability.
| Band | ||||
|---|---|---|---|---|
| () | () | |||
| F438W | 0.093 | 0.085 | ||
| F814W | 0.240 | 0.193 | ||
| F160W | 0.287 | 0.223 |
5.2 Stellar Mass, SFR, Dust and Gas Properties in the Disc
Structurally J2345-0449 shows a prominent disc of stars, and interstellar medium (ISM) of warm dust along with a coplanar rotating cold, molecular (mainly H2 and CO) gas disc in the equatorial plane. Based on our SED fitting models (Table 6 and Table 7) we infer the following properties of the ISM and dust components;
Rowlands et al. (2012) did a study on dust properties and star formation history of the local sub millimetre detected galaxies, with a mixture of early-type and passive spirals. The passive spirals are defined as early-type galaxies with dust abundance and low SFR. They found the mean dust luminosity with in the range for early-type galaxies, and for passive spirals mean with in the range . From SED fitting we find (Table 6) consistent with the results of Rowlands et al. (2012), with dust mass for J2345-0449 falling at the highest mass end of passive spirals. The small ratio of dust to stellar mass is typical of passive galaxies (Orellana et al., 2017), while the ratio of molecular gas mass (H2 mass is ) to stellar mass is far higher at indicating a large, quiescent (non star forming) repository of potential star forming material.
The estimated integrated stellar mass, of the galaxy is from SED model MAGPHYS and from CIGALE model. They are consistent with each other within errors. We may take the stellar mass of the galaxy as the mean of two values at . In an earlier paper Nesvadba et al. (2021) quoted a value of based on 2MASS J-band magnitude. This value is higher than our SED fitted values but we note it is dependent on the assumed star formation history and the mass-to-light ratio in J-band.
The global SFR computed via two competitive SED fitting models; MAGPHYS and CIGALE, gives consistent results. SFR and sSFR from MAGPHYS is and while from CIGALE it is and . In previous works Nesvadba et al. (2021) measured SFR of based on J-band magnitude and Walker et al. (2015) obtained based on FUV flux of GALEX, bracketing our value. These are global SFRs from the integrated flux values. One should refer to Drevet Mulard et al. (2023), who have discussed SFR surface density and observed properties of individual star-forming regions in the disc based on VLT/MUSE spectroscopic observations.
J2345-0449 shows mild ongoing star-forming activity across the galactic disc, traced by H and [NII] emission lines in our slit spectrum. It is also strongly detected by the Galaxy Evolution Explorer in the near (2316 Å) and far UV (1539 Å) bands, indicating a starburst of massive, hot OB stars during the past Myr. Interestingly, UV or H signatures of very recent ( Myr old) stars are absent closer to the nucleus, which shows only stellar populations older than Gyr in bulge, while most of the ongoing star formation in blue stellar nurseries is occurring in the outer disc (cf. Fig. 2 here and Drevet Mulard et al. (2023)). This requires some physical process which will rapidly shut down star formation in the central pseudo-bulge region. One may interpret this as a consequence of heating and expulsion of the star-forming medium by the energetic, episodic feedback of the central AGN, as revealed by two pairs of radio jets and lobes.
.
5.3 Contribution of the Active Galactic Nucleus (AGN) to SED and the Accretion State of the Black Hole
For an accreting black hole the Eddington luminosity () is a critical limit for the luminosity that the AGN can achieve before the radiation pressure from the emitted light becomes strong enough to counteract the gravitational force on the infalling gas. It is given by the formula:
| (3) |
Here, is the gravitational constant, is the mass of the black hole, is the mass of proton, is the speed of light and is the Thomson scattering cross section.
vigorous star formation produces significant UV emission, and the IR luminosity of dust is often interpreted as being directly proportional to the absorbed fraction of the energy from star formation. In addition, it is possible that a significant radiative flux from the AGN may contribute to the SED as well as drive an outflow similar to QSOs. Active nuclei can emit strongly in UV, and if embedded in a dusty torus, may also contribute to the IR emission by heating dust in the torus and clouds surrounding the AGN. In addition, an older stellar populations can also heat dust that is present in the ISM of a galaxy, which can add to the total FIR emission. Simultaneous model fittings to the SED provide powerful insights into these processes.
In order to investigate all such complex astrophysical processes we used the CIGALE V 0.9111https://cigale.lam.fr/, a Python-based SED fitting code (Noll et al., 2009; Boquien et al., 2019) to constrain the fractional contribution of AGN radiation to the total IR luminosity, represented by the AGN-fraction parameter. In addition, CIGALE also simultaneously provides several other parameters of ISM dust and star formation activity in the galaxy, similar to MAGPHYS. We have done SED fittings taking fiducial AGN-fractions of 0 per cent, 10 per cent and 20 per cent. The AGN-fraction is defined as the AGN contribution to the total IR luminosity in band. In CIGALE, AGN-fraction explicitly takes into account three emission components through a radiative transfer model; the primary source surrounded by a dusty torus, the scattered emission by dust, and the reprocessed thermal dust emission (more details can be seen in Boquien et al. (2019)).
The results of SED fitting with varying AGN contributions are shown in Table 7. A varying degree of AGN fraction did not significantly (at per cent confidence level) improve the reduced of the fit, on the basis of a Fisher-test. Therefore, SED fitting reveals no evidence of a (obscured or unobscured) radiatively efficient, accretion driven energy source in the galaxy’s SED. Notably, the high excitation radio galaxies (HERGs) are fuelled at high Eddington rate onto a radiatively efficient standard accretion disc by cold gas, perhaps brought in through mergers and interactions, which is clearly absent in this galaxy. Rather, the AGN in J2345-0449 can be classified as a low-excitation radio loud AGN (LERG; e.g., Best & Heckman (2012); Heckman & Best (2014)), possibly powered by a radiatively inefficient, low Eddington ratio, hot accretion flow of gas from the IGM (know as the Bondi-Hoyle type accretion) (Heckman & Best (2014); Hardcastle & Croston (2020) and references therein) on a super massive black hole, which are associated with AGN jets . In addition In terms of astro physical process the gaseous fuel for the LERGs is possibly derived from the hot X-ray halos surrounding massive galaxies, groups and clusters, as part of a radio-AGN feedback loop. Consistent with this picture, indeed an extended ( kpc scale) soft X-ray emitting halo of warm/hot baryonic matter is robustly detected in this galaxy (Walker et al., 2015; Mirakhor et al., 2021), whose implications are further discussed in next sections.
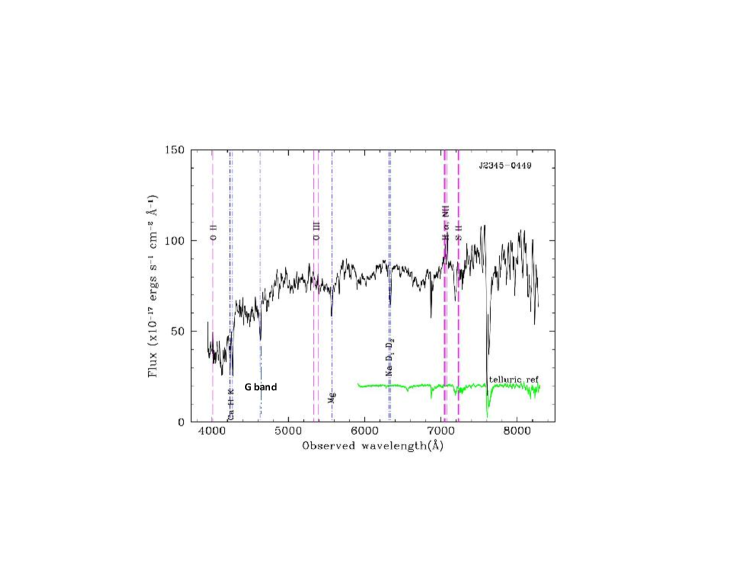
Furthermore, in order to better constrain the bolometric luminosity of the AGN we make use the first results from (Bagchi et al., 2014) and the optical spectrum taken on IUCAA 2m telescope of central AGN region (Fig. 12), which clearly falls into the LLAGN/LINER type with weak emission of the nucleus (Tadhunter et al., 1998; Best & Heckman, 2012; Buttiglione et al., 2010). From VLT/MUSE spectroscopy of J2345-0449 Drevet Mulard et al. (2023) also concluded the same. The optical spectrum of J2345-0449 core is characteristic of an old stellar population. The [OIII]4949 Å+ 5007 Å emission doublet is not detected in our spectrum above noise floor. We use the empirical relationship of Heckman et al. (2004) to estimate the bolometric AGN luminosity limit by setting . With the upper limit of given by Bagchi et al. (2014), this would correspond to and an Eddington ratio of for BH mass range . Drevet Mulard et al. (2023) estimated from [OIII]4949 Å+ 5007 Å luminosity, quite close to our estimate. However, both values should be considered upper limits because the fluxes are dominated by the old stellar populations around the nucleus, which are the dominant gas heating source in the nuclear regions of J2345-0449 (Drevet Mulard et al., 2023). In addition, the absence of broad Balmer emission lines in our slit spectrum (mainly the line ) implies that J2345-0449 is not a Broad Lined Radio Galaxy (BLRG or a type-I AGN). Nevertheless, it is evidently extremely radio loud for a spiral galaxy, which as a rule, do not create such large scale radio jets. The integrated flux density and radio luminosity of J2345-0449 at 1.4 GHz are estimated at mJy and erg s-1 Hz-1, respectively, which is typical of a low/medium powered radio galaxy.
This bolometric luminosity is also indicative of the current rate of mass accretion and growth rate of the black hole over time. The current rate of growth of the black hole () is governed by the mass accretion rate on the black hole and the resulting bolometric luminosity,
| (4) |
where, c is the speed of the light and is the efficiency of the accreted mass to radiative energy conversion (rest of the accreted mass is swallowed by the BH). The value of is usually unknown, but some previous works (e.g., Carraro et al. (2020); D’Eugenio et al. (2021)) find, , which for J2345-0449 gives an upper limit to mass accretion rate of , assuming lower limit of as above. At this fairly low accretion rate in the present epoch, assembling even a lower mass black hole of would take about a Hubble time, and much longer for a more massive black hole. This implies that either the primordial ‘seed’ black hole was very massive initially or the mass accretion rate was much higher in the past than the present low rate, leading to the unusually rapid growth of a SMBH in the galactic nucleus, without necessitating major merger events.
This is a promising scenario for J2345-0449 because it’s AGN is presently in a low-excitation state (LERG/ LLAGN), showing extremely low radiative efficiency, but has a very high kinetic luminosity in jetted outflows (a ratio of Jet-power/bolometric luminosity ), strongly reminiscent of a hot Advection Dominated Accretion or the Radiatively Ineficcient Accretion Flows (ADAF - RIAF, Narayan & Yi (1994),Yuan & Narayan (2014)). In this accretion mode, because of rapid advection, compared to radiative cooling time, the radiative efficiency of accretion flow is in general lower than that of a standard thin accretion disc. This model also provides an important clue as to how the radiatively inefficient, Mpc scale kinetic radio jets in J2345-0449 might be launched via a low Eddington rate accretion state, as observed in local radio-loud galaxies (Ho, 2002). Recently, in an extensive study of Mpc scale Giant Radio Galaxies (GRGs) Dabhade et al. (2020b) came to the conclusion that almost every one of the GRGs in their sample is fuelled by an AGN with low value of Eddington ratio () and confirms to the low accretion rate, radiative inefficient ADAF/RIAF model. Interestingly, in a parallel study Mahato et al. (2022) showed that average accretion rate of Giant Radio Quasars (GRQs) () is roughly about 10 times higher than Giant Radio Galaxies (radio jets of both extend to similar Mpc scales, but GRQ jets have more kinetic power than GRGs), while their central black holes are about equally massive ( to ). This implies that powerful Mpc scale radio jets can be launched even at high rates of accretion () and mass of the black hole is not a main deciding factor. Recently Breiding et al. (2024) found strong evidence for jet activity in radio loud quasars triggered by mergers. A corollary of this result is that launch of radio jets needs some additional favorable or necessary conditions, like the fast spin of BH and interaction of the accretion disc with strong magnetic fields near the black hole, possibly launched via the Blandford-Znajek (BZ) or Blandford-Payne (BP) type mechanism (Blandford & Znajek, 1977; MacDonald & Thorne, 1982; Penna et al., 2013). In BZ model dynamically important horizon-scale magnetic fields near spinning Kerr black holes naturally produce powerful electromagnetic outflows (Event Horizon Telescope Collaboration et al., 2021, 2024) which may source the Mpc scale jets. These important studies provide fundamental insight into the accretion disc-relativistic jet coupling process in large dimension radio galaxies and quasars.
In J2345-0449 the Inner lobes show FR-II morphology, clearly being fed by active jets, while outer lobes look peculiar; long, filamentous, and diffuse, possibly decaying relics of previous jet activity that ceased millions of years ago. This makes the outer lobes excellent tracers of final stages of the radio jet activity (Fig. 1). The kinetic power of radio jets is estimated at from GMRT 323 MHz flux. As we have applied no correction for the (unknown) energy loss in the expansion of outer radio lobes, this is likely to be a lower limit. This jet power is much higher than and therefore, any radiation driven feedback impact of AGN, for example a radiation pressure driven outflow, akin to a quasar, would be at least about a factor 10 less energetic than the kinetic power carried by the radio jets.
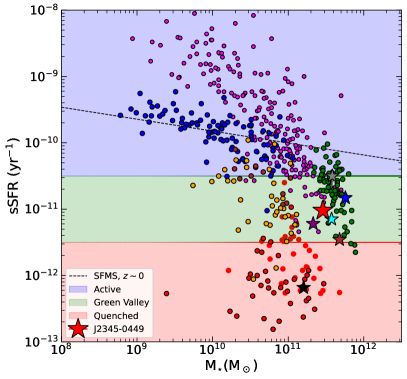
Thus, in this intriguing and rare spiral galaxy we are witnessing a radio-mechanical (sometimes also called the maintenance-mode) energetic outflow in action wherein the AGN, despite its low Eddington accretion rate and low radiative output, manages to produce large mechanical energy carried by the energetic jets which may couples efficiently to the circum-galactic atmospheric gas (e.g. Churazov et al. (2002)). In the absence of such feedback heating, the hot X-ray emitting intra-cluster gas in many clusters, groups and elliptical galaxies would cool and rapidly form stars, building much larger galaxies than are seen (see (Fabian, 2012; McNamara & Nulsen, 2012)). Intriguingly, J2345-0449 neither originates in an elliptical galaxy (but in a spiral) nor it is embedded in a rich galaxy cluster or a group environment, and the working surface of the farthest ends of radio jets (the termination shocks) clearly extends well beyond the galaxy’s virial radius ( kpc), they do not encounter a dense thermal plasma to inflate X-ray dark non-thermal cavities or bubbles, unlike the cluster central BCGs of elliptical morphology. Nevertheless, the radio-mechanical impact of it’s radio jets on the circum-galactic ambient medium is inevitable, that could be preventing the cooling of its extended, hot gaseous atmosphere strongly detected in deep X-ray observations (Mirakhor et al., 2021), thereby possibly partially quenching the new star formation in the disc. As we show below, compared to the radiation pressure dominated quasar-mode feedback, the radio-mode mechanical feedback in this galaxy is possibly keeping it in the state of semi-quiescence (in maintenance mode) rather than fully quenching the star formation in the disc. Nevertheless, in early growth phase of the central supermassive BH, when growing at super-Eddington/Eddington rate accretion, it may have exerted strong feedback affect via a hot wind on the molecular/atomic gas and reduced the star formation rate on these very small scales. In contrast, UGC 12591 is one such extreme mass, highly bulge dominated hybrid galaxy reported by Ray et al. (2022) which has no visible powerful radio jets observed now, yet it has reached a state of virtual quiescence showing extremely low star formation rate, which is shown plotted in Fig. 13 along with J2345-0449 and a many other galaxies of various star formation states and stellar mass ranges.
5.4 An Accreting Supermassive Black Hole Growing in a Bulgeless Environment
At present very little is known of the growth and AGN activity of SMBHs in bulgeless spiral galaxies. Our HST results above firmly establish J2345-049 to be a disc dominated spiral with unusual characteristics. Despite lacking a classical bulge, this exceptional spiral galaxy hosts a pseudo-bulge and possibly a massive, mass accreting (radio-loud) central black hole of minimal mass , which is needed to launch the large Mpc scale relativistic jets at low to medium mass accretion rates, See (Dabhade et al., 2020b; Mahato et al., 2022).
Here we attempt to estimate the mass of the central black hole using several established scaling relations. Our present data do not provide strong constraints on . One possible reason is because J2345-0449 lacks a classical bulge, whereas the black hole mass is more easily obtained from the tight correlation in bulge-dominated systems (Häring & Rix, 2004; Marconi & Hunt, 2003; Gültekin et al., 2009a). For this reason the demographics of black holes in pure disc galaxies are poorly determined. However, there is growing evidence that a classical bulge is not essential for nurturing a massive black hole and some pseudo-bulge systems may also host fairly massive black holes of masses (Kormendy et al. (2011); Shankar et al. (2012)). Therefore, these black holes must somehow attain masses substantially larger than the values implied by their bulge properties, possibly via a disc-driven, non-merger growth route. Possibly J2345-0449 is one such system, being an extreme member of such a population.
The (pseudo)bulge centric stellar velocity dispersion value on arcsec scale in J2345-0449 is km s-1 which is much higher than normal Milky Way like spirals and close to the highest velocity dispersion found among nearby E and S0 galaxies, and is also significantly larger than that known for the majority of bulge-less disc galaxies on such a spatial scale (e.g., Hu (2008); Graham (2016); Shankar et al. (2012)), and compares well with that usually found for massive elliptical galaxies (e.g., (Häring & Rix, 2004; Marconi & Hunt, 2003; Gültekin et al., 2009a). This strongly hints at a large central concentration of mass, including a putative SMBH in this overall massive galaxy. Pseudo-bulges are products of secular evolution, where instead of mergers, the internal dynamics of the galaxy drive the redistribution of material (Kormendy, 2013). This evolution can strongly impact the feeding of the central black hole and influence its growth.
Using the dynamical mass of the (pseudo)-bulge , within one scale radius ( = 1.25 kpc), we calculate the putative black hole mass using the black hole mass vs. bulge mass correlation found by Marconi and Hunt (Marconi & Hunt, 2003). This value is comparable to another estimate of obtained from the correlation of Hu (2008), applicable for the pseudo bulges. Another estimate using the Fundamental Plane (FP) relation of black hole activity of (Gültekin et al., 2009b) gives the black hole mass using 5 GHz radio luminosity of AGN erg sec-1 and 2-10 keV X-ray luminosity erg sec-1 (Bagchi et al., 2014). However, if we use the relation of Gültekin et al. (2009a), which is calibrated using a mixed sample of both ellipticals and spirals, with dynamically detected central black hole masses and has an intrinsic rms scatter of , we obtain the black hole mass . Finally, using K-band correlation of Graham (2007) we obtain . Both these latter BH masses are close to each other, yet are significantly larger than the previous mass estimates. It is necessary to verify these rather large black hole mass values via more direct and robust methods. If confirmed it would imply that J2345-0449 hosts a SMBH as massive as those found in giant elliptical galaxies (), which is not expected at all for normal disc galaxies, and which will pose a tension and raise various interesting questions about origin and growth of an accreting black hole in J2345-0449.
We note that some previous works have suggested (e.g., Hu (2008); Graham (2016); Graham et al. (2011); Shankar et al. (2012)) that pseudobulge and barred galaxies may host black holes that are about 3-10 times less massive than pure ellipticals with the same . It has also been proposed that their black hole masses do not correlate well with the properties of galaxy discs or their pseudo bulges (Kormendy et al., 2011), and hence the growth process of massive black holes in flattened galactic discs lacking prominent bulges is still puzzling and therefore a subject of ongoing deeper investigations. Interestingly, Kormendy & Ho (2013); Kormendy et al. (2011) find that there is no convincing evidence of co-evolution of SMBH and the disc component of galaxies, i.e. feedback from BH accretion does not affect disc evolution and its stellar content. They propose feedback from star formation is much more important in disc dominated systems than radio mode feedback. On the contrary, in J2345-0449, a predominantly disc dominated system, we find that SFR is very small (significantly quenched) for its extremely large stellar and molecular gas masses, and it clearly hosts a super massive black hole launching powerful radio jets, which clearly is located in the nuclei of a bulge-less pure disc system, contrary to the above idea. This makes J2345-0449 a unique and exceptional galactic laboratory where powerful AGN energized radio jets seem to be directly regulating the star formation activity in the surrounding disc.
5.5 Molecular gas, star formation rate and comparison with other galaxies
As many of the properties of this galaxy are rather extreme, like its huge mass, fast rotation speed and unusual ‘double-double’ episodic relativistic radio jets extending up to Mpc scale, it would be very informative to investigate their relationship to the stellar and baryonic mass contents of the galaxy, and contrast that to other local less massive galaxies. The raw fuel for star formation in galaxies is the cold molecular gas (e.g. Larson (2003); Kennicutt (1998)), and to understand galaxy evolution requires understanding the various physical processes that are responsible for the accretion and depletion of this gas in different environments existing within the galaxy. The star-forming molecular clouds are predominantly made up of molecular hydrogen H2. As H2 lacks a permanent dipole moment, therefore it is difficult to directly observe at low gas temperatures. Instead highly abundant CO is a good molecular gas tracer in the interstellar medium. The Doppler shift in the frequency of any such molecular line tracers, provides immense information on kinematics and gas flows.
To compare the estimated SFR state of J2345-0449 with other disc galaxies we consider the largest sample of local SDSS galaxies on the SFR - plane (Brinchmann et al., 2004). The galaxies that lie on the star formation main sequence (SFMS) are the active star forming (SF) ones, and those that have significant offset from SFMS are the passive or quenched galaxies. To avoid the selection biases in the normalization, slope, and shape of the SFMS we use an ‘objective definition’ of the SFMS defined by Renzini and Peng (Renzini & Peng, 2015) from SDSS galaxy sample (Brinchmann et al., 2004) that does not rely on a pre-selection of star forming or passive galaxies at all.
The equation for Renzini and Peng derived best straight-line fit to the SFMS ridge line is given by (see Fig. 4 of Renzini & Peng (2015))
| (5) |
Therefore, for our estimated , the global SFR for J2345-0449, if it were to lie on the SFMS, should be and as against estimated SFR and sSFR of . The range of values shown above spans between MAGPHYS and CIGALE SED fitting estimates. Therefore we find here, J2345-0449 shows a globally integrated SF quenching by about a factor 4 when compared to the SFMS of Renzini and Peng (Renzini & Peng, 2015). We infer that although global SFR and sSFR for J2345-0449 both are significantly below the well established main sequence, it’s star formation rate is much above the fully quenched (spheroidal) galaxies, indicating a drastic reduction, yet not full termination of SFR. These kind of plots also reveal a clear bimodality in global and resolved realisations of the star forming properties of galaxies around the main sequence (Bluck et al., 2022).
On Fig. 13 we see the specific star formation rate (sSFR) of galaxies versus . When compared to main sequence of UV bright star forming galaxies of Hoopes et al. (2007), J2345-0449 is placed anomalously low in the region of partially quenched ‘green valley’ galaxies. The graph is divided into three parts, showing actively star forming region (), green valley region () and quiescent region () (see Salim et al. 2016). Very interestingly, within the ’green valley’ region we can also locate a few other most massive local galaxies (NGC 1030, NGC 1961, NGC 4501, NGC 5635 and NGC 266) of comparable high stellar masses (). The position of J2345-0449 is in stark contrast with the ultraviolet luminous galaxies of Hoopes et al. (2007) which show far more recent star forming activity for the same mass range. On the other hand, an extraordinary massive and fast rotating hybrid spiral UGC 12591 is located in the lower-most region of highly quiescent ’fully quenched’ galaxies showing the lowest specific sSFR of all (Ray et al., 2022). The fairly low sSFR of all these very massive galaxies ( few ) located in sparse environment show that perhaps galaxy’s high mass and local environment is responsible to quench star formation. Presently very few detailed studies of cold molecular gas content of galaxies falling below the main sequence of star formation are available, and a general perception is that these systems are devoid of gas. However a detailed study of their molecular gas content is a key element for understanding the reason behind their remarkably low SFR.
What about local star formation rates in the disc of J2345-0449? From resolved 12CO(J = 1-0) line (rest frequency, 115.271 GHz) observations with ALMA Nesvadba et al. (2021); Drevet Mulard et al. (2023) showed that J2345-0449 falls well below the standard Kennicutt-Schmidt relationship. The local star formation rates are strikingly lower by factors 50 to 75 from what is expected from the standard Kennicutt-Schmidt main-sequence relation (Kennicutt, 1998), at the given gas mass surface densities, in ordinary star-forming galaxies with similar stellar and gas mass surface densities. Significant offsets towards lower star-formation rate densities are also found from the Silk-Elmegreen law and the extended Schmidt law when taking into account the resolved stellar mass surface density in the disc (Nesvadba et al., 2021).
Previous ALMA CO observations fully resolve the molecular gas distribution and kinematics, and thus it is able to distinguish between rotating discs, galaxy mergers, or gas inflows and outflows in J2345-0449. 12CO(J = 1-0) line imaging and GALEX UV images both show a low rate star forming disc beneath the disc-like pseudo-bulge. CO emission is sensitive to relatively low-density molecular gas, making it an excellent tracer of the bulk molecular material in star-forming regions. It is particularly useful for mapping the overall distribution and dynamics of molecular gas in galaxies. In J2345-0449 The CO molecular gas is located in an annular ring as shown in Fig. 14. The dimensions of the molecular gas ring are kpc and kpc (projected) at the inner and outer (truncated) edge of the molecular disc, respectively, and using the deprojected rotation velocities, Keplerian values km s-1 and km s-1 are measured at these radii, respectively. The kinematic center of CO molecular gas ring is located at position (J2000) RA= 23h45m32.708s, Dec = -04d49m25.42s, coincident with a faint ( mJy) radio continuum point source, presumably the AGN. This position is also within 0.5 arcsec of radio core detected on the GMRT 323 MHz and VLA FIRST 1.4 GHz maps. The position angle of CO annular ring on the sky is degree, and the inclination angle degree, the same values previously also found for the stellar component by Bagchi et al. (2014). This is another indication that most of the molecular gas resides in the disc, and as measured from the CO line Doppler mapping, rotates largely unperturbed, in a highly Keplerian fashion within the gravitational potential of the host galaxy. Moreover, no kinematic signature of rotation is detected along the minor axis, which is clear evidence for a planar, rotating molecular disc (see Fig.14).
Next we investigate the spatial correlation of CO emission ring and the central pseudo bulge component. As shown in Fig. 14, strikingly, no 12CO(J = 1-0) line emission is detected in the central arcsec from the nucleus, corresponding to a diameter of 4.2 kpc × 2.2 kpc (projected) at a flux limit of rms Jy beam-1. Summing the CO line flux over all regions where CO line FWHM > 70 km s-1 show that a total of cold gas mass is being stirred up, possibly by interactions with the compact radio nucleus (AGN) and inner jet, corresponding to about 75 per cent of the total molecular gas mass in the ring (Nesvadba et al., 2021). Here we find that the spatial extent of CO non-emission/depleted zone (Fig.14) is about 2 times the effective diameter of the stellar bulge in the HST B and I band images, which is kpc, close to the bulge size measured by Bagchi et al. (2014) from SDSS data. Therefore, we conclude that the cold molecular gas is only associated with the inner disc of J2345-0449, while it clearly avoids the central pseudo-bulge where the radio AGN is located at the very center. This reduced recent star formation in the innermost regions of the galaxy could be a manifestation of the growth of the bulge itself. Alternatively this could be a consequence of inside-out quenching of star formation as a result of supernova and/or AGN feedback which could inject energy to gravitationally unbind star forming gas from the galaxy’s center (Nelson et al., 2021); a process most effective in massive galaxies hosting SMBHs of masses accreting at low Eddington rates (Terrazas et al., 2020). In J2345-0449 we may be seeing observational signs of a similar AGN/SN feedback process at work, but more detailed investigations of cold molecular gas in future will provide a definite answer.
Recently Dabhade et al. (2020c) reported observations of 12CO(J = 1-0) and 12CO(J = 2-1) transition emission lines from the repository of cold molecular gas present in this and other giant radio galaxies (GRGs) using the IRAM 30m telescope. Their global CO abundance analysis (single dish observations) suggest that quenching does not require the total removal or depletion of molecular gas, as many quenching models have previously assumed. Moreover, cold molecular gas in the central region may comprise the reservoir for fueling the central supermassive black hole. In J2345-0449 the molecular gas (H2) mass was estimated at , much smaller than the galaxy’s stellar mass, yet is a significant repository of H2 which can seed new stars. On the other hand, the galaxy has a very long global molecular gas depletion time Gy, for and . This seems an extreme value even for spirals, and it is the highest of all Giant Radio Galaxies studied so far (Dabhade et al., 2020c). But what is peculiar about this is that whereas this galaxy contains a massive reservoir of cold molecular gas and dust (, Table 6), it is currently forming new stars at very small rate. The exact cause of it is still unclear but a good possibility is that this could be related to suppression of SF due to strong AGN feedback (Nesvadba et al., 2021).
5.6 The Baryon Landscape, Dark Matter Halo and the ‘Missing Baryon’ Budget
How did such ultra massive galaxies came to be? and what were the progenitors of these giants in the early universe? are the key open questions. Recent detection of a hidden (in UV to near-IR bands) population of massive galaxies at detected by ALMA in sub-mm bands (Wang et al., 2019) has provided new insights about origin of these elusive galaxies. Such dust laden galaxies contribute a total star-formation-rate density ten times larger than that of equivalently massive ultraviolet-bright galaxies at > 3. Forming within the most massive dark matter haloes of mass , they probably are the progenitors of the present-day massive galaxies. Moreover JWST has recently found some extremely massive (stellar mass ) galaxies existing even at very early epochs (; Labbé et al. (2023)). The infra-red and sub-mm detection of an unexpected large population of massive, evolved galaxies in the early Universe suggests that our present theories of massive-galaxy formation may require substantial revision. With JWST Carnall et al. (2023) found a similarly massive galaxy, which formed most of its stellar mass in a remarkably short interval of Myr before this galaxy quenched its star formation activity at , possibly via AGN feedback, when the Universe was about 800 million years old. They suggest that such galaxies are both likely descendents of the highest-z sub-mm galaxies and quasars, and probably the progenitors for the dense, ancient cores of the most massive local galaxies.
Much can be learned by exploring the warm/hot gaseous coronae around massive disc galaxies lacking prominent bulges. Contrary to the bulged systems these galaxies are likely to be much more direct tracers of the galaxy formation process governed by ‘secular’ (isolated) disc based mechanisms, since they have not undergone major mergers (Kormendy & Kennicutt, 2004) which drastically alters them. On the other hand, due to their extreme stellar and halo mass and possible AGN feedback of the central SMBHs the baryons in these galaxies may reside in unusual physical states that are strongly affected by these processes and may participate in much less star formation in the disc. Moreover, since the hot halo mass and thermal X-ray emission of baryons both scales with galaxy mass, it is highly informative to observe deeply the most massive spiral galaxies in soft X-rays to achieve a detectable signal and make a good study.
Indeed, in J2345-0449 XMM-Newton has robustly detected a giant halo of diffuse, soft X-ray emission gas ( KeV) which surrounds the galaxy and extends out to a minimum radius of 160 kpc (Mirakhor et al., 2021), which is roughly 35 per cent of the virial radius and times the exponential disc half light radius. Chandra observation also has found the halo, but less extended due to reduced detection sensitivity of the telescope (Walker et al., 2015). The baryonic mass of the hot gas in the halo is very high, about 3 times the total stellar mass of the galaxy (Table 3). This remarkable detection is currently limited by the detection capability of X-ray telescopes, yet it is the largest repository of a hot baryonic gaseous atmosphere observed in any single galaxy so far. Interestingly, the X-ray emitting gaseous halo is not spherically distributed but forms a flattened pancake elongated parallel to the host galaxy’s stellar disc (Mirakhor et al., 2021).
What could be the reason for this elongated shape? The 3-dimensional shape of dark matter halos around galaxies and galaxy groups or clusters is a frontier topic of ongoing research, but theoretical models (simulations; e.g. Chua et al. (2019); Emami et al. (2021); Baptista et al. (2023)) and limited observations suggest (Buote et al., 2002) that they are not perfectly spherical but assume triaxial spheroidal geometry, with long axis preferably oriented parallel to longer axis of the central galaxy or group. This is consequence of the fact that the gravitational force that shapes dark matter halos are not perfectly symmetrical, which governs their 3-dimensional equilibrium figures in a rotating frame, much like a Jacobi ellipsoid. A Jacobi ellipsoid is a triaxial ellipsoid that is in hydrostatic equilibrium under the influence of its own gravity and rotation. This means that the pressure inside the ellipsoid is everywhere equal to the gravitational force acting on a small volume of fluid (Chandrasekhar, 1969). Since the X-ray halo gas is essentially collisionless and likely to be bound in the gravitational potential of dark matter, it too will acquire a similar triaxial shape, if not disturbed by major mergers and tidal forces. This is a simple model but this makes the X-ray halos around massive galaxies remarkably accurate tracers of dark matter as the DM halo shape is a result of initial density field anisotropy and the subsequent halo assembly history (cold filament accretion and mergers), and the galaxy halo shape statistics can be used to test and validate the CDM structure formation paradigm. Future deep X-ray observations and theoretical modelling will reveal if the X-ray halo around J2345-0449 could be shaped by this mechanism, directly related to its currently unknown formation history.
Alternatively, Walker et al. (2015) suggest that pancake like shape of the X-ray halo in J2345-049 possibly is due to feedback by the energetic radio jets which might have disrupted or expelled hot gas from an extended region ( kpc) above and below the disc plane. Although still unproven, If confirmed by more observations and detailed modelling, this will be an extremely unusual scenario for a spiral galaxy environment as radio jet-mode feedback is commonly seen in AGN hosted by Brightest Cluster Galaxies (BCG) at the centers of galaxy clusters with a cooling core, but is extremely rare to observe in an isolated spiral galaxy like J2345-0449 (McNamara & Nulsen, 2012; Fabian, 2012).
A third possibility is that the hot X-ray halo gas could have been lifted up and heated up by hot stellar winds ejected by multiple supernovae from high SFR in the past, which has now got suppressed due to either the AGN feedback or a morphological quenching by the massive DM halo (Martig et al., 2009). Such a massive DM halo is also needed to stabilize the extremely fast rotating stellar disc. On the other hand, we find that a massive stellar spheroid/bulge formed by mergers, which is most effective in morphological quenching, is definitely not present in J2345-0449, but an extended ( kpc radius), hot X-ray halo is observable (Walker et al., 2015; Mirakhor et al., 2021).
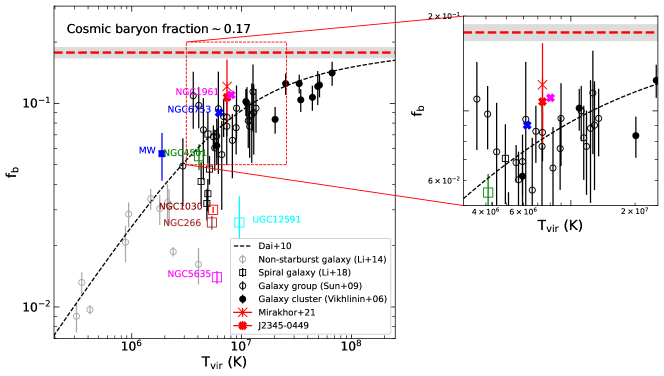
It would prove much informative if the X-ray halo in J2345-0449 is the signpost of initially cold gas that has fallen into the halo of the massive galaxy, and has been shock heated and virialized during galaxy structure formation. This can be shown as follows:
(1) The gas temperature of the X-ray halo is at the right order of magnitude for being near to the virial temperature of the binding gravitational potential:
| (6) |
which comes to K (or 0.55 keV) for J2345-0449 for a circular rotation speed of . This is about the same temperature as what the Chandra and XMM has measured in the hot halo region (Walker et al., 2015; Mirakhor et al., 2021).
(2) If not a coincidence, this implies that gas in X-ray emitting halo is in viral equilibrium with a massive dark matter halo of total mass as suggested by Dai et al. (2012). This in turn implies the halo gas is possibly shock heated after having been accreted from the cold filaments of cosmic-web beyond the virial radius at kpc, rather than being recycled from the disc. The thermal and metal line cooling time of the quasi-hydrostatic X-ray halo gas is large, in the range Gyr for material within the cooling radius, and has the effective cooling rate of (Fukugita & Peebles, 2006; Dai et al., 2012; Kelly et al., 2021). The average estimated cooling time is much larger than the free-fall time, and therefore, it would require more than a Hubble time to build the entire stellar mass of galaxy by condensation of cooling gas from halo, thus disfavoring such a possibility. The dynamical state of the circum-galactic gas would be revealed in future sensitive spectroscopic observations from the detection of the ‘Warm Hot Intergalactic Medium (WHIM)’ in the soft X-ray lines at K, and via the detection of even cooler gas through the UV/EUV lines of metals (Simionescu et al., 2021; Nicastro et al., 2021).
The XMM-Newton detection of an extended, luminous, soft Xray halo around the galaxy J2345-0449 is a prominent sign-post of so called ‘missing baryons’ in such massive galactic halos. All prominent galaxy formation models predict such gaseous circum-galactic halos (White & Rees, 1978; White & Frenk, 1991; Fukugita & Peebles, 2006; Sommer-Larsen, 2006). The entire baryonic mass contained in the X-ray halo of J2345-0449 implies a baryon fraction near the cosmic average (Komatsu et al. (2009); Dunkley et al. (2009)), which is very high for a galaxy. In J2345-0449 the baryon to DM mass density ratio appears to approach the cosmic value, if the baryonic mass is extended upto the virial radius where the dark matter mass dominates. Such a massive DM halo is also needed to gravitationally stabilize the extremely fast rotating disc. This finding does not support the possibility that in most massive galaxies in universe the baryon shortfall is due to the fact that majority of cosmic baryons never ‘condensed ’ onto the DM halo and thus are invisible. On the contrary, in J2345-0449 we find that these baryons actually may reside in the circum-galactic halo and thus it is a very important new result.
In Table 3 we have shown the masses of different baryonic components in the galaxy disc, which are; the stellar mass, mass of the cold molecular (H2 and He) gas, and the interstellar dust mass. As typically done in many studies, we assume that the total disc gas mass is the sum of the atomic and molecular gas masses, corrected for the Helium contribution by multiplying by a factor of 1.36, i.e. . We have neglected atomic hydrogen mass M(HI), as it is not measured and usually is a small fraction of total gas mass. In addition we also list the estimated mass of hot x-ray halo gas, as detected in XMM-Newton observations and the model fitted total halo mass (dark matter plus baryons) upto the virial radius, both as determined by Mirakhor et al. (2021). The
Combining all the baryon masses, we have determined a total baryon fraction of , close to the estimate reported by Mirakhor et al. (2021). Both these estimates are close but lower than cosmological baryon fraction of (Komatsu et al., 2009; Dunkley et al., 2009). This is shown in Fig.15 where galaxy J2345-0449 with a baryon fraction of (within the error bar of Mirakhor et al. 2021 who provided as upto the virial radius), falls above the nearby region of the broken power-law model surrounded by a few other highly massive spiral galaxies and galaxy groups. Note that, amongst the labelled massive spiral galaxies in the graph, we have X-ray detection in the galactic halo for the objects J2345-0449, NGC 1961, NGC 6753, NGC 266 and UGC 12591 and in effect their hot gas mass upto the virial radius are also included in the total baryon fraction.
To further explore implications of the above findings, we express the star formation efficiency of a galaxy, , which can be expressed by (Posti et al., 2019),
| (7) |
with if all baryons are converted to stars. Now for J2345-0449 if we take virial mass as calculated in Walker et al. (2015); Mirakhor et al. (2021) and our estimated mean stellar mass , we obtain , taking the universal cosmic baryon fraction . This shows that J2345-0449 is able to convert only about per cent of all available cosmic baryons to stars. Another indicator of remarkably low efficiency of star formation in this galaxy is it’s very large gas depletion time, given by Gy, taking and . On the contrary, the sample of most massive spirals with of Posti et al. (2019) yields which shows their larger efficiency of star formation and their stellar baryon fraction is approaching the cosmological baryon fraction. Although a very interesting result, it is still too early to tell if these unusual massive spirals of Posti et al. (2019) have experienced the same evolutionary and star formation history as the majority of normal spirals. On the contrary, J2345-0449 appears to be very different because of it’s very low , a large repository of potentially viable molecular gas, and because most of the ‘missing’ cosmic baryons in this galaxy appear to reside within the dark matter halo inside the virial radius in a phase of warm/hot low temperature ( keV) gas, but unable to turn into stars.
These baryons may enable galaxies to continue forming stars steadily for long periods of time and account for the elusive ‘missing baryons’ in galaxies in the local universe. For some of the most massive galaxies in local Universe, like J2345-0449, UGC 12591, NGC 1961 etc. we find just the opposite. This finding is broadly consistent with the constraints from abundance matching techniques to determine the typical galaxy stellar mass at a given halo mass. The simulations show that peak efficiency of is always fairly quite low, by reaching a peak of about per cent for typical galaxies with halo mass . Beyond the peak declines rapidly to per cent for ultra high mass (Behroozi et al., 2010, 2019; Moster et al., 2013). It is believed that AGN feedback is one of the main ingredients required to bring this decline in SFR, e.g. (Di Matteo et al., 2005; Beckmann et al., 2017) and a cut off in the total stellar mass.
Next we compare the 0.5-2 keV band X-ray luminosity () of all known massive spiral galaxies with detected soft X-ray halos. We find that at the luminosity of J2345-0449 is highest (Mirakhor et al., 2021), about 10 times that of UGC 12591 (Dai et al., 2012), NGC 6753 (Bregman et al., 2018; Bogdán et al., 2013) and significantly higher than that of NGC 1961 (Anderson et al., 2016). The metal abundance of J2345-0449 halo is low at , similar to those found for UGC 12591, NGC 1961 and NGC 6753. This metallicity is consistent with baryon deficit, low metallicity coronal gas surrounding in the halo of massive galaxies shown in EAGLE hydro simulations (Kelly et al., 2021; Schaye et al., 2015). Although the halo mass of UGC 12591, NGC 1961, NGC 6753 and J2345-0449 are similar, the higher X-ray luminosity and the largest extent of J2345-0449 corona (about 160 kpc, or 35 per cent of ) is very intriguing which needs better understanding. We point out that J2345-0449 is the only one of those four galaxies which hosts large scale radio jets. Therefore, one may infer it is a consequence of powerful Mpc scale radio jets and past supernovae activity in this galaxy, heating and expelling the inner baryons upto a larger radius and thus preventing gas cooling in the halo; although a very suggestive possibility, more observational proof is needed to robustly demonstrate this scenario.
| Parameter | Symbol | Value (in ) |
|---|---|---|
| Stellar mass (this work) | ||
| Stellar mass (Walker et al. (2015)) | ||
| Molecular hydrogen mass | ||
| Total gas mass (Including He) | ||
| Dust mass (this work) | ||
| Hot halo gas mass upto 160 kpc radius | ||
| Hot halo gas mass upto virial radius | ||
| Total baryonic mass upto virial radius | ||
| Total halo mass (dark matter + baryons) | ||
| upto virial radius (450 kpc) | ||
| Baryon fraction (this work) | ||
| Baryon fraction (Mirakhor et al. (2021)) |
6 Summary and Conclusions
In the present work our research endeavour was directed on the bulge-disc components and stellar mass distribution in the fast rotating, highly massive spiral galaxy J2345-0449 showing unusual radio jets extending up to Mpc scale. Using the high-resolution multi wavelength HST observations and multi-parameter panchromatic SED fitting we obtained estimates of star formation rate, the total baryonic mass contained in stars and derived the warm dust properties, which were then connected to the cold molecular gas distribution based on previous ALMA and IRAM Carbon Monoxide spectral line observations.
We confirm down to pc scale spatial resolution, that this spiral galaxy features a pseudo-bulge instead of a classical bulge. Search for non-axisymmetric structures in the AGN region revealed a small nuclear bar surrounded by a bright ring, forming a circumnuclear disc. This is consistent with the expectation as pseudo-bulges evolve from bars secularly. These have profound implications for how this galaxy formed and how the growth of it’s mass accreting SMBH happened in the past. Classical bulges form via more violent processes such as hierarchical clustering, whereas the pseudo-bulges, seem to be still evolving, more likely as a result of their host galaxies’ slow internal evolution, which involves disc instabilities and angular momentum transfer. One important conclusion from this study is that the galactic disc and its SMBH in J2345-0449 may have evolved together quietly (seculary), and have not experienced the upheaval of some recent major merger events. This suggestion is strengthened by the absence of any tidal debris (such as tails, shells, or faint plumes), the location of the galaxy in an isolated galactic environment having no nearby massive galactic neighbors, and by the fact that the galaxy has highly-symmetric spiral arms within a rotationally supported stellar disc and an inner, highly organized Keplerian disc of cold molecular gas.
Our detailed multi wavelength study of potential star forming gas reveal that, while hot gas cools down in the massive extended halo of this galaxy, new stars do not form in the center because of possible feedback from the central accreting supermassive black hole with powerful radio jets, which heats up the gas again or pushes it beyond the galaxy’s reach. For most of the galaxies like J2345-0449 and a few others observed, the activity of the black hole seems to have put an end or drastically reduced star formation but has not yet succeeded in clearing them of all their cold gas.
Much more detailed followup work is required and will be taken up in later studies. The future studies will be directed to understanding better how have such extremely massive, rotational supported disc galaxies have formed and are evolving, as it depends on non-linear baryonic physics and complex interaction with the dark matter halos. Obviously, the most striking property that sets J2345-0449 apart from nearly all other spiral galaxies is its large mass and unusual radio loudness, resulting in highly efficient ejection of relativistic jets on Mega parsec scales, possibly resulting from an unusual growth of a supermassive black hole in a bulge-less galaxy. The extreme rarity of such galaxies implies that whatever physical process had created such huge radio jets in J2345-0449 must be very difficult to realize and maintain for long periods of time in most other spiral/disc galaxies. Thus, an important question is; What could be responsible for the efficient fueling and sustained collimated jet ejection activity in J2345-0449? The answer requires very detailed knowledge of the properties of its central black hole engine, i.e., its mass, spin, and the nature of its accretion flow, namely the mass accretion rate and the magnetic field topology of the inner regions of accretion disc, most of which is clearly lacking at the present moment.
In summary, our study sheds light on the unique characteristics of J2345-0449 and also raises new questions about the interplay between galactic structure, star formation, and the activity of the central supermassive black hole. Future investigations will likely focus on obtaining more detailed information to unravel the complexities of this intriguing galactic system.
| F160W (H-band) | F438W (B-band) | F814W (I-band) | |||
| Model A | |||||
| (Sérsic + Exponential disc) | Sérsic mag | ||||
| Sérsic (kpc) | |||||
| Sérsic n | |||||
| Sérsic | |||||
| Sérsic pa | |||||
| Expdisc mag | |||||
| Expdisc scale radius (kpc) | |||||
| Expdisc | |||||
| Expdisc pa | |||||
| Reduced | 0.76 | 1.34 | 1.89 | ||
| Model B | |||||
| (Sérsic + Exponential disc + PSF) | Sérsic mag | ||||
| Sérsic (kpc) | |||||
| Sérsic n | |||||
| Sérsic | |||||
| Sérsic pa | |||||
| Expdisc mag | |||||
| Expdisc scale radius (kpc) | |||||
| Expdisc | |||||
| Expdisc pa | |||||
| PSF mag | |||||
| Reduced | 0.97 | 1.326 | 1.442 | ||
| Model C | |||||
| (Sérsic1 + Sérsic2 + | |||||
| Exponential disc + PSF) | Sérsic 1 mag | ||||
| Sérsic 1 (kpc) | |||||
| Sérsic 1 n | |||||
| Sérsic 1 | |||||
| Sérsic 1 pa | |||||
| Sérsic 2 mag | |||||
| Sérsic 2 (kpc) | |||||
| Sérsic 2 n | |||||
| Sérsic 2 | |||||
| Sérsic 2 pa | |||||
| Expdisc mag | |||||
| Expdisc scale radius (kpc) | |||||
| Expdisc | |||||
| Expdisc pa | |||||
| PSF mag | |||||
| Reduced | 0.85 | 1.314 | 1.392 |
| Telescope and | Wavelength () | Flux | Error |
|---|---|---|---|
| channel/detector | (µm) | (mJy) | (mJy) |
| GALEX/FUV | 0.15386 | 0.078 | 0.001 |
| GALEX/NUV | 0.23157 | 0.127 | 0.002 |
| SDSS/u | 0.3551 | 0.52 | 0.02 |
| SDSS/g | 0.4686 | 3.53 | 0.20 |
| SDSS/r | 0.6165 | 5.55 | 0.21 |
| SDSS/i | 0.7481 | 7.31 | 0.17 |
| SDSS/z | 0.8931 | 8.41 | 0.62 |
| 2MASS/J | 1.2500 | 3.34 | 0.52 |
| 2MASS/H | 1.6500 | 4.16 | 0.89 |
| 2MASS/K | 2.17 | 4.31 | 0.67 |
| WISE/W1 | 3.4 | 5.29 | 0.22 |
| WISE/W2 | 4.6 | 3.22 | 0.13 |
| WISE/W3 | 12 | 7.87 | 0.51 |
| WISE/W4 | 24 | 11.71 | 2.77 |
| HERSCHEL/SPIRE | 250 | 352.7 | 17.8 |
| HERSCHEL/SPIRE | 350 | 196.7 | 19.5 |
| HERSCHEL/SPIRE | 500 | 77.3 | 21.4 |
| Best fit parameters | Value |
|---|---|
| sSFR () | |
| ( ) | |
| ( ) | |
| ( ) | |
| SFR ( ) | |
| (K) | |
| (K) | |
| Fitted Parameter | |||
| () | |||
| ( ) | |||
| () | |||
| SFR () | 2.38 | 2.19 | 1.88 |
| 1.53 | 1.53 | 1.71 | |
| 5.10 | 5.63 | 5.86 |
Acknowledgements
JB acknowledges the support from Department of Physics and Electronics, CHRIST (Deemed to be University), Bangalore. SR gratefully acknowledges the support from IUCAA under the student visiting program and funding by Indian Space Research Organisation (ISRO) under ’AstroSat Data Utilization’ project. SR is also supported by Department of Physics and Electronics, CHRIST (Deemed to be University), Bangalore. SD acknowledge support from the Indian Space Research Organisation (ISRO) funding under project PAO/REF/CP167. LCH was supported by the National Science Foundation of China (11721303, 11991052, 12011540375, 12233001), the National Key R&D Program of China (2022YFF0503401), and the China Manned Space Project (CMS-CSST-2021-A04, CMS-CSST-2021-A06). This research has made use of the data from HST Archive. Part of the reported results is based on observations made with the NASA/ESA Hubble Space Telescope, obtained from the Data Archive at the Space Telescope Science Institute, which is operated by the Association of Universities for Research in Astronomy, Inc., under NASA contract NAS 5-26555. This research has made use of NASA’s Astrophysics Data System, and of the NASA/IPAC Extragalactic Database (NED) which is operated by the Jet Propulsion Laboratory, California Institute of Technology, under contract with the National Aeronautics and Space Administration. We have used images and results from SDSS and funding for SDSS has been provided by the Alfred P. Sloan Foundation, the participating institutions, the National Science Founda- tion, and the U.S. Department of Energy’s Office of Science. We thank the Ned Wright’s Javascript Cosmology Calculator for several cosmological calculations (Wright (2006)).
Data Availability
The HST data used in this paper are publicly available at the Hubble Legacy Archive (https://hla.stsci.edu) and the Mikulski Archive for Space Telescopes (https://archive.stsci.edu). All the retrieved data used in the analysis are tabulated in Table. 1 and Table. 5 which are publicly available. The GALAFIT code used in photo metric bulge-disc modelling and SED fitting routines MAGPHSY and CIGALE are publicly available at https://users.obs.carnegiescience.edu/peng/work/galfit/galfit.html, http://www.iap.fr/magphys/, and https://cigale.lam.fr. For any further help the authors can be contacted.
References
- Agazie et al. (2023) Agazie G., et al., 2023, ApJ, 952, L37
- Ahumada et al. (2020) Ahumada R., et al., 2020, ApJS, 249, 3
- Alexander & Hickox (2012) Alexander D. M., Hickox R. C., 2012, New Astron. Rev., 56, 93
- Anderson & Bregman (2011) Anderson M. E., Bregman J. N., 2011, ApJ, 737, 22
- Anderson et al. (2016) Anderson M. E., Churazov E., Bregman J. N., 2016, MNRAS, 455, 227
- Bagchi et al. (2014) Bagchi J., et al., 2014, ApJ, 788, 174
- Baptista et al. (2023) Baptista J., et al., 2023, ApJ, 958, 44
- Bardeen & Petterson (1975) Bardeen J. M., Petterson J. A., 1975, ApJ, 195, L65
- Beckmann et al. (2017) Beckmann R. S., et al., 2017, MNRAS, 472, 949
- Behroozi et al. (2010) Behroozi P. S., Conroy C., Wechsler R. H., 2010, ApJ, 717, 379
- Behroozi et al. (2019) Behroozi P., Wechsler R. H., Hearin A. P., Conroy C., 2019, MNRAS, 488, 3143
- Best & Heckman (2012) Best P. N., Heckman T. M., 2012, MNRAS, 421, 1569
- Bianchi et al. (2011) Bianchi L., Herald J., Efremova B., Girardi L., Zabot A., Marigo P., Conti A., Shiao B., 2011, Ap&SS, 335, 161
- Bîrzan et al. (2004) Bîrzan L., Rafferty D. A., McNamara B. R., Wise M. W., Nulsen P. E. J., 2004, ApJ, 607, 800
- Blandford & Znajek (1977) Blandford R. D., Znajek R. L., 1977, MNRAS, 179, 433
- Bluck et al. (2022) Bluck A. F. L., Maiolino R., Brownson S., Conselice C. J., Ellison S. L., Piotrowska J. M., Thorp M. D., 2022, A&A, 659, A160
- Bogdán et al. (2013) Bogdán Á., et al., 2013, ApJ, 772, 97
- Boquien et al. (2019) Boquien M., Burgarella D., Roehlly Y., Buat V., Ciesla L., Corre D., Inoue A. K., Salas H., 2019, A&A, 622, A103
- Bournaud & Combes (2002) Bournaud F., Combes F., 2002, A&A, 392, 83
- Bournaud et al. (2005) Bournaud F., Jog C. J., Combes F., 2005, A&A, 437, 69
- Boylan-Kolchin et al. (2009) Boylan-Kolchin M., Springel V., White S. D. M., Jenkins A., Lemson G., 2009, MNRAS, 398, 1150
- Bregman et al. (2018) Bregman J. N., Anderson M. E., Miller M. J., Hodges-Kluck E., Dai X., Li J.-T., Li Y., Qu Z., 2018, ApJ, 862, 3
- Breiding et al. (2024) Breiding P., et al., 2024, ApJ, 963, 91
- Bridle & Perley (1984) Bridle A. H., Perley R. A., 1984, ARA&A, 22, 319
- Brinchmann et al. (2004) Brinchmann J., Charlot S., White S. D. M., Tremonti C., Kauffmann G., Heckman T., Brinkmann J., 2004, MNRAS, 351, 1151
- Buote et al. (2002) Buote D. A., Jeltema T. E., Canizares C. R., Garmire G. P., 2002, ApJ, 577, 183
- Buta & Combes (1996) Buta R., Combes F., 1996, Fundamentals Cosmic Phys., 17, 95
- Buttiglione et al. (2010) Buttiglione S., Capetti A., Celotti A., Axon D. J., Chiaberge M., Macchetto F. D., Sparks W. B., 2010, A&A, 509, A6
- Carnall et al. (2023) Carnall A. C., et al., 2023, Nature, 619, 716
- Carraro et al. (2020) Carraro R., et al., 2020, A&A, 642, A65
- Carson et al. (2015) Carson D. J., Barth A. J., Seth A. C., den Brok M., Cappellari M., Greene J. E., Ho L. C., Neumayer N., 2015, AJ, 149, 170
- Chandrasekhar (1969) Chandrasekhar S., 1969, Ellipsoidal figures of equilibrium, Publisher: Yale University Press, New Haven. Vol. 10
- Chua et al. (2019) Chua K. T. E., Pillepich A., Vogelsberger M., Hernquist L., 2019, MNRAS, 484, 476
- Churazov et al. (2002) Churazov E., Sunyaev R., Forman W., Böhringer H., 2002, MNRAS, 332, 729
- Ciotti & Bertin (1999) Ciotti L., Bertin G., 1999, A&A, 352, 447
- Combes et al. (2014) Combes F., et al., 2014, A&A, 565, A97
- D’Eugenio et al. (2021) D’Eugenio C., et al., 2021, A&A, 653, A32
- Dabhade et al. (2020a) Dabhade P., et al., 2020a, A&A, 635, A5
- Dabhade et al. (2020b) Dabhade P., et al., 2020b, A&A, 642, A153
- Dabhade et al. (2020c) Dabhade P., Combes F., Salomé P., Bagchi J., Mahato M., 2020c, A&A, 643, A111
- Dabhade et al. (2023) Dabhade P., Saikia D. J., Mahato M., 2023, Journal of Astrophysics and Astronomy, 44, 13
- Dai et al. (2010) Dai X., Bregman J. N., Kochanek C. S., Rasia E., 2010, ApJ, 719, 119
- Dai et al. (2012) Dai X., Anderson M. E., Bregman J. N., Miller J. M., 2012, ApJ, 755, 107
- Dhiwar et al. (2023) Dhiwar S., Saha K., Dekel A., Paswan A., Pandey D., Cortesi A., Pandge M., 2023, MNRAS, 518, 4943
- Di Matteo et al. (2005) Di Matteo T., Springel V., Hernquist L., 2005, Nature, 433, 604
- Donahue & Voit (2022) Donahue M., Voit G. M., 2022, Phys. Rep., 973, 1
- Drevet Mulard et al. (2023) Drevet Mulard M., et al., 2023, A&A, 676, A35
- Dunkley et al. (2009) Dunkley J., et al., 2009, ApJS, 180, 306
- EPTA Collaboration et al. (2023) EPTA Collaboration et al., 2023, A&A, 678, A50
- Elbaz et al. (2007) Elbaz D., et al., 2007, A&A, 468, 33
- Emami et al. (2021) Emami R., et al., 2021, ApJ, 913, 36
- Event Horizon Telescope Collaboration et al. (2021) Event Horizon Telescope Collaboration et al., 2021, ApJ, 910, L13
- Event Horizon Telescope Collaboration et al. (2024) Event Horizon Telescope Collaboration et al., 2024, ApJ, 964, L25
- Fabian (2012) Fabian A. C., 2012, ARA&A, 50, 455
- Fanaroff & Riley (1974) Fanaroff B. L., Riley J. M., 1974, MNRAS, 167, 31P
- Fisher & Drory (2008) Fisher D. B., Drory N., 2008, AJ, 136, 773
- Fisher & Drory (2011) Fisher D. B., Drory N., 2011, ApJ, 733, L47
- Freudling (1993) Freudling W., 1993, in European Southern Observatory Conference and Workshop Proceedings. p. 27
- Friedli & Martinet (1993) Friedli D., Martinet L., 1993, A&A, 277, 27
- Fukugita & Peebles (2006) Fukugita M., Peebles P. J. E., 2006, ApJ, 639, 590
- Gadotti (2009) Gadotti D. A., 2009, MNRAS, 393, 1531
- Gebhardt et al. (2000) Gebhardt K., et al., 2000, ApJ, 539, L13
- Graham (2007) Graham A. W., 2007, MNRAS, 379, 711
- Graham (2016) Graham A. W., 2016, in Laurikainen E., Peletier R., Gadotti D., eds, Astrophysics and Space Science Library Vol. 418, Galactic Bulges. p. 263 (arXiv:1501.02937), doi:10.1007/978-3-319-19378-6_11
- Graham et al. (2011) Graham A. W., Onken C. A., Athanassoula E., Combes F., 2011, MNRAS, 412, 2211
- Gültekin et al. (2009a) Gültekin K., et al., 2009a, ApJ, 698, 198
- Gültekin et al. (2009b) Gültekin K., Cackett E. M., Miller J. M., Di Matteo T., Markoff S., Richstone D. O., 2009b, ApJ, 706, 404
- Hardcastle & Croston (2020) Hardcastle M. J., Croston J. H., 2020, New Astron. Rev., 88, 101539
- Häring & Rix (2004) Häring N., Rix H.-W., 2004, ApJ, 604, L89
- Harrison (2017) Harrison C. M., 2017, Nature Astronomy, 1, 0165
- Heckman & Best (2014) Heckman T. M., Best P. N., 2014, ARA&A, 52, 589
- Heckman et al. (2004) Heckman T. M., Kauffmann G., Brinchmann J., Charlot S., Tremonti C., White S. D. M., 2004, ApJ, 613, 109
- Herschel Point Source Catalogue Working Group et al. (2020) Herschel Point Source Catalogue Working Group et al., 2020, VizieR Online Data Catalog: Herschel/PACS Point Source Catalogs (Herschel team, 2017), VizieR On-line Data Catalog: VIII/106. Originally published in: Herschel catalogs (2017)
- Ho (2002) Ho L. C., 2002, ApJ, 564, 120
- Hoopes et al. (2007) Hoopes C. G., et al., 2007, ApJS, 173, 441
- Hu (2008) Hu J., 2008, MNRAS, 386, 2242
- Izquierdo-Villalba et al. (2019) Izquierdo-Villalba D., Bonoli S., Spinoso D., Rosas-Guevara Y., Henriques B. M. B., Hernández-Monteagudo C., 2019, MNRAS, 488, 609
- Jedrzejewski (1987) Jedrzejewski R. I., 1987, MNRAS, 226, 747
- Kalinova et al. (2021) Kalinova V., Colombo D., Sánchez S. F., Kodaira K., García-Benito R., González Delgado R., Rosolowsky E., Lacerda E. A. D., 2021, A&A, 648, A64
- Kelly et al. (2021) Kelly A. J., Jenkins A., Frenk C. S., 2021, MNRAS, 502, 2934
- Kennicutt (1998) Kennicutt Robert C. J., 1998, ApJ, 498, 541
- King & Pounds (2015) King A., Pounds K., 2015, ARA&A, 53, 115
- Komatsu et al. (2009) Komatsu E., et al., 2009, ApJS, 180, 330
- Kormendy (2013) Kormendy J., 2013, in Falcón-Barroso J., Knapen J. H., eds, , Secular Evolution of Galaxies. p. 1, doi:10.48550/arXiv.1311.2609
- Kormendy & Ho (2013) Kormendy J., Ho L. C., 2013, ARA&A, 51, 511
- Kormendy & Kennicutt (2004) Kormendy J., Kennicutt Robert C. J., 2004, ARA&A, 42, 603
- Kormendy et al. (2011) Kormendy J., Bender R., Cornell M. E., 2011, Nature, 469, 374
- Labbé et al. (2023) Labbé I., et al., 2023, Nature, 616, 266
- Laha et al. (2021) Laha S., Reynolds C. S., Reeves J., Kriss G., Guainazzi M., Smith R., Veilleux S., Proga D., 2021, Nature Astronomy, 5, 13
- Larson (2003) Larson R. B., 2003, Reports on Progress in Physics, 66, 1651
- Lasker et al. (2008) Lasker B. M., et al., 2008, AJ, 136, 735
- Li et al. (2014) Li J.-T., Crain R. A., Wang Q. D., 2014, MNRAS, 440, 859
- Li et al. (2018) Li J.-T., Bregman J. N., Wang Q. D., Crain R. A., Anderson M. E., 2018, ApJ, 855, L24
- Lynden-Bell (1969) Lynden-Bell D., 1969, Nature, 223, 690
- MacDonald & Thorne (1982) MacDonald D., Thorne K. S., 1982, MNRAS, 198, 345
- Madau & Dickinson (2014) Madau P., Dickinson M., 2014, ARA&A, 52, 415
- Magorrian et al. (1998) Magorrian J., et al., 1998, AJ, 115, 2285
- Mahato et al. (2022) Mahato M., Dabhade P., Saikia D. J., Combes F., Bagchi J., Ho L. C., Raychaudhury S., 2022, A&A, 660, A59
- Marconi & Hunt (2003) Marconi A., Hunt L. K., 2003, ApJ, 589, L21
- Martig et al. (2009) Martig M., Bournaud F., Teyssier R., Dekel A., 2009, ApJ, 707, 250
- Martín-Navarro et al. (2018) Martín-Navarro I., Brodie J. P., Romanowsky A. J., Ruiz-Lara T., van de Ven G., 2018, Nature, 553, 307
- Matthews et al. (1964) Matthews T. A., Morgan W. W., Schmidt M., 1964, ApJ, 140, 35
- McLure et al. (2004) McLure R. J., Willott C. J., Jarvis M. J., Rawlings S., Hill G. J., Mitchell E., Dunlop J. S., Wold M., 2004, MNRAS, 351, 347
- McNamara & Nulsen (2012) McNamara B. R., Nulsen P. E. J., 2012, New Journal of Physics, 14, 055023
- Miller & Bregman (2015) Miller M. J., Bregman J. N., 2015, ApJ, 800, 14
- Mirakhor et al. (2021) Mirakhor M. S., et al., 2021, MNRAS, 500, 2503
- Morganti (2017) Morganti R., 2017, Frontiers in Astronomy and Space Sciences, 4, 42
- Moster et al. (2013) Moster B. P., Naab T., White S. D. M., 2013, MNRAS, 428, 3121
- Narayan & Yi (1994) Narayan R., Yi I., 1994, ApJ, 428, L13
- Nelson et al. (2021) Nelson E. J., et al., 2021, MNRAS, 508, 219
- Nesvadba et al. (2021) Nesvadba N. P. H., et al., 2021, A&A, 654, A8
- Nicastro et al. (2021) Nicastro F., et al., 2021, Experimental Astronomy, 51, 1013
- Noll et al. (2009) Noll S., Burgarella D., Giovannoli E., Buat V., Marcillac D., Muñoz-Mateos J. C., 2009, A&A, 507, 1793
- Ogle et al. (2019) Ogle P. M., Jarrett T., Lanz L., Cluver M., Alatalo K., Appleton P. N., Mazzarella J. M., 2019, ApJ, 884, L11
- Orellana et al. (2017) Orellana G., et al., 2017, A&A, 602, A68
- Peng et al. (2002) Peng C. Y., Ho L. C., Impey C. D., Rix H.-W., 2002, AJ, 124, 266
- Peng et al. (2010) Peng C. Y., Ho L. C., Impey C. D., Rix H.-W., 2010, AJ, 139, 2097
- Penna et al. (2013) Penna R. F., Narayan R., Sądowski A., 2013, MNRAS, 436, 3741
- Posti et al. (2019) Posti L., Fraternali F., Marasco A., 2019, A&A, 626, A56
- Ray et al. (2022) Ray S., Bagchi J., Dhiwar S., Pandge M. B., Mirakhor M., Walker S. A., Mukherjee D., 2022, MNRAS, 517, 99
- Ray et al. (2023) Ray S., Dhiwar S., Bagchi J., Pandge M. B., 2023, MNRAS,
- Reardon et al. (2023) Reardon D. J., et al., 2023, ApJ, 951, L6
- Renzini & Peng (2015) Renzini A., Peng Y.-j., 2015, ApJ, 801, L29
- Rowlands et al. (2012) Rowlands K., et al., 2012, MNRAS, 419, 2545
- Saha et al. (2021) Saha K., Dhiwar S., Barway S., Narayan C., Tandon S., 2021, Journal of Astrophysics and Astronomy, 42, 59
- Sahu et al. (2019) Sahu N., Graham A. W., Davis B. L., 2019, ApJ, 876, 155
- Saikia (2022) Saikia D. J., 2022, Journal of Astrophysics and Astronomy, 43, 97
- Salim et al. (2016) Salim S., et al., 2016, ApJS, 227, 2
- Schaye et al. (2015) Schaye J., et al., 2015, MNRAS, 446, 521
- Sérsic (1963) Sérsic J. L., 1963, Boletin de la Asociacion Argentina de Astronomia La Plata Argentina, 6, 41
- Sérsic (1968) Sérsic J. L., 1968, Atlas de Galaxias Australes (Cordoba: Observatorio Astronomico)
- Shankar et al. (2012) Shankar F., Marulli F., Mathur S., Bernardi M., Bournaud F., 2012, A&A, 540, A23
- Simionescu et al. (2021) Simionescu A., et al., 2021, Experimental Astronomy, 51, 1043
- Somerville & Davé (2015) Somerville R. S., Davé R., 2015, ARA&A, 53, 51
- Somerville et al. (2008) Somerville R. S., Hopkins P. F., Cox T. J., Robertson B. E., Hernquist L., 2008, MNRAS, 391, 481
- Sommer-Larsen (2006) Sommer-Larsen J., 2006, ApJ, 644, L1
- Spitzer (1956) Spitzer Lyman J., 1956, ApJ, 124, 20
- Springel et al. (2005) Springel V., et al., 2005, Nature, 435, 629
- Stanley et al. (2015) Stanley F., Harrison C. M., Alexander D. M., Swinbank A. M., Aird J. A., Del Moro A., Hickox R. C., Mullaney J. R., 2015, MNRAS, 453, 591
- Sun et al. (2009) Sun M., Voit G. M., Donahue M., Jones C., Forman W., Vikhlinin A., 2009, ApJ, 693, 1142
- Tadhunter et al. (1998) Tadhunter C. N., Morganti R., Robinson A., Dickson R., Villar-Martin M., Fosbury R. A. E., 1998, MNRAS, 298, 1035
- Terrazas et al. (2020) Terrazas B. A., et al., 2020, MNRAS, 493, 1888
- Tumlinson et al. (2017) Tumlinson J., Peeples M. S., Werk J. K., 2017, ARA&A, 55, 389
- Vikhlinin et al. (2006) Vikhlinin A., Kravtsov A., Forman W., Jones C., Markevitch M., Murray S. S., Van Speybroeck L., 2006, ApJ, 640, 691
- Vogelsberger et al. (2020) Vogelsberger M., Marinacci F., Torrey P., Puchwein E., 2020, Nature Reviews Physics, 2, 42
- Walker et al. (2015) Walker S. A., Bagchi J., Fabian A. C., 2015, MNRAS, 449, 3527
- Wang et al. (2019) Wang T., et al., 2019, Nature, 572, 211
- Wechsler & Tinker (2018) Wechsler R. H., Tinker J. L., 2018, ARA&A, 56, 435
- Weinzirl et al. (2009) Weinzirl T., Jogee S., Khochfar S., Burkert A., Kormendy J., 2009, ApJ, 696, 411
- White & Frenk (1991) White S. D. M., Frenk C. S., 1991, ApJ, 379, 52
- White & Rees (1978) White S. D. M., Rees M. J., 1978, MNRAS, 183, 341
- Wright (2006) Wright E. L., 2006, PASP, 118, 1711
- Wu et al. (2022) Wu Z., Ho L. C., Zhuang M.-Y., 2022, ApJ, 941, 95
- Xu et al. (2023) Xu H., et al., 2023, Research in Astronomy and Astrophysics, 23, 075024
- Yuan & Narayan (2014) Yuan F., Narayan R., 2014, ARA&A, 52, 529
- da Cunha et al. (2010) da Cunha E., Eminian C., Charlot S., Blaizot J., 2010, MNRAS, 403, 1894