Identification of SNPs in genomes using GRAMEP, an alignment-free method based on the Principle of Maximum Entropy
Advances in high throughput sequencing technologies provide a large number of genomes to be analyzed, so computational methodologies play a crucial role in analyzing and extracting knowledge from the data generated. Investigating genomic mutations is critical because of their impact on chromosomal evolution, genetic disorders, and diseases. It is common to adopt aligning sequences for analyzing genomic variations, however, this approach can be computationally expensive and potentially arbitrary in scenarios with large datasets. Here, we present a novel method for identifying single nucleotide polymorphisms (SNPs) in DNA sequences from assembled genomes. This method uses the principle of maximum entropy to select the most informative k-mers specific to the variant under investigation. The use of this informative k-mer set enables the detection of variant-specific mutations in comparison to a reference sequence. In addition, our method offers the possibility of classifying novel sequences with no need for organism-specific information. GRAMEP demonstrated high accuracy in both in silico simulations and analyses of real viral genomes, including Dengue, HIV, and SARS-CoV-2. Our approach maintained accurate SARS-CoV-2 variant identification while demonstrating a lower computational cost compared to the gold-standard statistical tools. The source code for this proof-of-concept implementation is freely available at https://github.com/omatheuspimenta/GRAMEP.
Introduction
The analysis of genomic sequences has been extensively studied to understand the diversity of species and their evolution (?, ?, ?, ?). With the advancement of sequencing technology, an ever-increasing amount of genomics data is being generated, opening up new perspectives for research on genetic variants in various organisms (?).
The genome of a species encoding the instructions required for the production of thousands of proteins and RNA molecules (?). This information is embedded within the DNA sequence, acting as a complex code. Mutations in nucleotides, the building blocks of DNA, can be linked to typos in this code, altering DNA sequences and consequently the sequence of RNA and proteins that are synthesized. These variations can have an impact on the organism’s phenotype, or its observable characteristics (?). Mutations that affect only a single base pair are known as single nucleotide variants (SNVs) or single nucleotide polymorphisms (SNPs). SNPs are akin to minute variations in the genetic code, and they can have varying effects on the organism. Some SNPs may be silent, causing no significant changes. Others may have a mild impact, while some can lead to drastic alterations in the phenotype, such as genetic diseases (?).
The occurrence of SNVs can lead to the simultaneous emergence of different phenotypes and result in intraspecific variations. In viruses, such as SARS-CoV-2, several mutations occurred during the 2019 pandemic. Depending on the specific mutations, these variations directly affected the transmission rate, mortality, and infectivity of the virus (?, ?, ?, ?, ?, ?, ?, ?, ?, ?, ?, ?, ?, ?). The study of genomic variation is a critical tool for diagnosing, preventing, and treating diseases. When applied to the study of viral diseases, genomic variation analysis is of great relevance for epidemiological purposes and controlling viral spread. Additionally, a systematic understanding of the evolution and taxonomy of various species, including viruses, relies on genomic variation research (?). Furthermore, organisms like the Dengue virus exhibit weak error correction mechanisms, leading to a high mutation rate and significant diversity within their variant populations (?).The presence of SNPs in viral genomes can have various consequences, such as changes resistance to antiviral drugs (e.g., Influenza virus and HCV) (?) or enabling immune system evasion (e.g., HIV-1) (?, ?). However, a high mutation rate can also lead to the extinction of certain variants (?, ?).
The precise identification of SNVs in a large number of sequences can be computationally challenging considering classical alignment methods. This complexity can reach exponential regarding the number and size of the analyzed sequences (?). Alignment-based approaches are widely used in biological sequence analysis, however, they face significant challenges when dealing with multi-genomic scale data because computational resources, such as runtime and memory, grow exponentially with the size of the sequences. For instance, considering the existence of gaps, the number of possible for two sequences with base pairs can reach an order of approximately , and the direct use of alignment-based approaches for large-scale analysis becomes impractical because of these combinatorial complexity (?, ?, ?). Even with the combination of computational and mathematical approaches, such as dynamic programming, which avoids unnecessary recalculations by reusing previously calculated results, classical methods of multiple sequence alignment suffer from the high computational complexity involved in their execution (?, ?). The multiple sequence alignment problem is NP-complete, which implies that finding an optimal solution in polynomial time is computationally infeasible for large amounts of data.
Usually the identification of variations in genomes is performed using multiple or pairwise alignment methods. Traditional alignment methods have some drawbacks that can affect the quality of the results. They need to define important parameters, such as substitution matrices and gap penalties, which can lead to subjective decisions. The determination of thresholds and other parameters varies depending on the type of sequence being analyzed, introducing an element of arbitrariness into the results (?). They assume collinearity between sequences, which is not always useful, especially in sequences with many mutations. They fail to capture the complexity and genetic diversity of viral sequences, which are highly mutable and undergo recombination events, horizontal gene transfer, duplication, and gene loss (?). Viral sequences are prone to various genetic events, including recombination, horizontal gene transfer, duplications, and gene losses. These events play a significant role in the genetic diversity observed among viral pathogens. The diversity and genetic complexity of viral sequences may not be fully captured by traditional alignment approaches, for instance (?).
In this context, heuristics and alignment-free methods emerge as a viable alternative, providing near-optimal solutions in feasible time and allowing scalability in the analysis of large volumes of data (?, ?). They offer a more efficient approach for the analysis of complete genomes, with lower computational complexity, which are achieved by considering mathematical and computational concepts, such as calculus, information theory, statistics, physics, and linear algebra being more adaptable to different types of sequences, especially those with high mutation rates, such as those found in viruses (?, ?, ?). Alignment-free methods have applications in broad areas within computational biology, such as a study of viral diversity, identification of genes and regulatory regions, analysis of phylogeny and molecular evolution and detection of genetic variants associated with diseases (?, ?, ?, ?, ?, ?, ?, ?, ?, ?, ?, ?, ?, ?).
In light of this scenario, it is proposed a novel method leveraging the principle of maximum entropy to pinpoint the most informative deterministic regions unique to each species, clade, or sub-variant within an organism. These regions subsequently serve as features for training a robust biological sequence classification model. The proposed approach enables the identification of SNPs within the analyzed organism’s genome, providing scalability, allowing vertical expansion through increased hardware capacity or horizontal distribution across multiple processing nodes, ensuring its feasibility and effectiveness for extensive genomic analysis. Besides, GRAMEP (Genome vaRiation Analysis from the Maximum Entropy), an open proof-of-concept tool encompassing its key functionalities in genome analysis. These functionalities include classification, mutation identification, and phylogenetic tree generation based on the identified mutations.
Related Works
Genomic sequence comparisons can be performed using two primary alignment-free approaches: word-based and information theory-based methodologies (?). Word-based methods focus on the analysis of k-mers, which are short subsequences of fixed length k extracted from the analyzed sequences. These k-mers are treated as unique units, and their frequency and distribution within genomic sequences are used to generate sequence-specific profiles and patterns. Conversely, information theory-based methods leverage mathematical and statistical tools from information theory to quantify the information content across the entire genomic sequences. This approach allows for the identification of complex and contextual patterns within sequences, facilitating the detection of functional and evolutionary relationships between different genomic regions (?, ?, ?, ?). Several methods adopt the spectrum generated by the frequency of occurrence of k-mers (?). This approach is based on the premise that different species present unique k-mer patterns, which allow for the identification and classification of sequences according to their k-mer frequency (?). Alternatively, recent approaches have investigated the application of genetic algorithms to pinpoint deterministic subsequences of interest (?).
Integrating deterministic subsequences as features offers the possibility of reducing dimensionality for training machine learning models (?, ?, ?, ?, ?). This approach leverages these subsequences as the principal features to characterize the input sequences. Furthermore, machine learning models trained on such features get the ability to discern intricate and nuanced patterns, ultimately leading to the classification of novel sequences into distinct species.
Thanos (?) introduces an information theory-based approach for genomic analysis, leveraging Shannon entropy applied to non-overlapping blocks of subsequences. This framework adopts Shannon entropy to identify repetitive regions, as they often exhibit substantial entropy fluctuations compared to other genomic segments. This characteristic empowers the detection of repetitive elements, such as transposons and duplicated sequences, playing crucial roles in both evolution and genetic regulation. Furthermore, the method by (?) proposes a novel evolutionary measure based on the cross-covariance of entropy variation between two genomes. This measure quantifies the “evolutionary distance” between them by analyzing the differences in entropy fluctuations across their respective sequences.
The GENIES method (?, ?) presents a distinct approach to mutation detection in viral genomes, particularly focusing on SARS-CoV-2. It leverages the entropy spectrum, a graphic representation of the relationship between block index and k-mer entropy. Unlike the method proposed by Thanos (?), GENIES employs overlapping subsequences with a calculated step size to assess entropy for each k-mer within the genome. Mutations are identified by comparing the entropy ratios of the corresponding k-mer blocks between the reference and variant sequences. Deviations from a ratio of signify the presence of mutations within the specific k-mer. While this technique proves valuable for pinpointing specific mutations, a key limitation lies in its requirement for equal-length reference and variant sequences. As a result, GENIES is inapplicable to studies involving viral genomes of varying lengths.
MEME (discriminative mode) (?, ?) employs a statistical sequence model based on user-defined parameters, if available, for expected site count and width. It allows incorporating prior sequence information and offers two search options: zero-or-one occurrence per sequence (ZOOPS) and one occurrence per sequence (OOPS). STREME (?), utilizes a generalized suffix tree and evaluates motifs using a unilateral statistical test of enrichment within a specified sequence set compared to a control set.
Lebatteux et al. (?) introduced the CASTOR-KRFE method to identify discriminative subsequences within viral genomes for classification. This method adopts a feature selector to identify the most informative k-mers and subsequently employs them as features for clade, species, or sub-variant classification. An evolution of CASTOR-KRFE, is the Kevolve method (?, ?), which keeps the same structure while implements a genetic algorithm instead of a feature selector for k-mer selection. The latest refinement, KANALYZER (?), leverages these discriminative k-mers to pinpoint specific gene regions harboring mutations in the analyzed genomes. It achieves this by performing alignments only in regions exhibiting discrepancies between the matches of the discriminative k-mers and the reference sequence k-mers. This approach ultimately identifies single nucleotide polymorphisms (SNPs) and insertions/deletions (indels), potentially affecting amino acid changes. Notably, KANALYZER enables detailed analysis of genomic variations, pinpointing mutation sites and predicting their in silico impact on protein translation. Furthermore, its application to the SARS-CoV-2 genome successfully identified previously reported mutations (?).
Our methodology focuses on the development and application of a novel alignment-free method for analyzing genomes. This method aims to identify discriminatory regions within genomes, facilitating the subsequent extraction of SNPs. Furthermore, the identified discriminatory regions can be utilized for generating phylogenetic trees and as features to train classification models. The details of the methodology are discussed in the next section.
Materials and Methods
Materials
Three distinct datasets were employed for evaluating the proposed method. The first dataset was obtained from the Los Alamos Sequence Database (https://www.hiv.lanl.gov/), containing genomes related to the human immunodeficiency virus type 1 (HIV). All available genomes were downloaded, and subtypes were grouped into five major clades (A, B, C, D, and F). The reference genome used for the HIV virus was extracted from NCBI (identification NC_001802.1). The second dataset containing Dengue virus (DENV) genomes was obtained through BV-BRC (?), containing four dengue serotype. The reference genome utilized for the Dengue virus was extracted from NCBI (identification NC_001477.1). The last dataset is the SARS-CoV-2 virus and was extracted from NCBI. The 20 lineages with the highest number of available sequences until January 2024 were selected. The reference genome used was also obtained from NCBI, corresponding to the Wuhan (identification NC_045512.2).
In all three datasets, preprocessing was conducted using SeqKit (?) to remove incomplete sequences and those with distinct nucleotide letters (A, C, G and T). Additionally, the splitting step in training and testing sets was carried out for each virus lineage under analysis. We randomly selected 80% of the data for the training set, and the remaining 20% was used to test the method for its classification function. Table 1 shows the details of the adopted datasets.
| Dengue Virus (DENV) | ||
|---|---|---|
| Sorotype | Train Set | Test Set |
| Type 1 | 2060 | 511 |
| Type 2 | 1408 | 348 |
| Type 3 | 1020 | 252 |
| Type 4 | 372 | 90 |
| Total | 4860 | 1201 |
| Human Immunodeficiency Virus type 1 (HIV) | ||
| Subtype | Train Set | Test Set |
| A | 684 | 169 |
| B | 7332 | 1829 |
| C | 1588 | 393 |
| D | 88 | 19 |
| F | 40 | 7 |
| Total | 9732 | 2417 |
| SARS-CoV-2 | ||
| Lineages | Train Set | Test Set |
| AY.103 | 26760 | 6690 |
| AY.25 | 10372 | 2589 |
| AY.3 | 11392 | 2845 |
| AY.44 | 15728 | 3930 |
| B.1.526 | 10180 | 2545 |
| B.1 | 9984 | 2494 |
| B.1.1.7 | 52700 | 13175 |
| BA.1.15 | 16124 | 4029 |
| BA.1.18 | 10676 | 2666 |
| BA.1.1 | 71580 | 17891 |
| B.1.2 | 23696 | 5923 |
| BA.1 | 12148 | 3034 |
| BA.2.12.1 | 61516 | 15377 |
| BA.2 | 39736 | 9932 |
| BA.4.6 | 10204 | 2547 |
| BA.5.1 | 11252 | 2812 |
| BA.5.2.1 | 27932 | 6982 |
| BA.5.2 | 14396 | 3598 |
| BA.5.5 | 13496 | 3372 |
| BQ.1.1 | 13400 | 3350 |
| Total | 463272 | 115781 |
Methods
Entropy
The “entropy” permeates diverse scientific domains, encompassing both microscopic and macroscopic scales. In statistical mechanics (?), it reflects the disorder within a system. Similarly, thermodynamics leverages entropy to describe energy exchange and equilibrium states (?). While Clausius and Kelvin established the second law of thermodynamics, the underlying formula for entropy remained elusive until Boltzmann and Gibbs’ groundbreaking work (?). Their microscopic approach defined the now-renowned Boltzmann-Gibbs entropy:
| (1) |
where is the Boltzmann constant and represents the probabilities of the possible microscopic states .
Meanwhile, information theory employs a distinct concept of entropy introduced by Shannon (?). Here, entropy quantifies the uncertainty associated with a random variable , formally defined as:
| (2) |
where represents each element in the alphabet of and denotes its probability. Notably, entropy solely depends on the probabilities, not the specific values, of .
Jaynes (?, ?) bridged these realms by connecting the thermodynamic entropy of Boltzmann and Gibbs with Shannon’s information-theoretic entropy. The principle of maximum entropy posits that, given available data, one should choose the probability distribution with the highest possible entropy. This essentially implies utilizing only the observed data without incorporating any prior assumptions.
Consider a discrete distribution with events and observed frequencies . Let (where is the total number of samples) represent the probability of the i-th outcome. For a distribution with two classes, and , their respective entropies are:
| (3) |
| (4) |
where and are the respective probabilities of belonging to class or . By maximizing the sum of these class entropies , we achieve the maximum entropy :
| (5) |
This maximization essentially identifies the point in the distribution where the classes are most separable, signifying maximum uncertainty between them (?). Leveraging maximum entropy to distinguish classes (?) allows us to focus solely on data with high information content, effectively filtering out noise and bias. This approach proves particularly valuable in high-dimensional problems, where it can significantly reduce dimensionality.
GRAMEP - Genome vaRiation Analysis from the Maximum Entropy
GRAMEP consists of five main stages to extract the most informative subsequences. Figure 1 provides an overview of the method for obtaining the most informative subsequences for each variant under analysis. These subsequences will be used as features for training a classification model.
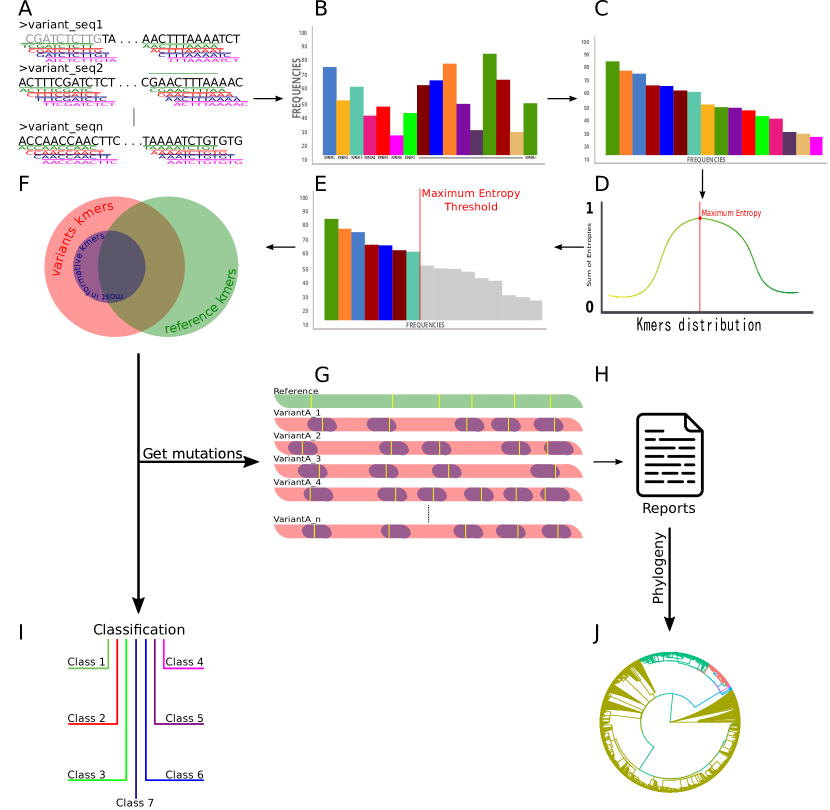
The initial step focuses on selecting unique and informative subsequences for each variant (subfamily) of the analyzed organism. This step requires two input files: a file containing all sequences of a specific variant and a single reference sequence for that organism. To identify unique subsequences, two key parameters are employed: “word” and “step”. The “word” parameter defines the k-mer size, representing the length of subsequences to be considered. The “step” parameter, on the other hand, dictates the stride or shift taken by a sliding window as it traverses the sequences, as shown in Figure 1, panel A. These parameters directly influence the size and overlap of extracted subsequences from the variant sequence, offering flexibility in the selection process. For each variant, GRAMEP efficiently calculates the frequency of occurrence for all k-mers present within all sequences of that variant, shown in Panel B in Figure 1. This comprehensive analysis facilitates the subsequent identification of unique and informative subsequences for each specific variant.
The second step leverages the previously calculated k-mer occurrence frequencies to identify the most informative k-mers, guided by the principle of maximum entropy. This stage begins by sorting the k-mer frequencies in descending order, generating a frequency histogram, Panel C of Figure 1 illustrates this stage. Subsequently, occurrence probabilities are calculated using the maximum entropy principle (see Entropy section). Following this, an automatic threshold for “informative” subsequences is established. Panels D and E of Figure 1 graphically represent the obtaining of the maximum entropy value and also the selection of the most informative kmers from the histogram. K-mers surpassing this threshold are then considered informative and retained to constitute the variant-specific set of informative subsequences. The entropy calculation is dependent on the data used as input, which can influence the choice of the most informative k-mers in each class, as the maximum entropy principle solely considers the probability of event occurrences. This reliance on probability precludes intermediate values from influencing the maximum entropy calculation. Therefore, utilizing multiple sequences per variant is recommended to determine the optimal cutoff point between these classes. Following the identification of informative k-mers specific to the variant, this stage accomplishes this by subtracting the set of informative k-mers belonging to the variant from the comprehensive set of k-mers present in the organism’s reference sequence, Panel F of Figure 1 illustrates this stage through Venn diagrams representing the set of k-mers from the reference sequence in green, the set of k-mers from the variant in red and the subset of the most informative k-mers for the variant in blue. This subtraction process effectively filters out k-mers shared between the variant and the reference, ensuring the resulting set solely comprises unique and informative subsequences characteristic of the analyzed variant.
Algorithm 1 provides a summary of how the most informative unique k-mers are obtained for each variant under analysis.
The third step focuses on detecting mutations and their corresponding positions within the reference genome. This task leverages the established set of unique and informative subsequences associated with each variant sequence. Only subsequences with potential mutation sites within the variant sequence are selected for further analysis. This selection is achieved by considering the intersection of the variant’s exclusive subsequences, effectively filtering out non-mutated regions. Subsequently, for each of these mutation-prone subsequences, the Levenshtein distance is adopted (?). Panel G of Figure 1 illustrates this stage. Each most informative unique k-mer is represented in purple in the variant sequences and SNPs are identified in yellow.
The fourth step culminates with a comprehensive analysis of mutation abundance and distribution within each variant sequence (Panels G and H in Figure 1). This step starts with the computation of a frequency table, systematically tallying the occurrence and position of every identified mutation. Furthermore, if feasible, a graphical representation is generated, visually depicting the entirety of mutation locations relative to the reference genome. In the presence of an annotation file in .gff3 format, detailed mutation information can be generated for each sequence. This enriched data encompasses sequence identification, functional annotation, start and end positions of the mutation, type of mutated region, both variant and reference subsequences harboring the mutation, and specific nucleotide changes. Analyzing multiple variants of the same organism enables the identification of shared mutations, offering valuable insights into population-level trends and evolutionary trajectories. Furthermore, the final two stages of the methodology empower the classification of novel sequences based on pre-established knowledge gleaned from analyzed variants within the same organism.
The sets of unique and informative subsequences for each variant, obtained in the previous steps, are combined to form a single set that contains all unique k-mers for each variant in relation to the reference genome. Subsequently, these k-mers are adopted as features to train a classification and prediction model capable of effectively classifying novel sequences.
The fifth step encompasses the training of the classification and prediction model. This step utilizes each k-mer in the consolidated set as a feature, resulting in a feature matrix, as shown in Panel I in Figure 1. Each row in this matrix represents a sequence, while each column corresponds to the occurrence frequency of a specific k-mer within that sequence. Following the acquisition of raw data (i.e., occurrence frequencies). The Min-Max rescaling is employed in order to improved usability in the model. Following data processing, a Random Forest algorithm with default parameters is implemented for training and classification tasks. A “10-fold” cross-validation approach is utilized to validate the generated model, demonstrate its robustness, and mitigate potential overfitting during the training step.
Results and Discussion
GRAMEP - identification of SNPs mutations
To assess the GRAMEP for accurate Single Nucleotide Polymorphism (SNP) identification, it was performed simulations by considering datasets based on HIV and Dengue virus genomes, motivated by other studies (?, ?). Simulated mutations incorporated parameters reflecting real-world variation, including sequence length (based on average lengths in available datasets), virus-specific mutation rates, sequencing error rates, and genome size variation (based on standard deviation sequence length in available datasets). For each scenario, a fixed-size reference sequence was generated, followed by creation of 1,000 mutated sequences incorporating size variations, sequencing errors, and true mutations.
Details of the simulation parameters for HIV (S-HIV) and Dengue virus (S-DENV) were obtained from literature (?, ?, ?, ?). The S-HIV dataset consisted of strings with a length of , a mutation rate of , and a variation rate of . The S-DENV dataset, on the other hand, comprised strings with a length of , a mutation rate of , and a variation rate of . Both simulations employed a uniform error rate of and used identical “word” and “step” values of and , respectively.
GRAMEP was performed considering the specified parameter configuration, as a remarkable result achieved a null false positive rate (FPR) in both simulations, which shows that all identified mutations were verified true positives. However, the true positive rate (TPR) varied across viruses. In the Dengue virus simulation (S-DENV), the TPR was with a standard deviation of , while in the HIV simulation (S-HIV), the TPR was with a standard deviation of . Further evaluation metrics are provided in Table 2.
| TPR | FPR | TNR | FNR | ACC | MCC | F1 | |||||||||||||||
|---|---|---|---|---|---|---|---|---|---|---|---|---|---|---|---|---|---|---|---|---|---|
| S-HIV |
|
|
|
|
|
|
|
||||||||||||||
| S-DENV |
|
|
|
|
|
|
|
In order to assess GRAMEP in the identification of SNPs in real scenarios, it was adopted a dataset of SARS-CoV-2 strains encompassing sequences (details provided in the Materials and Methods section). For validation, GRAMEP was compared against data from COV2Var (?), a resource analyzing and annotating mutations in over 13 billion SARS-CoV-2 sequences sourced from GISAID. The “word” and “step” parameters were set to and . The large number of sequences employed served to demonstrate the scalability of the proposed methodology. In addition, it demonstrates the methodology’s scalability, allowing thousands of sequences to be analyzed simultaneously. The results obtained are presented in Table 3.
| Variant | COV2Var (99%) | GRAMEP |
|---|---|---|
| AY.3 | 12 | 6 |
| AY.25 | 13 | 7 |
| AY.44 | 11 | 6 |
| AY.103 | 13 | 6 |
| B.1 | 0 | 0 |
| B.1.1.7 | 3 | 2 |
| B.1.526 | 6 | 4 |
| B.1.2 | 24 | 3 |
| BA.1 | 8 | 3 |
| BA.1.1 | 10 | 8 |
| BA.1.15 | 14 | 6 |
| BA.1.18 | 11 | 8 |
| BA.2 | 12 | 9 |
| BA.2.12.2 | 27 | 12 |
| BA.4.6 | 19 | 11 |
| BA.5.1 | 14 | 10 |
| BA.5.2 | 13 | 11 |
| BA.5.2.1 | 16 | 11 |
| BA.5.5 | 18 | 14 |
| BQ.1.1 | 20 | 14 |
Across all analyzed variants, except B.1, which contained no identified mutations under this restriction because of no one mutation occurring in of sequences analyzed, our methodology successfully confirmed the existence of identified mutations in the respective variants, achieving a null false positive rate.
Furthermore, in order to assess the GRAMEP for identifying structural mutations within each variant, the achieved results were compared to mutations present in of sequences analyzed by COV2Var. On average, across the analyzed variants, of mutations identified by GRAMEP were present in of sequences within each variant. The remaining mutations were detected in a lower proportion of sequences.
The mutations identified by GRAMEP exhibited high concordance with those present in of the sequences belonging to the COV2Var-analyzed variants (based on GISAID (?) data). The identified mutations represented, on average, half of all variants found in of the sequences. Moreover, none of the identified SNP-type mutations were false positives, further reinforcing the ability to pinpoint mutations truly present in the majority of analyzed sequences.
An additional potential application of GRAMEP involves identifying mutations common to specific organism variants. This capability stems from the fact that all identified mutations inherently belong to the examined variant. In this context, we explored shared mutations among the SARS-CoV-2 variants. For example, mutation C14408T was present in 18 of the 20 analyzed variants, leading to a proline-to-leucine substitution at amino acid position 4715 (?). A mutation at position A23403G within the Spike (S) protein region has been observed, leading to the substitution of aspartic acid (D) with glycine (G) at this residue. The remaining identified mutations were predominantly present in most analyzed sequences, suggesting distinctive variations between the variants. Additionally, GRAMEP offers the capability to generate detailed reports for each analyzed sequence, outlining the identified mutations, which facilitates interpretation and comparison of results.
To further evaluate GRAMEP’s performance in real-world settings, datasets containing sequences of DENV and HIV were considered. The same parameter configuration (“word” set to and “step” set to ) were kept the same adopted in the in silico simulations for consistency.
Beyond identifying individual mutations within each dataset, we explored the intersection of mutations between different variants of the respective organisms. For HIV, analysis of the five major lineages identified 49 shared mutations. Additionally, a high number of shared mutations were found between individual pairs of lineages, further highlighting distinct patterns within HIV strains.
In contrast, analyzing DENV serotype with the same parameter configuration revealed no shared mutations among all serotype. Only one mutation was shared between three serotype, suggesting common ground in this scenario.
For SARS-CoV-2 variants, 18 variants shared the same mutation. However, the extent of shared mutations between individual pairs of variants was heterogeneous, with some pairs exhibiting greater overlap compared to others.
GRAMEP - phylogeny based on the identified mutations
The GRAMEP allows for the construction of phylogenetic trees based on shared mutations identified across analyzed sequences. For each organism, mutations identified in all its variants are aggregated into a single set. Each analyzed sequence within the organism is then represented as a binary vector, where each element signifies the presence (1) or absence (0) of a specific mutation from the aggregated set. A distance matrix is constructed using the Hamming distance metric. This matrix quantifies the dissimilarity between each pair of sequences based on their shared mutation profiles. A phylogenetic tree is proposed, reflecting the relationships among the analyzed sequences. This approach leverages the shared mutation information effectively to uncover underlying evolutionary patterns and construct informative phylogenetic trees. Figure 2 presents the phylogenetic trees constructed using our method for the HIV and Dengue viruses. These trees visually represent the inferred groupings within each organism based on the identified mutations.
GRAMEP leverages the Newick format for its phylogenetic tree output. This format enables seamless integration with alternative tree generation methods, allowing researchers to explore the utility of different distance metrics and criteria for analysis. Additionally, as open-source software, GRAMEP is readily modifiable to incorporate novel tree generation criteria tailored to specific research questions.
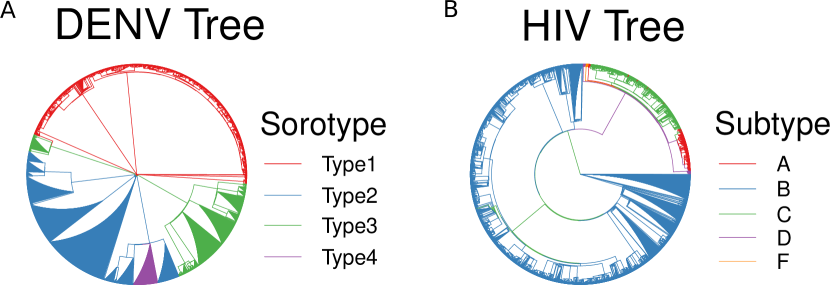
Phylogenetic trees constructed using the DENV and HIV data demonstrate this application effectively. The DENV tree exhibits significantly lower variability compared to the HIV tree, appropriately reflecting the inferred “distances” between individuals. This result is particularly impressive considering the HIV dataset encompassed five major subtype clades. Moreover, existing literature supports the significantly higher mutation rate observed in HIV (?, ?), further validating the abundance of mutations identified within the real HIV genome dataset analyzed.
GRAMEP - classification and prediction of sequences
The GRAMEP extends beyond mutation identification and offers the potential for biological sequence classification and prediction. This can be achieved by leveraging the most informative exclusive k-mers associated with each variant within an organism.
To demonstrate this application, the three previously analyzed organisms (DENV, HIV, and SARS-CoV-2) were considered. Pre-processing of data for each organism followed the procedures outlined in the Materials and Methods section.
For the training classification model with DENV, the parameter configuration of “word” set to , ensuring consistency with previous analyses, and demonstrating the ability to use previous analyzes as input for the method training stage. For HIV, the “word” parameter was set to , to demonstrate that our methodology is capable of predicting sequences with a small feature set, and for SARS-CoV-2, the “word” parameter was set to , showcasing the methodology’s flexibility to adapt to various sequence and organisms characteristics. For the execution of the three mentioned scenarios, the value was used for the “step” parameter. Following training and validation on dedicated datasets, we employed the trained models for prediction on independent test data.
To evaluate the performance of the classification models, the standard metrics including precision, recall, F1-score, Matthews correlation coefficient (MCC), and accuracy were adopted. For clarity and comprehensiveness, the performance metrics for each organism within a dedicated Figure 3, and also, the confusion matrix for each organism is shown in Figure 4.
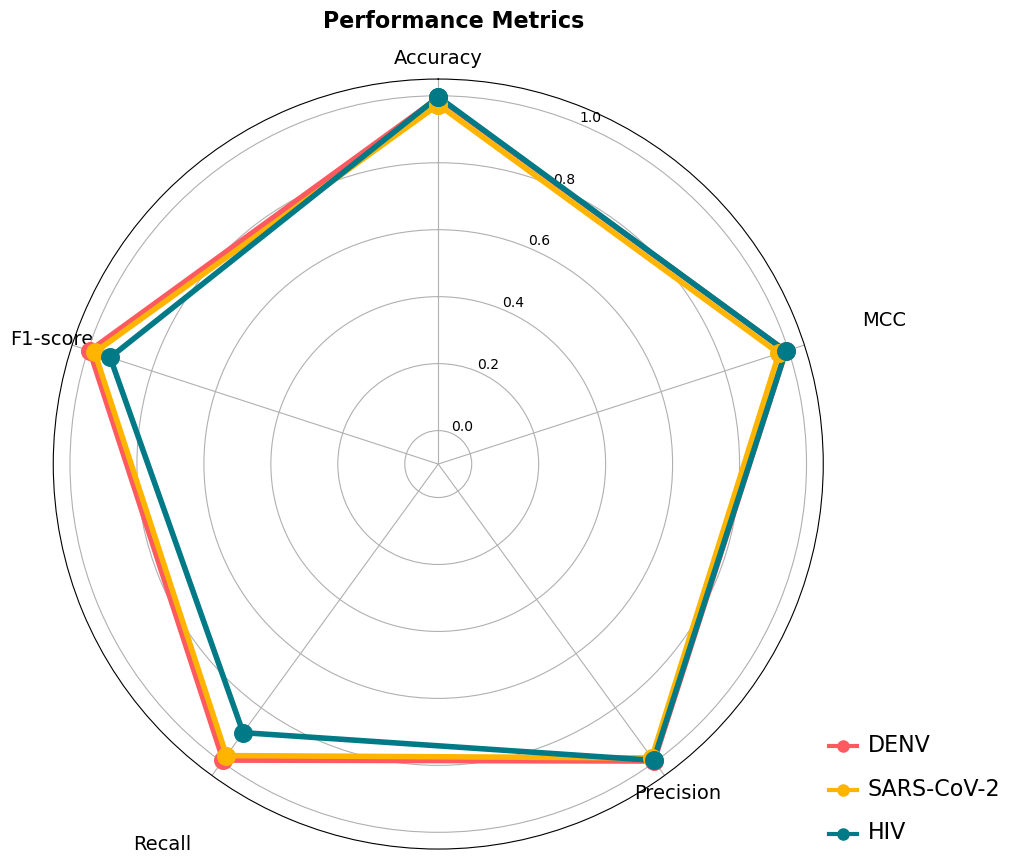
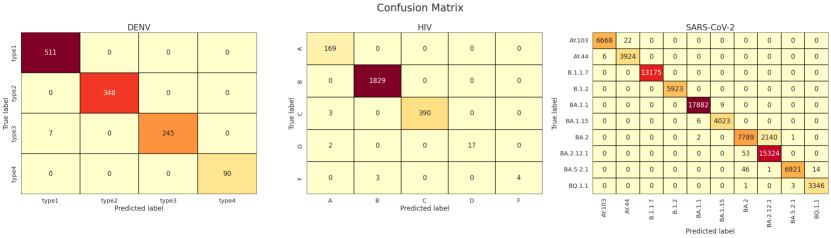
It is possible to notice that GRAMEP show remarkable results in classifying the four DENV serotype and the five HIV subtypes present in the dataset. Besides, GRAMEP achieved accurate class prediction for each organism, even accounting for imbalanced datasets with varying sequence availability. Confusion matrices for DENV serotype classification confirmed the model’s effectiveness, highlighting the precise distinction of the serotype. With HIV subtype classification, the limited number of sequences available for subtype F impacted prediction accuracy, as evident in the confusion matrix. This underscores the importance of adequate training data to ensure optimal performance. Interestingly, the ”word” parameter analysis for HIV classification revealed that satisfactory results can still be achieved using smaller values, demonstrating the method’s flexibility in handling different parameter settings.
Applying GRAMEP to a dataset of 10 frequently occurring SARS-CoV-2 variants, retrieved from the National Center for Biotechnology Information (NCBI), yielded satisfactory performance. Analyzing the confusion matrix presented in Figure 4 reveals significant misclassifications only between highly similar variants, such as BA.2 and its subvariant BA.2.12.1. This observation suggests close proximity and substantial overlap in genomic regions between these variants, potentially hindering accurate classification.
It is important to note that compared to commonly used tools in the field, GRAMEP offers distinct advantages in k-mer extraction. Unlike tools like CASTOR-KRFE and KEVOLVE, GRAMEP only requires variant sequences and a reference genome, streamlining the computational workflow and reducing reliance on additional external resources.
Comparing GRAMEP to existing state-of-the-art tools
In order to a broader comparison of the results by the proposed approach with the similar methods of classification and identification of mutations from deterministic regions in the genome in the literature, it was carried out a review and selected four methods commonly used and studied by the community in problems similar to those presented previously.
The performance of several motif discovery tools in identifying discriminatory sequence regions within SARS-CoV-2 genomes representing different variants were considered. Important methods such as MEME suite (MEME) (?, ?), STREME (?), CASTOR-KRFE (?), and KEVOLVE (?), were considered in order to compare their results from the previous work by (?).
| WHO Labe | Pango Lineage | Number of sequences |
| Alpha | B.1.1.7 | 175,212 |
| Beta | B.1.351 | 695 |
| Gamma | P.1 | 8,129 |
| Delta | B.1.617.2 | 9,408 |
| Kappa | B.1.617.1 | 127 |
| Epsilon | B.1.427/B.1.429 | 14,674 |
| Iota | B.1.526 | 19,274 |
| Eta | B.1.525 | 716 |
| Lambda | C.37 | 428 |
| Omicron | B.1.1.529/BA.x | 106,293 |
| Total number of sequences | 334,956 | |
A dataset of SARS-CoV-2 genomes representing ten World Health Organization (WHO) cataloged variants was analyzed, as shown in Table 4. A repeated K-fold cross-validation was conducted with random selection of sequences in iterations. Each fold comprised sequences for training and the remainder for testing. To ensure balanced representation within the training sets despite varying numbers of available sequences per variant, sequences were allocated to each variant except Kappa , Alpha , and Omicron . Each tool was used to identify discriminatory motifs within the training sets, which were subsequently utilized to train a linear support vector machine (SVM) machine learning algorithm. We compare the performance of GRAMEP to that achieved by (?) using Figure 5 which presents the confusion matrices to visualize the prediction accuracy for each variant class.
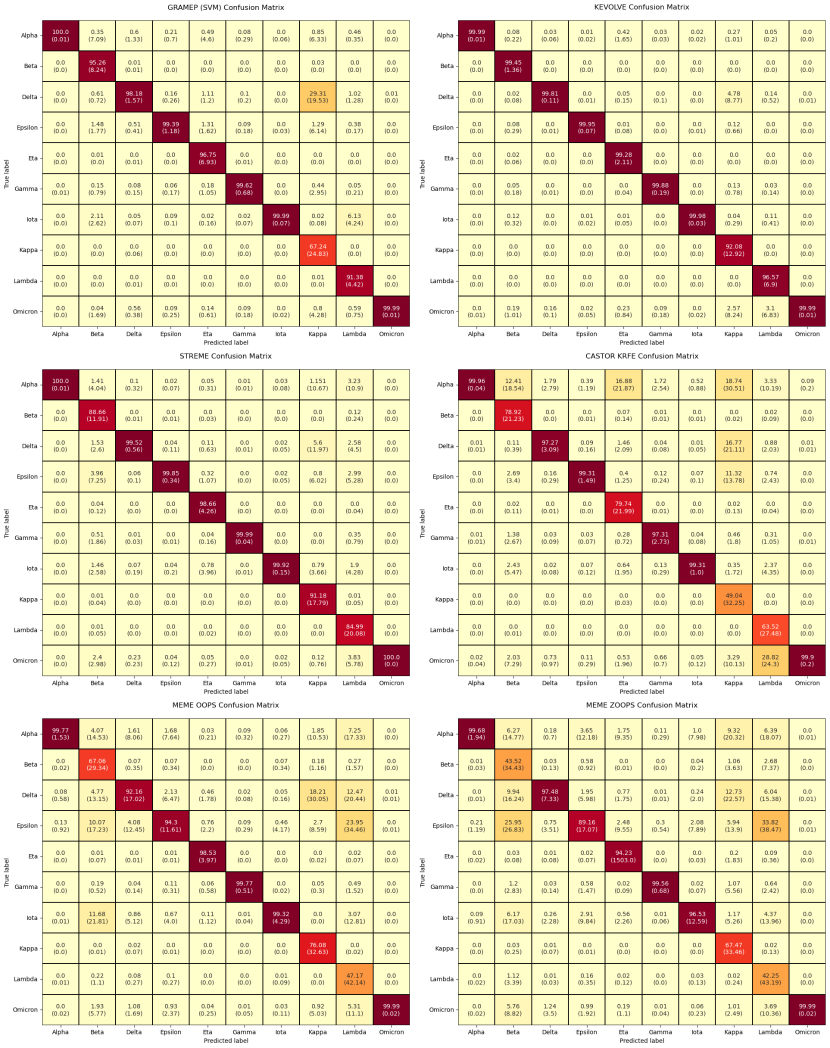
Figure 5 presents the resulting confusion matrices. The analysis reveals that our entropy-maximization approach achieves a significantly lower dimensional feature space, utilizing an average of features for sequence classification with low standard deviation. In comparison to all other tools, with the exception of CASTOR-KRFE, GRAMEP requires a lower number of features for sequence classification. This reduction in dimensionality is achieved while maintaining satisfactory classification accuracy with low standard deviation in average. These findings suggest the potential of our methodology as an efficient and robust tool for extracting informative k-mers for various scenarios and organisms, ultimately enhancing the feature space for classification models.
In the scenarios analyzed, our proposed methodology proved to be promising. The initial application explores the identification of structural mutations without requiring genome alignment. To validate this, we simulated two datasets based on real Dengue virus (DENV) and human immunodeficiency virus (HIV) genomes. These simulations were designed to highlight the ability to detect mutations present in the majority of analyzed genomes, excluding point mutations arising from sequencing errors or individual sample peculiarities. GRAMEP successfully identified all mutations without false positives, demonstrating its robustness in categorizing this type of mutation.
The simulated scenarios incorporated variations in mutation rates, error rates, and sequence lengths, effectively demonstrating the methodology’s adaptability to handle diverse organisms, including those with high mutation rates or highly conserved genomes.
The results indicates the GRAMEP’s high accuracy, its capacity for scalability and the potential for dimensionality reduction during genome analyses.
he sensitivity and specificity of GRAMEP’s mutation identification are influenced by two key parameters: “word” and “step”. Utilizing very small “word” values can lead to false positives, potentially identifying differences in non-mutated regions with k-mer similarities. Conversely, a “step” parameter exceeding “word” might result in incomplete coverage of the analyzed genome. Given its data-driven nature, our method is well-suited for application across diverse scenarios and organisms. This is because it solely relies on information extracted from the analyzed sequences, eliminating the need for prior knowledge about the organisms under investigation.
In the classification stage, reducing the “word” value demonstrated the possibility of maintaining classification accuracy while lowering computational complexity, as observed with HIV. Our approach offers a reduction in computational complexity compared to alignment methods and other alignment-free analysis techniques, such as evolutionary algorithms, feature selection, or statistical tests. This advantage stems from the requirement of solely analyzing k-mer occurrence frequencies within the sequences. Consequently, our method facilitates the simultaneous analysis of large datasets even on personal computers.
Conclusion
The identification and classification of mutations within genomes are crucial tasks that underpin advancements in public health research, including drug and vaccine development, disease control strategies, and various other areas. However, these tasks present significant challenges. Traditional methods often rely on sequence alignment, which can be computationally expensive, require specific reference information, and potentially generate inaccurate results because of the inherent complexity and variability of genomic sequences. Consequently, alignment-free approaches have emerged as a promising alternative for mutation identification. While a variety of methods have been proposed, each employs its own unique approach.
This study present a novel method (GRAMEP) for selecting the most informative subsequences from genomic data, grounded in the principle of maximum entropy. This approach leverages information theory, particularly Shannon entropy, to identify k-mers that are most “important” for characterizing different variants of an organism. By prioritizing these informative subsequences, we can create unique k-mer signatures for each variant.
Beyond simply selecting the most informative k-mers, GRAMEP a proof-of-concept application demonstrating the methodology’s potential in genome analysis. The four scenarios analyzed concern obtaining SNPs in silico and in viral organisms, identifying mutations in common between variants of the same organism, generating phylogenetic trees and classifying sequences from different organisms.
The proposed methodology is capable of obtaining SNPs with a high reliability rate and also of obtaining exclusive regions for each variant in relation to the reference, which can be applied as “barcodes” for classifying these organisms. In terms of classification, using an automatic threshold based on maximum entropy reduces the dimensionality of the feature space in comparison to other available methods, maintaining satisfactory accuracy. In addition, our methodology does not depend on a priori information, using only the input sequences to extract and obtain the feature values, making it a useful tool in a variety of different scenarios and organisms.
Currently, the GRAMEP primarily focuses on identifying single nucleotide polymorphisms (SNPs) and excludes mutations like insertions or deletions. As a result, real-world applications, such as the SARS-CoV-2 analysis, solely report identified SNP mutations. Future studies could explore this approach further to optimize parameterization for different scenarios and, additionally, porting the methodology to languages like Rust or C/C++ could potentially unlock even faster analyses. Beyond basic k-mer frequencies, the threshold derived from the maximum entropy principle could be applied to other features extracted from the sequences. These features could encompass physical-chemical properties or biological characteristics relevant to the specific organism under analysis.
The GRAMEP method was implemented in open source (Python language). The source code is available at https://github.com/omatheuspimenta/GRAMEP and the documentation is available from Read the Docs: https://gramep.readthedocs.io/en/latest/.
Acknowledgments
This study was financed by the Coordenação de Aperfeiçoamento de Pessoal de Nível Superior (CAPES) - Finance Code 001, the Fundação Araucária (Grant number 035/2019, 138/2021 and NAPI - Bioinformática and CNPq 440412/2022-6 and 408312/2023-8).
Software availability
GRAMEP source code is available at GitHub: https://github.com/omatheuspimenta/GRAMEP under the open-source MIT license.
GRAMEP v0.1.0 was used for all analysis and is available as a release on GitHub. GRAMEP documentation is available from Read the Docs: https://gramep.readthedocs.io/en/latest/.
The random sequence generator during in silico simulations is available at Github: https://github.com/omatheuspimenta/seq_generatoRS.
References and Notes
- 1. G. Formenti, et al., Nature Methods 19, 696 (2022).
- 2. A. OToole, et al., Wellcome Open Research 6, 121 (2021).
- 3. A. Zielezinski, S. Vinga, J. Almeida, W. M. Karlowski, Genome Biology 18, 186 (2017).
- 4. G. Escaramís, E. Docampo, R. Rabionet, Briefings in Functional Genomics 14, 305 (2015).
- 5. C. R. De Pierri, et al., Scientific Reports 10, 91 (2020).
- 6. F. CRICK, Nature 227, 561 (1970). Publisher: Springer Science and Business Media LLC.
- 7. A. L. Lehninger, D. L. Nelson, M. M. Cox, Lehninger principles of biochemistry (W.H. Freeman, New York, 2013), 6th edn. OCLC: ocn820352899.
- 8. D. P. Snustad, M. J. Simmons, Principles of genetics (John Wiley & Sons, 2015).
- 9. D. Tian, Y. Sun, J. Zhou, Q. Ye, Journal of Medical Virology 94, 847 (2022).
- 10. D. Tian, Y. Sun, H. Xu, Q. Ye, Journal of Medical Virology p. jmv.27643 (2022).
- 11. G. Lippi, C. Mattiuzzi, B. M. Henry, Diagnosis 9, 11 (2022).
- 12. WHO, SARS-CoV-2 variants of concern and variants of interest., Tech. rep., World Health Organization (2022).
- 13. M. Worobey, Science 374, 1202 (2021).
- 14. K. Tao, et al., Nature Reviews Genetics 22, 757 (2021).
- 15. C. P. Perico, et al., Frontiers in Microbiology 13, 1037455 (2022).
- 16. V. B. Franceschi, P. A. G. Ferrareze, R. A. Zimerman, G. B. Cybis, C. E. Thompson, Virus Research 304, 198532 (2021).
- 17. W. T. Harvey, et al., Nature Reviews Microbiology 19, 409 (2021).
- 18. N. R. Faria, et al., Science 372, 815 (2021).
- 19. E. Cella, et al., Chemotherapy 66, 3 (2021).
- 20. D. Mercatelli, F. M. Giorgi, Frontiers in Microbiology 11, 1800 (2020).
- 21. H. Zhou, et al., Current Biology 30, 2196 (2020).
- 22. K. G. Andersen, A. Rambaut, W. I. Lipkin, E. C. Holmes, R. F. Garry, Nature Medicine 26, 450 (2020).
- 23. E. C. Holmes, Novartis Foundation Symposia, G. Bock, J. Goode, eds. (Wiley, 2006), vol. 277, pp. 177–192, first edn.
- 24. J. Y. Yeo, G.-R. Goh, C. T.-T. Su, S. K.-E. Gan, Viruses 12, 297 (2020).
- 25. J. M. Cuevas, R. Geller, R. Garijo, J. López-Aldeguer, R. Sanjuán, PLOS Biology 13, e1002251 (2015).
- 26. K. Lange, Mathematical and Statistical Methods for Genetic Analysis, Statistics for Biology and Health (Springer New York, New York, NY, 2002).
- 27. A. Zielezinski, et al., Genome Biology 20, 144 (2019).
- 28. D. Sankoff, Bioinformatics 16, 41 (2000). Publisher: Oxford University Press.
- 29. S. B. Needleman, C. D. Wunsch, Journal of Molecular Biology 48, 443 (1970).
- 30. S. Duffy, L. A. Shackelton, E. C. Holmes, Nature Reviews Genetics 9, 267 (2008).
- 31. Y. Zhang, et al., BioMed Research International 2017, 1 (2017).
- 32. M. Murugaiah, M. Ganesan, Brazilian Archives of Biology and Technology 64, e21210075 (2021).
- 33. C. Marchet, M. Kerbiriou, A. Limasset, Bioinformatics 37, 2858 (2021).
- 34. E. A. Ito, I. Katahira, F. F. Vicente, L. P. Pereira, F. M. Lopes, Nucleic Acids Research 46, e96 (2018).
- 35. A. Li, J. Zhang, Z. Zhou, BMC Bioinformatics 15, 311 (2014).
- 36. Y.-J. Kang, et al., Nucleic Acids Research 45, W12 (2017).
- 37. Y. Zhang, C. Jia, M. J. Fullwood, C. K. Kwoh, Briefings in Bioinformatics 22, 2073 (2021).
- 38. T. M. R. Noviello, F. Ceccarelli, M. Ceccarelli, L. Cerulo, PLOS Computational Biology 16, e1008415 (2020).
- 39. B. Panwar, A. Arora, G. P. Raghava, BMC Genomics 15, 127 (2014).
- 40. X. Zhang, et al., International Journal of Molecular Sciences 23, 11825 (2022).
- 41. L. Wang, et al., IEEE/ACM Transactions on Computational Biology and Bioinformatics 18, 784 (2021).
- 42. D. De Souza Lima, L. J. A. Amichi, A. A. Constantino, M. A. Fernandez, F. A. V. Seixas, IEEE/ACM Transactions on Computational Biology and Bioinformatics pp. 1–1 (2021).
- 43. N. Amin, A. McGrath, Y.-P. P. Chen, Nature Machine Intelligence 1, 246 (2019).
- 44. S. N. Gardner, T. Slezak, B. G. Hall, Bioinformatics 31, 2877 (2015).
- 45. J. W. Sahl, et al., Microbial Genomics 2 (2016).
- 46. M. H. Pimenta-Zanon, V. A. de Souza, R. F. Hashimoto, F. M. Lopes, Ambient Intelligence in Health Care, T. Swarnkar, S. Patnaik, P. Mitra, S. Misra, M. Mishra, eds. (Springer Nature Singapore, Singapore, 2023), vol. 317, pp. 459–468. Series Title: Smart Innovation, Systems and Technologies.
- 47. G. A. Barros-Carvalho, M.-A. Van Sluys, F. M. Lopes, Journal of Computational Biology 24, 1125 (2017).
- 48. M. M. Vopson, Dynamics of SARS-CoV-2 genetic mutations and their information entropy, preprint, Bioinformatics (2022).
- 49. M. M. Vopson, S. C. Robson, Physica A: Statistical Mechanics and its Applications 584, 126383 (2021).
- 50. P. Kuksa, V. Pavlovic, BMC Bioinformatics 10, S9 (2009).
- 51. B. Chor, D. Horn, N. Goldman, Y. Levy, T. Massingham, Genome Biology 10, R108 (2009).
- 52. G. Fiscon, et al., BioData Mining 9, 38 (2016).
- 53. D. Lebatteux, A. M. Remita, A. B. Diallo, Journal of Computational Biology 26, 519 (2019).
- 54. D. Lebatteux, A. B. Diallo, 2021 IEEE International Conference on Bioinformatics and Biomedicine (BIBM) (IEEE, Houston, TX, USA, 2021), pp. 688–693.
- 55. D. Lebatteux, H. Soudeyns, I. Boucoiran, S. Gantt, A. B. Diallo, PLOS ONE 19, e0296627 (2024).
- 56. D. Lebatteux, H. Soudeyns, I. Boucoiran, S. Gantt, A. B. Diallo, 2022 IEEE International Conference on Bioinformatics and Biomedicine (BIBM) (IEEE, Las Vegas, NV, USA, 2022), pp. 757–762.
- 57. D. Thanos, W. Li, A. Provata, Physica A: Statistical Mechanics and its Applications 493, 444 (2018).
- 58. T. L. Bailey, M. Bodén, T. Whitington, P. Machanick, BMC Bioinformatics 11, 179 (2010).
- 59. T. L. Bailey, J. Johnson, C. E. Grant, W. S. Noble, Nucleic Acids Research 43, W39 (2015).
- 60. T. L. Bailey, Bioinformatics 37, 2834 (2021).
- 61. R. D. Olson, et al., Nucleic Acids Research 51, D678 (2023).
- 62. W. Shen, S. Le, Y. Li, F. Hu, PLOS ONE 11, e0163962 (2016).
- 63. C. Tsallis, The European Physical Journal A 40, 257 (2009).
- 64. R. Clausius, The Mechanical Theory of Heat (Creative Media Partners, LLC, 2019).
- 65. L. Boltzmann, B. McGuinness, Theoretical Physics and Philosophical Problems: Selected Writings, Vienna Circle Collection (Springer Netherlands, 2012).
- 66. C. E. Shannon, Bell System Technical Journal 27, 379 (1948).
- 67. E. T. Jaynes, Physical Review 108, 171 (1957).
- 68. E. T. Jaynes, Physical Review 106, 620 (1957).
- 69. S. Guiasu, A. Shenitzer, The Mathematical Intelligencer 7, 42 (1985).
- 70. J. Kapur, P. Sahoo, A. Wong, Computer Vision, Graphics, and Image Processing 29, 273 (1985).
- 71. V. I. Levenshtein, Soviet physics doklady (Soviet Union, 1966), vol. 10, pp. 707–710. Issue: 8.
- 72. D. Struck, G. Lawyer, A.-M. Ternes, J.-C. Schmit, D. P. Bercoff, Nucleic Acids Research 42, e144 (2014).
- 73. E. Plummer, et al., Journal of Virology 89, 5592 (2015).
- 74. Y. Feng, et al., Nucleic Acids Research 52, D701 (2024).
- 75. S. Khare, et al., China CDC Weekly 3, 1049 (2021).
- 76. M. Pachetti, et al., Journal of Translational Medicine 18, 179 (2020).