Effect of multiple bands on high-harmonic generation in zinc oxide subjected to intense mid-infrared femtosecond laser pulse
Abstract
We theoretically investigate photo-ionization and high harmonic generation in the bulk of zinc oxide subjected to intense femto-second laser pulses with mid-infrared wavelength (3 m). When the electric field strength inside vacuum is below V/Å, an intra-band mechanism associated to non-adiabatic response of multiple valence and conduction bands is found to be responsible for high-harmonic generation in the bulk solid. Good semi-quantitative agreement with the experimental data is found: clean and well defined odd-order harmonic peaks extending beyond the band edge of ZnO are exhibited for laser linearly polarized perpendicular to the optical axis of the crystal.
I Introduction
High harmonic generation (HHG) in a bulk crystal was observed for the first time after the irradiation of zinc-oxide with intense mid-infrared (MIR) few-cycle laser pulse Ghimire2011 . High order harmonics up to the 25th order were produced in the transmission through a 500 m thick ZnO crystal at peak laser intensity 5 W/cm2. The measured harmonic spectra extended beyond the band edge of ZnO and displayed distinct odd harmonic peaks superimposed on a continuous background. The harmonics spectra display clear non-perturbative signatures: i) the cutoff for solid states HHG scales linearly with the peak electric field of the pulsed laser, which is in contrast to the gas-phase harmonics, where the cut-off scales linearly with the peak laser intensity and ii) the dependence of the spectral intensity of individual harmonics on the peak laser intensity of the driving pulse was found to substantially deviate from a power law expected from perturbative nonlinear optics. To explain their results, Ghimire proposed a model in which harmonics of the fundamental laser frequency are a result of laser-driven Bloch oscillations of electrons promoted into the conduction band by tunnel transitions repeating during each half-cycle of the driving pulse. Thus the non-linear band dispersion of the group velocity of conduction electrons was assumed to be the main mechanism for solid state HHG.
Subsequently solid-state HHG were experimentally achieved in other wide bandgap dielectrics, in silica Luu2015 and in gallium selenide Schubert2014 ; Hohenleutner2015 . In the silica experiment, the intra-band mechanism of HHG by dynamical Bloch oscillations of conduction electrons was verified. Importantly, however the main features of measured HHG spectra in GaSe were associated with a non-perturbative effect of interference between direct and indirect photo-ionization pathways involving multiple valence bands.
While HHG experiments in solids display clean and well-defined harmonic spectra with distinct peaks at multiples of the driving laser frequency, the predictions of the corresponding theoretical models for solid-state HHG often lack clear harmonic structure. For instance, in the framework of two band model for laser-driven ZnO Vampa2014 ; Vampa2015 ; Yue2020 (analogus to the semi-classical three-step model of HHG in the gas phase Lewenstein1994 ; Schafer2015 ; Corkum1990 ), an inter-band mechanism of build-up of transient polarization in the photo-excited solid was identified as a primary source of HHG, which contrasts the conclusions in Ghimire2011 . However, in order to reproduce the clean frequency comb observed in the ZnO experiment, one has to phenomenologically introduce an ultra-fast polarization de-phasing process. But a physical mechanism associated with such ultrashort de-phasing time-scale, which is fraction of an optical cycle, has not been clearly identified Floss2018 ; Orlando2020 ; Freeman2022 .
Theoretical analysis of HHG in bulk solids accounted for the temporal structure of interband excitations, typically in the framework of two-band models Vampa2014 ; Tamaya2016 . An effect of multiple conudction bands on the mechanism of HHG in solids was discussed in, e.g Hawkins2015 ; Wu2015 ; Guan2016 ; Navarette2019 ; for instance transitions between multiple conudction bands may affect spectral and temporal properties of solid state HHG. Thus the effect of multiple bands on the mechanism for HHG in soldis should be analyzed within a realistic model for the crystal band structure.
In this paper we theoretically investigate photo-ionization and high-harmonic generation in ZnO subjected to intense few-cycle femto-second laser pulses with wavelength 3 m. The peak laser intensity was varied in the range W/cm2. The laser polarization direction was either parallel or perpendicular to the optical axis of the ZnO crystal. In velocity gauge, the time-dependent Schödinger equation was employed to investigate the effect of multiple valence and conduction bands on the HHG process in ZnO. We find that for the MIR wavelength clean odd-order harmonics emerge in ZnO, due to inter-band mechanism associated with the non-adiabatic response of multiple Bloch bands. This paper is organized as follows: Sec.II includes description of out theoretical model, Sec. III presents numerical results and discussion of the time evolution of the plasma density and photo-currents associated to HHG, and Sec.IV includes our main conclusions. Unless otherwise stated, atomic units are used throughout this paper ().
II Theoretical model
II.1 Ground state electronic structure
The ground state electronic structure of zinc oxide is described by the empirical pseudo-potential method Cohen1966 . The wurtzite structure of ZnO exhibits a hexagonal lattice with primitive lattice translation vectors
| (1) |
where and the two lattice constants. The position vectors of the two zinc atoms in the crystal unit cell and , and the position vectors of the two oxygen atoms in the unit cell are obtained from them by translation along the optical axis and , here the displacement parameter (in ideal wurtzite structure). The primitive reciprocal lattice wave-vectors are
| (2) |
The screened electron-ion pseudo-potential for wurtzite is expanded in plane waves in the basis of the reciprocal lattice wave vectors ()
| (3) |
where the symmetric and anti-symmetric form factors for ZnO are
| (4) |
and the symmetric and anti-symmetric structure factors can be written as
The atomic form-factors for zinc and oxygen atoms were presented by a smooth function of the form Schluter1975
| (5) |
in terms of eight pseudo-potential parameters, which according to Fan2006 are: for a zinc atom, and for an oxygen atom. The lattice constants and used in our calculation are and Å, respectively, and the parameter was set to . The static band structure of ZnO is found by solving for the eigen-energies and eigen-states of the Hamiltonian of a Bloch electron with crystal momentum in a plane-wave basis with high-energy cutoff Ry :
| (6) |
with the Hamiltonian
| (7) |
here the crystal momentum extends over the first Brillouin zone. The Brillouin zone was sampled by a Monkhorst-Pack scheme.
II.2 Time-dependent Bloch states
The time-dependent Hamiltonian of a Bloch electron interacting with spatially uniform laser electric field can be obtained form the static one in terms of the kinetic quasi-momentum
| (8) |
where are the instantaneous Bloch eigenstates with eigen-energies and is the electromagnetic vector potential, related to the laser electric field by . The electric field of the pulse transmitted inside the bulk is a superposition of the externally applied laser electric field and the induced electric field due to transient polarization of the solid, i.e. . In this paper, the applied laser electric field is parametrized by
| (9) |
where is the laser polarization unit vector, the peak field strength inside vacuum is related to the peak laser intensity by , is the laser oscillation frequency corresponding to photon energy eV and designates the pulse duration. To obtain the observables associated with HHG, we propagate forward in time the initially occupied valence electron Bloch states with the Hamiltonian in Eq.(8), by numerically solving the Schrödinger equation
| (10) |
subject to the initial conditions , where labels the eight initially occupied valence electron orbitals of ZnO; the single-particle density-matrix is defined
| (11) |
and the three Cartesian components () of the transient photo-induced current are obtained from the Brillouin zone integral
| (12) |
here is the field-dependent velocity operator. The current density is related to the transient polarization of the solid by and to the induced electric field by . The Fourier transform of the photo-induced current projected onto the laser polarization direction is related to the power spectrum of the emitted radiation inside the bulk of ZnO, which is often associated to high harmonic generation
| (13) |
Details about the numerical method and its implementation are given in appendix/
III Numerical results and discussion
III.1 Static band structure and dielectric response
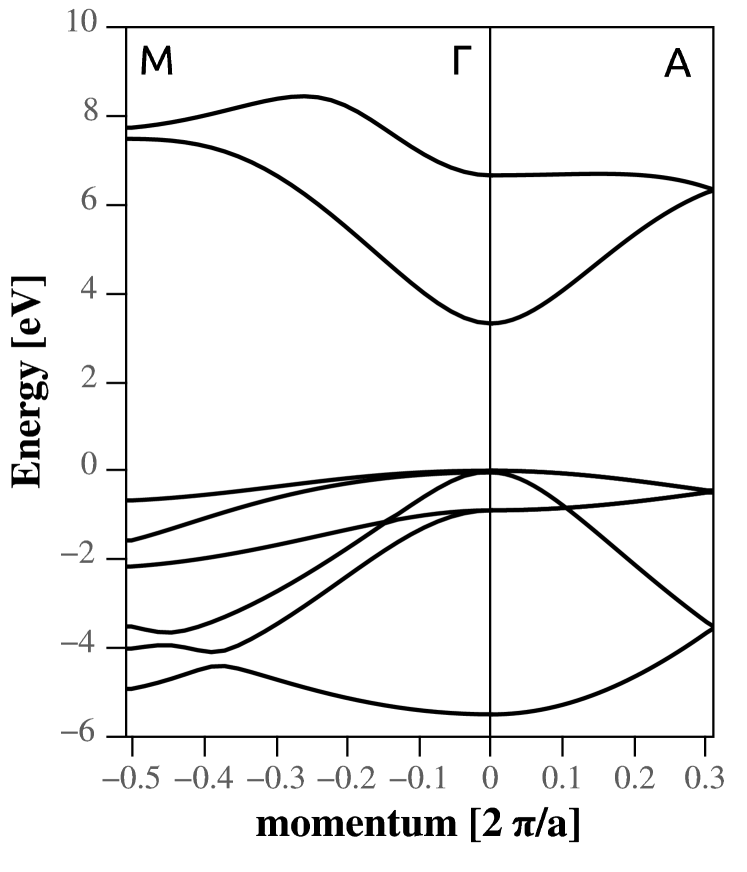
The static band structure of ZnO is shown in Fig.1 along the -A and -M lines in the Brillouin zone. The pseudo-potential method reproduces quantitatively the principal energy gaps and optical properties of ZnO in the UV region. For the MIR wavelength, the direct bandgap energy at the Brillouin center eV would require simultaneous absorption of at least nine photons to produce an electron-hole pair. The conduction bands of ZnO are mainly derived from the orbitals of zinc atoms, while the group of six valence bands stems from the orbitals of the oxygen atoms. Around 20 eV below the valence band top, there are two more bands derived from the orbitals of the oxygen atoms (not shown). Near the point, the two degenerate valence bands at the top are derived from and orbitals of oxygen atoms, the crystal field split-off -like band is slightly below the top of the valence band by eV. Besides the three valence bands at the top, there are three more lower-lying in energy valence bands. The upper two of these lower-lying bands are degenerate at the point and are separated by nearly eV from the top. The lowest in energy valence band at the bottom is split by eV from the top. Degeneracy among valence bands is lifted along the -M line, when all six valence bands are clearly revealed. In this direction in the Brillouin zone, the upper five bands disperse downwards, while the bottom band disperses upwards, such that the group of six bands move close in energy and are strongly coupled. For the MIR laser wavelength (photon energy eV) considered in this work, one- and two-photon resonances between coupled valence bands are exhibited, which is expected to have a pronounced effect on the electron dynamics in the strong field regime.
To test the static band structure and couplings associated with transitions among valence and conduction bands, we first verify that the oscillator strength sum-rule is satisfied. Given the Hamiltonian in Eq.(8), the Cartesian components of the optical conductivity tensor are evaluated in first order of perturbation theory with the standard expression in velocity gauge Passos2018
| (14) |
where in the -representation, the density matrix is diagonal with elements - the occupation numbers of unperturbed Bloch states, the transition frequencies are and is the matrix representation of the field-free velocity operator. In practical calculations a finite-dimensional subspace of Bloch states is used, which in turn automatically violates important sum rules, such as the oscillator strength sum rule Sipe1993 ; Aversa1995 ; Apostolova2020 . The frequency-independent coefficients compensate for the effect of diminished oscillator strength, and ascertain that in the limit , the optical conductivity of the band insulator is regular and vanishes as it physically should. In the static limit, Eq.(14) reduces to
| (15) |
here is the inverse effective mass tensor of band with crystal momentum , and thus the apparent zero-frequency divergence in Eq.(14) is removed on account of the effective mass sum rule. The frequency-dependent dielectric tensor is related to the optical conductivity by
| (16) |
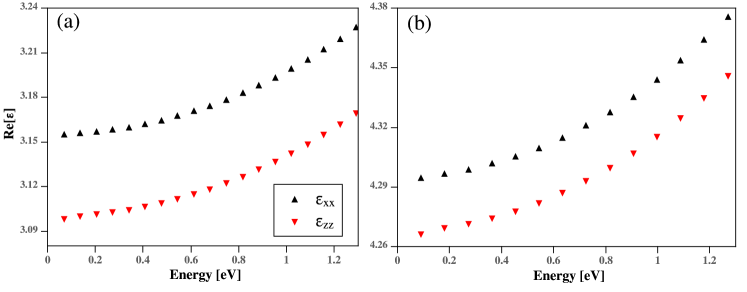
For ZnO, is diagonal and has only two independent components and (here the -axis points along the optical axis of the crystal). The dispersion of the dielectric function for energies below the band gap energy are shown in Fig.2(a-b). In Fig.2(a), the optical conductivity was calculated by sampling the full Brillouin zone with homogeneous Monkhorst-Pack mesh, and by including transitions from valence bands into and out of the two lowest conduction bands of ZnO. The small difference between the two screening parameters and is associated to the optical birefringence of ZnO. After including virtual transitions into and out of the lowest eight conduction bands of ZnO, the static dielectric constant () reproduces quantitatively the experimental result quoted in Phillips1968 .
III.2 Photo-ionization, destructive interference of currents and effect of multiple valence bands
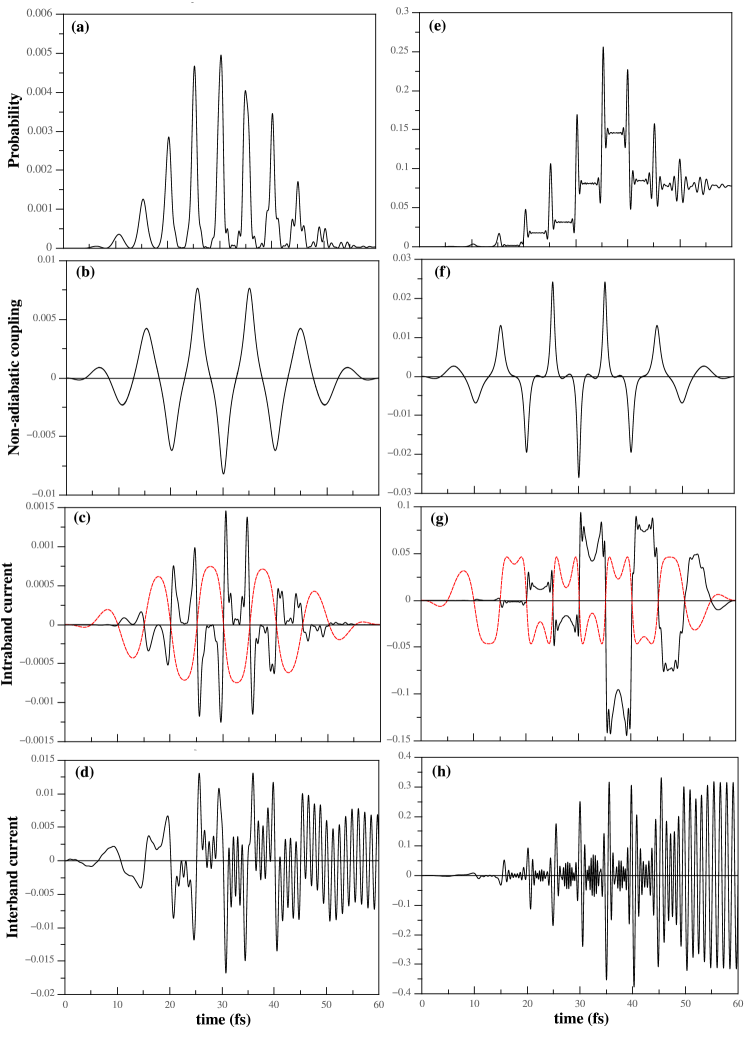
We first discuss results on photo-ionization of ZnO for laser linearly polarized along the optical axis, using the screened electric field , here is the static dielectric constant of ZnO in a model including only the two lowest in energy conduction bands, cf. Fig.2(a). Figs.3(a-h) display the temporal response of electrons in the -bands with initial crystal momentum . In this case there is one relevant inter-band coupling associated with the crystal-field split-off band derived from the orbitals of O interacting with the -like band of Zn orbitals. In the figures, the probability for photo-ionization, the intra- and inter-band currents are presented in the adiabatic basis of the instantaneous Bloch eigen-states with ; these quantities are defined by , and . In Figs. 3(a-d), the peak laser intensity is W/cm2 and the screened Keldysh parameter is ; the reduced mass of an electron-hole pair at the BZ center is . In Figs.3(e-h) the peak laser intensity is W/cm2, which corresponds to tunnel ionization with .
For the lower intensity shown, the transient response of electrons is characterized by series of temporally confined ionization bursts that occur near the peaks of the oscillating laser electric field, cf. Fig.3(a). The temporal profile of the relevant non-adiabatic coupling that drives transitions between the valence and the conduction band is also shown in Fig.3(b). The time duration of each burst is some fraction of the laser half-cycle, and it leads to emergence of a small number of electrons in the conduction band. Following each transition, a steady state is not reached, the density distribution does not have enough time to fully relax, as next ionization burst occurs. The bursts that occur during each half-cycle of the oscillating electric field are not independent of the previous half-cycles: intra- and inter-cycle interference distort the temporal profile of the conduction electron density, which become most prominent after the pulse peak.
The sharp transient features in the probability for photo-ionization translate into the intra- and inter-band currents as shown in Fig.3(c-d). The intra-band current is modulated by the temporal profile of the relaxing electron density during each half-cycle, since conduction electrons (and valence band holes) need finite time to experience the psuedo-potential of the substrate ionic cores before they start moving with the group velocity. The alternation of the current during successive half-cycles is because charge carriers reverse their velocity at the times when the kinetic quasi-momentum passes through the point. The sudden change of the electric current at the time of ionization produces a continuum bremsstrahlung-like radiation during each half-cycle, and as the number of half-cycles increases, harmonics of the fundamental laser frequency emerge from this bremsstrahlung spectrum through interference in time of emissions from all half-cycles. During each half-cycle, the build-up of coherent superposition of states in the valence and the conduction band creates a rapidly oscillating dipole, cf. Fig.3(d), which in turn produces harmonic radiation, however the main features in the temporal profile of the photo-currents are primary determined by the photo-ionization process and the transient plasma density, which is not so sensitive to the detailed static band structure of ZnO, cf. also Ref.Brunel1990 ; Protopapas1996 .
When the laser field strength is increased, photo-ionization is dominated by intense tunneling transitions, the tunneling time being a small fraction of the laser cycle. The plasma of electron-hole pairs is generated in a series of tunneling transitions, which occur at each half-cycle, cf. Figs.3(e,f). Non-adiabatic transitions may interfere either constructively or destructively, such that at each half-cycle the probability for creation of an electron-hole pair undergoes a transient step-like increase or decrease, respectively. After each transition, a steady-state is reached, the electron-hole pairs evolve adiabatically in their respective bands: a coherent superposition of states exists in the valence and the conduction bands and only the relative phase between the two states changes (here is the instantaneous bandgap energy). During each half-cycle the charged particles are subject to the oscillating laser electric field, change speed and move with their group velocities, cf. Fig. 3(g). The dispersion of the group velocity introduces characteristic transient features in the intra-band current: for instance at the times when the band curvature changes sign, electron-hole pairs decelerate and reduce their speeds. Thus for strong and low-frequency laser electric fields electrons have enough time to sense the static band structure and perform dynamical Bloch oscillations during each half-cycle of the driving pulse. Similarly, during each half-cycle the coherent superposition of states in the valence and the conduction bands creates a rapidly oscillating dipole, whose frequency increases with the increase of the field strength as the kinetic momentum reaches an edge of the Brillouin zone, cf. Fig. 3(h). These rare events occur during the half-cycle near the pulse peak, and result in emission of short-wavelength photons with energies near the cut-off energy.
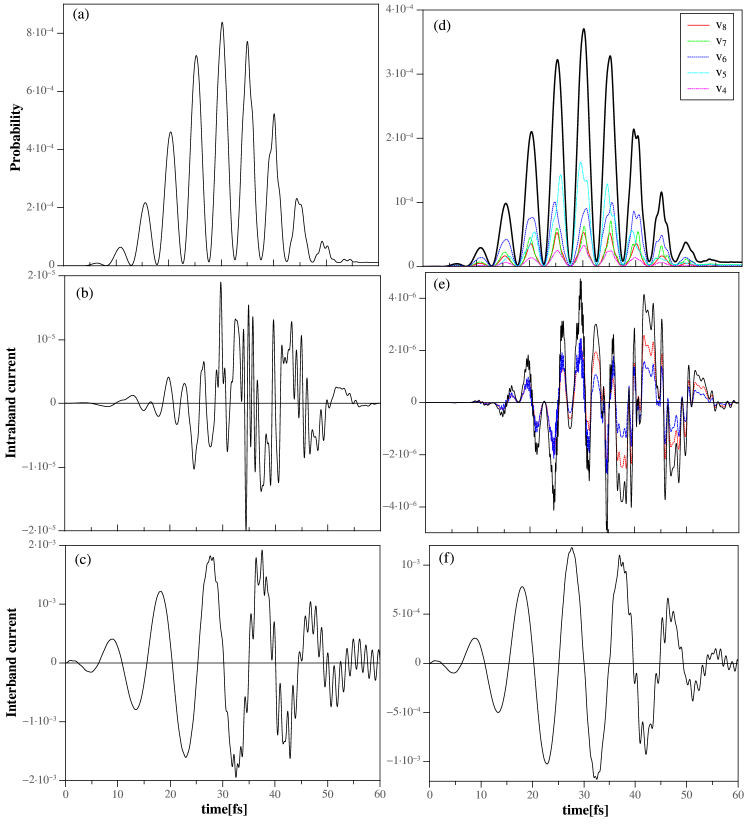
However, since the dipole coupling has a dispersion, cf. Figs.3(b,f), valence electrons with different initial crystal momentum , emerge in the conduction band at different times. The AC currents produced by electrons(holes) arriving in the conduction(valence) band at different times, and hence at different phases of the driving laser electric field, undergo destructive interference. Figs.4(a-c), show the temporal evolution of the probability for photo-ionization, and the coherently summed () intra- and inter-band currents arising from points in the BZ with initial momenta equidistantly spaced along the -axis. The destructive interference of currents produces a highly irregular intra- and inter-band line currents, consequently their power spectra lack clear harmonic structure (cf. below). The noisy temporal behavior of the intra-band current is primary a consequence of intra- and inter-cycle interferences in time. It is mainly for this reason, that two-band models of solid-state HHG routinely use phenomenological de-phasing times around an optical half-cycle in order to suppress intra- and inter-cycle interferences and hence to obtain clean harmonic spectra.
Similar results are found for laser polarized perpendicularly to the optical axis (the -axis), cf. Figs.4(d-f). Importantly however, multiple valence bands contribute to photo-ionization and the photo-current. The partial probabilities for photo-ionization of individual valence bands are small, but their collective response generates intense transient bursts as shown in Fig.4(d). This effect is because for the MIR laser wavelength, the static band structure of ZnO supports multi-photon resonances between multiple valence bands, cf. Fig.1. Initially transitions among these bands are blocked due to Pauli’s exclusion principle, but once valence bands at the top are weakly ionized by tunneling transitions into the conduction band, intense multi-photon transitions among the bottom and top valence bands intervene in the photo-ionization process. This is clealrly exhibited in the distinct sub-cycle dynamics of conduction electrons and valence band holes, as shown in Fig.4(e).
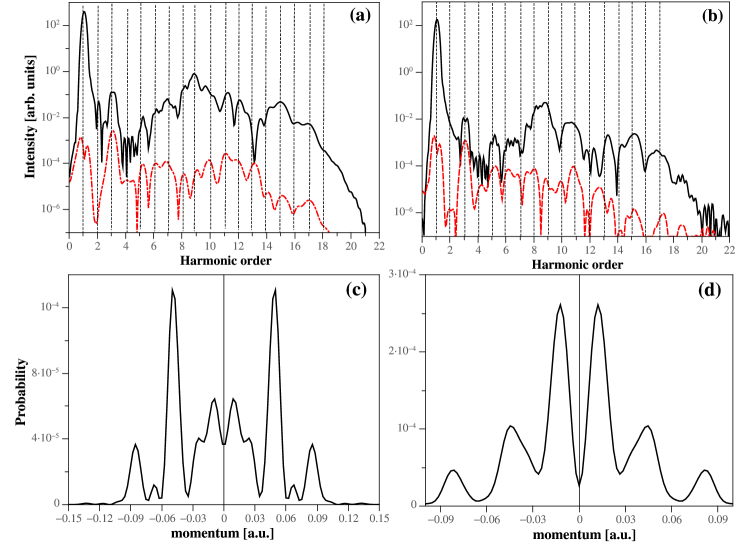
The corresponding HHG spectra resulting from photo-ionization for parallel and perpendicular laser polarization are compared in Figs.5(a,b). For the parallel polarization, the power spectrum of both intra- and inter-band currents is dominated by bremsstrahlung and lacks clear harmonic structure. For the perpendicular polarization, the inter-band current displays clear odd harmonic peaks below the absorption edge, the harmonic structure above the band edge is less well defined and consists of broad overlapping harmonic peaks on top of the continuous background. In both cases, the inter-band current is the dominant contribution to the photo-current. Figs.5(c,d) also present the probability for photo-ionization as a function of the initial crystal momentum . For the parallel polarization, photo-ionization creates electron-hole pairs in a wide range of crystal momenta, the photo-electron yield is structured by sharp peaks associated with above-threshold ionization (ATI). Thus in the non-perturbative regime (when the ponderomotive energy of an electron-hole pair of reduced effective mass is comparable to the photon energy), ATI electrons emerge in the conduction band from a broad range of crystal momenta, and the associated HHG spectra are blurred.
III.3 Main results
Detailed numerical calculations were made for laser intensities in the range W/cm2. The laser polarization direction was set either parallel or perpendicular to the optical axis of the crystal. The full three-dimensional Brillouin zone was sampled by a homogeneous Monkhorst-Pack mesh. Because of severe destructive interference of photo-currents, dense sampling of the Brillouin zone was made. Typically, a mesh with reproduces well the main features in the temporal response of electron-hole pairs. The number of conduction bands included in the expansion of the time-dependent wave-functions over static Bloch orbitals is also an important convergence parameter. To obtain good quantitative agreement with the experiment, the eight valence bands together with the lowest in energy eight conduction bands were included in the expansion.
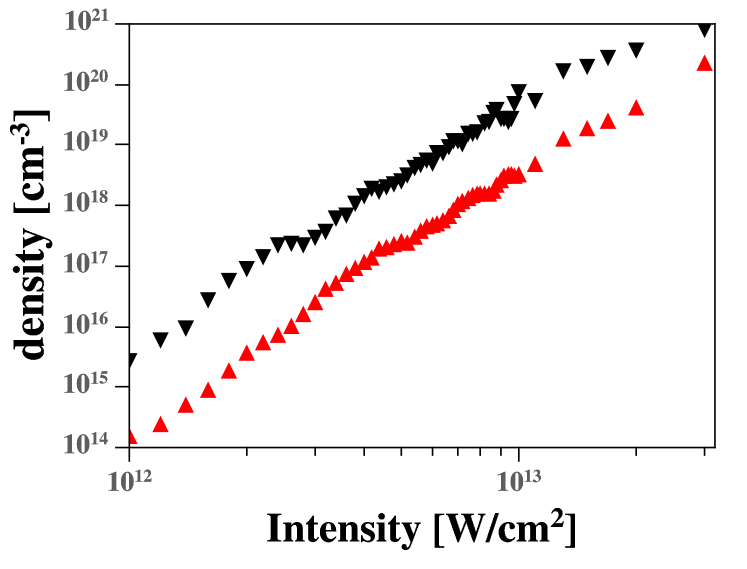
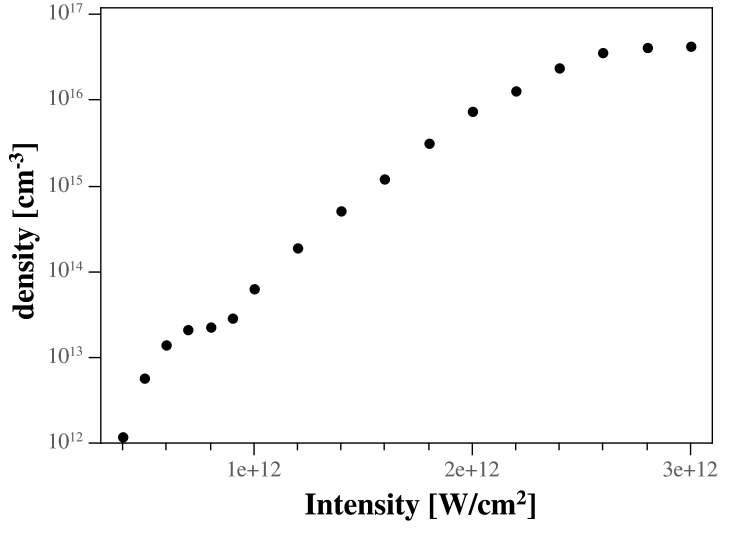
In Fig. 6, the conduction electron density after the conclusion of a 60fs MIR laser pulse is shown as a function of the laser intensity at the pulse peak, the laser is linearly polarized along the optical axis. In a model including the two lowest in energy conduction bands, screening of the laser electric field with dielectric constant results in high level of electronic excitation, cf. also Fig.2(a,b). After including the contributions of the eight lowest in energy conduction bands, the static dielectric constant increases to , and the probability for photo-ionization reduces by nearly two orders of magnitude. The photo-electron yield depends sensitively on the screening parameter, because tunnel transitions are exponentially damped by increasing as follows from the Keldysh formula for the probability of a transition
| (17) |
In the non-perturbative regime, the two curves in Fig. remain parallel, the plasma density follows a super-linear scaling trend with .
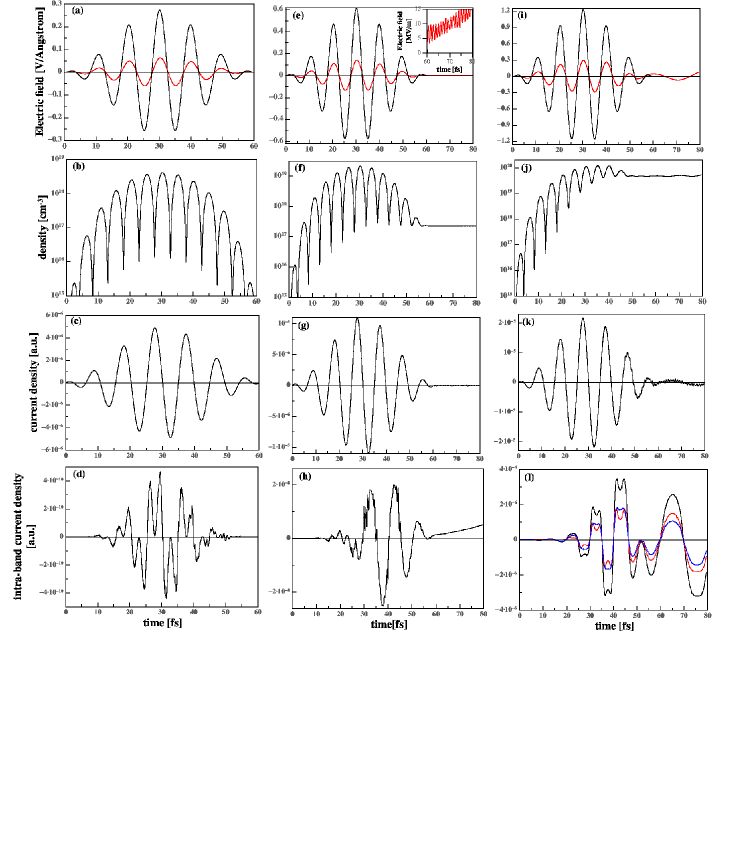
The time-evolution of the electric field of the pulse transmitted in the bulk of ZnO, the conduction electron density and the photo-currents are shown in Figs.7(a-l). The time-dependent conduction electron density is presented in the adiabatic basis of states and is given by the Brillouin zone integral
| (18) |
the associated intra-band current is
| (19) |
Three representative peak laser intensities were chosen W/cm2 in (a-d), W/cm2 in (e-h) and W/cm2 in (i-l). Dense mesh with -points was used. For the lowest laser intensity shown, Figs.7(a-d), the dielectric response of ZnO is exhibited, the pulsed electric field is screened inside the bulk with . Ionization bursts occur near the peaks of the oscillating laser electric field and produce an oscillating plasma density distribution. The density of real electron-hole pairs does not exceed 1016 cm-3 at the pulse peak. Re-combination of charge carriers occurs in the trailing edge of the pulse, thereby reducing their number by nearly two orders of magnitude; a low-density plasma with density 1014 cm-3 is established after conclusion of the pulse. In the weakly ionized plasma, when linear response of bulk ZnO is dominant, the photo-current closely follows the temporal oscillations of the laser vector potential. The sub-cycle dynamics of conduction electrons and valence band holes is clearly exhibited in the transient profile of the intra-band current, which displays regular repeating pattern of non-adiabatic events.
For the increased laser intensity, Figs.7(e-h) the dielectric screening response of electrons remains dominant. After the pulse ends, interference in time of transitions from all half-cycles manifests in creation of a quasi-DC polarization and internal electric field with intensity of few MV/m. This quasi-DC field is sufficiently weak to produce post-pulse ionization of the pumped solid. The time-dependent conduction electron density in Fig.7(e) builds-up rapidly in a series of tunneling transitions. A steady state plasma is established at the conclusion of the pulse with density exceeding cm-3; electron-hole pairs born in a superposition of states evolve adibatically in their respective bands after the end of the pulse. In a high-density plasma, the sharp transient features of the intra-band current is blurred due to severe inter- and intra-cycle interferences in time, cf. Fig.7(h). In the post-pulse evolution, charge carriers respond to the residual quasi-DC electric field inside the bulk, increase their speed in conduction/valence bands and slowly drift in the field.
For the highest field strength shown, Figs. 7(i-l) non-adiabatic transitions become intense and manifest in collective plasmonic oscillations of the electron gas after the end of the pulse. The conduction electron density reaches cm-3 at the pulse peak, shortly afterwards photo-ionization tends to saturate. The movement of charged particles in their respective bands and dynamical Bloch oscillations are clearly exhibited in the temporal profile of the intra-band current near and after the pulse peak, cf. Fig.7(l). In this regime, accelerated charge carriers create a self-sustained plasmonic electric field, which is sufficiently strong to produce ionization bursts in the post-pulse evolution. Thus on a longer time scale, the self-electric field releases more electrons which join the photo-electrons that are already present in the conduction band. Thus electron avalanche occurs that eventually leads to optical breakdown of ZnO, as also observed in the experiment of Ghimire.
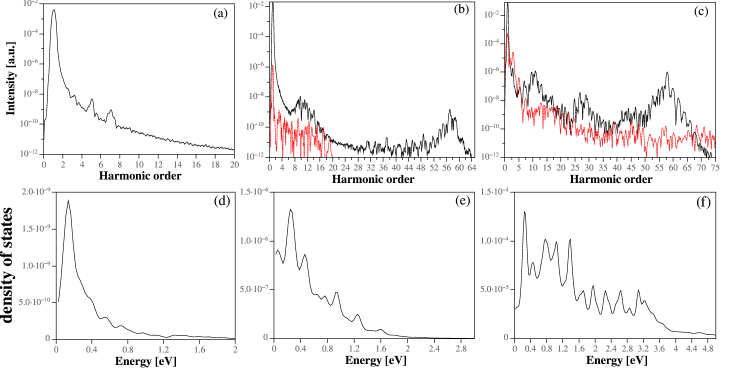
The HHG spectra corresponding to the three different laser intensities discussed above are shown in Figs.8(a-f), together with the density of occupied conduction band states after the conclusion of the pulse. In the regime of weakly ionized plasma, the majority of photo-electrons emerge in the conduction band with energies near threshold. In this regime of weakly ionized plasma, the power spectrum of the photo-current exhibits distinct odd-order harmonic peaks below the band edge.
For increased field strength with V/Å, the probability for non-adiabatic transition increases, the HHG spectrum of the total phot-current is dominated by a continuous bremsstrahlung-like radiation, which lacks harmonic structure, except for photon-energies close to the cutoff energy. In this regime, the density of occupied conduction electron states extends to higher energies and is structured by series of ATI peaks, approximately separated by one-photon energy. Inter- and intra-cycle interferences in time blur the associated HHG spectra.
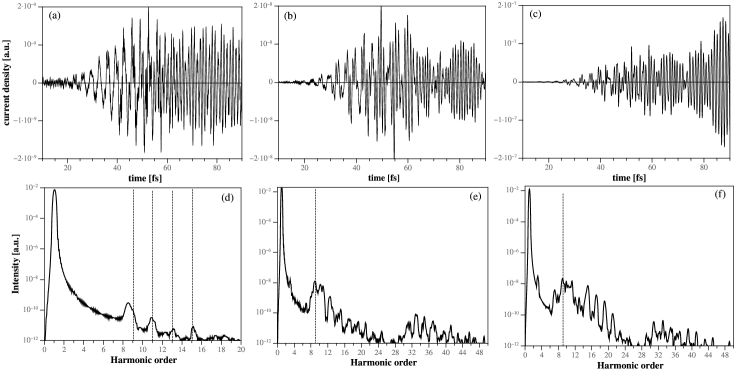
For the perpendicular laser polarization, the non-adiabatic response of conduction electrons and valence band holes manifests in HHG. In order to reproduce the conditions in the ZnO experiment, the pulse length was increased to 90fs and the laser intensity was varied in the range W/cm2. For the considered laser intensity range, photo-ionization creates weakly ionized plasma of electron-hole pairs with density below cm-3, Fig.9. In this regime, the majority of photo-electrons emerge in the conduction band with energies close to threshold, small fraction of ATI electrons emerge with very high energies from initial states with crystal momentum near the BZ centre. The inter-band mechanism due to collective response of multiple valence and conduction bands is dominant for HHG in the whole range of laser intensities, cf. Figs.10(a-c). The corresponding HHG spectra in Figs.10(d-f) are structured by clean odd-order harmonic peaks extending beyond the band edge, in very good quantitative agreement with the experiment. The conversion efficiency of HHG in ZnO is low and it does not exceed . Similarly to the experiment, the spectral intensity of individual harmonics depends in highly non-linear way on the laser intensity, irrespective on the harmonic order. However there is also a noticeable difference: inter-band transitions associated with ATI electrons extend the frequency comb beyond 27-th order. On account of this high-energy effects, the cut-off energy for HHG shifts to 49th order when TW/cm2. High order harmonics beyond 27th order were not observed in the ZnO experiment, which may be due to re-absorption of the generated UV photons.
IV Conclusion
In summary, the non-adiabatic response of electrons and valence band holes associated with high harmonic generation in zinc oxide subjected to intense femtosecond mid-infrared laser pulse was investigated in a wide range of laser intensities. For laser intensities below threshold for avalanche breakdown of ZnO, we find that HHG is strongly affected by peculiarities of the multiple band structure of the pumped solid. We find that the sub-cycle response of multiple electronic bands results in intense inter-band current responsible for the high-harmonic emission process. This inter-band mechanism is weakly dependent on the static band structure of ZnO, it mainly reflects the time-dependent characteristics of photo-ionization and photo-excitation process in a non-equilibrium plasma of electron-hole pairs. To achieve good semi-quantitative agreement with the experiment, it was not necessary to assume relevance of ultra-fast de-phasing process. With account of realistic multiple band structure of the solid, our theoretical HHG spectra display clear odd harmonic structure as observed in the ZnO experiment. We hope this paper may stimulate further investigations on multiple band effects on high harmonic generation in solids.
Appendix
The matrix representation of the time-dependent Hamiltonian in static Bloch state basis can be written as
| (20) |
where is a diagonal matrix of the instantaneous eigen-energies, labels the total number of valence and conduction electron bands, and the overlap matrix of transformation between the fixed and moving bases is given by
| (21) |
Only for an infinite-dimensional Hilbert space, the overlap matrix is unitary. However in practice a finite-dimensional subspace of Bloch states is used in the computation, thus the unitarity of the overlap matrix is broken, such that the Hamiltonian is no longer Hermitian. To obtain an unitary approximation for the overlap matrix, to each -point we associate an open string of closely spaced in kinetic momentum points . The arc-length of the string is (in units of ), and is the Bloch oscillation frequency. The overlap matrix can be expressed as a product of overlap matrices between adjacent points
| (22) |
Each overlap matrix was subjected to the singular-value decomposition , where is a diagonal matrix of the singular values, and and is a pair of unitary matrices associated with the basis transformation between two adjacent points. The singular values are real and measure the incompleteness of the computational basis of Bloch states at a given point, and typically they all deviate slightly from unity. Thus an unitary approximation to the overlap matrix is made by , which establishes the connection between the Bloch states at the two nearby points and on the string. Thus the full overlap matrix is approximated by a product of unitary matrices
| (23) |
and thereby the Hermitian property of the time-dependent Hamiltonian is restored. During this procedure, one has to carefully take into account that initially unoccupied conduction bands are connected, and at some points in the Brillouin zone, these bands become degenerate in energy, so that the matrix of singular values is ill-defined at these points. When a degeneracy between conduction bands occurs, the local dimension of the computational basis set at a given canonical quasi-momentum -point was increased to accommodate one more band, the procedure is stopped and resumed with larger computational basis, until the matrix of the singular values becomes regular and close to the unit matrix at all points on the string.
At the end of this procedure, a family of Hamiltonians is obtained. Given the set , the actual time-dependent Hamiltonian was obtained by cubic spline interpolation from the kinetic momentum mesh points . Next we propagate the initially occupied valence electron states forward in time be applying the Cayley transformation for small equi-distant time steps according to
| (24) |
the photo-induced current is calculated from the Brillouin zone integral according to Eq.(12) and finally the induced electromagnetic gauge vector potential is updated
| (25) |
References
- (1) S. Ghimire, A. D. DiChiara, E. Sistrunk, P. Agostini, L. F. DiMauro and D. A. Reis, Nature Phys. 7, 138 (2011).
- (2) T. T. Luu, M. Garg, S. Yu. Kruchinin, A. Moulet, M. Th. Hassan and E. Goulielmakis, Nature 521, 498 (2015).
- (3) O. Schubert, M. Hohenleutner, F. Langer, B. Urbanek, C. Lange, U. Huttner, D. Golde, T. Meier, M. Kira, S. W. Koch and R. Huber, Nature Photon 8, 119–123 (2014).
- (4) M. Hohenleutner, F. Langer, O. Schubert, M. Knorr, U. Huttner, S. W. Koch, M. Kira and R. Huber, Nature 523, 572 (2015).
- (5) G. Vampa, C. R. McDonald, G. Orlando, D. D. Klug, P. B. Corkum and T. Brabec, Phys. Rev. Lett. 113, 073901 (2014).
- (6) G. Vampa, T. Hammond, N. Thiré, B. Schmidt, F. Légaré, C. McDonald, T. Brabec, and P. Corkum, Nature 522, 462–464 (2015).
- (7) L. Yue and M. Gaarde, Phys. Rev. A 101, 053411 (2020).
- (8) M. Lewenstein, P. Balcou, M. Y. Ivanov, A. L’Huillier, and P. B. Corkum, Phys. Rev. A 49, 2117 (1994).
- (9) K. J. Schafer, B. Yang, L. F. DiMauro, and K. C. Kulander, Phys. Rev. Lett. 70, 1599 (1993).
- (10) P. B. Corkum, Phys. Rev. Lett. 71, 1994–1997 (1993).
- (11) I. Floss, C. Lemell, G. Wachter, V. Smejkal, S. A. Sato, X-M. Tong, K. Yabana, and J. Burgdörfer, Phys. Rev. A 97, 011401(R) (2018).
- (12) G. Orlando, T.-S. Ho, and S.-I. Chu, J. Opt. Soc. Amer. B 37, 1540 (2020).
- (13) D. Freeman, A. Kheifets, S. Yamada, A. Yamada, and K. Yabana, Phys. Rev. B 106, 075202 (2022).
- (14) T. Tamaya, A. Ishikawa, T. Ogawa, and K. Tanaka, Phys. Rev. Lett. 116, 016601 (2016).
- (15) G. Hawkins, M. Y. Ivanov, and V. S. Yakovlev, Phys. Rev. A 91, 013405 (2015).
- (16) M. Wu, S. Ghimire, D. A. Reis, K. J. Schafer, and M. B. Gaarde, Phys. Rev. A 91, 043839 (2015).
- (17) Z. Guan, X.-X. Zhou, and X.-B. Bian, Phys. Rev. A 93, 033852 (2016).
- (18) F. Navarrete, M. F. Ciappina, and U. Thumm, Phys. Rev. A 100, 033405 (2019).
- (19) M. Cohen, T. K. Bergstresser, Phys. Rev. 141, 789 (1966).
- (20) M. Sclütter, J. R. Chelikowsky, S. G. Louie, and M. L. Cohen, Phys. Rev. B 12, 4200 (1975).
- (21) W. J. Fan, A. P. Abiyasa, S. T. Tan, S. F. Yu, X. W. Sun, J. B. Xia, Y. C. Yeo, M. F. Li, T. C. Chong, J. Cryst. Growth 287, 28–33 (2006).
- (22) D. J. Passos, G. B. Ventura, J. M. Viana Parente Lopes, J. M. B. Lopes dos Santos, and N. M. R. Peres, Phys. Rev. B 97, 235446 (2018).
- (23) J. E. Sipe, E. Ghahramani, Phys. Rev. B 48, 11705 (1993).
- (24) C. Aversa and J. E. Sipe, Phys. Rev. B 52, 14636 (1995).
- (25) T. Apostolova, B. Obreshkov, I. Gnilitskyi, Appl. Surf. Sci. 519, 146087 (2020).
- (26) J. C. Phillips, Phys. Rev. Lett. 20, 550 (1968).
- (27) F. Brunel, J. Opt. Soc. Am. B 7 (4), 521 (1990).
- (28) M. Protopapas, D. G. Lappas, C. H. Keitel, and P. L. Knight, Phys. Rev. A 53, R2933 (1996).