1191 \vgtccategoryResearch \vgtcpapertypealgorithm/technique \authorfooter Furui Cheng, Vilém Zouhar, Robin Shing Moon Chan, and Mennatallah El-Assady are with ETH Zurich. E-mails: {furui.cheng, vzouhar, robin.chan}@inf.ethz.ch, menna.elassady@ai.ethz.ch Daniel Fürst is with University of Konstanz. E-mail: daniel.fuerst@uni.kn Hendrik Strobelt is with IBM Research. E-mail: hendrik.strobelt@ibm.com
Interactive Analysis of LLMs using Meaningful Counterfactuals
Abstract
Counterfactual examples are useful for exploring the decision boundaries of machine learning models and determining feature attributions. How can we apply counterfactual-based methods to analyze and explain LLMs? We identify the following key challenges. First, the generated textual counterfactuals should be meaningful and readable to users and thus can be mentally compared to draw conclusions. Second, to make the solution scalable to long-form text, users should be equipped with tools to create batches of counterfactuals from perturbations at various granularity levels and interactively analyze the results. In this paper, we tackle the above challenges and contribute 1) a novel algorithm for generating batches of complete and meaningful textual counterfactuals by removing and replacing text segments in different granularities, and 2) LLM Analyzer, an interactive visualization tool to help users understand an LLM’s behaviors by interactively inspecting and aggregating meaningful counterfactuals. We evaluate the proposed algorithm by the grammatical correctness of its generated counterfactuals using 1,000 samples from medical, legal, finance, education, and news datasets. In our experiments, 97.2% of the counterfactuals are grammatically correct. Through a use case, user studies, and feedback from experts, we demonstrate the usefulness and usability of the proposed interactive visualization tool.
keywords:
Explainable machine learning, counterfactual, large language model![[Uncaptioned image]](/html/2405.00708/assets/x1.png)
LLM Analyzer enables LLM practitioners and users to analyze and understand LLM behaviors using meaningful counterfactuals. From the user’s input prototype sentences, such as a medical question in this example, the system generates meaningful segments for perturbation. (A) Users can interactively adjust their granularities and specify alternative segments for replacements, which are then used by the system to create meaningful counterfactuals. The system enables users to analyze the LLM by inspecting and interactively aggregating the counterfactual examples in a table-based visualization. (B) The table header shows the segments’ text, dependencies, and feature attributions. (C) By grouping the counterfactuals by segments of interest, users can assess their joint influence on the predictions. (D) Through concrete counterfactual examples, users finally validate their findings.
1 Introduction
Counterfactual reasoning allows humans to build a causal understanding of the physical world by mentally inferring and comparing consequences from hypothetical scenarios—asking “what-if” questions [14].
This human reasoning process inspired the design of explainable artificial intelligence (XAI) techniques [42]. Counterfactual explanations interpret a model’s prediction by finding the minimal perturbation required to change the prediction [40]. Additive feature attribution methods, like LIME [33] and KernalSHAP [21], perturb the input features (i.e., create counterfactuals), test model responses, and aggregate the results to quantify features’ contributions to the prediction. These counterfactual- or perturbation-based methods help model users and developers assess the model’s capabilities for concrete tasks while identifying model vulnerabilities for refinement.
Large Language Models (LLMs) are the most complex AI systems humans have created. They have shown impressive capabilities of following and responding to complex textual instructions [31]. Their performance comes at the cost of complex and non-linear boundaries. Consequently, users understand very little about how LLMs arrive at their decisions and generations. Although LLMs can produce coherent and persuasive text, they may be inaccurate or unfaithful to the given context [13] or biased towards protected attributes, such as ethnicity or gender [28]. To properly assess and safely apply them in critical areas, it is crucial to support users in understanding LLM behaviors.
In this paper, we explore the use of counterfactuals to help LLM users and practitioners analyze and understand LLMs’ text-generation behaviors. We start by reviewing existing counterfactual and perturbation-based explanation methods and discussing their applicability to LLMs, where we identified the following three challenges.
-
C1
Counterfactuals should be meaningful and comparable. Counterfactual analysis relies on mental comparisons between counterfactuals and original instances, requiring the textual counterfactual to be understandable and easy to compare. However, arbitrarily removing and replacing words in a sentence may lead to incomplete and meaningless text. How can we regulate the counterfactual generation process to guarantee completeness and comparability to the prototype sentence?
-
C2
Perturbing text in different granularities is desired. LLM inputs can be in long-form and information-enriched. A single perturbation granularity (token-level or sentence-level) is not efficient in all situations. How can we enable users to perturb text in different granularities to gain different levels of understanding?
-
C3
One explanation does not fit all. One type of XAI technique cannot answer all questions. For example, additive feature attributions explain how individual features influence outcomes but do not reveal interactions between features. How can we connect different types of explanations to offer users a better comprehension of LLMs?
These challenges motivate us to take a user-driven approach. We support users in creating meaningful textual counterfactuals via perturbations in different granularities and interactively analyzing them to gain LLM comprehension and insights.
Counterfactual Generation. We propose an efficient counterfactual generation method that produces grammatically correct and syntactic-structure-preserved counterfactuals (C1). We leverage the dependency structure of the text to segment the text into meaningful parts for removal and replacements (the two elementary operations for perturbations) and generate rules to create only complete sentences from the perturbations. Users can customize the granularity (phrases, clauses, sentences) of the meaningful segments to perform removal (C2) and define alternatives for replacement. We evaluate the proposed algorithm using 5,000 sentences sampled from five datasets of different domains. On average, our algorithm generates 46 removal-only counterfactuals from each sentence, which takes less than a second. And 97.2% of generated counterfactuals are grammatically correct, which proves the efficiency and effectiveness of the proposed algorithm.
Counterfactual Analysis. Example-based explanations (e.g., counterfactual explanations) and aggregation-based explanations (e.g., LIME [33], Anchor [34]) complement each other and together provide a thorough understanding of the ML model. Driven by this idea, we propose LLM Analyzer, an interactive visualization tool to support model users and practitioners in analyzing LLMs using counterfactuals. We design and implement a table-based visualization that allows users to inspect concrete counterfactuals, view additive attributions for each segment, and interactively aggregate counterfactuals by segments of interest to assess their joint influence on model responses (C3). We demonstrate using the proposed visualizations to support the typical usage workflow through a use case (Interactive Analysis of LLMs using Meaningful Counterfactuals).
In addition to the algorithm experiments and the use case, we evaluate the usability and usefulness of the proposed visualization tool through a user study with ten non-expert participants and interviews with six XAI and NLP experts. In the user study, we created a list of seven questions from the user tasks in the proposed workflow. Most of the participants successfully completed the given tasks. They provided positive feedback in terms of usefulness and usability, suggesting that the system is capable of supporting the proposed workflow and is useful in helping people understand LLMs. Through qualitative feedback from both non-expert users and experts, we further discuss the implications, applicability, and limitations of the system.
The major contributions of this study include:
-
•
A novel algorithm for generating grammatically correct and syntactic-structure-preserved textual counterfactuals via removing and replacing text segments in different granularities.
-
•
LLM Analyzer, an interactive visualization tool to support LLM practitioners and users in understanding LLMs by analyzing meaningful counterfactuals.
-
•
Evaluations, including a case study, user studies, and expert interviews that demonstrate the usefulness and usability of LLM Analyzer.
2 Background and Related Work
In this section, we introduce the background of this study and review existing studies related to the definition, usage, and generation of counterfactuals and alternative methods in explaining LLMs.
2.1 Definition and Usage of Counterfactuals in ML
Counterfactuals are an essential concept in causal reasoning and analysis, which means hypothetical “what-if” conditions [32, 19, 26, 41]. People use counterfactuals to assess causations by mentally simulating the outcomes under counterfactual conditions and comparing them with the factual results. This cognitive process is known as counterfactual assessments or counterfactual reasoning [14].
This concept of counterfactuals has been applied and extended in the machine learning field [40] as a technique for model training, assessments, and explanations. In existing ML-related counterfactual studies, researchers have proposed two different definitions of counterfactuals.
Wachter proposed the concept of counterfactual explanations [40], sometimes also called counterfactuals, which describes the minimal perturbations to the model input required to alter the model prediction. Counterfactual explanations are widely used. For novice users, they are intuitive and understandable When people are influenced by the model’s decisions, counterfactual explanations can suggest required actions to get the desired outcome (e.g., increase the monthly income by $500 to get your loan request approved) [16, 40]. These two desired properties incentivize the development of tools that generate diverse counterfactuals [27] and guide users to find actionable ones [11, 45]. For ML practitioners, counterfactual explanations are useful tools to probe the model’s decision boundaries, which inspired the development of visualization tools, including the What-If Tool [46] and DECE [3].
In the natural language processing (NLP) field, the definition of counterfactuals is more general. A counterfactual is defined as a variation or perturbation from the prototype sentences, which is independent of the model [47]. Usually, the generated counterfactual should be close and comparable to the original text. These general-purpose counterfactuals are commonly used to augment datasets [17], evaluate NLP models [10, 35], and explain models [48].
In this paper, we use the second definition, where each counterfactual example is defined as a variation of the input text. Using counterfactuals, we support users in accessing different explanations for the LLM, namely, counterfactual explanations, feature attributions, and anchors.
2.2 Generate Counterfactuals from Text
Counterfactuals are created using different criteria and methods depending on the concrete usage scenario. In the most common usage scenarios, model assessments, a counterfactual is usually generated by modifying one (semantic) factor while keeping the others constant. The definition of such a factor can be very broad, from negations, quantifiers, and entities to the gender of the people included in the sentence. The goal of generating these counterfactuals is to test the specific perspectives of the model’s capability [35].
The usage of the counterfactuals is based on certain heuristics. For example, through negation, the generated counterfactual should lead to a different prediction; otherwise, the model is problematic as it does not behave as expected. The model prediction should also be invariant to gender or race perturbations; otherwise, the model is biased. By employing these counterfactuals and heuristics, NLP researchers can conduct “sanity checks” to evaluate the model’s performance [35] and identify shortcuts used by the model [24].
In early studies, these counterfactual datasets are created manually [17], e.g., through crowd-sourcing, which is time-consuming. Then, NLP researchers propose methods to automate this process by using templates [35] or language models to generate meaningful perturbed text [22, 36]. For example, Polyjuice [47] uses a fine-tuned GPT-2 model for controllable counterfactual generation.
These semantic perturbing counterfactuals have proven useful in model evaluations. However, they cannot fully support explanation scenarios since they are narrow—they only differ from the prototype sentence in certain predefined directions. For example, using counterfactuals generated by negation, users can only assess and understand the model’s behaviors regarding capturing negation. So unless we identify all factors interesting to users (e.g., entities, polarities, relationships, and many more) and perturb the sentences by changing these factors one by one, we cannot provide users with a thorough understanding.
In this study, we explore generating counterfactuals for explanations. We start with generating removal-only counterfactuals, which are commonly used in feature attribution algorithms, such as LIME [33] and KernelSHAP [21]. We aim to generate all valid syntax-structure-preserved and meaningful counterfactuals using removal. During this process, we partition the text into meaningful segments, which are then used as the elementary interpretable components [33] for explanations. Then we extend the method to more general settings by considering segment-level replacements.
2.3 Interactive Visualizations for Understanding LLMs
Visualizations play an essential role in explaining language models [1]. Existing methods can be categorized by their generalizability into model-agnostic and model-specific approaches.
Most existing language-model-oriented visualization tools target supporting professional users (e.g., ML developers) to look into the model’s inner structure for understanding and debugging [25, 38, 37, 39, 44]. RNNVis [25] uses a bipartite graph to help users understand the function of hidden state units in a recurrent neural network. LSTMVis [38] visualizes the dynamic of the neuron activations in an LSTM model to help users find activation patterns for analysis and debugging. Various existing approaches visualize the attention layers of transformer models for explanations [44, 37, 39]. Seq2seq-Vis [37] visualizes the attention and other modules within a sequence-to-sequence model to help users identify the failing part. To apply these model-specific approaches, we usually need to probe the language model’s layer-wise outputs, which is not feasible in today’s commercial models like GPT-4. Besides, when the language model’s number of parameters and layers increases, understanding its inner mechanism becomes challenging.
Model-agnostic approaches, on the other hand, are more generally applicable. Such approaches usually focus on probing model behavior using input variations [46, 5, 15]. Existing work uses feature attribution methods to quantify each word’s contribution to prediction and visualize them using a heatmap [43, 6]. KnowledgeVIS [5] enables users to interactively explore LLM using fill-in-the-blank prompts. LLM Comparator [15] supports users to compare LLM outputs side-by-side.
We take a model-agnostic approach to help LLM users and practitioners to gain model understanding. We propose a table-based visualization with aggregation interactions to help users explore counterfactuals and connect example-based explanations, feature attributions, and anchors to understand the LLM’s behaviors.
3 Problem Formulation
How can we use counterfactuals to analyze and explain LLMs? In this section, we elaborate on this central research question and discuss the key challenges, starting with a review of existing counterfactual and perturbation-based XAI methods.
3.1 Use Examples to Understand LLMs
![[Uncaptioned image]](/html/2405.00708/assets/x2.png)
Counterfactual explanations [27, 40] are one of the most commonly used example-based explanation methods. They are defined as counterfactuals with a minimal difference from the original instance and leading to a different prediction. Counterfactual explanations help users understand the model’s decision boundaries by suggesting the minimal changes required to alter the prediction [3], e.g., “After increasing your monthly income by $500, the credit assessment model will change the prediction to positive and accept your request.”
Counterfactual explanations are an intuitive and effective model probing method, but it is not easily applicable to text data. To make the explanations comprehensible to humans, the generated counterfactual examples should be meaningful and comparable to the original input. However, by arbitrarily removing and replacing words, we may get incomplete sentences, which are meaningless in most situations. Even though sometimes the sentences are grammatically correct, they may be far diverging from the original input in terms of both syntactic structures and semantics, making them hard to interpret for users.
The above challenge motivates the first part of this study (Section 4), where we target generating meaningful and comparable counterfactuals from the text. We use grammatical correctness to measure the meaningfulness of the generated sentences and assure comparability by preserving the syntax structure of the sentences.
3.2 Aggregate Counterfactuals for Precise Explanations
For another set of counterfactual- or perturbation-based methods, the purpose is not limited to creating examples but to use these perturbations to quantify the influences of the features on the model output. These methods can be categorized into two types: measuring each feature’s contribution to the prediction separately, known as additive explanations [21] and measuring feature interactions—how multiple features jointly influence the prediction (e.g., by using rules) [34]. In this section, we review representative methods in the above two categories, removal-based additive feature attribution methods [7] (represented by LIME [33]) and anchor [34] (high precision explanations using rules), and discuss their applicability in LLMs.
![[Uncaptioned image]](/html/2405.00708/assets/x3.png)
Additive feature attribution methods are a set of XAI techniques that use a linear (additive) model to explain an ML model’s local behaviors [21]. Among all attribution methods, removal-based methods [7] are the most widely used because they are model-agnostic—requiring no assumption of model structure and applicable to any ML model. LIME (Local Interpretable Model-agnostic Explanations) [33] is a general removal-based attribution framework that uses a linear surrogate model to approximate the target ML model’s local behavior. Lundberg et al. systematically discuss the desired properties of the linear surrogate model and proposed KernelSHAP, a model-agnostic SHapley Additive Explanation (SHAP) method [21] based on LIME.
![[Uncaptioned image]](/html/2405.00708/assets/x4.png)
The Anchor [34] method uses rules to find “sufficient” conditions for model prediction, e.g., if the values of certain features are fixed, no matter how other features change, the model will always give the same prediction. The calculation of Anchor is also based on perturbations, where it samples around the target instance to find the “sufficient” conditions. Compared with additive attributions, the Anchor communicates features’ joint influence on the prediction and uses intuitive rules.
Theoretically, LIME and Anchor are model-agnostic approaches and thus can be directly applied to analyze LLMs. However, these methods have exponential time complexity regarding the number of features. By treating the words in the text as features and sampling all combinations, the computational time is not affordable for long-form text. In some related work, like PartitionSHAP, the words are divided into groups according to statistical properties to reduce the time cost. However, these methods cannot guarantee the meaningfulness of the text segment, which harms the comprehensibility of the explanations. And a unified granularity of text segments may not fit all situations. This challenge has inspired us to explore segmenting and perturbing text in different granularities (e.g., by removing words, phrases, clauses, and sentences) (Section 4) and enable users to customize this process (Section 5).
3.3 Connect Example-based and Aggregated Explanations
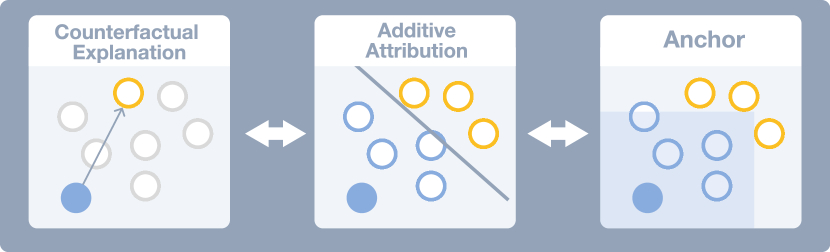
Counterfactual explanations, additive attributions, and anchors help users understand the ML predictions from different perspectives. A single type of explanation cannot answer all users’ questions. Counterfactual explanations uncover influential features; however, the magnitude of the influence is difficult to quantify and compare by inspecting only examples. Additive attribution methods tackle the above limitation but fail to reveal the interactions between features. For example, if the model follows the rule, “When the patient has the two symptoms (i.e., features) simultaneously, the situation is much more severe than having only one symptom,” it cannot be represented using an additive model. Anchors are more precise and user-friendly explanations concerning interactions between features. However, not all anchors provide helpful insights, e.g., anchors far from the decision boundaries. In these cases, counterfactual explanations can be used to find and validate anchors [3]. One type of explanation does not fit all situations, but different kinds of explanations can complement each other and together provide a thorough comprehension of the ML model (Figure 1).
In the second part of this study (Section 5), we investigate interactively connecting the above three types of explanations (counterfactual explanations, attributions, and anchors) to offer users a better understanding of LLMs.
3.4 Workflow and User Tasks
In the last part of the section, we concretize the design problems by discussing the analytical tasks in counterfactual-assisted LLM analysis. In this study, we aim to support both LLM users and practitioners in analyzing LLMs. Based on the discussions in prior sections, we propose an analytical workflow composed of the following user tasks.
-
T1
Create and customize batches of meaningful counterfactuals. The starting point of conducting a counterfactual-based analysis is to define the scope of the desired counterfactuals, which includes selecting a proper granularity (e.g., words, phrases, sentences) to perform perturbations and customizing the perturbation rules, e.g., fixing some sentences and replacement some segments with alternatives. Afterward, users apply the tool to sample batches of meaningful counterfactuals for further analysis.
-
T2
Explore the counterfactual collection. After getting the counterfactual collections and corresponding LLM responses, users need to gain an overall understanding of this data collection by interactive exploration. Users may want to locate and inspect concrete counterfactual examples during the explorations to understand how specific perturbations may influence the LLM response.
-
T3
Understand how individual segments influence the generation. After the exploration, users investigate the feature attribution calculated using the counterfactuals to identify important text segments. Users compare the additive explanations with their assumptions from prior knowledge, where the misalignments may indicate potential model failures.
-
T4
Assess how segments jointly influence the generation. To gain a more precise understanding of the LLM’s local behaviors, users assess how multiple segments together influence the model responses. Users select the important segments identified by the attribution algorithms or according to their prior knowledge and group all counterfactuals by these segments’ occurrence. By inspecting each group, users can gain a precise understanding of these segments’ influence on the model response.
-
T5
Search counterfactual examples to validate findings. During the analysis, users also use concrete examples to help them gain a vivid understanding of the model’s behavior. From the examples, users can form new hypotheses about the segments’ joint influence, e.g., a combination of some segments is sufficient to make consistent predictions and move back to the last task to test them.
The users may perform the above process multiple times by conducting the analysis with different counterfactual generation settings (the granularity and text for replacement). From the above workflow, users can narrow the gaps between their mental model of how the LLM performs the prediction task and the actual model behaviors. It allows users to assess the LLM’s (local) capability in the concrete task defined by the prompt and identify misalignment with their knowledge, which suggests model failures.
4 Generating Meaningful Counterfactuals
In this section, we present the pipeline of the proposed algorithm and an evaluation with five datasets from different domains.
4.1 Algorithm Pipeline
We propose the following algorithm that takes a sentence as input and outputs meaningful counterfactuals. The computational pipeline contains three stages: parsing, simplification, reconstruction, and supports user customizations for specifying the granularities and defining text for replacements.
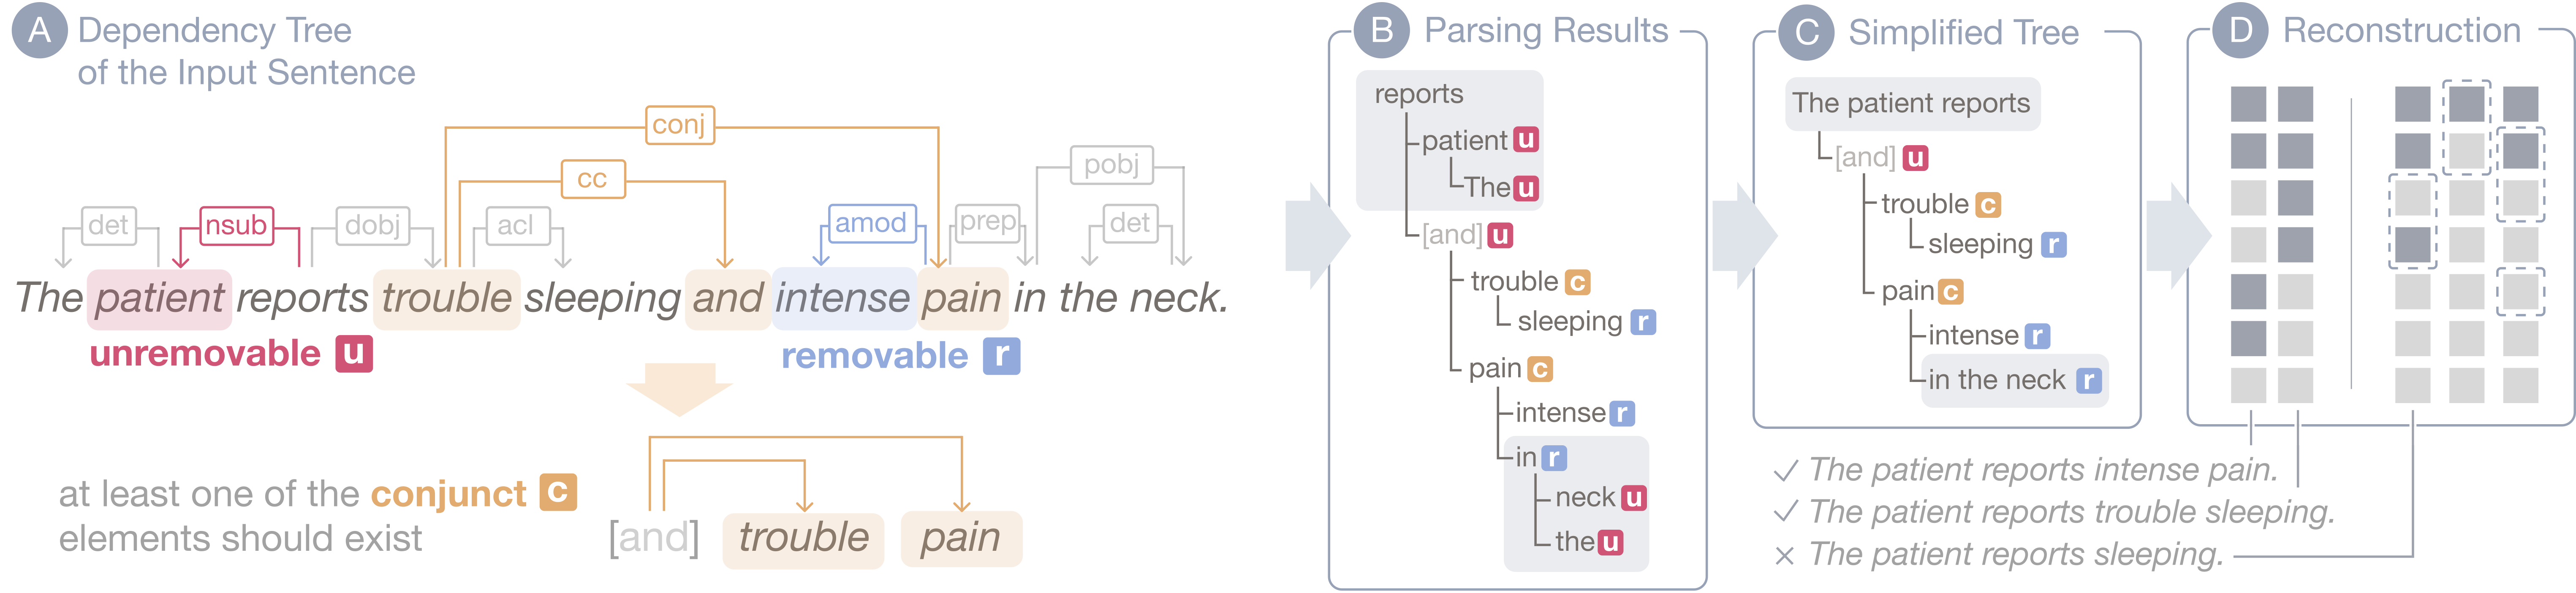
Parsing. The parsing stage aims to create a hierarchical representation of the text showing the dependency and removability of the words (i.e., whether the sentence structure is broken by removing the words). Since identifying the dependency structure of the text is a foundation problem in syntax analysis, we built our algorithm on existing dependency parsing algorithms and implementations. The next question we need to solve is identifying the removability of the words, which can be inferred from its dependency relation with the parent word. For example, removing the nominal subject (nsub) breaks the structure, while removing an adjectival modifier (amod) usually doesn’t (Figure 2A). Using this idea, we categorized the dependency relation according to linguistic grammar into two categories: relations that infer the words to be “optional” (i.e., removable) and the opposite (i.e., unremovable). However, there are exceptions. Conjunct components influence each other, i.e., removing only one will not break the sentence structure. So, for the conjunct (‘conj‘) relationship, we create a dummy token as the common parent of the two conjunct parts. We validated and iteratively refined the categorization rules by testing through samples from the MedQA dataset. Using these rules, the algorithm generates a parsing tree of the sentence (Figure 2B).
Simplification. The parsing tree is sufficient to generate all grammatically correct removal-only counterfactuals. However, a word-by-word partition is inefficient in computing counterfactuals and is unfriendly for users to understand. We noticed that this tree structure could be further simplified by combining unremovable segments (dummy segments excluded) with their parent segment (Figure 2C), which reduces the number of elementary segments.
Reconstruction. Using the simplified parse tree, we generated all counterfactuals by sampling all combinations of the segments and selecting the valid ones (Figure 2D) using three rules. First, if the parent segment is removed, all segments in its branch should also be removed. Second, if the parent segment is preserved, its unremovable children segments should also be preserved. Third, if a dummy segment (e.g., [and]) is preserved, at least one of its children should also be preserved. Finally, the algorithm reconstructed its corresponding textual counterfactuals for each valid combination.
Customization on Demand. The algorithm supports users to customize the granularity of the segments by combining a non-leaf segment with all segments in its branch, for example, combining “pain”, “intense”, and “in the neck” to a longer segment “intense pain in the neck”. For each leaf segment, users can define alternative options for replacement, for example, replacing “in the neck” with “in the stomach” to generate diverging counterfactuals.
4.2 Experiments
In this section, we present the experiments for evaluating the algorithm.
Metrics. We use LanguageTool to evaluate the grammatical correctness of the generated counterfactuals. The LanguageTool takes a sentence as input and outputs a list of grammatical and stylistic errors. In our experiments, we do not require the prototype sentence to be grammatically correct for testing. Instead, we measure if the generated counterfactuals introduce new grammatical errors. If not, we count the generated counterfactual as grammatically correct.
Datasets. We choose five datasets, including MedQA [22], BillSum [18], FiQA [23], TinyTextbooks [29], and news–MultiNews [9]. These datasets cover the five most common domains: medicine, legal, finance, education, and news reports. We randomly select 1,000 sentences from each dataset (5,000 in total) and generate all possible counterfactuals by removal.
Results. The results are shown in Table 1 with an average parse and sample time per sentence of 0.7s using a laptop. The most consequential contributor to this time is the dependency parsing by Spacy’s trf Roberta Transformer model. The grammaticality, a lower bound by the tool, is consistently above 95% (average 97.2%), and a single sentence usually generates 46 perturbations. In Appendix A, we show samples of the generated counterfactuals from all datasets.
| Dataset | Sent. length | Pert./sent. | Grammatical |
|---|---|---|---|
| MedQA | 13.3 | 51 | 98.3% |
| BillSum | 18.1 | 59 | 97.2% |
| FiQA | 16.2 | 46 | 95.9% |
| TinyTextbooks | 13.3 | 41 | 97.5% |
| MultiNews | 15.6 | 34 | 97.1% |
5 LLM Analyzer
We introduce LLM Analyzer, an interactive visualization tool for analyzing LLMs using counterfactuals. The system usage is divided into three stages: task creation, configuration, and results analysis.
5.1 Task Creation
In the task creation stage, the users input the prototype text—the sentences to be perturbed and an optional prompt template. For example, for a prompt containing a multi-option question (the prompt text in Interactive Analysis of LLMs using Meaningful CounterfactualsC), the users don’t want to perturb the question and options but only generate counterfactuals for the descriptions to the patient. They define the prompt template as “{input} Which of the following is….”
Despite the input, the users also need to specify what property of the generated text to observe (or explain), i.e., the observation object, which is usually related to a model prediction. For example, in the above multi-option question-answering task, the users may be interested in whether the model outputs the correct prediction or which option is chosen by the model. In our method, an observation object is defined by a rule-based binary classifier composed of an operator (e.g., CONTAIN) and a parameter (e.g., Nitrofurantoin), which classifies the generated text into two contrastive categories with and without certain properties (e.g., containing the word “Nitrofurantoin” or not).
We predefined a list of operators for users to define the observation object, including token-matching-based operators (e.g., CONTAIN, STARTWITH) and logic-based operators (e.g., ENTAIL, CONTRADICT). In general, token-matching-based operators are used for concrete classification tasks, and logic-based operators should be used when the text generation task is open-ended. When defining observation objects using logic-based operators, the parameter is a propositional sentence. In these cases, we use an off-the-shelf DeBERTa model [12] to infer whether the generated text entails the operation parameter.
5.2 Experiment Panel
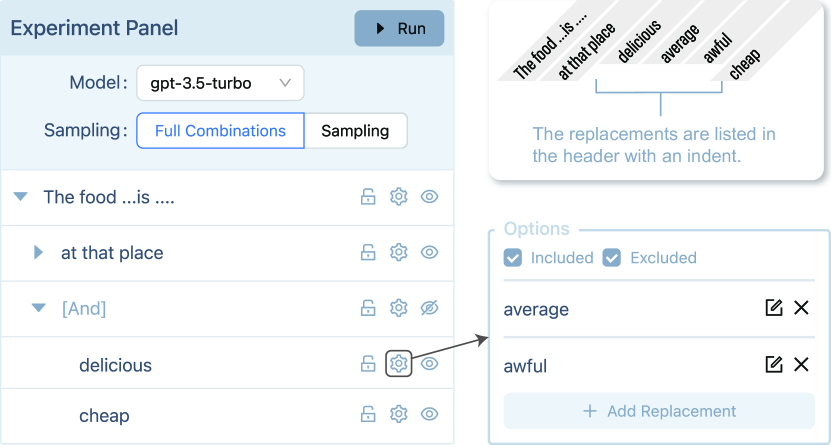
From the users’ input text, the system uses the algorithm introduced in Section 4 to divide text segments and present them in the experiment panel using a hierarchical list (Figure 3).
Users can open and collapse text nodes using the experiment panel to change the granularities (T1). For example, when the text contains too many segments, and some of them do not influence the semantics that much, users can combine these segments with their parents to reduce the number of segments. Or, after performing a low-granularity analysis (e.g., at the sentence level), users can expand some important and relative segments to drill down for more precise explanations. Users can also input replacement options for the leaf segments to test the LLM’s generation behaviors under different conditions. By clicking the “Run” button, the system will create counterfactuals based on users’ configurations and get LLM responses. For each counterfactual example, we query the model five times (suggested by a preliminary study [4]) and quantify the outcomes according to the observation object specified in the task creation stage. The outcome value is the proportion of the responses (in the five times of queries) that satisfy the corresponding rule, e.g., CONTAIN(Nitrofurantoin).
5.3 Table View
LLM Analyzer uses a table-based visualization, inspired by UpSet [20] and Juniper [30], to support interactive analysis of counterfactuals. The table view is composed of the following components.
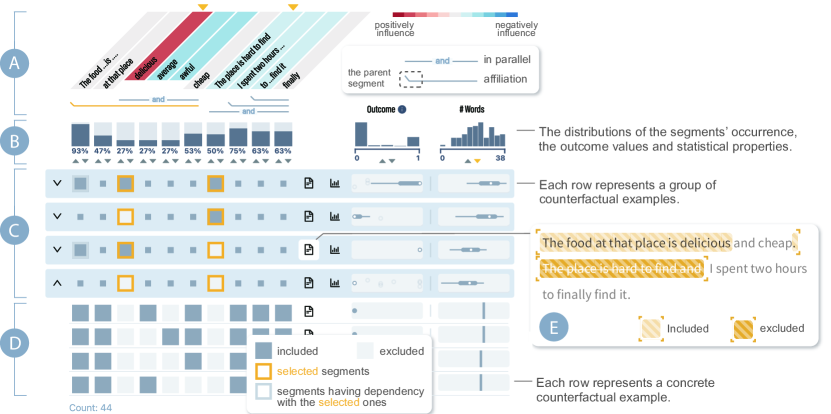
Segment Text and Attributions. The header of the table presents the text segments with their attributions (Figure 4A, T3). We use color to encode the attribution values. The colors (red and blue) are friendly to colorblind people. The red color indicates a positive influence, meaning that by keeping this segment, the LLM is more likely to have a positive prediction (i.e., having a higher outcome value). On the contrary, segments in blue negatively influence the outcome—by removing the segment, the outcome value increases in general. In our method, the attribution value is estimated using the correlation coefficient between the occurrence of each individual segment and the outcome value. Instead of using a continuous color scale and mapping each attribution value to a different color, which may overwhelm users and amplify the inaccuracies in the attribution calculations, we bin these values and map them to a limited set of colors.
Segment Dependencies. We annotate the dependencies of the segments under the segment text (Figure 4A). We consider two types of relations: affiliation and parallel. When a segment is affiliated with another one (noted as the parent segment, usually the backbone of a sentence, clause, and phrase), its occurrence depends on that segment. When the parent segment is removed in a counterfactual example, all children segments should be removed as well. Affiliations are annotated using an underline, where the raised end indicates the parent segment. When the users select a segment, all related affiliation underlines are highlighted to notify users of the corresponding segments to be considered. Parallel segments can be treated separately, and they are also annotated using an underline with a conjunct (“and”) in the middle.
Overview Charts. When the table includes a large number of counterfactuals, users need to gain an overview understanding of the dataset (T2). We use bar charts and histograms to visualize the distributions of the segment occurrence, outcome values, and the number of words (Figure 4B) and support sorting and filtering interactions to find counterfactuals of interest (T5).
Counterfactual Examples and Groups.
In the default settings, the table body shows individual counterfactual examples.
The color in each cell represents whether the corresponding segment is included ![]() or not
or not ![]() (Figure 4D).
Each row also contains charts displaying the outcome value and the word count of the counterfactual example.
LLM Analyzer allows users to interactively aggregate the counterfactual examples by selecting segments and performing a group-by operation (T4).
For example, in Figure 4, the user selected “delicious” and “The place is hard to find…” to understand the distributions of the outcome values under different combinations of their occurrence states.
Then, the system divides the instances into groups and visualizes their aggregated properties in the table body (Figure 4C).
(Figure 4D).
Each row also contains charts displaying the outcome value and the word count of the counterfactual example.
LLM Analyzer allows users to interactively aggregate the counterfactual examples by selecting segments and performing a group-by operation (T4).
For example, in Figure 4, the user selected “delicious” and “The place is hard to find…” to understand the distributions of the outcome values under different combinations of their occurrence states.
Then, the system divides the instances into groups and visualizes their aggregated properties in the table body (Figure 4C).
We use boxplots to visualize the outcome distributions and highlight the selected segments in each group using squares with orange borders ![]() .
The occurrence of the selected segments may also influence other segments. For example, in groups where “delicious” is always included, its parent segment “The food is…” also exists in all counterfactual examples within the group.
We highlight these influenced segments (due to the dependency) as well using gray borders
.
The occurrence of the selected segments may also influence other segments. For example, in groups where “delicious” is always included, its parent segment “The food is…” also exists in all counterfactual examples within the group.
We highlight these influenced segments (due to the dependency) as well using gray borders ![]() .
Users can inspect the individual examples within the group by clicking the arrow button on the left. Users can filter these examples by brushing on the boxplot, e.g., to check outliers (T5).
.
Users can inspect the individual examples within the group by clicking the arrow button on the left. Users can filter these examples by brushing on the boxplot, e.g., to check outliers (T5).
Text Annotations for Counterfactual Groups.
The graphical representation for counterfactual groups may not be intuitive to all users. So, we designed a text annotation schema that bordered and marked the included ![]() and excluded
and excluded ![]() segments in the original input (Figure 4E).
segments in the original input (Figure 4E).
6 Evaluation
We evaluate LLM Analyzer through a hypothetical use case, a user study, and feedback from NLP and XAI experts.
6.1 Usage Scenario
We introduce a hypothetical scenario to demonstrate how the system supports the workflow and user tasks defined in Section 3.4.
In this scenario, a hypothetical user, Emma, was a trainee doctor. She was interested in exploring new techniques for automizing clinical decisions and was specifically curious about how LLMs are capable of suggesting treatments. She selected a medical testing question about treatment selection for patients with urinary tract infections (UTIs) and fed it into GPT-3.5. While the model returned the correct answer (D. Nitrofurantoin), she wandered if the model took the proper information for making the prediction. She input this task into our system and defined an LLM response observer as CONTAIN(Nitrofurantoin), which categorizes any LLM responses into two categories: correct responses (containing the D option) or incorrect ones.111Using an instruction of Answer the question without giving explanations, we can regulate the model only to include the selected option in the response.
Customize the counterfactual generation (T1). The system suggested a list of text segments from the input prompt text, which are the basic elements for performing removal and replacements. After going through these segments, she found them all to be complete, reasonable phrases or sentence templates. Some of the segments included important information in this context, like “pregnant” and “at 22 weeks gestation”, while others were less informative, like “[She] otherwise [feels well]”. So, she combined these segments with their ancestor segments and reduced the number of segments from 26 to 14 (Interactive Analysis of LLMs using Meaningful CounterfactualsA). She kept other settings as default and submitted the configuration.
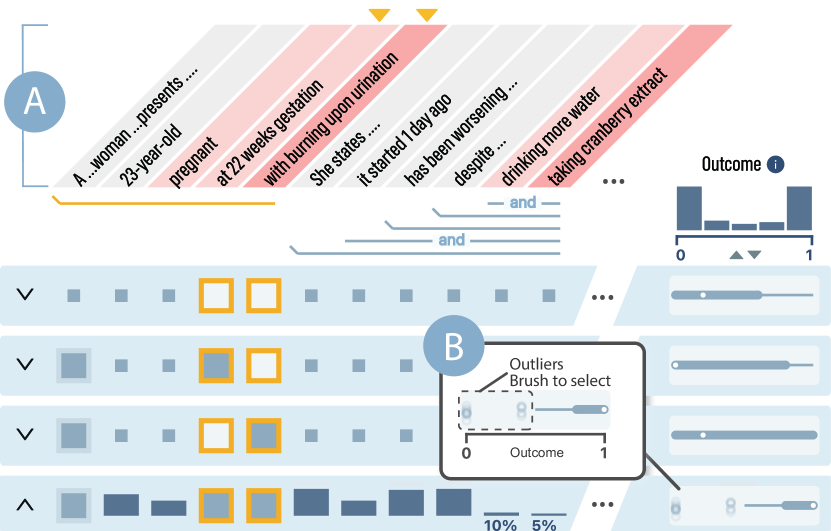
Explore and Identify important segments (T2, T3). After the system returned the results, Emma first looked at the table header, where she noticed that “burning upon urination” and another two segments were identified as having the highest positive contribution to the outcome (Figure 5A). “pregnant”, “at 22 weeks gestation” and the other two segments also have a noticeable positive contribution, and the last segment (sentence) has a negative contribution. In general, she agreed that the LLM identified the most critical information in the context—“burning upon urination” indicated the patient’s symptom (e.g., UTI) and “pregnant” suggested the doctor needed to careful choose treatment where option D was the best choice. However, to take Nitrofurantoin, the patient should not be in the third trimester (), which is guaranteed by “at 22 weeks gestation”. However, she found that the model also took less significant segments like “taking cranberry extract” as important ones. To gain a more precise understanding, she interactively aggregated important segments to assess their anchoring effect.
Gain precise explanations (T4). She grouped the counterfactual examples by “at 22 weeks gestation” and “burning upon urination”. These two segments include sufficient information for her to make the prediction, and she wanted to know if the LLM’s prediction is always aligned with hers. She then looked at the group where the two segments were both contained. Through the outcome box plot (Figure 5B), she noticed that most of the outputs had a high probability, suggesting that in most cases when the two segments and the sentence backbone (“A woman presents…”) are included in the input prompt, the LLM would choose the correct answer, which aligned with her knowledge.
Valid findings with examples (T5). However, there are exceptions. She found outliers in the box plot whose outcome probability was lower than 0.5. By brushing on the box plot, she selected these examples (20 in total) (Interactive Analysis of LLMs using Meaningful CounterfactualsD). These examples demonstrate that even if the input provides enough information (symptoms and pregnancy) for prediction, the model may still make an incorrect prediction, resulting in a failure. She reviewed these examples and found that most of them do not include part of the second sentence, “despite drinking more water and taking cranberry extract”. It indicates that LLM treated the second sentence as crucial additional information. The model can make correct and confident predictions when it co-occurs with the important segments in the first sentence.
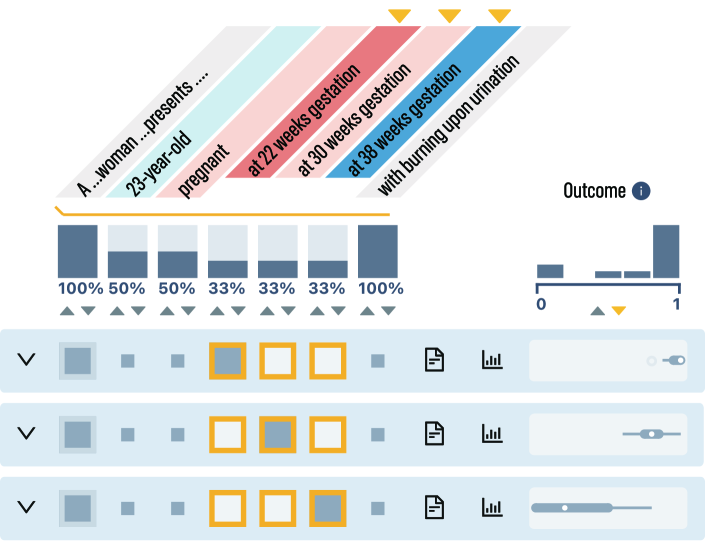
Change the settings for further analysis (T1). To understand if the model correctly captured the information in “at 22 weeks gestation”, the user conducted another round of analysis by replacing the gestation stage to “30 weeks” and “38 weeks”. If the LLM used this information correctly, after replacing it with “38 weeks”, the LLM will give an alternative prediction (i.e., recommending a different treatment) since option D should not be given to patients in the third trimester (). For simplicity, she excluded other sentences. Then, she submitted the configuration. From the results (Figure 6), she noticed that when replaced by “at 38 weeks gestation”, the corresponding outcome values are in general negative (), indicating that the LLM made use of this information. However, not all outcome values are lower than 0.5, which suggests that the LLM may still recommend Nitrofurantoin to pregnant patients in the third trimester, which may bring risks.
Conclusions. From the above analysis, Emma identified the segments with higher contributions to the predictions. Through interactive aggregation and inspecting concrete examples, she gained a vivid understanding of how these segments contribute to the predictions. She also found misalignments with the LLM in suggesting treatment for UTI patients, where the LLM may give unexpected predictions when “despite taking cranberry extract” is not explicitly mentioned in the text or for the patients at 38 weeks gestation. These findings suggest that the LLM should be cautiously used in such treatment suggestion tasks.
6.2 User Study
We conducted a user study to understand the effectiveness of LLM Analyzer in supporting LLM users to understand the model and evaluate the system’s overall usability and usefulness.
6.2.1 Study Setup
Participants. We recruited ten participants (aged 24-44), noted as [P1-10] through a university email list. All participants use LLMs (ChatGPT) regularly. None of the participants have knowledge about LLM explanations before the study.
User Tasks. During the user study, the users were asked to conduct a series of analytical tasks using the system and answer the corresponding questions in (Table 2). These questions were formed from the user tasks identified in Section 3.4. For T2, T3, and T5, we created two questions covering two different scenarios users may face. These questions (Q1-6) only have one correct answer. The last question (Q7) was formed from T4, which is an open-ended question with multiple valid answers. We excluded T1 from evaluation because performing this task (customization) requires users to have prior knowledge about the prompt and the prediction task, which is hard to control and measure. Based on Q1-7, we designed the study procedure as follows.
Procedure. The user study took about 45 minutes. After getting consent from users and collecting their demographic information, we introduced the background and the goal of this study and showcased the LLM Analyzer using a tutorial case about sentiment prediction. Then, we allowed users to freely explore the system using the tutorial case and ask questions about the system usage. Afterward, the users were asked to perform the above user tasks using the treatment suggestion example presented in Section 6.1 and answer the seven questions. Upon completing the user tasks, the participants were asked to rate the user experience through a questionnaire based on the System Usability Scale [2] using a 7-point Likert Scale, and we finally followed up with a semi-structured interview to collect their qualitative feedback.
6.2.2 Results
Almost all (9/10) participants answered Q1 correctly. All participants answered Q2-6 correctly. For Q7, all participants found at least one correct anchor, and most of them (7/10) found two anchors. However, some of the anchors identified by the participants are overcomplicated by containing more segments, which also means that they are less general (i.e., covering fewer examples). We believe it is because participants lack sufficient knowledge about the medical question, which hinders their ability to propose good hypotheses about the anchoring segments. In general, the results suggested that LLM Analyzer has good usability and is effective in supporting the proposed tasks.
| Task | Question | |
|---|---|---|
| T2 | Q1 | Will the LLM’s prediction change by removing…? |
| Q2 | What is the LLM’s prediction for input …? | |
| T5 | Q3 | How to change the LLM’s prediction by removing a minimal number of words? |
| Q4 | How to change the LLM’s prediction by removing a minimal number of words without changing…? | |
| T3 | Q5 | Which of the following text segments plays the most important role according to the system? |
| Q6 | Which of the following text segments has a negative effect on the prediction according to the system? | |
| T4 | Q7 | Find anchors (sufficient conditions for the LLM to make consistent predictions) |
6.2.3 User Feedback
Most of the participants agree that the system is useful in helping them understand LLMs () and easy to use (). Four participants ([P1, P2, P5, P8]) mentioned that the table-based visualization is intuitive and self-explanatory. They are familiar with tables and, thus, do not need to learn every interaction from the beginning. Moreover, most of the participants agree that the system is enjoyable to use (), and they would like to use it frequently ().
Three participants ([P2, P5, P10]) suggested that the group-by operation (interactive aggregation) is the most useful feature, as it helps to understand the common properties of a counterfactual population. Other participants are more in favor of fundamental interactions, like filtering and sorting, and the color encoding in the header for highlighting important segments. According to their feedback, these functions are well-integrated (). [P2] commented that the system is really “reactive” by incorporating multiple types of interactions.
In general, the participants find the system easy to learn (). However, four participants suggested that they needed to learn some concepts before using the system to solve the given task. Among these concepts, Anchor was not intuitive to them at the beginning, but they then understood it and found it very useful. [P9] commented that the system is too flexible by supporting many interactions, and thus, more guidance should be provided.
In summary, from this user study, we demonstrate the effectiveness of LLM Analyzer in supporting the user tasks in the proposed workflow. From users’ feedback, we confirm the usability and usefulness of the system. Their feedback also suggests future improvements in providing visual guidance for system usage and introducing explanation concepts with more intuitive visualizations.
6.3 Expert Interview
In addition to the user studies, we interviewed six experts from the NLP and XAI fields to understand the usage and applicability of the proposed system. We present the process and results as follows.
6.3.1 Study Setup
Participants. We recruited three NLP researchers [E1-E3] and three XAI researchers [E4-E6] using a university email list. All participants have at least three years and up to over ten years of experience publishing in their domains. None of them are the authors of this paper.
Procedure. We conducted semi-structured interviews with the participants. Each interview was composed of three sessions and took around 45 minutes. In the first session, we introduced the background and demonstrated our system using the use case in Section 6.1. Then, we allowed them to use our system for free explorations. In the final session, we collected their feedback about their overall impression of the system, potential usage scenarios, and desired improvements.
6.3.2 Expert Feedback
System Design. Experts from both domains found the system design to be concise and easy to comprehend, presenting a comprehensive overview of numerous functionalities. [E3] highlighted that our way of the feature attributions is the most intuitive explanation to lay users. [E3] also noted that anchoring was a more complex concept to grasp. However, the way that we highlighted corresponding segments in the original text significantly improved its understanding. [E4] and [E6] highly praised the way we integrated multiple explanation techniques. “Attributions are not sufficient for users to make decisions; the concrete (counterfactual) examples help.” suggested by [E6].
Multi-Level Segmentations. Most experts highlighted the positive implications of our multi-level segmentation for language model explainability. [E5] described how traditional XAI methods are not developed for NLP and tend to underperform when applied without careful consideration of syntactical constraints: "They were not created for text data. In my opinion, we should consider the relationship and interaction between words." Similarly, [E6] discussed that creating meaningful perturbation for attribution methods, such as LIME[33], remains a significant challenge in NLP. They agreed that our way of sampling perturbations based on the dependency structure provides a helpful way to address this issue: "you take LIME and improve sampling, which is the most critical part, I think, of the algorithm." Finally, [E4-E6] mentioned scalability issues when running SHAP[21], which they were happy to see addressed by our way of hierarchical segmentation.
Adaptions to Different NLP Tasks. Throughout our interviews, the NLP researchers also highlighted potential usage scenarios of the proposed system in more challenging tasks. [E2] and [E5] were interested in using the system to solve more open-ended language generation tasks, such as text summarization. Besides, [E1] and [E3] were interested in using the system to explain model reasoning through attribution in math world problems and as a potentially useful tool for causal mediation analysis. Finally, [E2] suggested a potential extension of supporting multi-round dialog input. In Section 7.2, we discuss more about adapting our system to more general text generation tasks.
Desired Improvements. Finally, experts were given the opportunity to suggest their desired improvements. [E4] commented that the interpretable components might contain excess words and would benefit from semantic grouping for better interpretability. Further, [E2] and [E4] mentioned that they would also be interested in comparing the explanations provided by our system with natural language explanations provided by the LLM itself.
In summary, all experts confirmed the tool’s usefulness, especially as an LLM analysis tool for practitioners. The three used explanation methods were found to complement each other well to get a holistic overview of instance-level explanation. Furthermore, our hierarchical segmentation was noted to create meaningful explanation components, though a semantic grouping was suggested to make the explanation more telling. Additionally, the flexibility of considering model-agnostic explanations for any generative task sparked several ideas for potential usage scenarios across NLP and XAI researchers.
7 Discussion
In this section, we discuss this study’s design implications, the approach’s limitations, and future studies.
7.1 Design Implications
Interpretable Components in Text Data. Explanations are built upon concepts that are understandable to humans. When explaining an ML model’s behaviors, Ribeiro et al. suggests that separating the input into interpretable components is a preliminary step for generating explanations [33]. For example, if the input is an image, interpretable components can be image segments that are meaningful to users. For text data, most existing studies treat words as the elementary interpretable components. Word-level explanations are useful for tasks like sentiment analysis. When the users see that the attributions align with the word polarity, they may confirm the correctness of the model prediction. However, for more complex tasks involving logical inferences, such as the treatment suggestion problem in the use case (Interactive Analysis of LLMs using Meaningful Counterfactuals), word-level explanations are not sufficient. The words need to be put into context to understand their semantic effect.
We isolate the “removable” segments in the text, which are the elementary interpretable components and the building blocks of explainability in our system. For each segment, we visualize its dependency on its parent segment, which provides the necessary context to interpret the meaning of the segments in the sentence.
Multi-level Explanations. Finding a proper granularity for offering LLM explanations is challenging. Ideally, the sentence partition should be context- and user-dependent. However, it is hard to design an algorithm that adapts to all cases by isolating all segments that are useful in solving the task and reasonable to users. So, in this work, we propose a unified solution by generating a hierarchical list of text segments. When partitions are not optimal for users, they can interactively adjust and improve the granularity. For complex prompt instances, users can start with coarse-level (sentence-level) explanations and then drill down to understand which parts of the text are the most influential to the outcome.
7.2 Limitations and Future Work
Interpret LLM Explanations. In this study, we adapt counterfactual- and perturbation-based local explanations to explain LLMs, demonstrate their usage in a hypothetical usage scenario, and evaluate them using proxy tasks. However, how users actually interpret these explanations in different scenarios and use them to make decisions is not well investigated in this paper and needs to be studied in the future.
Recommend Text for Replacement. The focus of the proposed counterfactual generation algorithm is to guarantee the meaningfulness of the generated counterfactuals by removal. If users want to replace a segment, they need to manually input the text, which takes additional effort. As a future extension, we aim to recommend alternative text for replacement to users automatically. A promising approach is to use an off-the-shelf language model to perform a blank-filling task [8].
Adapt to Free-Form Text Generations. The system is designed to help users analyze and explain LLMs. It requires the users to have a concrete observation object—knowing what to explain. The observation object is easy to define for classification tasks like multi-option question-answering and sentiment prediction. However, the observation object is not apparent for free-form text generation, like prompting the LLM with “Given the above context, why should the patient be given this treatment?”. To support free-form text generation tasks, the system should allow users to explore the text generations from different prompts and iteratively refine the observation objects. Supporting exploratory analysis on free-form text generation is an interesting open problem that requires further research.
8 Conclusion
This paper explored using counterfactuals to help LLM users and practitioners analyze and explain LLMs. From a review and discussion on existing counterfactual- and perturbation-based methods, we summarized three key challenges regarding generating meaningful and comparable counterfactuals, perturbing text in different levels, and connecting different explanations for better understanding. We proposed LLM Analyzer, an interactive visualization tool with a meaningful counterfactual generation algorithm, to help users create and analyze textual counterfactuals to understand LLMs. We evaluated the counterfactual generation algorithm with five datasets from different domains, which show good quality of the generated counterfactuals. Through a hypothetical use case, a user study, and expert feedback, we demonstrated the usability of LLM Analyzer and the usefulness of the proposed counterfactual-based multi-level and multi-explanation approach in helping users analyze and understand LLMs.
References
- [1] R. Brath, D. Keim, J. Knittel, S. Pan, P. Sommerauer, and H. Strobelt. The role of interactive visualization in explaining (large) nlp models: from data to inference. arXiv preprint arXiv:2301.04528, 2023.
- [2] J. Brooke. SUS-A quick and dirty usability scale. In Usability Evaluation in Industry, pp. 4–7. London: Taylor and Francis, 1996.
- [3] F. Cheng, Y. Ming, and H. Qu. Dece: Decision explorer with counterfactual explanations for machine learning models. IEEE Transactions on Visualization and Computer Graphics, 27(2):1438–1447, 2020.
- [4] F. Cheng, V. Zouhar, S. Arora, M. Sachan, H. Strobelt, and M. El-Assady. RELIC: Investigating large language model responses using self-consistency. In Proceedings of the 2024 CHI conference on human factors in computing systems, 2024. doi: 10 . 1145/3613904 . 3641904
- [5] A. Coscia and A. Endert. Knowledgevis: Interpreting language models by comparing fill-in-the-blank prompts. IEEE Transactions on Visualization and Computer Graphics, pp. 1–13, 2023. doi: 10 . 1109/TVCG . 2023 . 3346713
- [6] A. Coscia, L. Holmes, W. Morris, J. S. Choi, S. Crossley, and A. Endert. iscore: Visual analytics for interpreting how language models automatically score summaries. In Proceedings of the 2024 IUI Conference on Intelligent User Interfaces, IUI ’24. Association for Computing Machinery, New York, NY, USA, 2024. doi: 10 . 1145/3640543 . 3645142
- [7] I. Covert, S. Lundberg, and S.-I. Lee. Explaining by removing: A unified framework for model explanation. Journal of Machine Learning Research, 22(209):1–90, 2021.
- [8] C. Donahue, M. Lee, and P. Liang. Enabling language models to fill in the blanks. In Proceedings of the 58th Annual Meeting of the Association for Computational Linguistics, pp. 2492–2501, 2020.
- [9] A. R. Fabbri, I. Li, T. She, S. Li, and D. R. Radev. Multi-news: a large-scale multi-document summarization dataset and abstractive hierarchical model, 2019.
- [10] M. Gardner, Y. Artzi, V. Basmov, J. Berant, B. Bogin, S. Chen, P. Dasigi, D. Dua, Y. Elazar, A. Gottumukkala, N. Gupta, H. Hajishirzi, G. Ilharco, D. Khashabi, K. Lin, J. Liu, N. F. Liu, P. Mulcaire, Q. Ning, S. Singh, N. A. Smith, S. Subramanian, R. Tsarfaty, E. Wallace, A. Zhang, and B. Zhou. Evaluating models’ local decision boundaries via contrast sets. In T. Cohn, Y. He, and Y. Liu, eds., Findings of the Association for Computational Linguistics: EMNLP 2020, pp. 1307–1323. Association for Computational Linguistics, Online, nov 2020. doi: 10 . 18653/v1/2020 . findings-emnlp . 117
- [11] O. Gomez, S. Holter, J. Yuan, and E. Bertini. ViCE: Visual counterfactual explanations for machine learning models. In Proceedings of the 25th international conference on intelligent user interfaces, pp. 531–535, 2020.
- [12] P. He, X. Liu, J. Gao, and W. Chen. DeBERTa: Decoding-ehanced bert with disentangled attention. In International Conference on Learning Representations, 2021.
- [13] Z. Ji, N. Lee, R. Frieske, T. Yu, D. Su, Y. Xu, E. Ishii, Y. J. Bang, A. Madotto, and P. Fung. Survey of hallucination in natural language generation. ACM Computing Surveys, 55(12):1–38, 2023.
- [14] D. Kahneman and A. Tversky. The simulation heuristic. National Technical Information Service, 1981.
- [15] M. Kahng, I. Tenney, M. Pushkarna, M. X. Liu, J. Wexler, E. Reif, K. Kallarackal, M. Chang, M. Terry, and L. Dixon. Llm comparator: Visual analytics for side-by-side evaluation of large language models, 2024.
- [16] A.-H. Karimi, B. Schölkopf, and I. Valera. Algorithmic recourse: from counterfactual explanations to interventions. In Proceedings of the 2021 ACM conference on fairness, accountability, and transparency, pp. 353–362, 2021.
- [17] D. Kaushik, E. Hovy, and Z. C. Lipton. Learning the difference that makes a difference with counterfactually augmented data. International Conference on Learning Representations (ICLR), 2020.
- [18] A. Kornilova and V. Eidelman. BillSum: A corpus for automatic summarization of US legislation. In L. Wang, J. C. K. Cheung, G. Carenini, and F. Liu, eds., Proceedings of the 2nd Workshop on New Frontiers in Summarization, pp. 48–56. Association for Computational Linguistics, Hong Kong, China, Nov. 2019. doi: 10 . 18653/v1/D19-5406
- [19] D. Lewis. Counterfactuals. John Wiley & Sons, 2013.
- [20] A. Lex, N. Gehlenborg, H. Strobelt, R. Vuillemot, and H. Pfister. Upset: visualization of intersecting sets. IEEE transactions on visualization and computer graphics, 20(12):1983–1992, 2014.
- [21] S. M. Lundberg and S.-I. Lee. A unified approach to interpreting model predictions. In I. Guyon, U. V. Luxburg, S. Bengio, H. Wallach, R. Fergus, S. Vishwanathan, and R. Garnett, eds., Advances in Neural Information Processing Systems, vol. 30. Curran Associates, Inc., 2017.
- [22] N. Madaan, I. Padhi, N. Panwar, and D. Saha. Generate your counterfactuals: Towards controlled counterfactual generation for text. In Proceedings of the AAAI Conference on Artificial Intelligence, vol. 35, pp. 13516–13524, 2021.
- [23] M. Maia, S. Handschuh, A. Freitas, B. Davis, R. McDermott, M. Zarrouk, and A. Balahur. Www’18 open challenge: financial opinion mining and question answering. In Companion proceedings of the the web conference 2018, pp. 1941–1942, 2018.
- [24] T. McCoy, E. Pavlick, and T. Linzen. Right for the wrong reasons: Diagnosing syntactic heuristics in natural language inference. In A. Korhonen, D. Traum, and L. Màrquez, eds., Proceedings of the 57th Annual Meeting of the Association for Computational Linguistics, pp. 3428–3448. Association for Computational Linguistics, Florence, Italy, jul 2019. doi: 10 . 18653/v1/P19-1334
- [25] Y. Ming, S. Cao, R. Zhang, Z. Li, Y. Chen, Y. Song, and H. Qu. Understanding hidden memories of recurrent neural networks. In 2017 IEEE conference on visual analytics science and technology (VAST), pp. 13–24. IEEE, 2017.
- [26] S. L. Morgan and C. Winship. Counterfactuals and causal inference. Cambridge University Press, 2015.
- [27] R. K. Mothilal, A. Sharma, and C. Tan. Explaining machine learning classifiers through diverse counterfactual explanations. In Proceedings of the 2020 conference on fairness, accountability, and transparency, pp. 607–617, 2020.
- [28] M. Nadeem, A. Bethke, and S. Reddy. Stereoset: Measuring stereotypical bias in pretrained language models. In Proceedings of the 59th Annual Meeting of the Association for Computational Linguistics and the 11th International Joint Conference on Natural Language Processing (Volume 1: Long Papers), pp. 5356–5371, 2021.
- [29] Nam Pham. tiny-textbooks (revision 14de7ba), 2023. doi: 10 . 57967/hf/1126
- [30] C. Nobre, M. Streit, and A. Lex. Juniper: A tree+ table approach to multivariate graph visualization. IEEE transactions on visualization and computer graphics, 25(1):544–554, 2018.
- [31] L. Ouyang, J. Wu, X. Jiang, D. Almeida, C. Wainwright, P. Mishkin, C. Zhang, S. Agarwal, K. Slama, A. Ray, et al. Training language models to follow instructions with human feedback. Advances in neural information processing systems, 35:27730–27744, 2022.
- [32] J. Pearl. Causal inference in statistics: An overview. Statistics Surveys, 3:96 – 146, 2009. doi: 10 . 1214/09-SS057
- [33] M. T. Ribeiro, S. Singh, and C. Guestrin. "why should i trust you?": Explaining the predictions of any classifier. In Proceedings of the 22nd ACM SIGKDD International Conference on Knowledge Discovery and Data Mining, KDD ’16, p. 1135–1144. Association for Computing Machinery, New York, NY, USA, 2016. doi: 10 . 1145/2939672 . 2939778
- [34] M. T. Ribeiro, S. Singh, and C. Guestrin. Anchors: High-Precision model-agnostic explanations. Proceedings of the AAAI Conference on Artificial Intelligence, 32(1), Apr. 2018. doi: 10 . 1609/aaai . v32i1 . 11491
- [35] M. T. Ribeiro, T. Wu, C. Guestrin, and S. Singh. Beyond accuracy: Behavioral testing of nlp models with checklist. In Proceedings of the 58th Annual Meeting of the Association for Computational Linguistics, pp. 4902–4912, 2020.
- [36] M. Robeer, F. Bex, and A. Feelders. Generating realistic natural language counterfactuals. In Findings of the Association for Computational Linguistics: EMNLP 2021, pp. 3611–3625, 2021.
- [37] H. Strobelt, S. Gehrmann, M. Behrisch, A. Perer, H. Pfister, and A. M. Rush. Seq2seq-vis: A visual debugging tool for sequence-to-sequence models. IEEE Transactions on Visualization and Computer Graphics, 25(1):353–363, 2019. doi: 10 . 1109/TVCG . 2018 . 2865044
- [38] H. Strobelt, S. Gehrmann, H. Pfister, and A. M. Rush. Lstmvis: A tool for visual analysis of hidden state dynamics in recurrent neural networks. IEEE transactions on visualization and computer graphics, 24(1):667–676, 2017.
- [39] I. Tenney, J. Wexler, J. Bastings, T. Bolukbasi, A. Coenen, S. Gehrmann, E. Jiang, M. Pushkarna, C. Radebaugh, E. Reif, and A. Yuan. The language interpretability tool: Extensible, interactive visualizations and analysis for NLP models. In Q. Liu and D. Schlangen, eds., Proceedings of the 2020 Conference on Empirical Methods in Natural Language Processing: System Demonstrations, pp. 107–118. Association for Computational Linguistics, Online, oct 2020. doi: 10 . 18653/v1/2020 . emnlp-demos . 15
- [40] S. Wachter, B. Mittelstadt, and C. Russell. Counterfactual explanations without opening the black box: Automated decisions and the gdpr. Harv. JL & Tech., 31:841, 2017.
- [41] A. Z. Wang, D. Borland, and D. Gotz. An empirical study of counterfactual visualization to support visual causal inference. Information Visualization, p. 14738716241229437, 2024.
- [42] D. Wang, Q. Yang, A. Abdul, and B. Y. Lim. Designing theory-driven user-centric explainable ai. In Proceedings of the 2019 CHI conference on human factors in computing systems, pp. 1–15, 2019.
- [43] X. Wang, R. Huang, Z. Jin, T. Fang, and H. Qu. CommonsenseVIS: Visualizing and understanding commonsense reasoning capabilities of natural language models. IEEE Transactions on Visualization & Computer Graphics, 30(01):273–283, jan 2024. doi: 10 . 1109/TVCG . 2023 . 3327153
- [44] Z. J. Wang, R. Turko, and D. H. Chau. Dodrio: Exploring Transformer Models with Interactive Visualization. In Proceedings of the Joint Conference of the 59th Annual Meeting of the Association for Computational Linguistics and the 11th International Joint Conference on Natural Language Processing: System Demonstrations, pp. 132–141. Association for Computational Linguistics, Online, 2021.
- [45] Z. J. Wang, J. Wortman Vaughan, R. Caruana, and D. H. Chau. Gam coach: Towards interactive and user-centered algorithmic recourse. In Proceedings of the 2023 CHI Conference on Human Factors in Computing Systems, pp. 1–20, 2023.
- [46] J. Wexler, M. Pushkarna, T. Bolukbasi, M. Wattenberg, F. Viégas, and J. Wilson. The what-if tool: Interactive probing of machine learning models. IEEE Transactions on Visualization and Computer Graphics, 26(1):56–65, 2020. doi: 10 . 1109/TVCG . 2019 . 2934619
- [47] T. Wu, M. T. Ribeiro, J. Heer, and D. S. Weld. Polyjuice: Generating counterfactuals for explaining, evaluating, and improving models, 2021.
- [48] L. Yang, E. Kenny, T. L. J. Ng, Y. Yang, B. Smyth, and R. Dong. Generating plausible counterfactual explanations for deep transformers in financial text classification. In Proceedings of the 28th International Conference on Computational Linguistics, pp. 6150–6160, 2020.
Appendix A Perturbation Examples
Intentionally shorter sentences selected in the interest of space.
A 23-year-old pregnant woman at 22 weeks gestation presents with burning upon urination (MedQA)
A woman presents.
A pregnant woman presents.
A 23-year-old woman presents.
A woman presents with burning.
A 23-year-old pregnant woman presents.
A pregnant woman presents with burning.
A woman at 22 weeks gestation presents.
A woman presents with burning upon urination.
A 23-year-old woman presents with burning.
A pregnant woman at 22 weeks gestation presents.
A pregnant woman presents with burning upon urination.
A 23-year-old pregnant woman presents with burning.
A 23-year-old woman at 22 weeks gestation presents.
A 23-year-old woman presents with burning upon urination.
A woman at 22 weeks gestation presents with burning.
A 23-year-old pregnant woman at 22 weeks gestation presents.
A 23-year-old pregnant woman presents with burning upon urination.
A pregnant woman at 22 weeks gestation presents with burning.
A woman at 22 weeks gestation presents with burning upon urination.
A 23-year-old woman at 22 weeks gestation presents with burning.
A pregnant woman at 22 weeks gestation presents with burning upon urination.
A 23-year-old pregnant woman at 22 weeks gestation presents with burning.
A 23-year-old woman at 22 weeks gestation presents with burning upon urination.
A 23-year-old pregnant woman at 22 weeks gestation presents with burning upon urination.
A mother brings her 3-week-old infant to the pediatrician’s office because she is concerned about his feeding habits. (MedQA)
A mother brings her infant.
A mother brings her 3-week-old infant.
A mother brings her infant because she is concerned.
A mother brings her infant to the pediatrician’s office.
A mother brings her 3-week-old infant because she is concerned.
A mother brings her infant because she is concerned about his feeding habits.
A mother brings her 3-week-old infant to the pediatrician’s office.
A mother brings her infant to the pediatrician’s office because she is concerned.
A mother brings her 3-week-old infant because she is concerned about his feeding habits.
A mother brings her 3-week-old infant to the pediatrician’s office because she is concerned.
A mother brings her infant to the pediatrician’s office because she is concerned about his feeding habits.
A mother brings her 3-week-old infant to the pediatrician’s office because she is concerned about his feeding habits.
Requires plaintiffs who obtain a preliminary injunction or administrative stay in Indian energy related actions to post bond. (BillSum)
Requires plaintiffs to post bond.
Requires plaintiffs who obtain an injunction to post bond.
Requires plaintiffs who obtain stay to post bond.
Requires plaintiffs who obtain a preliminary injunction to post bond.
Requires plaintiffs who obtain an injunction or stay to post bond.
Requires plaintiffs who obtain administrative stay to post bond.
Requires plaintiffs who obtain a preliminary injunction or stay to post bond.
Requires plaintiffs who obtain an injunction in actions to post bond.
Requires plaintiffs who obtain an injunction or administrative stay to post bond.
Requires plaintiffs who obtain a preliminary injunction in actions to post bond.
Requires plaintiffs who obtain a preliminary injunction or administrative stay to post bond.
Requires plaintiffs who obtain an injunction in Indian actions to post bond.
Requires plaintiffs who obtain an injunction in energy related actions to post bond.
Requires plaintiffs who obtain an injunction in actions or stay to post bond.
Requires plaintiffs who obtain a preliminary injunction in Indian actions to post bond.
Requires plaintiffs who obtain a preliminary injunction in energy related actions to post bond.
Requires plaintiffs who obtain a preliminary injunction in actions or stay to post bond.
Requires plaintiffs who obtain an injunction in Indian energy related actions to post bond.
Requires plaintiffs who obtain an injunction in Indian actions or stay to post bond.
Requires plaintiffs who obtain an injunction in energy related actions or stay to post bond.
Requires plaintiffs who obtain an injunction in actions or administrative stay to post bond.
Requires plaintiffs who obtain a preliminary injunction in Indian energy related actions to post bond.
Requires plaintiffs who obtain a preliminary injunction in Indian actions or stay to post bond.
Requires plaintiffs who obtain a preliminary injunction in energy related actions or stay to post bond.
Requires plaintiffs who obtain a preliminary injunction in actions or administrative stay to post bond.
Requires plaintiffs who obtain an injunction in Indian energy related actions or stay to post bond.
Requires plaintiffs who obtain an injunction in Indian actions or administrative stay to post bond.
Requires plaintiffs who obtain an injunction in energy related actions or administrative stay to post bond.
Requires plaintiffs who obtain a preliminary injunction in Indian energy related actions or stay to post bond.
Requires plaintiffs who obtain a preliminary injunction in Indian actions or administrative stay to post bond.
Requires plaintiffs who obtain a preliminary injunction in energy related actions or administrative stay to post bond.
Requires plaintiffs who obtain an injunction in Indian energy related actions or administrative stay to post bond.
Requires States to allocate funds from Federal and State shares of program costs to LEAs according to specified formulae. (BillSum)
Requires States to allocate funds.
Requires States to allocate funds to LEAs.
Requires States to allocate funds according.
Requires States to allocate funds to LEAs according.
Requires States to allocate funds from Federal shares.
Requires States to allocate funds from State shares.
Requires States to allocate funds according to formulae.
Requires States to allocate funds from Federal and State shares.
Requires States to allocate funds from Federal shares to LEAs.
Requires States to allocate funds from Federal shares according.
Requires States to allocate funds from State shares to LEAs.
Requires States to allocate funds from State shares according.
Requires States to allocate funds to LEAs according to formulae.
Requires States to allocate funds according to specified formulae.
Requires States to allocate funds from Federal and State shares to LEAs.
Requires States to allocate funds from Federal and State shares according.
Requires States to allocate funds from Federal shares of program costs.
Requires States to allocate funds from Federal shares to LEAs according.
Requires States to allocate funds from State shares of program costs.
Requires States to allocate funds from State shares to LEAs according.
Requires States to allocate funds to LEAs according to specified formulae.
Requires States to allocate funds from Federal and State shares of program costs.
Requires States to allocate funds from Federal and State shares to LEAs according.
Requires States to allocate funds from Federal shares of program costs to LEAs.
Requires States to allocate funds from Federal shares of program costs according.
Requires States to allocate funds from Federal shares according to formulae.
Requires States to allocate funds from State shares of program costs to LEAs.
Requires States to allocate funds from State shares of program costs according.
Requires States to allocate funds from State shares according to formulae.
Requires States to allocate funds from Federal and State shares of program costs to LEAs.
Requires States to allocate funds from Federal and State shares of program costs according.
Requires States to allocate funds from Federal and State shares according to formulae.
Requires States to allocate funds from Federal shares of program costs to LEAs according.
Requires States to allocate funds from Federal shares to LEAs according to formulae.
Requires States to allocate funds from Federal shares according to specified formulae.
Requires States to allocate funds from State shares of program costs to LEAs according.
Requires States to allocate funds from State shares to LEAs according to formulae.
Requires States to allocate funds from State shares according to specified formulae.
Requires States to allocate funds from Federal and State shares of program costs to LEAs according.
Requires States to allocate funds from Federal and State shares to LEAs according to formulae.
Requires States to allocate funds from Federal and State shares according to specified formulae.
Requires States to allocate funds from Federal shares of program costs according to formulae.
Requires States to allocate funds from Federal shares to LEAs according to specified formulae.
Requires States to allocate funds from State shares of program costs according to formulae.
Requires States to allocate funds from State shares to LEAs according to specified formulae.
Requires States to allocate funds from Federal and State shares of program costs according to formulae.
Requires States to allocate funds from Federal and State shares to LEAs according to specified formulae.
Requires States to allocate funds from Federal shares of program costs to LEAs according to formulae.
Requires States to allocate funds from Federal shares of program costs according to specified formulae.
Requires States to allocate funds from State shares of program costs to LEAs according to formulae.
Requires States to allocate funds from State shares of program costs according to specified formulae.
Requires States to allocate funds from Federal and State shares of program costs to LEAs according to formulae.
Requires States to allocate funds from Federal and State shares of program costs according to specified formulae.
Requires States to allocate funds from Federal shares of program costs to LEAs according to specified formulae.
Requires States to allocate funds from State shares of program costs to LEAs according to specified formulae.
You trade in a car and they sell it at a profit. (FinQA)
They sell it.
You trade in a car.
They sell it at a profit.
You trade in a car and they sell it.
You’re losing money in more than one way on that investment. (FinQA)
You’re losing money.
You’re losing money in way.
You’re losing money on that investment.
You’re losing money in than one way.
You’re losing money in more than one way.
You’re losing money in way on that investment.
You’re losing money in than one way on that investment.
Here at MarketBeat HQ, we’ll be offering color commentary before and after the data crosses the wires. (MultiNews)
We’ll be offering color commentary.
Here, we’ll be offering color commentary.
We’ll be offering color commentary before.
Here, we’ll be offering color commentary before.
Here at MarketBeat HQ, we’ll be offering color commentary.
We’ll be offering color commentary after the data crosses the wires.
Here at MarketBeat HQ, we’ll be offering color commentary before.
Here, we’ll be offering color commentary after the data crosses the wires.
We’ll be offering color commentary before and after the data crosses the wires.
Here, we’ll be offering color commentary before and after the data crosses the wires.
Here at MarketBeat HQ, we’ll be offering color commentary after the data crosses the wires.
He didn’t take responsibility for his comment and he fails horribly at humor. (MultiNews)
He fails.
He didn’t take responsibility.
He fails horribly.
He fails at humor.
He didn’t take responsibility and he fails.
He fails horribly at humor.
He didn’t take responsibility for his comment.
He didn’t take responsibility and he fails horribly.
He didn’t take responsibility and he fails at humor.
He didn’t take responsibility for his comment and he fails.
He didn’t take responsibility and he fails horribly at humor.
He didn’t take responsibility for his comment and he fails horribly.
He didn’t take responsibility for his comment and he fails at humor.
The most promising agents in clinical development are reviewed. (TinyTextbooks)
The agents are reviewed.
The promising agents are reviewed.
The most promising agents are reviewed.
The agents in development are reviewed.
The promising agents in development are reviewed.
The agents in clinical development are reviewed.
The most promising agents in development are reviewed.
The promising agents in clinical development are reviewed.
The most promising agents in clinical development are reviewed.
For all kinds of business problems, we are there to help you to resolve business problems by astrology. (TinyTextbooks)
We are.
We are there.
For all kinds, we are.
For all kinds, we are there.
We are to help you to resolve business problems.
For all kinds of business problems, we are.
We are there to help you to resolve business problems.
We are to help you to resolve business problems by astrology.
For all kinds of business problems, we are there.
For all kinds, we are to help you to resolve business problems.
We are there to help you to resolve business problems by astrology.
For all kinds, we are there to help you to resolve business problems.
For all kinds, we are to help you to resolve business problems by astrology.
For all kinds of business problems, we are to help you to resolve business problems.
For all kinds, we are there to help you to resolve business problems by astrology.
For all kinds of business problems, we are there to help you to resolve business problems.
For all kinds of business problems, we are to help you to resolve business problems by astrology.