UNESCO-UNISA-iTLABS Africa Chair in Nanoscience and Nanotechnology (U2ACN2), College of Graduate Studies, University of South Africa (UNISA), Pretoria, South Africa
![[Uncaptioned image]](/html/2405.00647/assets/graphical_abstract.png)
Screening of BindingDB database ligands against EGFR, HER2, Estrogen, Progesterone and NF-B receptors based on machine learning and molecular docking
Abstract
Breast cancer, the second most prevalent cancer among women worldwide, necessitates the exploration of novel therapeutic approaches. To target the four subgroups of breast cancer “hormone receptor-positive and HER2-negative, hormone receptor-positive and HER2-positive, hormone receptor-negative and HER2-positive, and hormone receptor-negative and HER2-negative” it is crucial to inhibit specific targets such as EGFR, HER2, ER, NF-B, and PR.
In this study, we evaluated various methods for binary and multiclass classification. Among them, the GA-SVM-SVM:GA-SVM-SVM model was selected with an accuracy of 0.74, an F1-score of 0.73, and an AUC of 0.94 for virtual screening of ligands from the BindingDB database. This model successfully identified 4454, 803, 438, and 378 ligands with over 90% precision in both active/inactive and target prediction for the classes of EGFR+HER2, ER, NF-B, and PR, respectively, from the BindingDB database. Based on to the selected ligands, we created a dendrogram that categorizes different ligands based on their targets. This dendrogram aims to facilitate the exploration of chemical space for various therapeutic targets.
Ligands that surpassed a 90% threshold in the product of activity probability and correct target selection probability were chosen for further investigation using molecular docking. The binding energy range for these ligands against their respective targets was calculated to be between -15 and -5 . Finally, based on general and common rules in medicinal chemistry, we selected 2, 3, 3, and 8 new ligands with high priority for further studies in the EGFR+HER2, ER, NF-B, and PR classes, respectively.
keywords:
virtual screening, machine learning, molecular docking, breast cancer1 Introduction
Breast cancer, characterized by the highest mortality rate among various cancer types, is a widespread condition. The development and progression of breast cancer are facilitated by the interaction of estrogen and progesterone receptors with breast cells1. These hormones, estrogen and progesterone, bind to their respective receptors in the cytoplasm, leading to dimerization and subsequent entry into the nucleus. Additionally, they bind to estrogen and progesterone response elements located near the promoters of target genes. In a study by Shirazi, it was demonstrated that estradiol, an estrogen hormone, alone promoted the growth of MCF-7 cells compared to the control group. Conversely, tamoxifen, a well-known estrogen blocker, arrested the proliferation of MCF-7 cells for a minimum of five days. When both the stimulator (estradiol) and blocker (tamoxifen) were applied together, the level of stimulation in MCF-7 cell growth was reduced. Consequently, both estrogen and progesterone contribute to the initiation and acceleration of breast cancer. An excessive presence of these receptors indicates hormone (ER+/PR+) mediated breast cancer. Targeting estrogen and progesterone hormones can aid in the identification of potent inhibitors for breast cancer2, 3.
EGFR is a transmembrane glycoprotein with a crucial role in cell signaling. It consists of a ligand-binding domain and a tyrosine kinase domain. Binding with endogenous epidermal growth factor (EGF) leads to dimerization, autophosphorylation, and activation of downstream pathways, resulting in cell proliferation and differentiation4. EGFR is a major target in breast cancer, and anti-EGFR agents have shown efficacy, especially in patients with specific EGFR mutations. Tyrosine kinase inhibitors (TKIs) like gefitinib, erlotinib, and lapatinib have been used to inhibit EGFR overexpression5, 6.
HER2 is a protein with tyrosine kinase activity encoded by the neu/erbB2/c-erbB2 oncogene. It belongs to the EGFR family and plays a crucial role in the development of normal and malignant breast tissue. Approximately 30% of human breast carcinomas exhibit HER2 amplification7. HER2 interacts with insulin-like growth factor receptor-1 and estrogen receptor, initiating cell signaling. Targeting HER2 has been a focus in anti-cancer drug development, with the discovery of inhibitors like neratinib and afatinib. However, further trials are needed to confirm their efficacy against breast cancer. HER2 overexpression can increase the activity of MMP-2 and MMP-9 proteases, promoting invasiveness of breast cancer cells8. It also amplifies VEGF expression and MMP-9 activity, potentially triggering angiogenic responses. Clinical studies have shown that breast cancer cases with Erbb2 gene amplification have reduced responsiveness to certain treatments compared to cases with normal ErbB2 expression9, 10.
Nuclear factor-kappa B (NF-B) is a transcription factor that regulates the expression of genes involved in cell proliferation, immunological responses, and inflammation. It contributes to the development of breast tumors, lymphoma, and colorectal cancer11. In breast cancer, NF-B activation occurs downstream of EGFR signaling, specifically in the ER-negative subtype. HER-2 overexpression leads to the activation of the PI3K/Akt pathway and induction of NF-B. NF-B plays a role in angiogenesis by stimulating the expression of VEGF and IL-8. It can activate two signaling pathways: the classical (canonical) pathway and the alternative (noncanonical) pathway12. Drugs like lapatinib and certain microtubule disruptors activate NF-B. In vitro studies have shown that ginseng inhibits COX-2 and NF-B activation in breast cancer cell lines13.
Despite remarkable advancements in the field of basic life sciences and biotechnology, the process of drug discovery and development (DDD) continues to be slow and costly. On average, it takes around 15 years and approximately US$2 billion to develop a small-molecule drug14. While clinical studies are widely acknowledged as the most expensive phase in drug development, the greatest potential for time and cost savings lies in the earlier stages of discovery and preclinical research. Preclinical efforts alone account for over 43% of pharmaceutical expenses, in addition to significant public funding14, 15. This is primarily due to the high attrition rate observed at every step, ranging from target selection and hit identification to lead optimization and the selection of clinical candidates. Furthermore, the substantial failure rate in clinical trials, currently at 90%16, can largely be attributed to issues originating in the early stages of discovery, such as inadequate target validation or suboptimal properties of ligands. Discovering faster and more accessible methods to identify a broader range of high-quality chemical probes, hits, and leads with optimal absorption, distribution, metabolism, excretion, and toxicology (ADMET) as well as pharmacokinetics (PK) profiles during the early phases of DDD would significantly enhance outcomes in preclinical and clinical studies. Consequently, this would enable the development of more effective, accessible, and safer drugs17, 18.
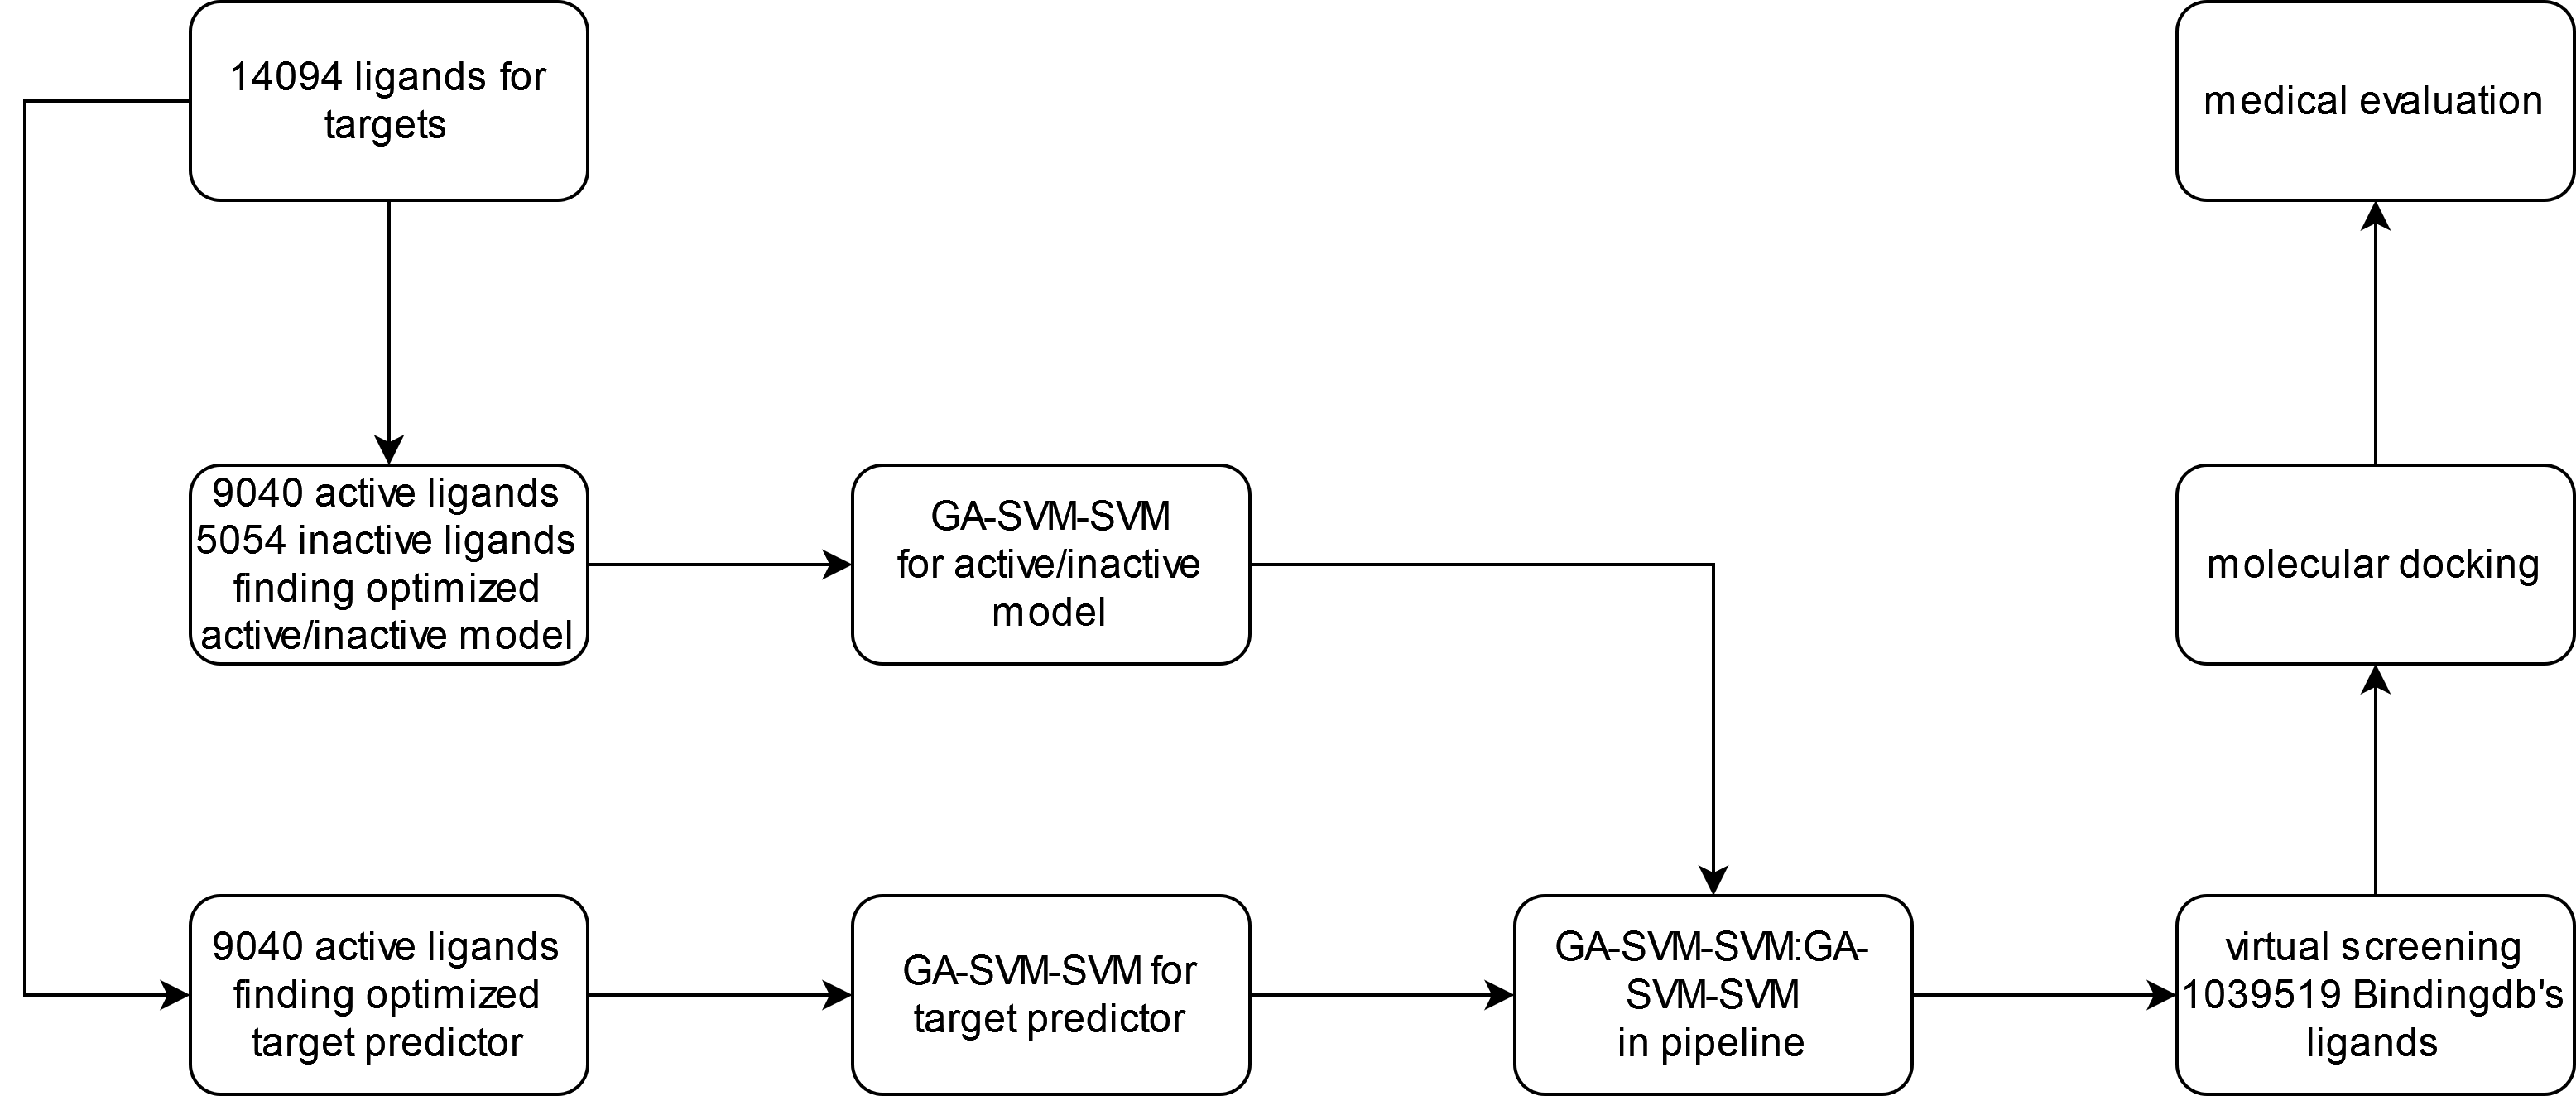
In this study, first, we developed two models with the purpose of identifying active/inactive molecules and determining the target of each ligand. Subsequently, we constructed a pipeline using these models. This pipeline was utilized to screen the bindingDB ligands, employing various thresholds of model precision. The selected ligands were subjected to molecular docking to assess their binding energy with their respective targets. Additionally, we applied several established principles in medicinal chemistry to prioritize further investigation of these selected molecules, such as molecular dynamics, in vitro and in vivo studies. Furthermore, we examined the significance of the features employed in creating the target predictor model, aiming to identify a simple rule for acceptable accurate target recognition as a common rule. The procedure’s flowchart of this study is illustrated in Figure 1.
2 Materials and methods
In this study, our dataset consisted of inhibitors targeting various breast cancer targets: 7341 for EGFR, 2182 for HER2, 1859 for ER, 1273 for NF-B, and 1439 for PR. To obtain these compounds, we downloaded five specific sdf files from the Binding database19 website, each file corresponding to a particular class of inhibitors. These sdf files were then converted to gjf files using the OpenBabel20 software. The 3D structures of all the molecules were optimized using the Austin model 1 Hamiltonian implemented in Gaussian software21. After optimization, the molecules were used to calculate molecular descriptors with the help of Alvadesc22 software. A total of 5668 descriptors, including 0-, 1-, 2-, and 3D descriptors, were generated. To streamline the dataset, descriptors with constant values in 90% of the compounds were removed. Additionally, among descriptors with a correlation above 0.9, the one exhibiting higher pair correlation with all other descriptors was kept and the others were automatically excluded. Following these processes, 1461 descriptors remained for further analysis.
| Target | active | inactive | total |
|---|---|---|---|
| EGFR | 4922 | 2419 | 7341 |
| ER | 1223 | 636 | 1859 |
| HER2 | 1393 | 789 | 2182 |
| NF-B | 447 | 826 | 1273 |
| PR | 1055 | 384 | 1439 |
| total | 9040 | 5054 | 14094 |
Each sdf file contains activity information pertaining to a specific molecule, indicating the affinity of that molecule towards different therapeutic targets. We extracted the activity information from the downloaded sdf files for each class of molecules, and saved it in separate vectors. The enumeration of the collected data can be found in Table 1. Molecules with , , and values below 2000 nM were categorized as active inhibitors, while those with values exceeding 2000 nM were considered inactive. Also we removed molecules with activity more than 10000 nM as outlier data from the inactive dataset. Both active and inactive molecules were utilized to develop and evaluate the active/inactive classifiers. These models serve the purpose of screening extensive databases and identifying new potent molecules for the treatment of breast cancer.
A dataset of 1039519 molecules was gathered from the BindingDB database. The same preparation process used for the breast cancer inhibitors described earlier was applied to these downloaded molecules. Additionally, the descriptors selected for the breast cancer inhibitors were also chosen for these molecules. This resulted in a data matrix of size , which was used for further analysis.
We employed various methods, including k-best, K-Nearest Neighbors (KNN), Gaussian Naive Bayes (GNB), Quadratic Discriminant Analysis (QDA), Random Forest (RF), and Support Vector Machine (SVM), to independently select descriptors for the active/inactive and target classifiers. To optimize the selection of descriptors across all data, we utilized a Genetic Algorithm (GA) in an optimal manner. The GA started with a population size of 200 and evolved through a maximum of 1000 generations, employing a crossover rate of 0.5 and a mutation rate of 0.2. The estimator was configured with the aforementioned methods, utilizing 5-fold cross-validation and an accuracy scoring function. The only difference between the feature selection processes of the active/inactive and target classifiers was the maximum number of features. The active/inactive classifier allowed a maximum of 64 features, while the target classifier allowed a maximum of 128 features.
We utilized the chosen features to create an optimized binary classifier for predicting active/inactive molecules. Various methods, including K-nearest neighbors (KNN), support vector machine (SVM), decision tree (DT), random forest (RF), naive Bayes (NB), linear discriminant analysis (LDA), and quadratic discriminant analysis (QDA), were employed for this purpose. To maximize the performance of each method, we conducted a grid search to identify the best parameters for constructing the model. Since the data reality is not imbalanced and due to a lack of studies on active molecules, we selected 461 active and 461 inactive molecules from the dataset to create a balanced training dataset for binary classification.
For the target classifier, we employed methods such as KNN, SVM, DT, logistic regression (LR), RF, NB, Gaussian naive Bayes (GNB), LDA, and QDA. Similar to the binary classifier, we utilized grid search to identify the optimal parameters for constructing the model. To ensure balance in the training dataset, we selected 132 active molecules for each class for the multiple classifier as well.
| GA-SVM-SVM | precision | recall | f1-score | support |
|---|---|---|---|---|
| active | 0.78 | 0.70 | 0.74 | 461 |
| inactive | 0.73 | 0.80 | 0.76 | 461 |
| GA-RF-RF | precision | recall | f1-score | support |
| active | 0.75 | 0.73 | 0.74 | 461 |
| inactive | 0.74 | 0.76 | 0.75 | 461 |
| GA-SVM-SVM | precision | recall | f1-score | support |
| EGFR+HER2 | 0.95 | 0.92 | 0.93 | 132 |
| ER | 0.91 | 0.95 | 0.93 | 132 |
| NF-B | 0.94 | 0.96 | 0.95 | 132 |
| PR | 0.96 | 0.93 | 0.95 | 132 |
| GA-QDA-SVM | precision | recall | f1-score | support |
| EGFR+HER2 | 0.94 | 0.92 | 0.93 | 132 |
| ER | 0.95 | 0.95 | 0.95 | 132 |
| NF-B | 0.93 | 0.94 | 0.93 | 132 |
| PR | 0.96 | 0.96 | 0.96 | 132 |
Based on the selected best models for the active/inactive and target classifiers, they were combined into a single pipeline as a decision model for predicting the activity and target of each BindingDB ligand. The decision-making process for the model’s predictions of activity and target was constrained by a certainty threshold of 0.8, 0.85, and 0.9 for the active/inactive classifier, and 0.9 for the target classifier.
Autodock Vina23 was utilized for molecular docking to calculate the binding affinities between ligands and their respective targets. The grid box resolution was set with specific coordinates for each target: (EGFR)(PDB ID: 1M17) had coordinates of 23.424, 1.310, 51.002 along the x, y, and z axes, respectively, with a grid spacing of 0.2 ; (HER2)(PDB ID: 3PP0) had coordinates of 17.563, 16.689, 26.321; (PR)(PDB ID: 1A28) had coordinates of 17.038, 0.145, 74.798; (ER)(PDB ID: 2IOK) had coordinates of 19.050, 35.696, 52.244; and (NF-B)(PDB ID: 4KIK) had coordinates of 48.268, 31.589, -57.885. These coordinates were used to define the binding sites for the docking process. The grid dimensions were set at . The control ligands were initially docked with the binding sites of the five receptors, and the resulting interactions were compared with standard reference ligands.
To prioritize new ligands for further studies, such as molecular dynamics and others, we utilized various rules such as Lipinski, Pfizer, GSK, and golden triangle rules. Additionally, important parameters for drug production, including QED, SAscore, and MCE-18, were calculated using ADMETlab 2.024.
|
precision | recall | f1-score | support | ||
| N/A | 0.75 | 0.74 | 0.74 | 461 | ||
| EGFR+HER2 | 0.68 | 0.74 | 0.71 | 99 | ||
| ER | 0.83 | 0.83 | 0.83 | 115 | ||
| NF-B | 0.61 | 0.61 | 0.61 | 123 | ||
| PR | 0.78 | 0.79 | 0.78 | 124 | ||
| accuracy | 0.74 | 922 | ||||
| macro avg | 0.73 | 0.74 | 0.73 | 922 | ||
| weighted avg | 0.74 | 0.74 | 0.74 | 922 | ||
|
precision | recall | f1-score | support | ||
| N/A | 0.73 | 0.76 | 0.74 | 461 | ||
| EGFR+HER2 | 0.68 | 0.70 | 0.69 | 99 | ||
| ER | 0.82 | 0.83 | 0.83 | 115 | ||
| NF-B | 0.56 | 0.50 | 0.53 | 123 | ||
| PR | 0.80 | 0.76 | 0.78 | 124 | ||
| accuracy | 0.73 | 922 | ||||
| macro avg | 0.72 | 0.71 | 0.71 | 922 | ||
| weighted avg | 0.72 | 0.73 | 0.73 | 922 | ||
|
precision | recall | f1-score | support | ||
| N/A | 0.75 | 0.74 | 0.74 | 461 | ||
| EGFR+HER2 | 0.68 | 0.73 | 0.70 | 99 | ||
| ER | 0.82 | 0.84 | 0.83 | 115 | ||
| NF-B | 0.60 | 0.59 | 0.60 | 123 | ||
| PR | 0.78 | 0.78 | 0.78 | 124 | ||
| accuracy | 0.74 | 922 | ||||
| macro avg | 0.73 | 0.74 | 0.73 | 922 | ||
| weighted avg | 0.74 | 0.74 | 0.74 | 922 | ||
|
precision | recall | f1-score | support | ||
| N/A | 0.73 | 0.76 | 0.74 | 461 | ||
| EGFR+HER2 | 0.69 | 0.71 | 0.70 | 99 | ||
| ER | 0.82 | 0.82 | 0.82 | 115 | ||
| NF-B | 0.57 | 0.51 | 0.54 | 123 | ||
| PR | 0.80 | 0.77 | 0.78 | 124 | ||
| accuracy | 0.73 | 922 | ||||
| macro avg | 0.72 | 0.71 | 0.72 | 922 | ||
| weighted avg | 0.73 | 0.73 | 0.73 | 922 | ||
3 Results and discussion
EGFR and HER2 receptors, shows 83.71% similarity in their residues using sequence alignment with BLOSUM weight matrix and have a large similarity in their 3D structure using Needleman-Wunsch alignment algorithm with BLOSUM-62 similarity matrix (Fig. S1 and S2). Moreover, near 70% of ligands in BindingDB database with EGFR and HER2 targets, were identical. According to these reasons, we merged two classes of EGFR and HER2 to just one EGFR/HER2 class.
The active/inactive and target classifiers utilized 128 and 64 selected features, respectively (see tables S1 and S2). Various models were created using the aforementioned methods. The top two models for the active/inactive classifier were GA-SVM-SVM and GA-RF-RF, while for the target classifier, they were GA-SVM-SVM and GA-QDA-SVM. The GA-SVM-SVM binary classifier was constructed using the radial basis function (RBF) kernel with a gamma value of 0.1 and a regularization term of 1. Similarly, GA-RF-RF was built using the Gini function with 400 trees and maximum depth until all leaves were pure. The forest construction involved the use of bootstrap sampling. Furthermore, GA-SVM-SVM and GA-QDA-SVM multi-classifiers were employed with the RBF kernel, a gamma value of 0.01, and a regularization term of 10. The classification was performed using the one-vs-one strategy, which has been shown to provide higher prediction accuracy compared to the one-vs-rest approach25. As shown in Table 2, the active/inactive classifiers GA-SVM-SVM and GA-RF-RF achieved precision, recall, and F1-scores all above 0.7. Likewise, the target classifiers GA-SVM-SVM and GA-RF-RF achieved precision, recall, and F1-scores all above 0.9.
| Threshold | |||||
|---|---|---|---|---|---|
| classes | 0:0 | 0:90 | 80:90 | 85:90 | 90:90 |
| EGFR+HER2 | 172498 | 95123 | 19796 | 11068 | 4454 |
| ER | 54101 | 22876 | 3613 | 2029 | 803 |
| NF-B | 45452 | 16400 | 2499 | 1257 | 438 |
| PR | 67323 | 14109 | 2300 | 1116 | 378 |
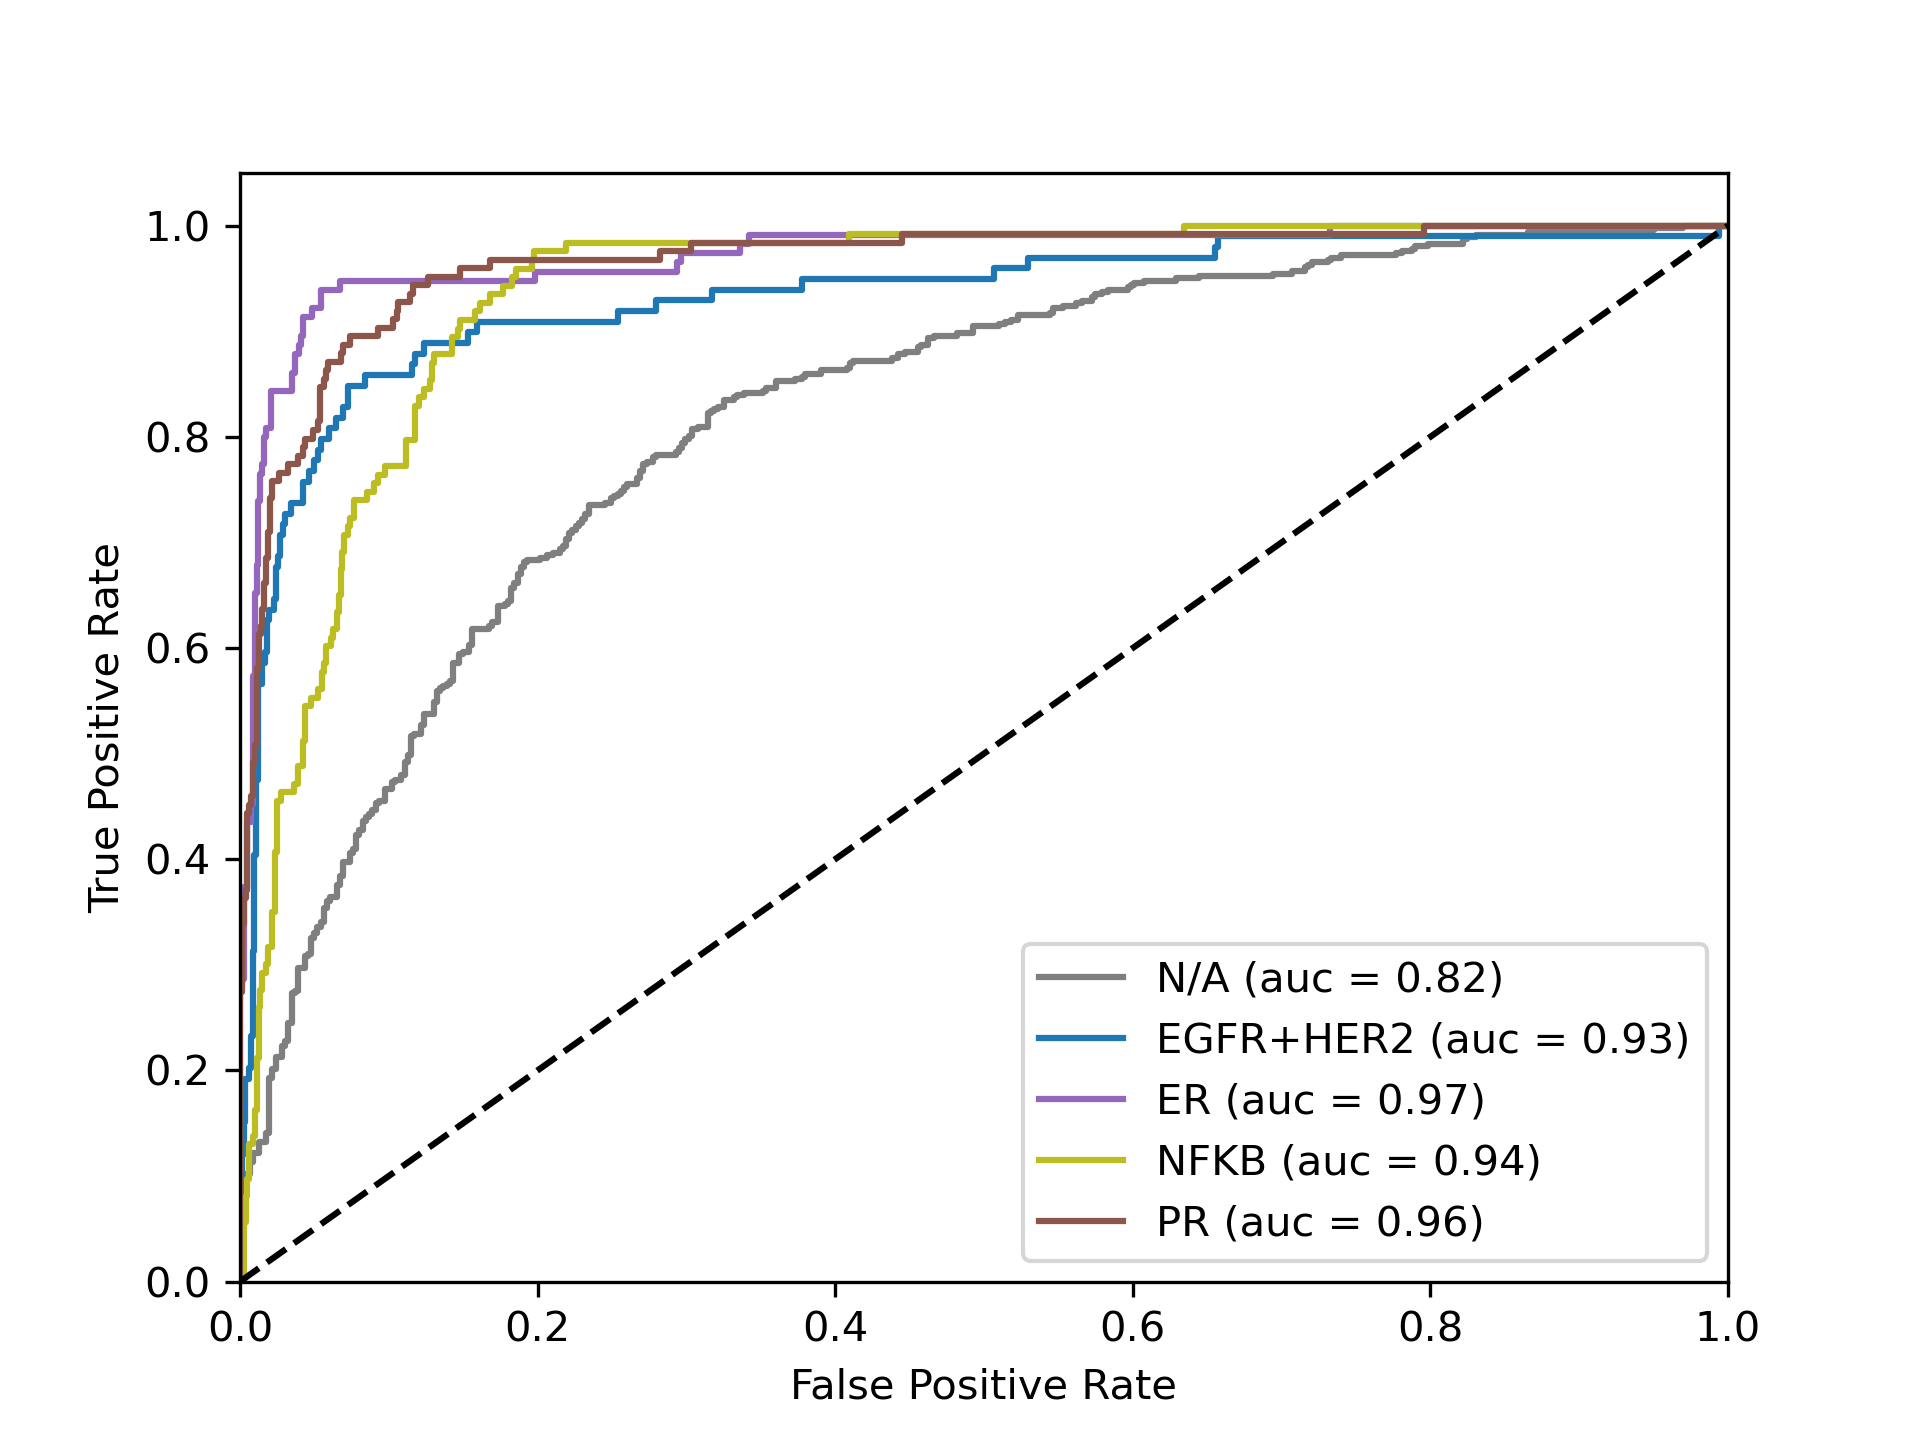
Subsequently, we generated a pipeline by combining different permutations of the selected model. The precision, recall, f1-score, and support of these models are presented in Table 3. Among the options, the GA-SVM-SVM:GA-SVM-SVM model emerged as the most suitable pipeline, displaying superior performance compared to others. This approach achieved an accuracy of 0.74 and an AUC of 0.94. Figure 2 showcases the ROC plots for each class using the one-vs-rest strategy, further validating the effectiveness of the GA-SVM-SVM:GA-SVM-SVM model for virtual screening. Table 4 provides insights into the number of selected molecules from the BindingDB database for each target, based on different predetermined thresholds. Notably, this table reveals the presence of 4454, 803, 438, and 378 new inhibitor molecules for EGFR+HER2, ER, NF-B, and PR, respectively. These novel inhibitors were selected with 90% precision in both the active/inactive and therapeutic classification decision-making processes.
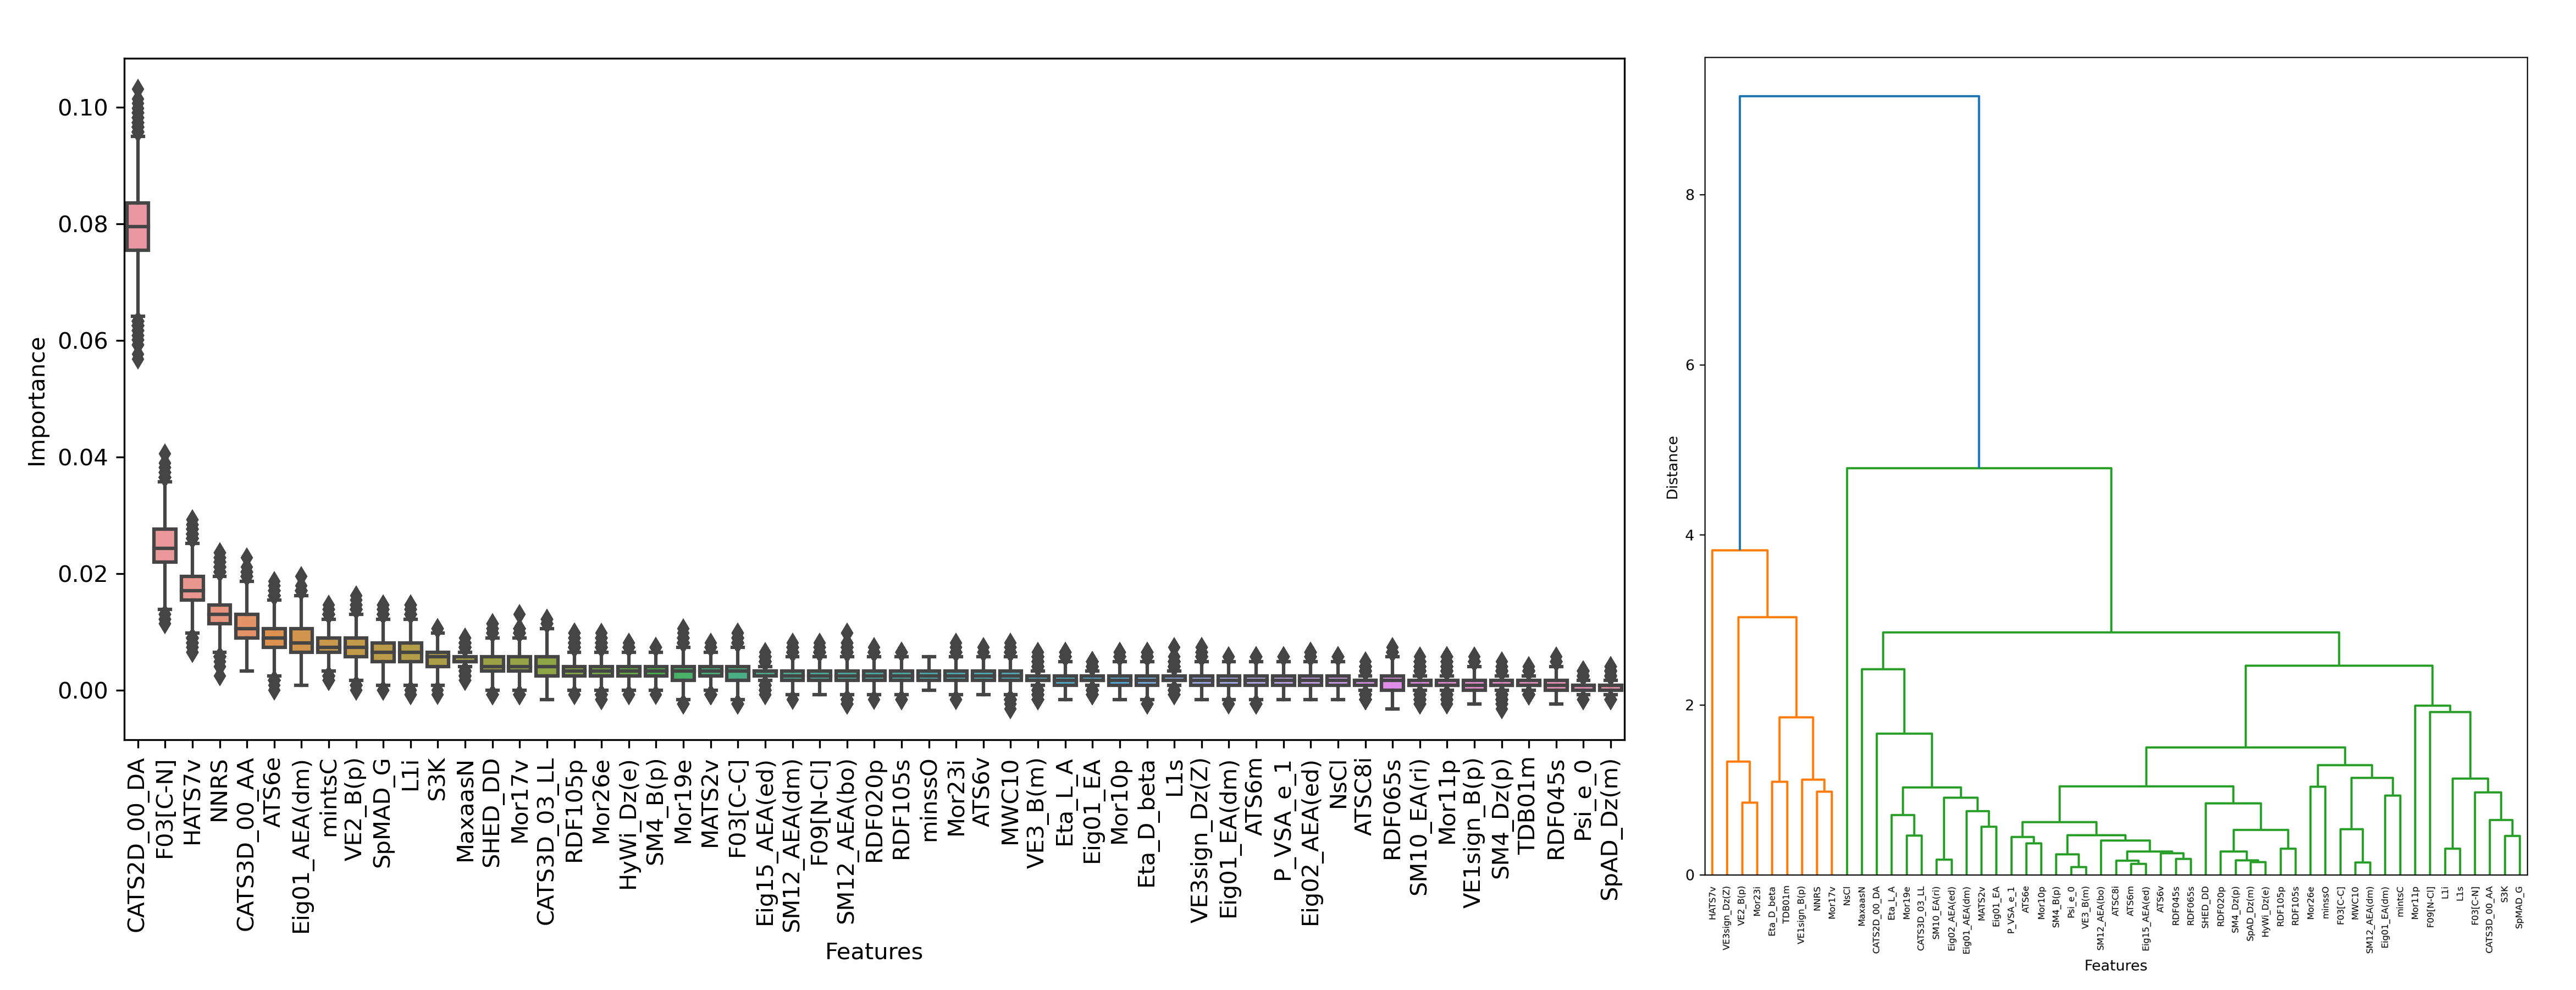
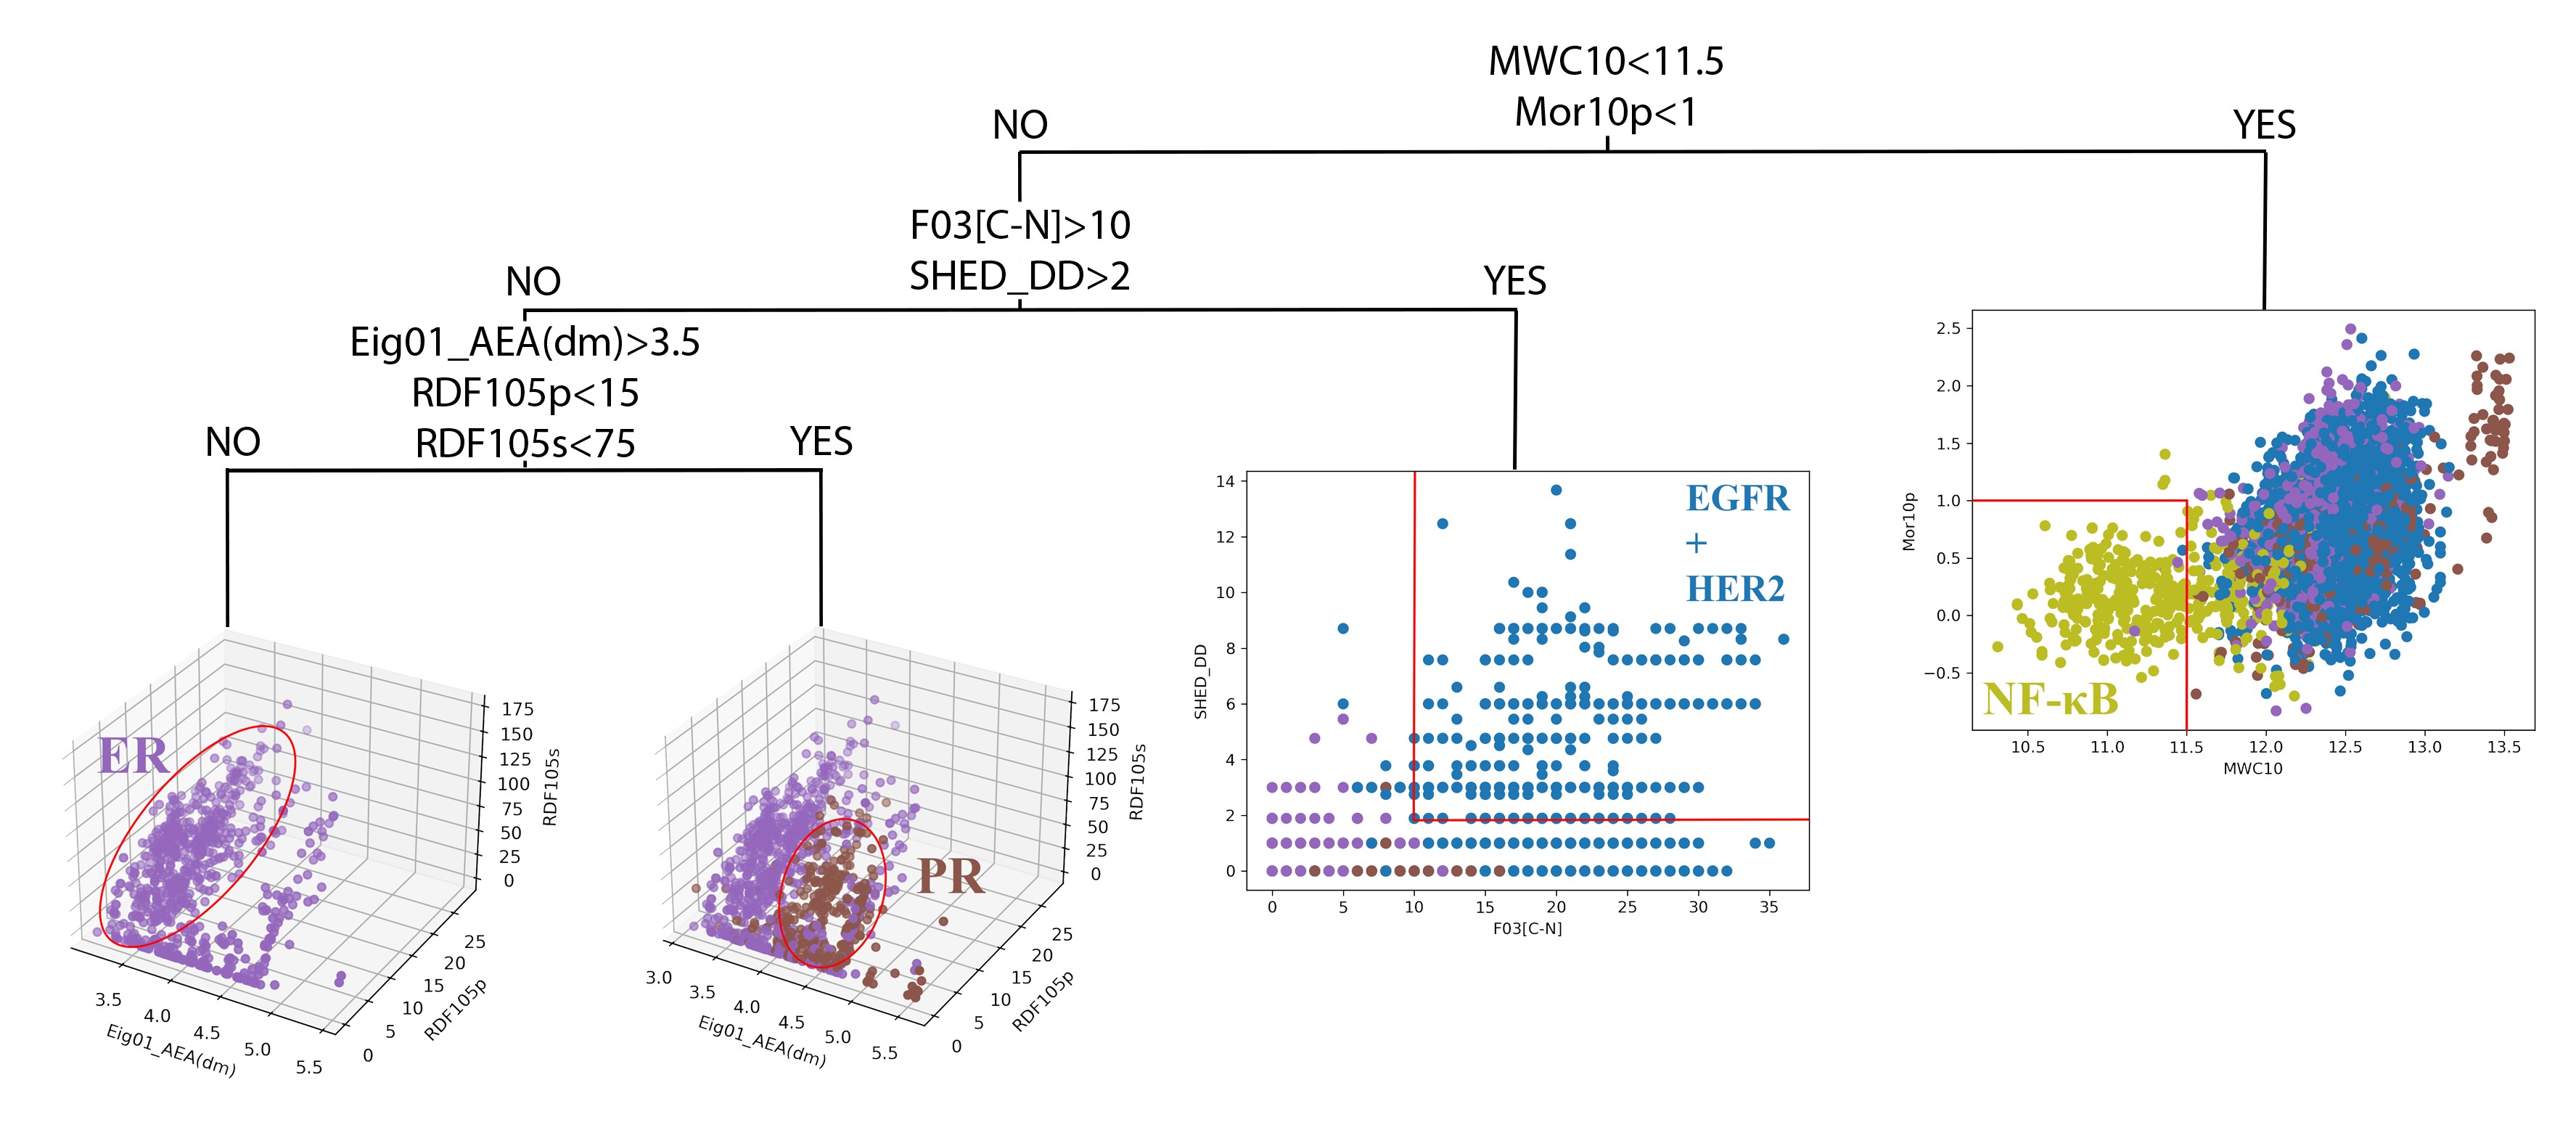
In order to easily identify the target for each molecule, our objective was to extract a straightforward rule from the model. To achieve this, we employed permutation importance to determine the significance of each feature in the model. Additionally, we utilized the Pearson method to create a hierarchical clustering dendrogram, which helped us identify the correlation distance (Euclidean distance) between features. Figure 3 displays the feature importance and hierarchical clustering dendrogram. Based on these findings, we constructed a simple questionnaire dendrogram for determining the target of each molecule which are selected with 90% precision in both the active/inactive and target classification decision-making, as illustrated in Figure 4. The data presented in Figure 4 provide concise and effective structure-activity relationship (SAR) information regarding the inhibitors. For instance, NF-B inhibitors exhibit significantly lower values for molecular walk count of order 10 (MWC10) and signal 10/weighted by polarizability (Mor10p) compared to other inhibitors. Additionally, EGFR and HER2 inhibitors demonstrate higher values of frequency of C–N at topological distance 3 (F03[C-N]) and SHED Donor-Donor (SHED_DD) in comparison to ER and PR inhibitors. The ratio of eigenvalue n.1 from augmented edge adjacency mat. weighted by dipole moment (Eig01_AEA(dm)), radial distribution function–105/weighted by polarizability (RDF105p), and radial distribution function–105/weighted by I-state (RDF105s) differentiates PR and ER inhibitors. These SAR information types effectively filter a significant portion of large databases, thus accelerating early-stage drug discovery projects that begin with extensive databases like GDB-1326. The classification of molecules based on their therapeutic targets has garnered considerable attention in the field of chemoinformatics27. These types of classifiers expand on the concept of “Chemography”28, 29, which refers to the art of navigating through chemical space. As evident from these figures, the inhibitors cluster within specific regions of the selected chemical space, aligning with the core objective of chemography.
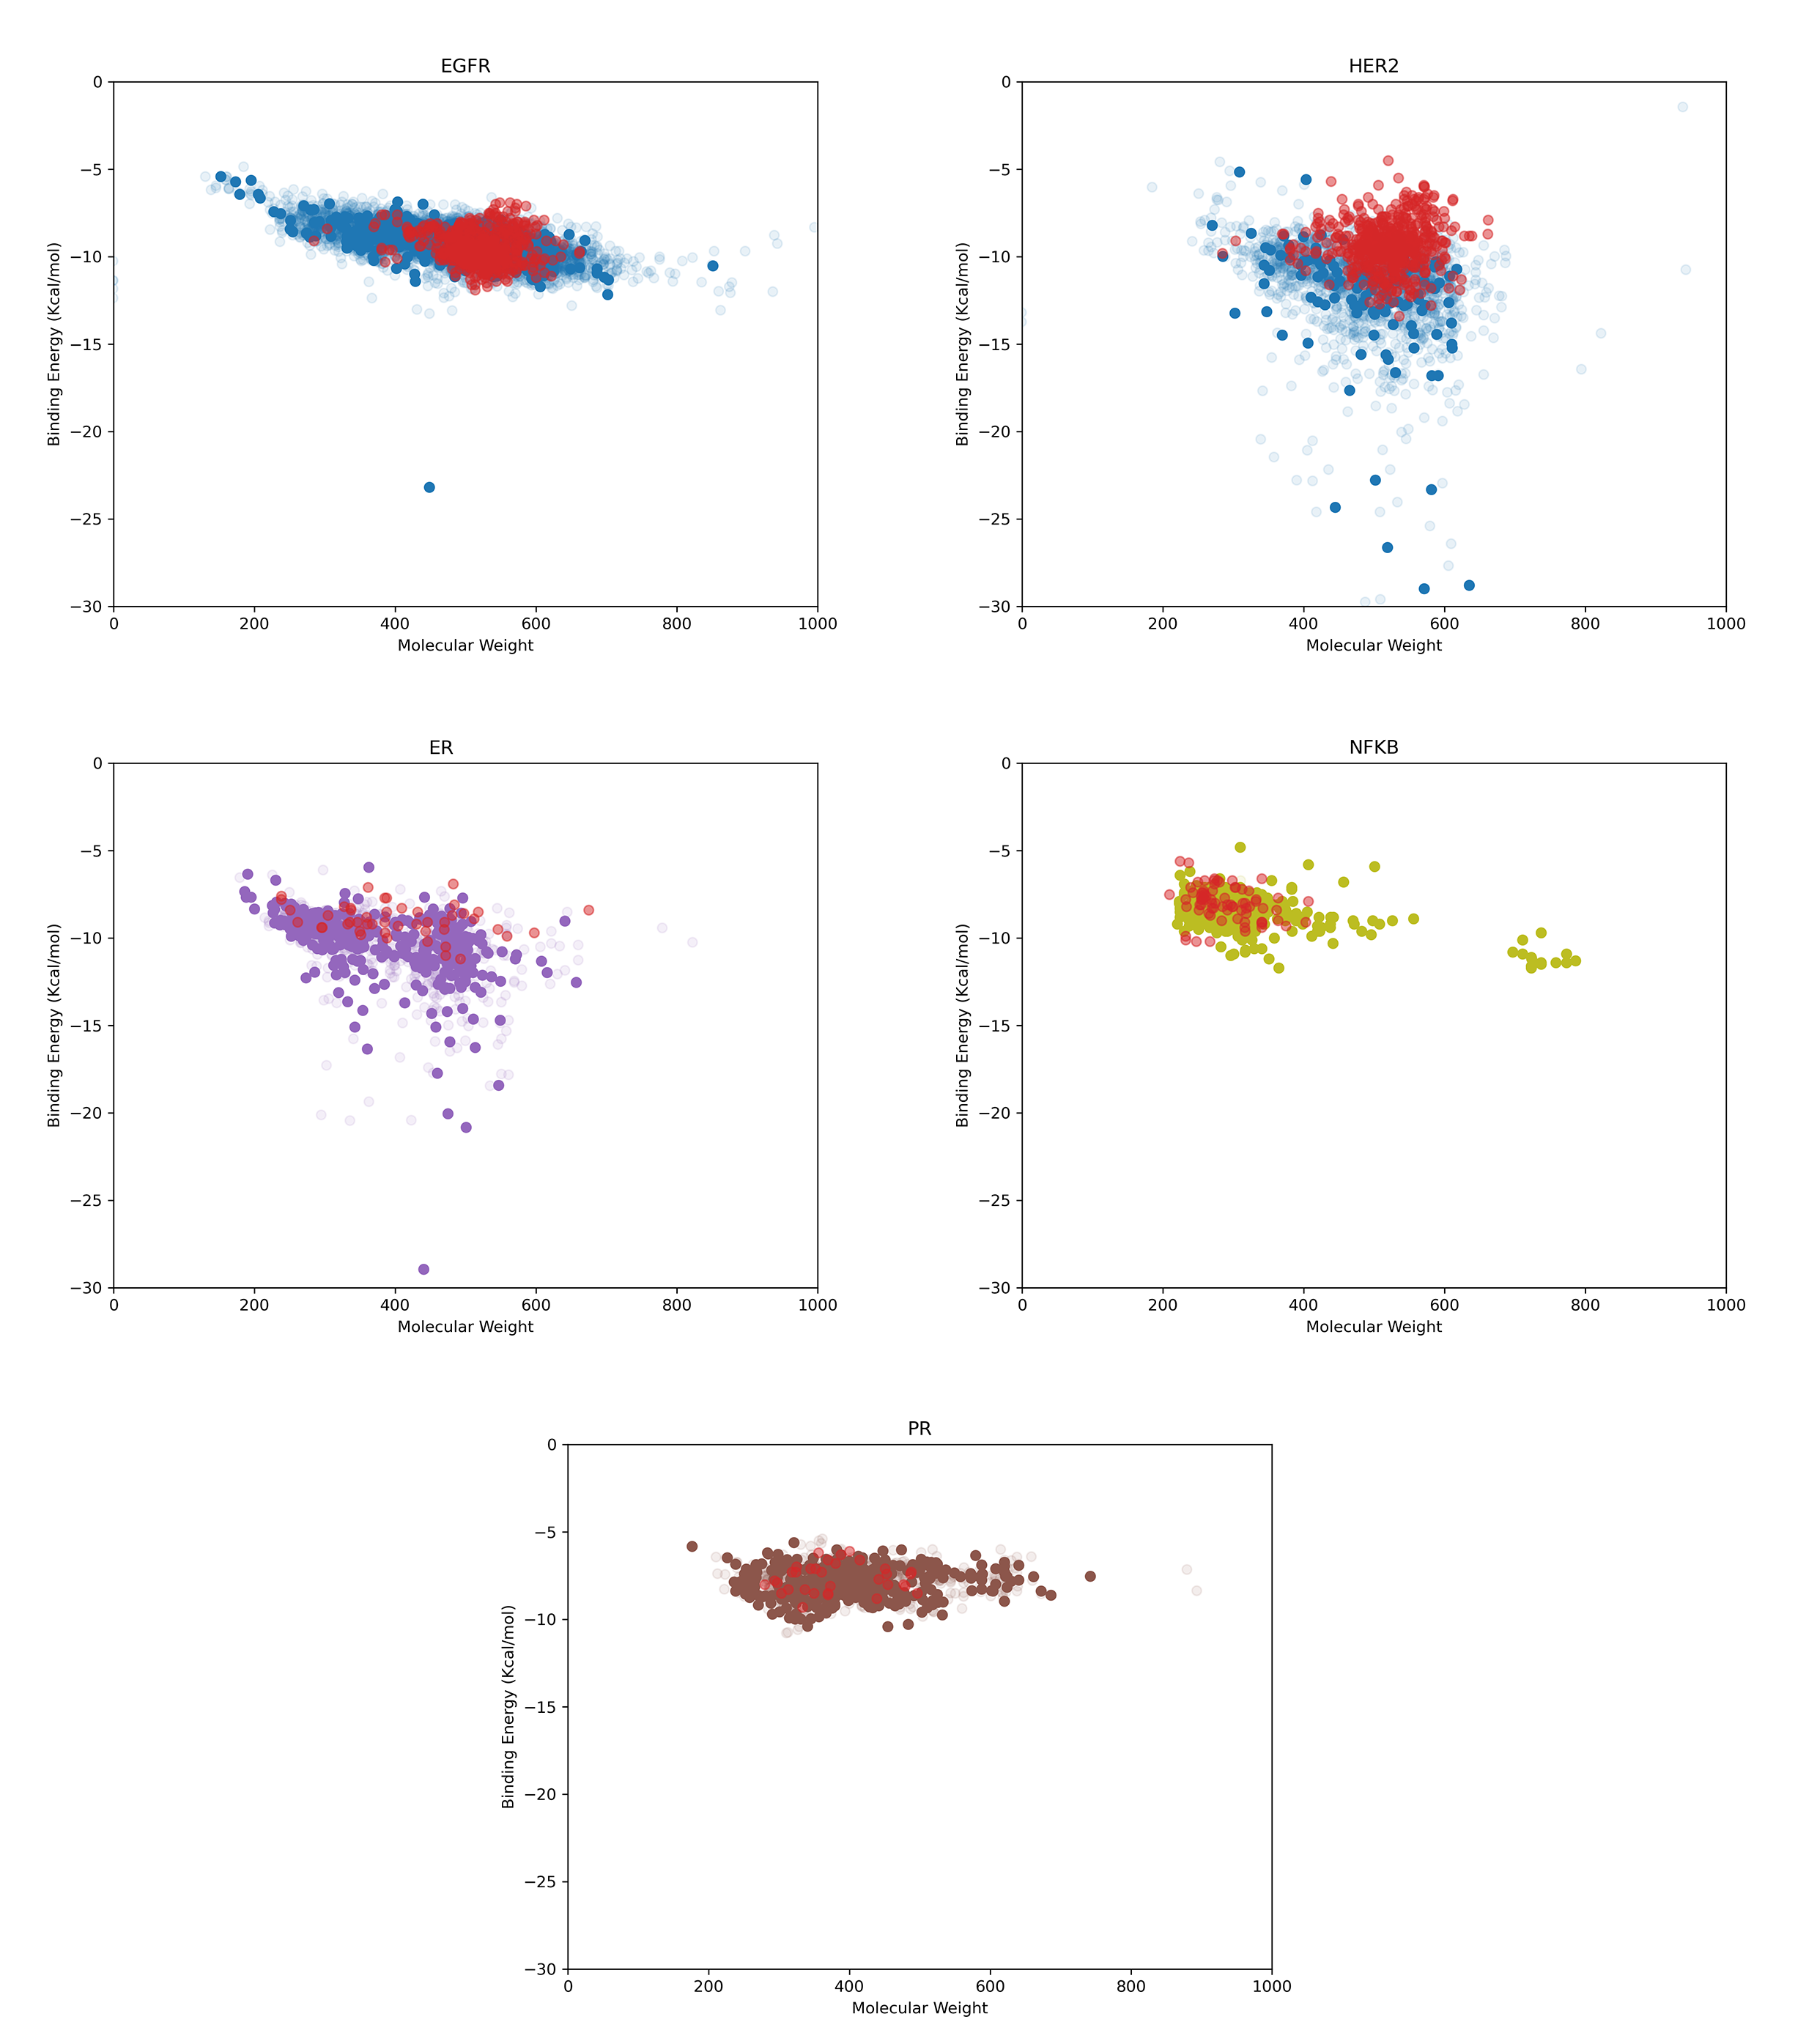
In order to assess the binding energy of the molecules selected using the GA-SVM-SVM:GA-SVM-SVM model, we employed molecular docking for both the chosen molecules (with a multiplication of precision product exceeding 0.9 for both active/inactive and target classification) and the molecule sets within each class. The distribution of binding energy for these molecules, based on their molecular weights, is depicted in Figure 5. In these plots, the pale dots represent the active inhibitors labeled by the bindingDB database, while the filled dots represent the active molecules utilized in constructing the GA-SVM-SVM:GA-SVM-SVM model. The red dots correspond to new inhibitors, which exhibit binding energy within the range of -15 to -5 . This range of binding energy proves to be sufficiently suitable for forming protein-ligand complexes.
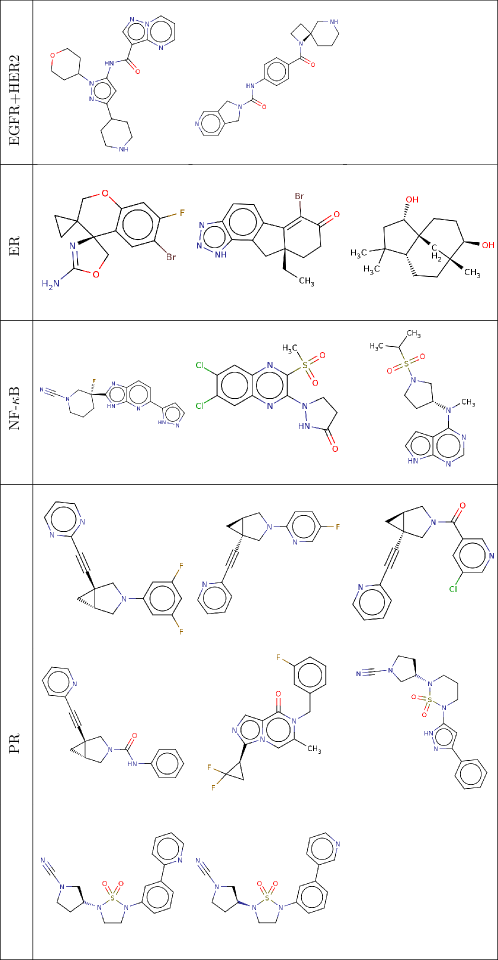
In order to prioritize further study on the new molecules, we applied several medicinal criteria. The Lipinski rule suggests that ligands with a molecular weight of less than or equal to 500 (), a logarithm of the n-octanol/water distribution coefficient of less than or equal to 5 (), a number of hydrogen bond acceptors of less than or equal to 10 (), and a number of hydrogen bond donors of less than or equal to 5 () exhibit good absorption or permeability. Accordingly, 376, 59, 91, and 35 ligands were accepted based on the Lipinski rule for EGFR+HER2, ER, NF-B, and PR targets, respectively. The Pfizer rule states that ligands with a and a topological polar surface area of less than or equal to 75 () are likely to be toxic. Consequently, 577, 30, 38, and 15 ligands passed the Pfizer rule for EGFR+HER2, ER, NF-B, and PR targets, respectively. The GSK rule suggests that ligands with a and may have a more favorable ADMET (absorption, distribution, metabolism, excretion, and toxicity) profile. Thus, 6, 11, 65, and 12 ligands were accepted based on the GSK rule for EGFR+HER2, ER, NF-B, and PR targets, respectively. Additionally, the golden triangle hypothesis proposes that ligands with a and a logD (logarithm of the n-octanol/water distribution coefficient at pH = 7.4) ranging from -2 to 5 () may have a more favorable ADMET profile. Consequently, 166, 53, 91, and 34 ligands fulfilled the golden triangle criteria for EGFR+HER2, ER, NF-B, and PR targets, respectively. Moreover, several parameters such as QED (desirability functions based on eight drug-likeness related properties including , , , , , , ), SAscore (synthetic accessibility score based on a combination of fragment contributions and a complexity penalty), and MCE-18 (medicinal chemistry evolution in 2018 score molecules by novelty in terms of their cumulative sp3 complexity) were considered favorable in the medical industry. Ligands with QED greater than 0.67, SAscore less than 6, and MCE-18 larger than 45 were deemed desirable. Accordingly, 6, 14, 4, and 14 ligands met these criteria for EGFR+HER2, ER, NF-B, and PR targets, respectively. The distributions of selected molecules according to these rules are illustrated in Figures S3-S7. The molecules depicted in Figure 6 satisfy all these criteria. Specifically, 2, 3, 3, and 8 ligands met all the parameters for EGFR+HER2, ER, NF-B, and PR targets, respectively. As observed in this figure, each ligand within each class exhibits unique structural properties.
4 Conclusion
In this research, we utilized various machine learning methods and employed the GA-SVM-SVM and GA-RF-RF models for the active/inactive classification, as well as GA-SVM-SVM and GA-QDA-SVM for therapeutic classification. Based on the revenue generated by these methods in the pipeline, we selected GA-SVM-SVM:GA-SVM-SVM as the most effective pipeline for virtual screening. This model screened the BindingDB database inhibitors with varying precision ratios. As a result, we identified 4454, 803, 438, and 378 new inhibitor molecules for EGFR+HER2, ER, NF-B, and PR, respectively. Moreover, we introduced a simple dendrogram to determine the target of each inhibitor with new ligands which are predicted with over 90% precision in both active/inactive and target prediction.
The molecules that exhibited a precision product exceeding 0.9 for both active/inactive and target classification were selected for further evaluation of their binding energy. Molecular docking analysis revealed that the binding energies of these inhibitors to their therapeutic targets ranged from -15 to -5 , which is considered suitable for inhibiting the targets.
To prioritize further investigation of these new molecules, we applied several filters, including the Lipinski, Pfizer, GSK, golden triangle rules, as well as QED, SAscore, and MCE-18 parameters. Among these filters, 2, 3, 3, and 8 ligands met all the specified criteria for EGFR+HER2, ER, NF-B, and PR targets, respectively. We believe that this study can provide valuable insights for researchers working on the discovery of new inhibitors for breast cancer.
The authors acknowledge the UNESCO UNISA iThemba-LABS/NRF Africa Chair in Nanoscience & Nanotechnology (U2ACN2) and the Centre for High-Performance Computing (CHPC), South Africa for providing computational resources and facilities for this research project. The authors would like to express their gratitude to all the members of the bioinformatics lab at Tarbiat Modares University (TMU) for their valuable contributions in the form of discussions and critical feedback on the manuscript.
Figures of sequence and structural alignment of EGFR and HER2 receptors, distribution of ligands according to the Lipinski, Pfizer, GSK, golden triangle rules and medical synthesis parameters and table of selected features for active/inactive and target are presented in supporting information.
5 Data Availability
Scripts of this study is available on Github, allowing users to access the source code. Visit our GitHub repository at https://github.com/parham-rezaee/bindingdb-bc-virtual-screening.
References
- IsmaiL \latinet al. 2018 IsmaiL, S.; UzaiRu, A.; Sagagi, B.; SuleiMan, M. S. Insilico Molecular Docking and Pharmacokinetic Studies of Selected Phytochemicals With Estrogen and Progesterone Receptors as Anticancer Agent for Breast Cancer. Journal of the Turkish Chemical Society Section A: Chemistry 2018, 5, 1337–1350
- Zhou \latinet al. 2014 Zhou, Z.; Qiao, J. X.; Shetty, A.; Wu, G.; Huang, Y.; Davidson, N. E.; Wan, Y. RETRACTED ARTICLE: Regulation of estrogen receptor signaling in breast carcinogenesis and breast cancer therapy. Cellular and Molecular Life Sciences 2014, 71, 1549–1549
- Gnanaselvan \latinet al. 2024 Gnanaselvan, S.; Yadav, S. A.; Manoharan, S. P. Structure-based virtual screening of anti-breast cancer compounds from Artemisia absinthium —insights through molecular docking, pharmacokinetics, and molecular dynamic simulations. Journal of Biomolecular Structure and Dynamics 2024, 42, 3267–3285
- Schwartz and Murray 2011 Schwartz, P. A.; Murray, B. W. Protein kinase biochemistry and drug discovery. Bioorganic Chemistry 2011, 39, 192–210
- Yang \latinet al. 2015 Yang, J. C.-H. \latinet al. Afatinib versus cisplatin-based chemotherapy for EGFR mutation-positive lung adenocarcinoma (LUX-Lung 3 and LUX-Lung 6): analysis of overall survival data from two randomised, phase 3 trials. The Lancet Oncology 2015, 16, 141–151
- Johnston, S.R.D. and Leary, A. 2006 Johnston, S.R.D.; Leary, A. Lapatinib: A novel EGFR/HER2 tyrosine kinase inhibitor for cancer. Drugs of Today 2006, 42, 441
- Brennan \latinet al. 2000 Brennan, P. J.; Kumogai, T.; Berezov, A.; Murali, R.; Greene, M. I. HER2/Neu: mechanisms of dimerization/oligomerization. Oncogene 2000, 19, 6093–6101
- Li \latinet al. 2014 Li, L.; Wang, Y.; Qi, B.; Yuan, D.; Dong, S.; Guo, D.; Zhang, C.; Yu, M. Suppression of PMA-induced tumor cell invasion and migration by ginsenoside Rg1 via the inhibition of NF-κB-dependent MMP-9 expression. Oncology Reports 2014, 32, 1779–1786
- Purawarga Matada \latinet al. 2022 Purawarga Matada, G. S.; Dhiwar, P. S.; Abbas, N.; Singh, E.; Ghara, A.; Das, A.; Bhargava, S. V. Molecular docking and molecular dynamic studies: screening of phytochemicals against EGFR, HER2, estrogen and NF-KB receptors for their potential use in breast cancer. Journal of Biomolecular Structure and Dynamics 2022, 40, 6183–6192
- Asadollahi-Baboli and Mani-Varnosfaderani 2013 Asadollahi-Baboli, M.; Mani-Varnosfaderani, A. Shuffling multivariate adaptive regression splines as a predictive method for modeling of novel pyridylmethylthio derivatives as VEGFR2 inhibitors. Medicinal Chemistry Research 2013, 22, 2645–2653
- Zubair and Frieri 2013 Zubair, A.; Frieri, M. Role of Nuclear Factor-B in Breast and Colorectal Cancer. Current Allergy and Asthma Reports 2013, 13, 44–49
- Alberti \latinet al. 2012 Alberti, C.; Pinciroli, P.; Valeri, B.; Ferri, R.; Ditto, A.; Umezawa, K.; Sensi, M.; Canevari, S.; Tomassetti, A. Ligand-dependent EGFR activation induces the co-expression of IL-6 and PAI-1 via the NFkB pathway in advanced-stage epithelial ovarian cancer. Oncogene 2012, 31, 4139–4149
- Peralta \latinet al. 2009 Peralta, E. A.; Murphy, L. L.; Minnis, J.; Louis, S.; Dunnington, G. L. American Ginseng Inhibits Induced COX-2 and NFKB Activation in Breast Cancer Cells. Journal of Surgical Research 2009, 157, 261–267
- Sun \latinet al. 2022 Sun, D.; Gao, W.; Hu, H.; Zhou, S. Why 90% of clinical drug development fails and how to improve it? Acta Pharmaceutica Sinica B 2022, 12, 3049–3062
- Alamdari \latinet al. 2012 Alamdari, R.; Mani-Varnosfaderani, A.; Asadollahi-Baboli, M.; Khalafi-Nezhad, A. Monte Carlo sampling and multivariate adaptive regression splines as tools for QSAR modelling of HIV-1 reverse transcriptase inhibitors. SAR and QSAR in Environmental Research 2012, 23, 665–682
- Bajorath 2015 Bajorath, J. Computer-aided drug discovery. F1000Research 2015, 4, 630
- Sadybekov and Katritch 2023 Sadybekov, A. V.; Katritch, V. Computational approaches streamlining drug discovery. Nature 2023, 616, 673–685
- Jalali-Heravi and Mani-Varnosfaderani 2011 Jalali-Heravi, M.; Mani-Varnosfaderani, A. QSAR modelling of integrin antagonists using enhanced Bayesian regularised genetic neural networks. SAR and QSAR in Environmental Research 2011, 22, 293–314
- Gilson \latinet al. 2016 Gilson, M. K.; Liu, T.; Baitaluk, M.; Nicola, G.; Hwang, L.; Chong, J. BindingDB in 2015: A public database for medicinal chemistry, computational chemistry and systems pharmacology. Nucleic Acids Research 2016, 44, D1045–D1053
- O’Boyle \latinet al. 2011 O’Boyle, N. M.; Banck, M.; James, C. A.; Morley, C.; Vandermeersch, T.; Hutchison, G. R. Open Babel: An open chemical toolbox. Journal of Cheminformatics 2011, 3, 33
- Frisch 2009 Frisch, A. Gaussian 09: user’s reference; Gaussian: Wallingford, Conn., 2009; OCLC: 711965588
- Mauri 2020 Mauri, A. In Ecotoxicological QSARs; Roy, K., Ed.; Springer US: New York, NY, 2020; pp 801–820
- Trott and Olson 2010 Trott, O.; Olson, A. J. AutoDock Vina: Improving the speed and accuracy of docking with a new scoring function, efficient optimization, and multithreading. Journal of Computational Chemistry 2010, 31, 455–461
- Xiong \latinet al. 2021 Xiong, G.; Wu, Z.; Yi, J.; Fu, L.; Yang, Z.; Hsieh, C.; Yin, M.; Zeng, X.; Wu, C.; Lu, A.; Chen, X.; Hou, T.; Cao, D. ADMETlab 2.0: an integrated online platform for accurate and comprehensive predictions of ADMET properties. Nucleic Acids Research 2021, 49, W5–W14
- Jalali‐Heravi \latinet al. 2013 Jalali‐Heravi, M.; Mani‐Varnosfaderani, A.; Valadkhani, A. Integrated One‐Against‐One Classifiers as Tools for Virtual Screening of Compound Databases: A Case Study with CNS Inhibitors. Molecular Informatics 2013, 32, 742–753
- Blum and Reymond 2009 Blum, L. C.; Reymond, J.-L. 970 Million Druglike Small Molecules for Virtual Screening in the Chemical Universe Database GDB-13. Journal of the American Chemical Society 2009, 131, 8732–8733
- Jalali-Heravi \latinet al. 2011 Jalali-Heravi, M.; Mani-Varnosfaderani, A.; Jahromi, P. E.; Mahmoodi, M. M.; Taherinia, D. Classification of anti-HIV compounds using counterpropagation artificial neural networks and decision trees. SAR and QSAR in Environmental Research 2011, 22, 639–660
- Von Korff and Hilpert 2006 Von Korff, M.; Hilpert, K. Assessing the Predictive Power of Unsupervised Visualization Techniques to Improve the Identification of GPCR-Focused Compound Libraries. Journal of Chemical Information and Modeling 2006, 46, 1580–1587
- Jalali‐Heravi and Mani‐Varnosfaderani 2012 Jalali‐Heravi, M.; Mani‐Varnosfaderani, A. Navigating Drug‐Like Chemical Space of Anticancer Molecules Using Genetic Algorithms and Counterpropagation Artificial Neural Networks. Molecular Informatics 2012, 31, 63–74