dust, extinction — galaxies: evolution — galaxies: halos — galaxies: ISM — intergalactic medium — quasars: absorption lines
Evolution of grain size distribution in the circum-galactic medium
Abstract
In order to theoretically understand dust properties in the circum-galactic medium (CGM), we construct a dust evolution model that incorporates the evolution of grain size distribution. We treat each of the galaxy and the CGM as a one-zone object, and consider the mass exchange between them. We take into account dust production and interstellar dust processing for the galaxy based on our previous models, and newly incorporate sputtering in the hot phase and shattering in the cool phase for the CGM. We find that shattering increases the dust destruction (sputtering) efficiency in the CGM. The functional shape of the grain size distribution in the CGM evolves following that in the galaxy, but it is sensitive to the balance between sputtering and shattering in the CGM. For an observational test, we discuss the wavelength dependence of the reddening in the CGM traced by background quasar colors, arguing that, in order to explain the observed reddening level, a rapid inflow from the CGM to the galaxy is favored because of quick dust/metal enrichment. Small grain production by shattering in the CGM also helps to explain the rise of dust extinction toward short wavelengths.
1 Introduction
Dust affects the brightness of background objects through extinction, that is, scattering and absorption of light. Dust usually causes reddening, since it absorbs and scatters light more efficiently at shorter wavelengths (e.g., [Draine (2003)]). Dust is prevailing in the interstellar medium (ISM); thus, in order to estimate the intrinsic luminosity or color of a Galactic object, we need to correct the observed flux for the dust extinction in the line of sight. Observation of an extragalactic object is also affected by the reddening in the ISM of its host galaxy. Thus, it is important to understand the dust extinction properties in the ISM of the Galaxy and extragalactic objects.
Dust is also known to be distributed on larger scales than galaxies, that is, in the intergalactic medium (IGM) or in the circum-galalctic medium (CGM). Background quasars are used to trace the extinction of foreground absorption line systems distributed in the circum-galactic or intergalactic space. Since dust extinction in these systems is generally small, reddening of the IGM or CGM has been detected in a statistical manner through a large sample of quasars observed mainly by the Sloan Digital Sky Survey (SDSS; [York et al. (2000)]). For example, York et al. (2006) obtained the dust extinction curves of foreground absorption systems from the comparison between quasar samples with and without intervening absorbers. Ménard et al. (2010) detected reddening on a scale of several Mpc around galaxies at median ( is the redshift) by taking a cross-correlation between the color excess of background quasars and the projected density of galaxies. A similar radial reddening profile was obtained for nearer () galaxies by Peek et al. (2015). Ménard & Fukugita (2012) detected reddening in Mg ii absorbers, which are considered to be located in the CGM in the intervening systems (e.g., Steidel et al. (1994); Lan (2020)). In addition to the above absorption studies, Meinke et al. (2023) found extended dust emissions around a sample of galaxies at by stacking millimeter data. An analytic cosmological galaxy structure model developed by Masaki & Yoshida (2012) also supported such a large-scale dust distribution.
Dust in the CGM and IGM is important in the following aspects. Dust in the CGM contributes significantly to the total dust content in the Universe, since galaxy halos contain an amount of dust comparable to galaxy disks on average (Ménard et al., 2010; Fukugita, 2011). As mentioned above, dust distributed in a large volume of the Universe causes slight extinction or reddening of background sources, causing some bias in the colors and fluxes of the objects used as statistical tracers of large-scale structures (Mörtsell & Goobar, 2003; Avgoustidis et al., 2009). In addition to reddening, dust could also contribute to the cooling of the hot ( K, where is the gas temperature) gas contained in the CGM (e.g., Dwek (1987); Tsai & Mathews (1995); Mathews & Brighenti (2003)). In cooler gas in the CGM and IGM, dust could play an important role in gas heating through the photoelectric effect (Inoue, 2003; Inoue & Kamaya, 2004). Therefore, in order to reveal the thermal properties of the CGM and IGM, the evolution of dust needs to be clarified.
The dust in the CGM should be supplied from the central galaxy. There are some observations that showed spatial dust distributions extending the galactic disk to the CGM, indicating a connection between the dust in these two regions (Howk & Savage, 1997; Alton et al., 1998). Galactic outflows driven by energy input (feedback) from supernovae (SNe) and active galactic nuclei (AGNs; e.g., Veilleux et al. (2005)) can transport dust from the galaxy to the CGM. Some hydrodynamic simulations showed that this dust transport actually happens (Zu et al., 2011; McKinnon et al., 2016; Hou et al., 2017; Aoyama et al., 2018). A detailed high-resolution simulation showed that a significant fraction of the dust survives against sputtering in galactic outflows (Richie et al., 2024). Semi-analytic frameworks also provide theoretically expected dust mass budget in the CGM (Triani et al., 2020; Parente et al., 2023). Recent theoretical studies also suggested that galactic outflows can be an important mechanism for the loss of dust from galaxies at high redshift (Burgarella et al., 2020; Nanni et al., 2020). Radiation pressure from stars provides another way of supplying dust to the CGM (Ferrara et al., 1991; Davies et al., 1998; Bianchi & Ferrara, 2005; Hirashita & Inoue, 2019). The CGM is also a reservoir of gas for the central galaxy. The infall of the CGM into the galaxy can trigger star formation, which further enhances stellar feedback. Therefore, the mass exchange between the CGM and its central galaxy is the key process that clarifies the origin of the dust in the CGM.
Otsuki & Hirashita (2024) (hereafter OH24) developed a dust enrichment model in the CGM by considering the mass exchange with the central galaxy. The evolution of the dust content in the galaxy is calculated in a manner consistent with the metal enrichment based on an already developed model (e.g., Lisenfeld & Ferrara (1998); Dwek (1998); Hirashita (1999)). The model includes stellar dust production, dust growth in the ISM, and dust destruction in SN shocks. The dust content in the CGM is calculated by considering dust supply from galactic outflows and dust destruction by sputtering. The latter process occurs in the hot ( K) phase (Tsai & Mathews, 1995) of the CGM. OH24 focused on the dust abundance at ages comparable to the present-day Universe ( Gyr), and found that the resulting dust mass in the CGM is consistent with the value derived from a large sample of SDSS galaxies. Using a much more comprehensive model based on a semi-analytic framework, Parente et al. (2023) also obtained a similar CGM dust mass, confirming that the physical processes regarding the CGM dust evolution are successfully included in the models. In particular, the dust mass in the CGM can be explained by the scenario in which the dust is supplied by the outflows from the central galaxy.
However, there is another important aspect for the dust in the CGM, which is the grain size distribution (the distribution function of grain size). In fact, the above important processes of dust in the IGM and CGM, that is, reddening and heating/cooling occur in a way dependent on the grain size, more precisely the grain size distribution. Thus, for a detailed understanding of these processes, it is crucial to clarify not only the total dust abundance but also the grain size distribution. In this paper, we focus on the CGM, since it is the site where the dust produced in the galaxy is directly injected. Therefore, the purpose of this paper is to construct a model that describes the evolution of the grain size distribution in the CGM. To achieve this goal, we need to treat the evolution of grain size distribution in the central galaxy, with which the CGM exchanges mass. The grain size distribution in a galaxy is already modeled in some previous studies (Asano et al., 2013; Hirashita & Aoyama, 2019), which we are able to utilize to model the central galaxy in this paper. We extend the model to include the dust evolution in the CGM.
In addition to the dust destruction by sputtering, there is a process that is potentially important for the evolution of the grain size distribution in the CGM: Hirashita & Lan (2021) showed that shattering could occur in cool clumps in the CGM. Coexistence of cool clumps and hot gas is also shown by a high-resolution cosmological simulation (Ramesh et al., 2023). In cool clumps, grain motion, which causes grain–grain collisions, is assumed to be governed by turbulence. Some observations showed that the cool medium in the CGM is turbulent (Qu et al., 2022; Chen et al., 2023). Shattering preserves the total dust mass, so that it was not explicitly included in OH24. However, shattering is considered to be a unique process that could explain the existence of small grains indicated by the rest-frame ultraviolet excess in the reddening curves (Hirashita & Lan, 2021). The above cool phase could be traced by Mg ii absorbers, which Lan & Fukugita (2017) considered to have a typical gas density of cm-3 ( is the hydrogen number density) and a typical dimension of 30 pc. Gas clumps of similar size are also observed in the Milky Way halo (e.g., Ben Bekhti et al. (2009)) as well as in quasar absorption line systems at high redshift (e.g., Rauch et al. (1999); Prochaska & Hennawi (2009)). Lan & Mo (2019), based on an analytically estimated evaporation time-scale, found that the lifetime of a cool clump is yr. Hirashita & Lan (2021) showed that shattering in cool clumps with a duration of yr raises the abundance of small grains to a level high enough to explain the ultraviolet excess in the reddening curves mentioned above.
In this paper, we construct a theoretical framework for the evolution of grain size distribution in the CGM by including both shattering and sputtering. We extend the model developed by OH24 to include the evolution of grain size distribution. As done by OH24, we treat the CGM in a consistent manner with its central galaxy by including mass exchange. As emphasized by OH24, we take an analytical approach without solving hydrodynamical evolution. This serves to directly address how the grain size distribution in the CGM is affected by the efficiencies or time-scales of relevant processes. In other words, the model developed in this paper will clarify what determines the grain size distribution in the CGM. We also calculate reddening curves in order to directly output observable properties of the CGM dust.
2 Model
We construct a model that describes the evolution of grain size distribution in a galaxy and its CGM. Since the dust in the CGM is supplied from the central galaxy, we also need to model the mass exchange between the CGM and the galaxy as well as the dust evolution within the galaxy. OH24 already modeled the evolution of dust mass in the CGM by considering the mass exchange with the galaxy and including relevant processes that affect the dust content in the galaxy and the CGM. Since OH24 did not treat grain size distribution, we modify their framework. The evolution of grain size distribution by various processes is formulated based on our previous models, especially taken from Asano et al. (2013) and Hirashita & Aoyama (2019). Since dust enrichment is tightly related to metal production (e.g., Lisenfeld & Ferrara (1998)), we model the chemical evolution in the CGM and the galaxy. We treat each of the CGM and the central galaxy as a one-zone object, of which the spatial structure is neglected. We treat the galaxy–CGM system as an isolated system and neglect the matter circulation outside it.
Because we neglect detailed spatial structures in the galaxy and the CGM, we assume that the grain size distribution in the outflow (inflow) is the same as that in the galaxy (CGM). Indeed, a significant fraction of large grains, which are the major component of the dust population in the galaxy, survive against sputtering in galactic outflows (Richie et al., 2024). Since we are not able to distinguish the gas once launched to the CGM and that preexisting in the CGM, ‘dust destruction in the CGM’ in our framework includes sputtering both in the outflow and in the CGM.
2.1 Chemical evolution
We calculate the enrichment of metals and dust in the CGM and the galaxy. We describe the evolution of the gas, metal, and dust masses in the galaxy, denoted as , , and , respectively. The masses of the same components in the CGM are denoted with superscript ‘C’ (i.e., , , and ). In our definition, the metals include both gas and dust phases. The following equations are based on OH24, but are modified to include the grain size distribution.
In the galaxy, the evolution of the above mass components is described by (e.g., Inoue (2011)):
| (1) | |||||
| (2) | |||||
| (3) |
where is the star formation rate, is the gas return rate from stars, is the inflow rate from the CGM, is the outflow rate to the CGM, is the metallicity of the gas in the galaxy, is the ejection rate of metals from stars, is the metallicity in the CGM, is the dust-to-gas ratio in the galaxy, is the dust-to-gas ratio in the CGM, and is the contribution to the dust mass increase from interstellar dust processing (dust growth by accretion and dust destruction by SN shocks). Using the above three equations, we obtain the time evolution of and as
| (4) | |||||
| (5) |
We use equation (4) to calculate the metallicity, but we do not use equation (5) since interstellar processing is directly evaluated through the evolution of grain size distribution formulated in subsection 2.2. Instead, we calculate the dust-to-gas ratio contributed from stars (denoted as ) by evaluating the stellar terms in equation (5):
| (6) |
A similar approach is taken by Hirashita & Murga (2020).
In the CGM, the evolution is described by
| (7) | |||||
| (8) | |||||
| (9) |
where is the changing rate of dust mass by dust processing in the CGM. From the above three equations, we obtain the time evolution of and as
| (10) | |||||
| (11) |
We use equation (10) to calculate the metallicity evolution in the CGM, while we do not solve equation (11) but directly use the dust evolution model in subsection 2.2. We still refer to equation (11) together with equation (5) later in formulating the effect of mass exchange between the galaxy and the CGM (sub-subsection 2.2.3).
In summary, we use equations (1) and (4) to obtain the evolution of the gas and metal content in the galaxy and apply equations (7) and (10) to calculate that in the CGM. For the dust evolution, we directly solve the equations formulated later in subsection 2.2, but we use equation (6) to evaluate the contribution from stellar dust sources (sub-subsection 2.2.1). We do not use equations (5) and (11), but we refer to these equations in evaluating the effects of inflow and outflow on the grain size distribution (sub-subsection 2.2.3).
The rates of star formation, inflow, and outflow are determined by time-scales (, , and , respectively), which are treated as constant free parameters: , , and . We expect that the inflow and outflow are related to the star formation activity in the galaxy. Thus, we assume and and treat and as free parameters. Instead of determining these parameters by conducting detailed hydrodynamical calculations, we move them in a wide range. This serves to investigate the effects of each process on the resulting grain size distribution. Also, the above parameterization assumes smooth changes in the SFR, and inflow/outflow rates. Yajima et al. (2017) showed using cosmological hydrodynamical simulations that star formation may be intermittent at the beginning of galaxy evolution when the galaxy mass is low but that it is smooth at low redshift. Moreover, we are interested in evolution on a Gyr time-scale, which is much longer than the intermittence. Therefore, the smooth SFR realized in our analytic work is reasonably applicable to this paper. Based on the star formation history, the mass ejection rates from stars (, and for gas, metals, and dust, respectively) are calculated by equations (8)–(10) of Hirashita & Murga (2020) using stellar yield calculation data quoted in the same paper.
2.2 Evolution of grain size distribution
The evolution of grain size distribution is calculated based on our previous models, especially those developed by Hirashita & Aoyama (2019) and Hirashita & Lan (2021). The grain size distribution at time is defined as the number density of dust grains in the radius range between and . We calculate the grain size distributions in the galaxy and in the CGM, which are denoted as and , respectively. In equations that describe the evolution of grain size distribution, we use the grain mass distribution in the galaxy
| (12) |
where the grain mass is calculated by assuming a spherical shape as ( is the material density). We also define as the grain mass distribution normalized to the gas mass density: , where is the gas mass per hydrogen mass, and is the hydrogen atom mass. The grain mass distribution is linked to the dust-to-gas ratio as
| (13) |
The grain mass distribution in the CGM is defined in the same way and denoted with superscript ‘C’ as and .
The grain size distribution is discretized into 128 logarithmically spaced grain radius bins in the range of –10 following appendix B of Hirashita & Aoyama (2019). For the boundary condition, we adopt and (or equivalently and ) at the maximum and minimum grain radii.
2.2.1 In the galaxy
We calculate the evolution of grain size distribution in the galaxy based on Hirashita & Aoyama (2019) and Hirashita & Murga (2020). We refer the interested reader to these references for detailed equations. In what follows, we review the calculation of grain size distribution in each process and describe the changes made to include the mass exchange between the galaxy and the CGM.
We include stellar dust production, shattering in the diffuse ISM, dust growth by the accretion of gas-phase metals in the dense gas (this process is referred to as accretion), coagulation in the dense ISM, and destruction in SN shocks (referred to as SN destruction). For simplicity, we separate the ISM into dense and diffuse phases and assume the mass fraction of the dense ISM to be 0.5 (i.e., the other half is occupied by the diffuse ISM). The effect of varying the dense gas fraction has already been examined by Hirashita & Murga (2020), and the adopted fraction 0.5 explains well the Milky Way extinction curve. The time-step is weighted with the dense gas fraction (0.5) for accretion and coagulation, and with the diffuse gas fraction (0.5) for shattering. The densities and temperatures of the dense and diffuse phases are and (0.3, ), respectively. For the other processes (stellar dust production and SN destruction), we use the full time-step.
For stellar dust production, the increasing rate of grain size distribution at radius (or equivalently at mass ) is evaluated using (equation 6). We distribute this newly supplied dust into grain radius bins by assuming a lognormal distribution centered at with a standard deviation of 0.47 (see also Asano et al. (2013)).
For accretion and SN destruction, we adopt the changing rate of (, where the dot indicates the time derivative) that depends on the grain radius. As a consequence, the grain size distribution is governed by advection equations with appropriate (or ). The accretion rate is estimated by the collision rate between grains and gas-phase metals. Following Hirashita (2023), we set a maximum for the dust-to-metal ratio, ; that is, accretion is turned off if the dust-to-metal ratio exceeds this value. This maximum value is adopted to match the dust extinction and emission per hydrogen in the Milky Way, and is also based on the consideration that some metal elements are not easily incorporated into the dust (solid) phase. For SN destruction, we estimate the dust destruction rate based on the sweeping rate of SN shocks in the ISM (the SN rate is evaluated in a manner consistent with the star formation history, ) with an assumed efficiency of destruction as a function grain radius, :
| (14) |
For coagulation and shattering, we solve Smoluchowski equations using a Kernel function evaluated with geometrical cross-sections and grain velocities. We consider the grain–gas coupling in a Kolmogorov turbulence to obtain the typical grain velocity as a function of grain radius. For shattering, we adopt the total fragment mass formed in a collision and the fragment size distribution function from Kobayashi & Tanaka (2010).
For coagulation, we newly include the coagulation threshold velocity, above which grain–grain collisions do not lead to sticking. This is to avoid run-away coagulation, which could occur because larger grains have higher velocities. In reality, grains should bounce or fragmented in high-velocity collisions. Thus, we multiply the Kernel function ()111In Hirashita & Aoyama (2019), the Kernel function is denoted as . Since is used to parameterize the inflow time-scale in this paper (subsection 2.1), we adopt a different notation. used in Hirashita & Aoyama (2019) by an exponential cut-off function for coagulation:
| (15) |
where and are the masses of the two colliding grains, is the relative velocity (with a random direction), is the cross-section ( and are the grain radii of the two grains), and is the coagulation threshold velocity above which grains do not stick. We adopt km s-1, which is near to the velocity ( km s-1) above which collisions could disrupt grains (Wada et al., 2013). As argued by Hirashita & Voshchinnikov (2014), lower thresholds suggested experimentally by Blum (2000) and theoretically by Dominik & Tielens (1997) fail to produce grains larger than 0.1 . Indeed, the above coagulation threshold velocity reproduces the maximum grain radius (; Mathis et al. (1977), hereafter MRN) for the Milky Way.
2.2.2 In the CGM
The evolution of grain size distribution in the CGM is driven by sputtering and shattering. Sputtering takes place in the hot phase with K (e.g., Draine & Salpeter (1979); Tsai & Mathews (1995); Hirashita et al. (2015)), while shattering occurs in a colder medium (referred to as cool clumps; Hirashita & Lan (2021)). For simplicity, we assume the weighting factor (or the mass fraction) for these two phases to be 0.5; that is, a single time-step is divided into two steps ( for each) and we treat shattering and sputtering in each of these time-steps. These weighting factors are degenerate with the efficiencies of shattering and sputtering. Thus, we fix the mass fractions of the two phases and move the efficiencies of the relevant processes as we will explain below.
The equation describing sputtering is the same as that used for SN destruction in the galaxy, but we use a different destruction rate. We adopt the following formula for the time-scale of dust destruction by sputtering, utilizing in equation (14):
| (16) |
where is the destruction time-scale treated as a free parameter. Note that and are related as described below equation (12). In the hot phase, sputtering occurs even more quickly than the exchange between the cool and hot phases. Small grains formed in cool clumps by shattering do not suffer sputtering before they are injected into the hot medium. Thus, we effectively regard as the phase exchange time-scale between the cool and hot gas. We incorporate the above form of into the equation describing the evolution of grain size distribution by sputtering (see equation 7 of Hirashita & Aoyama (2019)).
For shattering, we use the method developed by Hirashita & Lan (2021). We adopt their fiducial values for the gas density and temperature in cool clumps ( cm-1 and K). The grain velocity, which contributes to the kernel function in the shattering equation, is determined by the turbulence model described in the same paper. The turbulence is assumed to have a Kolmogorov spectrum with injection scale and maximum velocity . We adopt the fiducial values for these two parameters ( pc and km s-1). Larger grains, coupled with larger eddies, tend to have higher velocities. At the same time, if grains are too large (typically ), they are not coupled even with the largest eddies. Therefore, the grain velocity becomes a decreasing function of at . Based on this grain velocity model, we solve the same shattering equation as used for the dust in the galaxy.
Since predominantly affects the shattering efficiency, we specifically denote in cool clumps as , and vary it. The gas density in cool clumps affects the grain size distribution in the CGM in the following two aspects (Hirashita & Lan, 2021): (i) The grain–grain collision rate is enhanced in denser (larger ) environments. (ii) Large grains (typically at ) attain higher velocities for higher because the grains are more strongly coupled with the gas (turbulence). Because of these two effects, the shattering rate in the CGM is sensitive to .
2.2.3 Effect of the CGM–galaxy mass exchange
In addition to the dust processing in the galaxy and CGM, we also need to include the mass exchange between these two zones through the outflow and inflow. The inflow changes the grain mass distribution in the galaxy as
| (17) |
The inflow does not affect the grain mass distribution in the CGM. The outflow causes the following change for the grain mass distribution in the CGM:
| (18) |
The outflow does not affect the grain mass distribution in the galaxy. These terms are similar to the inflow and outflow terms in the equations for and (equations 5 and 11, respectively). Indeed, if we integrate the above two equations for , we obtain the corresponding terms for equations (5) and (11). The inflow and outflow tend to make the grain size distributions in the CGM and in the galaxy approach each other on timescales and , respectively.
2.3 Settings and parameters
We start calculation from and with a metal (dust)-free condition ( and ) at . In this situation, the galaxy builds up its baryonic content by the inflow. We adopt M⊙ as a tentative value, aiming roughly at the baryonic mass in the Milky Way. This is the same as the CGM mass in OH24. While the CGM gas mass is constant in OH24 (i.e., the CGM is treated as a gas reservoir), it is decreased by the infall in our model. Thus, we effectively adopt a smaller mass scale than OH24. However, since we output the grain size distributions per gas mass (subsection 2.2), it is independent of the total mass scale. Therefore, the choice of does not directly influence the conclusions in this paper.
For the grain material density, we adopt g cm-2, which is taken from astronomical silicate in Weingartner & Draine (2001). Carbonaceous dust has a lower density; thus, with a fixed dust abundance, the grain number density is larger. This leads to somewhat faster interstellar processing such as small grain formation by shattering. Carbonaceous dust also has small tensile strength, so that it is more easily shattered (Jones et al., 1996). Therefore, adopting silicate properties would serve to examine a conservative case for the effectiveness of interstellar processing. However, the difference in grain species affects the grain size distribution less than the variations in the efficiencies of essential physical processes; that is, the differences in , , , and are more significant. Thus, we focus on these parameters, fixing the dust material properties.
As described in subsection 2.1, the inflow and outflow are regulated by the parameters and , respectively. We vary and with Gyr fixed to the fiducial value adopted by OT24 (see also Asano et al. (2013); Hirashita & Murga (2020)). By fixing , we concentrate on the variations of and . We expect that and are not much above or below unity since otherwise, the gas masses of the galaxy and the CGM are strongly imbalanced.222To avoid this imbalance, OH24 assumed a constant CGM mass (i.e. the CGM acted as a gas reservoir in their model) as mentioned above. However, this assumption is not essential in the parameter ranges of interest. Thus, we adopt and for the fiducial values, and investigate the range of –10 and –10. We note that corresponds to the mass-loading factor in OT24. Some hydrodynamical simulations indicate that (or ; e.g., Hu et al. (2023)), although it is sensitive to the treatment of stellar feedback and is dependent on the galactocentric distance. We do not directly include AGN feedback. Valiante et al. (2011) included galactic outflows driven by both SNe and AGNs in the dust evolution model based on their semi-analytic model. Because of the co-evolution of stellar and black-hole masses as is also reproduced by their model, we expect that AGN feedback is indirectly related to the stellar feedback. Thus, we could regard as effectively including AGN-driven outflows, although we need to develop a model that includse the evolution of the central black hole and the CGM at the same time (e.g., Ramesh et al. (2023)) to isolate the effect of AGNs.
The sputtering time-scale is related to the exchange time-scale between the cool and hot gas phases (sub-subsection 2.2.2). OH24 adopted a sputtering time-scale of 2 Gyr based on the gradual decline of the dust mass density in the CGM seen in a hydrodynamic simulation (Aoyama et al., 2018). However, OH24 did not consider the grain radius dependence, and we expect that the time-scale is shorter for small grains whose destruction efficiency is almost unity (). In this paper, we determine in the following way. The lifetime of cool clumps can be as long as 0.1–1 Gyr based on analytic estimates (Lan & Mo, 2019) and hydrodynamical simulations (Armillotta et al., 2017), but could be uncertain because of the details in thermal conduction and magnetic field (Li et al., 2020; Sparre et al., 2020). We adopt Gyr as a fiducial value and examine a range of 0.03–3 Gyr, considering the uncertainties. As mentioned in sub-subsection 2.2.2, the gas density in cool clumps has a large influence on the shattering efficiency. We vary in the range of 0.03–0.3 cm-3 with a fiducial value of 0.1 cm-3 (Hirashita & Lan, 2021). The variations of these parameters serve to clarify how sputtering and shattering affect the grain size distribution in the CGM.
The varied parameters are summarized in table 2.3, where we show the fiducial values and the ranges. Since we model grain processing in the grain-size-dependent way, the parameterization is not exactly the same as that in OT24. Thus, we do not fine-tune the parameters but investigate a wide range for each of them. This approach is also useful to investigate the response of the grain size distribution to the relevant parameters.
Parameters. Parameter units fiducial value minimum maximum 1 0.1 10 1 0.1 10 Gyr cm-3 0.1 0.01 1
3 Results
3.1 Dust and gas masses in the CGM
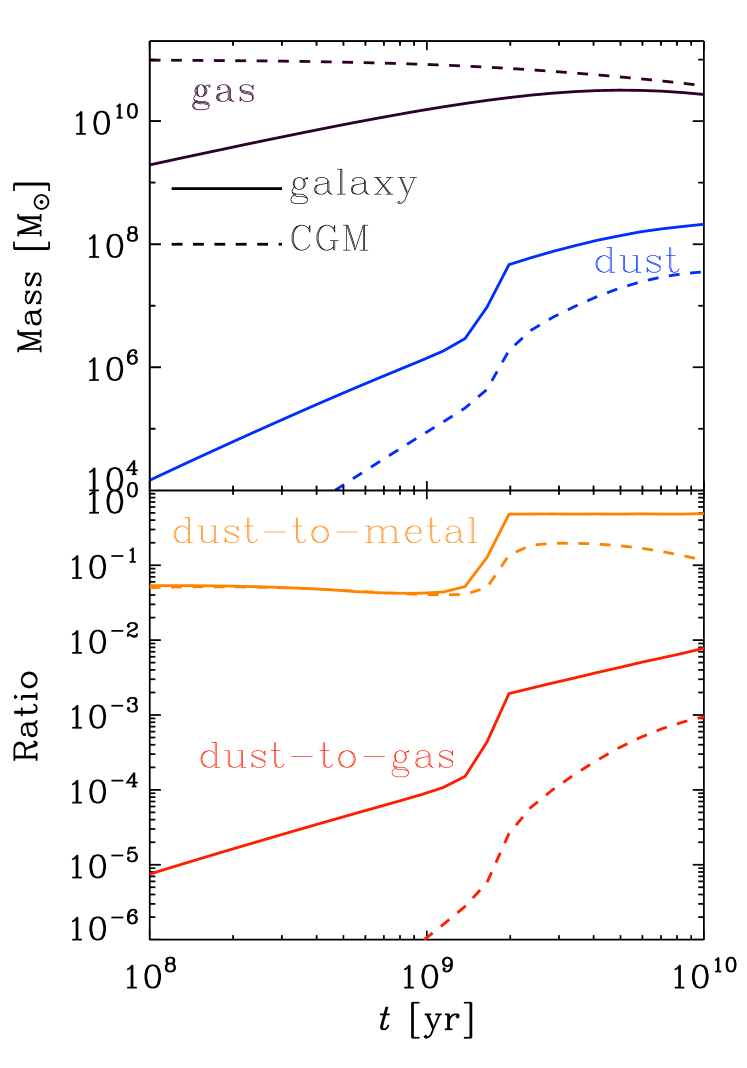
Although our main focus is laid on the grain size distribution, it is useful to confirm if our model is consistent with the evolution of the total dust mass shown in our previous paper (OH24). The dust mass can be ‘decomposed’ into the gas mass and the dust-to-gas ratio, which are also examined here. In addition, we also present the dust-to-metal ratio to show the efficiency of dust production out of metals.
In figure 1, we show the evolution of the quantities related to the total dust mass. The evolution of the gas mass directly traces the mass exchange between the CGM and the galaxy. The gas mass in the CGM decreases because of the infall into the galaxy although there is a partial return from the galaxy through the outflow. The gas mass in the galaxy grows in the early epochs, but it decreases later because the gas consumption by star formation becomes more prominent than the gas supply from the CGM. The dust masses in both the galaxy and the CGM rise, which is also consistent with the increase of the dust-to-gas ratio indicated in the lower window. The steep increases of the dust mass and the dust-to-gas ratio at Gyr are due to dust growth by accretion, as commonly seen in previous dust evolution models (e.g., Dwek (1998); Hirashita (1999)). Although this growth only occurs in the galaxy, it affects the dust abundance in the CGM indirectly through the dust transport by the outflow. The dust-to-metal ratio behaves like a step function: It is determined by the dust condensation efficiency in stellar ejecta at low metallicity, while it reaches the maximum value (0.48; subsection 2.2) because of accretion at high metallicity. At later stages, the dust-to-metal ratio in the CGM declines because of sputtering.
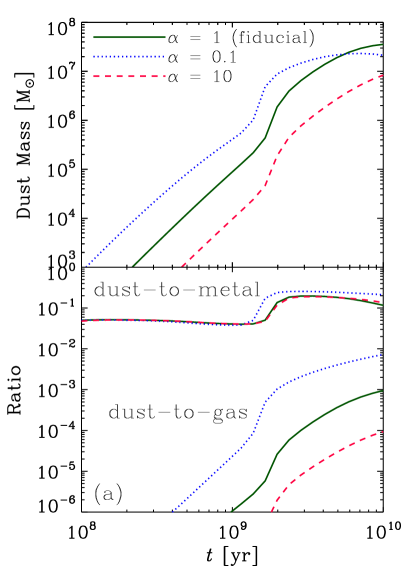
We clarify the effects of galaxy–CGM mass exchange on the evolution of dust content by varying and . We focus on dust-related quantities in the CGM. In figure 2(a), we show the evolution of dust mass, dust-to-gas ratio, and dust-to-metal ratio in the CGM for various values for . The dust mass is higher for a smaller value of in the early phase ( Gyr) because a higher star formation rate caused by a more efficient inflow leads to quicker metal enrichment in both the galaxy and the CGM. The increase of the dust mass is stopped at later epochs for the case of , which reflects the depletion of infalling gas. The dust-to-gas and dust-to-metal ratios are higher for a smaller value of because of quicker metal and dust enrichment. The smaller CGM mass in the case of smaller also makes the dust enrichment easier simply because there is less gas to enrich. However, the effect of on the dust-to-metal ratio is not as large as that on the dust-to-gas ratio, which indicates that the dust abundance is strongly correlated with the metallicity.
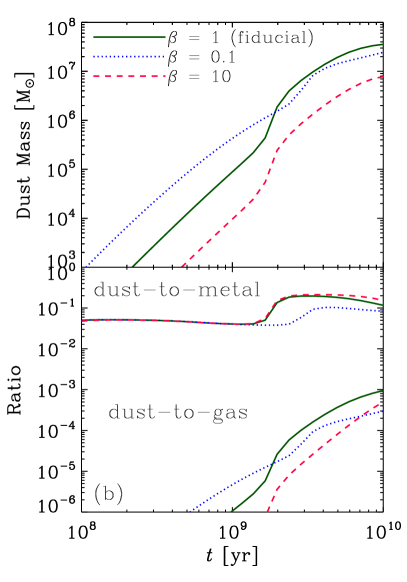
In figure 2(b), we show the effects of , which regulates the outflow. In the early epoch, the dust mass is almost inversely proportional to since dust mass supply to the CGM is governed by the outflow rate from the galaxy. At later times, the dust mass does not change monotonically with : The fiducial model achieves the largest dust mass among the three cases. If is too small, the efficient outflow keeps the gas mass in the galaxy low, leading to inefficient dust production. If is too large in contrast, the supply of dust from the galaxy is inefficient so that the dust mass tends to be low in the CGM. The evolution of the dust-to-gas ratio broadly follows that of the dust mass. The dust-to-metal ratio in the CGM is smaller for smaller , reflecting a smaller dust-to-metal ratio (i.e., less efficient dust enrichment) in the galaxy.
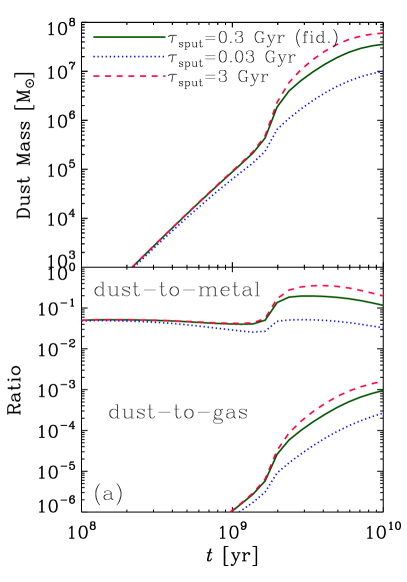
We also examine the effect of dust processing in the CGM, that is, sputtering and shattering. In figure 3(a), we show the evolution of dust-related quantities in the CGM for various in order to examine the effect of sputtering. We confirm that stronger sputtering reduces the dust mass and abundance in the CGM. The effect of sputtering appears at an earlier epoch for shorter . Thus, we confirm that the dust destruction by sputtering has a direct impact on the dust abundance in the CGM.
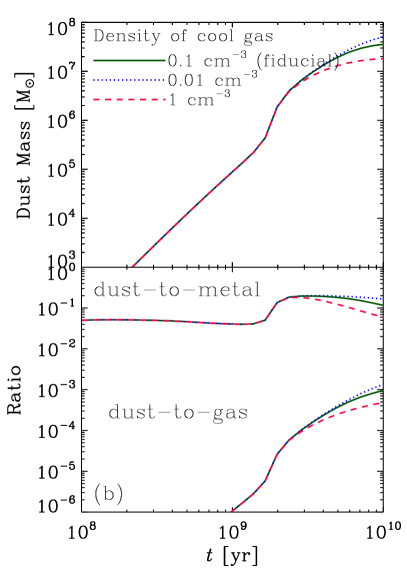
In figure 3(b), we show the effects of shattering efficiency regulated by . We observe that, if shattering is efficient with large , the dust mass and abundance are slightly diminished. Although shattering itself conserves the total dust mass, it makes the grain size distribution biased to small grains, which are easily destroyed by sputtering. Shattering, thus, has an indirect influence on the CGM dust abundance through enhanced sputtering. Since shattering becomes efficient after the CGM is enriched with a significant amount of dust, the effect of shattering appears at later epochs.
It may be useful to compare our results with OH24’s, although our models and parameterizations are not the same as theirs. In our fiducial model, the dust masses in the galaxy and in the CGM at Gyr are and M⊙, respectively; in OH24’s fiducial model, and M⊙, respectively. In our fiducial model, the stellar mass at Gyr is M⊙, while in OH24’s, it is M⊙. As mentioned in subsection 2.3, OH24 assumed a constant gas mass for the CGM, while we decrease it according to the inflow. Thus, we tend to underpredict the stellar and metal/dust masses.
OH24 adopted the CGM dust mass from Ménard et al. (2010), who showed from statistical analysis of background quasar colors that the dust mass in the CGM is on average M⊙ for a sample of galaxies whose mean redshift is . Peek et al. (2015) obtained a similar dust mass in the CGM for a lower-redshift sample. As estimated by OH24, the CGM dust mass normalized to the stellar mass is , while it is in our model. Thus, our dust enrichment model predicts an order-of-magnitude smaller dust abundance in the CGM compared with OH24, whose model explained the CGM dust abundance of the above observational sample. However, our value is rather near to the one indicated by stacking analysis of extended dust emission around galaxies at (Meinke et al., 2023). Considering the uncertainties in the observational data in terms of the dust and stellar masses, we do not further tune the fiducial model, but we concentrate on the effects of various parameters on the resulting grain size distribution. We still discuss observational aspects including the above discrepancy later in section 4.
3.2 Evolution of grain size distribution
We first discuss the case with the fiducial parameter values (table 2.3). We show the evolution of grain size distribution in the galaxy and in the CGM in figure 4.
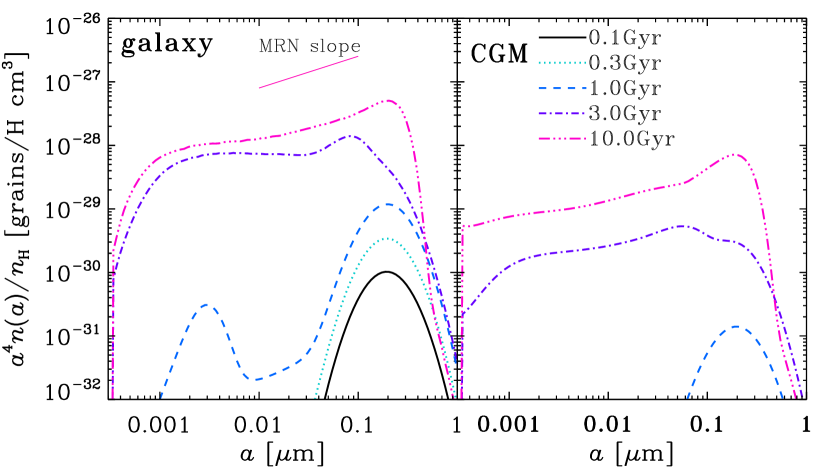
The evolution of grain size distribution (figure 4 left) in the galaxy is similar to that presented in our previous models; thus, we refer the reader to Hirashita & Aoyama (2019) and Hirashita & Murga (2020) for detailed discussions on the evolution of grain size distribution in galaxies. We briefly describe the outline here. Overall, the grain size distribution rises in almost all the grain radius range as a function of time because of the increase in the grain abundance. In the early epoch, dust production is dominated by stellar sources, which mainly supply large () grains. After that, shattering becomes efficient enough to convert large grains to small grains, whose abundance is further raised by accretion at Gyr. The effect of accretion is seen in the bump at . At , the abundance of small grains is large enough to cause efficient coagulation, which smoothes out the bump into a power-law like grain size distribution. In the end, the grain size distribution approaches a shape similar to the MRN distribution.
The grain size distribution in the CGM broadly follows that in the galaxy, which is the main source of dust in the CGM. The grain size distribution is dominated by large grains in the early epoch and is in a smooth power-law-like shape later. The level of the grain size distribution in the CGM is lower than that in the galaxy, reflecting the lower dust abundance and metallicity.
Although the slope of grain size distribution in the CGM is similar to that in the galaxy in the fiducial model, it is not generally true. A difference in the functional shape of grain size distribution between the galaxy and the CGM is caused by sputtering and shattering in the CGM. Sputtering destroys small grains more efficiently than large ones while shattering increases the small grain abundance. Thus, the balance between sputtering and shattering determines the slope of the grain size distribution in the CGM. We further investigate this balance in subsection 3.4.
3.3 Effects of inflow and outflow
The mass exchange between the galaxy and the CGM drives the evolution of dust abundance and grain size distribution in the CGM. We examine the effects of inflow and outflow by varying and .
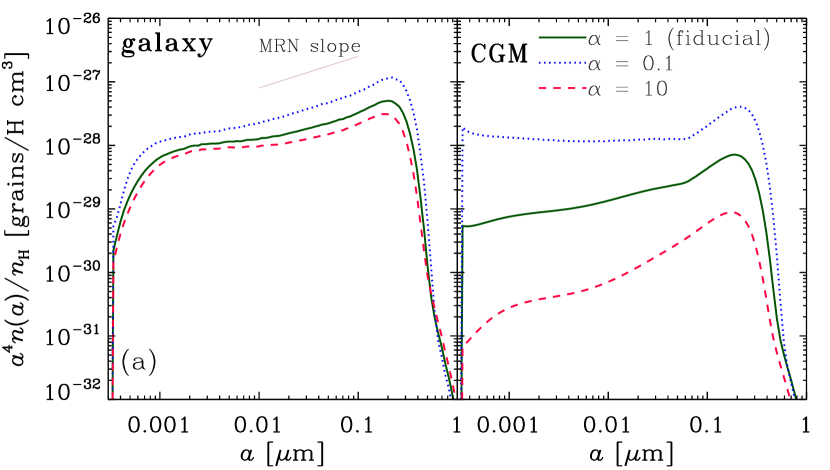
In figure 5(a), we show the results for –10 at Gyr with the other parameters fixed to the fiducial values (table 2.3). To simplify the presentation, we only compare the results at Gyr, but the following differences caused by the changed parameter ( in the case here) qualitatively apply to other ages. In the galaxy, a lower inflow rate (larger ) leads to slower metal and dust enrichment. Accordingly, the overall dust abundance in the CGM is also lower for larger (subsection 3.1). Different slopes in grain size distribution for different are clear both in the galaxy and in the CGM. In the galaxy, larger leads to slower coagulation because of lower dust abundance; thus, the abundance of large grains is slightly suppressed for larger . In contrast, the grain size distribution in the CGM shows more dominance of large grains for larger . This is explained by different shattering efficiencies: A low dust abundance in the CGM leads to less efficient dust processing by shattering because of a low grain–grain collision rate, leading to less production of small grains. This explains the more large-grain-dominated grain size distribution in the CGM for larger .
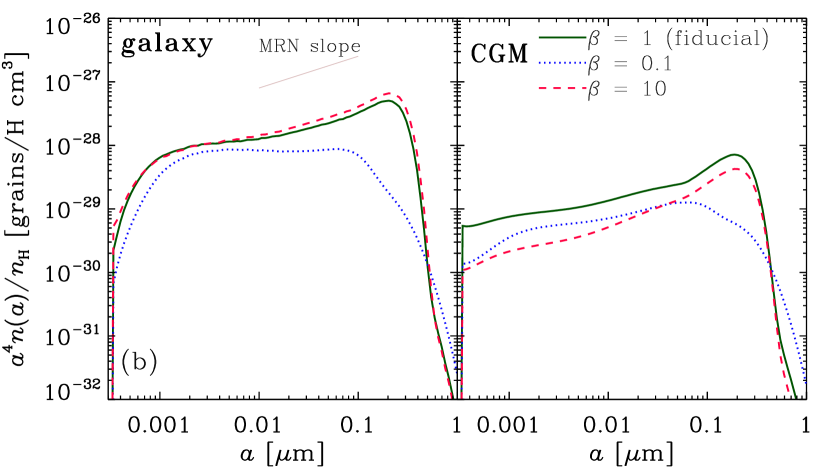
In figure 5(b), we investigate the effects of outflow by showing the results for –10 at Gyr. In the galaxy, the overall dust abundance, especially at large grain radii, is lower for both small and large . If is small, the galaxy loses gas easily so that the chemical enrichment does not proceed efficiently. The resulting metallicity is about 1/3 solar for , and as a result the dust abundance is low. Therefore, coagulation, which is the efficient formation path of large grains, is less efficient for small . Accordingly, dust in the CGM is less abundant, especially at large grain radii. In the case of large , the grain size distribution, including the overall dust abundance, in the galaxy is similar to that in the fiducial case (). This is because the gas mass is maintained in the galaxy well if is larger than 1 (i.e., the effect of outflow is moderate). The dust abundance is lower in the CGM in the case of than in the fiducial case because the dust supply from the galaxy is less efficient.
3.4 Effects of dust processing in the CGM
In the CGM, two dust processing mechanisms are considered: sputtering and shattering. As shown in table 2.3, we change and to regulate sputtering and shattering, respectively. We concentrate on the grain size distributions at Gyr as we did in the previous subsection.
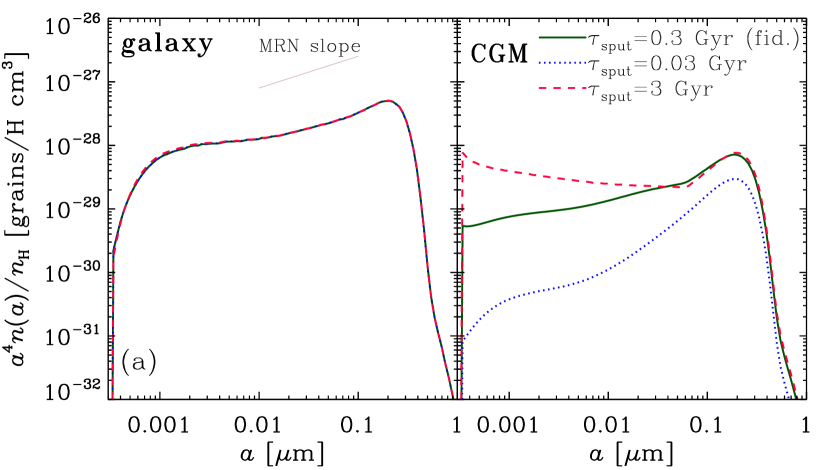
In figure 6(a), we show the grain size distributions for –3 Gyr. The grain size distribution in the galaxy is little influenced by the sputtering parameter, while that in the CGM is strongly affected. As expected, the overall grain abundance is higher for longer because less dust is destroyed. The functional shape of the grain size distribution in the CGM is also strongly affected by . In particular, in the case of inefficient sputtering ( Gyr), the tail toward small grain radii is developed because more small grains produced by shattering can survive. Thus, the efficiency of sputtering affects not only the overall grain abundance level but also the grain size distribution in the CGM.
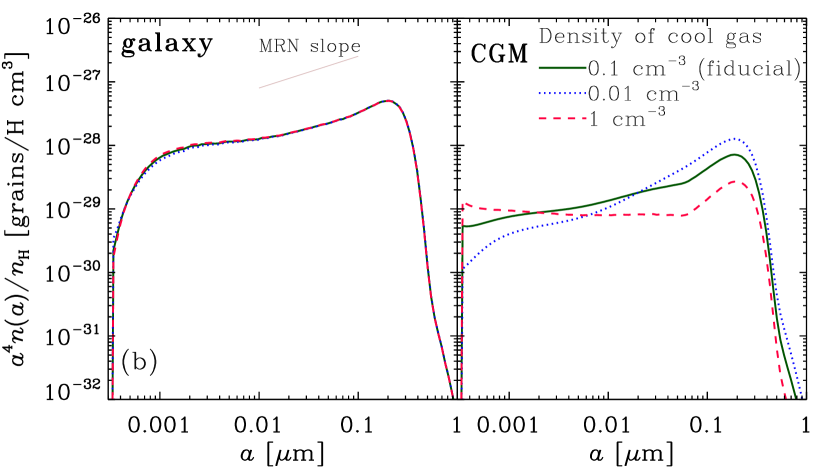
In figure 6(b), we show the effects of shattering efficiency by changing . We observe that shattering in the CGM does not affect the grain size distribution in the galaxy. In the CGM, a large value of means more efficient shattering, which leads to more fragmentation of large grains. Thus, the abundance of large grains is lower for larger . Moreover, since smaller grains are more efficiently destroyed by sputtering, more production of small grains by shattering leads to more efficient sputtering. This interplay between shattering and sputtering decreases the total dust abundance as observed in the case of cm-3 in figure 3(b).
4 Discussion
4.1 Reddening curves
For the purpose of an observational test, we use the reddening curves observed for a sample of Mg ii absorbers, which are considered to trace a gas component in the CGM (see the Introduction). We calculate the reddening curve using the method described in section 2.4 of Hirashita & Lan (2021) (see also Hirashita & Lin (2020)). Because the observed reddening curves were derived from a large galaxy sample, we assume that they reflect an averaged property of galaxies to which our models with the above ranges of the parameters are applicable. We provide a brief summary for the calculation procedure in what follows.
We define the reddening as the relative dust extinction at two wavelengths. The extinction at wavelength , is described in units of magnitude, and is estimated as
| (19) |
where is the mass extinction coefficient as a function of wavelength , and is the column density of hydrogen nuclei. We calculate the reddening curve, that is, as a function of with being the reference wavelength. The mass extinction coefficient is estimated as
| (20) |
where is the extinction efficiency, and is calculated using the Mie theory (Bohren & Huffman, 1983). The necessary grain property data are taken from astronomical silicate (Weingartner & Draine (2001) and references therein) and amorphous carbon (ACAR; Zubko et al. (1996)). We also adopt and 1.8 g cm-3 from these papers for astronomical silicate and amorphous carbon, respectively. We do not use graphite, whose 2175 Å feature is not clearly seen in the actual observational data of Mg ii absorbers (Hirashita & Lan, 2021). As shown by Hirashita & Lan (2021), while silicate explains more easily the rise of extinction toward shorter wavelengths, carbonaceous dust fits better to the overall level of extinction. Thus, following their approach, we mix silicate and amorphous carbon with a mass ratio of 0.54:0.46, which is originally based on a Milky Way model (Hirashita & Aoyama, 2019). However, the following results are not sensitive to the particular choice of the ratio as long as the fractions of silicate and carbonaceous dust are comparable.
We adopt , where is the -band wavelength (0.76 ). We use the SDSS , , , and -band data for Mg ii absorbers at and 2 in Ménard & Fukugita (2012). We also apply a range of – cm-2 for the typical column density of an Mg ii absorber (Lan & Fukugita, 2017). The typical dust-to-gas ratio of Mg ii absorbers is 60–80 per cent of the Milky Way value (Ménard & Fukugita, 2012); this high level is only achieved at Gyr in our model. Although the cosmic ages at and 2 are younger than 10 Gyr, a smaller value of would give a similarly high dust-to-gas ratio at a younger age. Because of this degeneracy between and , we use the results at Gyr to focus on the most dust-enriched case achieved in our model.
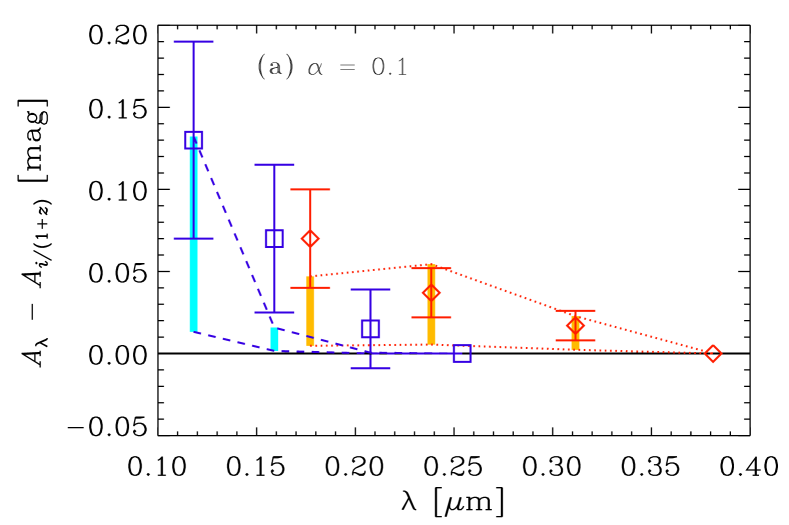
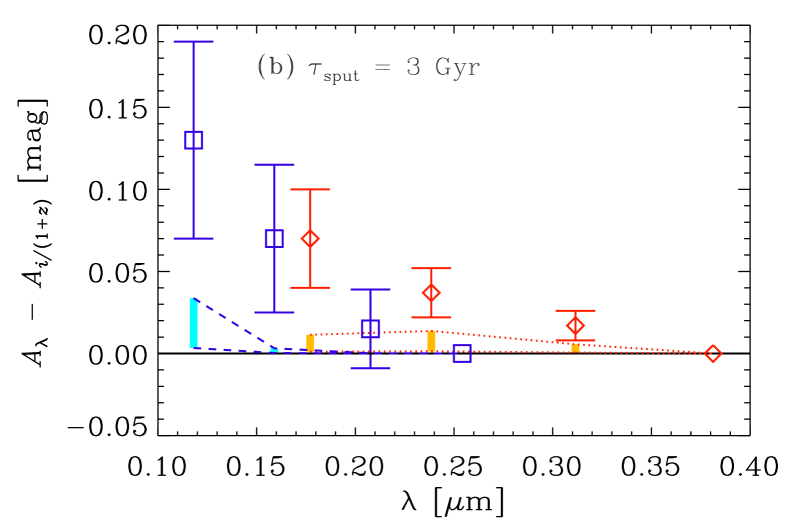
We find (not shown) that the fiducial model underpredicts the reddening by an order of magnitude. Thus, we only show the cases where the grain abundance in the CGM is enhanced; that is, small (efficient inflow) and long (inefficient sputtering) as shown in subsection 3.1. In particular, sputtering cannot be stronger than the fiducial model. Stronger sputtering also leads to more efficient destruction of small grains than large ones, so that the resulting reddening curves would be too flat. In figure 7, we show the results for (Panel a) and Gyr (Panel b) with the other parameters fixed to the fiducial values. We observe that the model with efficient inflow could explain the observed reddening while that with inefficient sputtering underpredicts it. In fact, even the fiducial model is inefficient in destroying large grains by sputtering (figure 6a), so that the effect of weakening sputtering is limited. In contrast, an efficient inflow enriches the CGM to a high dust-to-gas ratio not only because the galaxy is more efficiently metal-enriched but also because the relatively small gas mass in the CGM makes the dust enrichment easier (subsection 3.1). Therefore, a strong inflow whose time-scale is an order of magnitude shorter than the star formation and outflow time-scales is favoured in explaining the level of reddening observed for the CGM.
The above broad success in explaining the reddening curves in Mg ii absorbers means that our evolution model of grain size distribution is capable of explaining the actually observed optical properties of dust in the CGM within reasonable parameter ranges. We also emphasize that the steepness of the observed reddening curves toward shorter wavelengths is naturally explained by these models that show enhanced small grain abundances (especially, the model with as shown in figure 5a).
4.2 Possibilities of further improvement
Our model treats each of the galaxy and the CGM as a one-zone object, neglecting spatial variations in each zone. We further assume a fixed ratio for the dense and diffuse phases and neglect possible time variations for the time-scales or efficiencies of inflow, outflow, and dust processing. Although this simplification serves to clarify the physical role of each process involved, time variations caused by hydrodynamical evolution of the ISM and CGM may be important for the efficiencies of various dust evolution processes.
Hydrodynamic simulations provide a useful platform where we treat dust evolution in a manner consistent with the hydrodynamic evolution of galaxies (e.g., Bekki (2013); McKinnon et al. (2016); Aoyama et al. (2017)). In particular, Hou et al. (2017) implemented a two-size grain model in their isolated-galaxy simulations, and showed that the grains in the CGM (out of the galactic disk) is biased to larger sizes. Since they did not include sputtering in the CGM, the dominance of large grains in the CGM should be due to an effect other than sputtering. They interpreted this result as due to stellar feedback, which tends to eject large grains produced by stars before they are affected by interstellar processing. This effect cannot be included in our model, since we assume that the dust produced by stars is instantaneously mixed with the preexisting dust in the galaxy. Aoyama et al. (2018) included sputtering in their cosmological hydrodynamic simulation, and showed that the dust-to-metal ratio declines toward large galactocentric radii in the CGM. They argued that their radial profile of dust surface density is consistent with those derived from reddening observations by Ménard et al. (2010) and Peek et al. (2015). In fact, because of the uncertainty in the observational data, it is difficult to constrain the sputtering process from the observations. Zu et al. (2011), assuming a constant dust-to-metal ratio in a cosmological simulation, also reproduced the radial profile of dust surface density. The dust-to-metal ratio in the CGM they adopted is , which is larger than our fiducial case, but is well reproduced by the model with , and/or with Gyr (figures 2 and 3). These models (especially the one with ) are favored by the observed reddening curves (subsection 4.1).
Shattering in the CGM is still challenging to include in hydrodynamic simulations because of limited spatial resolutions. Since shattering occurs in cool clumps whose typical size is pc (Lan & Fukugita, 2017), spatial resolution is usually not enough in galaxy-scale hydrodynamic simulations. The model in this paper could be used for a subgrid model to be implemented in such simulations.
Hydrodynamic simulations could also be used to determine the free parameters (table 2.3) adopted in this paper. In reality, they could have dependence on the galaxy mass. Also, the galaxy mass assembly history is important to include. Cosmological hydrodynamic simulations would provide a suitable platform on which we investigate these issues.
5 Conclusions
We investigate the evolution of grain size distribution in the CGM by constructing a model that describes the chemical enrichment in the galaxy and the CGM. We include the mass exchange between the galaxy and the CGM by galactic inflows and outflows. We also utilize the evolution model of grain size distribution developed in our previous papers and extend it to describe the CGM dust. For dust evolution processes, we include stellar dust production, SN destruction, shattering, accretion, and coagulation for the galaxy, while we consider sputtering and shattering in the CGM.
We first present the evolution of the dust abundance in the CGM, and find broadly consistent results with OH24 for the dependences on the processes (inflow, outflow, and sputtering) that were also included in their dust mass evolution model. We tend to underestimate the dust abundance in the CGM compared with OH24, which is attributed to different assumptions on the mass evolution in the CGM. We newly find that shattering in the CGM has an appreciable influence on the dust abundance because small grains produced by shattering are easily destroyed by sputtering.
After these predictions, we show our main results, that is, the evolution of grain size distribution. We confirm that the evolution of grain size distribution in the galaxy is similar to our previous models that treated the galaxy as a closed box. Therefore, the inclusion of the CGM does not significantly affect the dust evolution in the galaxy. The functional shape of the grain size distribution in the CGM to some extent follows that in the galaxy, indicating that the grain properties in the CGM are strongly affected by interstellar dust processing. We also find, however, that the slope of the grain size distribution in the CGM is sensitive to dust processing in the CGM, that is, sputtering and shattering. If sputtering is dominant over shattering as is realized in the cases for inefficient dust enrichment with large , for efficient sputtering with short , or for inefficient shattering with small , the grain size distribution in the CGM is more biased to large grains compared with that in the galaxy. In contrast, if shattering is dominant over sputtering as in the opposite case for , or , the grain size distribution is more biased to small sizes compared with that in the galaxy.
To further predict observable features of the CGM dust, we examine the reddening curve. We find that our fiducial model underpredicts the reddening observed for a large sample of background quasars by an order of magnitude. This underprediction is effectively resolved by efficient inflow mainly because of higher dust abundance achieved. The steepness of the reddening curve is also consistent with the case of efficient inflow since the small-grain abundance is enhanced.
Our results in this paper gives a basis on which the evolution of grain size distribution in more sophisticated calculations such as hydrodynamic simulations is interpreted, or on which subgrid models in hydrodynamic simulations are developed. The grain size distributions in the CGM calculated in this paper are also essential in predicting the dust extinction in the CGM, which could cause a systematic bias for the colors of background objects. Our model is also general enough to be applied to various populations of galaxies in the nearby Universe as well as at high redshift. Future studies focused on a particular type of galaxies using our model would be useful if we choose an appropriate set of the relevant parameters governing the dust enrichment in the CGM.
We are grateful to the referee, Shohei Aoyama, for his useful comments that improved the discussions and presentations in this paper. We thank the National Science and Technology Council for support through grant 111-2112-M-001-038-MY3, and the Academia Sinica for Investigator Award AS-IA-109-M02.
References
- Alton et al. (1998) Alton, P. B., Bianchi, S., Rand, R. J., et al. 1998, ApJ, 507, L125
- Aoyama et al. (2018) Aoyama, S., Hou, K.-C., Hirashita, H., Nagamine, K., & Shimizu, I. 2018, MNRAS, 478, 4905
- Aoyama et al. (2017) Aoyama, S., Hou, K.-C., Shimizu, I., et al. 2017, MNRAS, 466, 105
- Armillotta et al. (2017) Armillotta, L., Fraternali, F., Werk, J. K., Prochaska, J. X., & Marinacci, F. 2017, MNRAS, 470, 114
- Asano et al. (2013) Asano, R. S., Takeuchi, T. T., Hirashita, H., & Nozawa, T. 2013, MNRAS, 432, 637
- Avgoustidis et al. (2009) Avgoustidis, A., Verde, L., & Jimenez, R. 2009, J. Cosmology Astropart. Phys., 6, 012
- Bekki (2013) Bekki, K. 2013, MNRAS, 432, 2298
- Ben Bekhti et al. (2009) Ben Bekhti, N., Richter, P., Winkel, B., Kenn, F., & Westmeier, T. 2009, A&A, 503, 483
- Bianchi & Ferrara (2005) Bianchi, S. & Ferrara, A. 2005, MNRAS, 358, 379
- Blum (2000) Blum, J. 2000, Space Sci. Rev., 92, 265
- Bohren & Huffman (1983) Bohren, C. F. & Huffman, D. R. 1983, Absorption and Scattering of Light by Small Particles (New York: Wiley)
- Burgarella et al. (2020) Burgarella, D., Nanni, A., Hirashita, H., et al. 2020, A&A, 637, A32
- Chen et al. (2023) Chen, H.-W., Qu, Z., Rauch, M., et al. 2023, ApJ, 955, L25
- Davies et al. (1998) Davies, J. I., Alton, P., Bianchi, S., & Trewhella, M. 1998, MNRAS, 300, 1006
- Dominik & Tielens (1997) Dominik, C. & Tielens, A. G. G. M. 1997, ApJ, 480, 647
- Draine (2003) Draine, B. T. 2003, ARA&A, 41, 241
- Draine & Salpeter (1979) Draine, B. T. & Salpeter, E. E. 1979, ApJ, 231, 77
- Dwek (1987) Dwek, E. 1987, ApJ, 322, 812
- Dwek (1998) Dwek, E. 1998, ApJ, 501, 643
- Ferrara et al. (1991) Ferrara, A., Ferrini, F., Barsella, B., & Franco, J. 1991, ApJ, 381, 137
- Fukugita (2011) Fukugita, M. 2011, preprint, arXiv:1103.4191
- Hirashita (1999) Hirashita, H. 1999, ApJ, 510, L99
- Hirashita (2023) Hirashita, H. 2023, MNRAS, 518, 3827
- Hirashita & Aoyama (2019) Hirashita, H. & Aoyama, S. 2019, MNRAS, 482, 2555
- Hirashita & Inoue (2019) Hirashita, H. & Inoue, A. K. 2019, MNRAS, 487, 961
- Hirashita & Lan (2021) Hirashita, H. & Lan, T.-W. 2021, MNRAS, 505, 1794
- Hirashita & Lin (2020) Hirashita, H. & Lin, C.-Y. 2020, Planet. Space Sci., 183, 104504
- Hirashita & Murga (2020) Hirashita, H. & Murga, M. S. 2020, MNRAS, 492, 3779
- Hirashita et al. (2015) Hirashita, H., Nozawa, T., Villaume, A., & Srinivasan, S. 2015, MNRAS, 454, 1620
- Hirashita & Voshchinnikov (2014) Hirashita, H. & Voshchinnikov, N. V. 2014, MNRAS, 437, 1636
- Hou et al. (2017) Hou, K.-C., Hirashita, H., Nagamine, K., Aoyama, S., & Shimizu, I. 2017, MNRAS, 469, 870
- Howk & Savage (1997) Howk, J. C. & Savage, B. D. 1997, AJ, 114, 2463
- Hu et al. (2023) Hu, C.-Y., Sternberg, A., & van Dishoeck, E. F. 2023, ApJ, 952, 140
- Inoue (2003) Inoue, A. K. 2003, PASJ, 55, 901
- Inoue (2011) Inoue, A. K. 2011, Earth, Planets, and Space, 63, 1027
- Inoue & Kamaya (2004) Inoue, A. K. & Kamaya, H. 2004, MNRAS, 350, 729
- Jones et al. (1996) Jones, A. P., Tielens, A. G. G. M., & Hollenbach, D. J. 1996, ApJ, 469, 740
- Kobayashi & Tanaka (2010) Kobayashi, H. & Tanaka, H. 2010, Icarus, 206, 735
- Lan (2020) Lan, T.-W. 2020, ApJ, 897, 97
- Lan & Fukugita (2017) Lan, T.-W. & Fukugita, M. 2017, ApJ, 850, 156
- Lan & Mo (2019) Lan, T.-W. & Mo, H. 2019, MNRAS, 486, 608
- Li et al. (2020) Li, Z., Hopkins, P. F., Squire, J., & Hummels, C. 2020, MNRAS, 492, 1841
- Lisenfeld & Ferrara (1998) Lisenfeld, U. & Ferrara, A. 1998, ApJ, 496, 145
- Masaki & Yoshida (2012) Masaki, S. & Yoshida, N. 2012, MNRAS, 423, L117
- Mathews & Brighenti (2003) Mathews, W. G. & Brighenti, F. 2003, ApJ, 590, L5
- Mathis et al. (1977) Mathis, J. S., Rumpl, W., & Nordsieck, K. H. 1977, ApJ, 217, 425
- McKinnon et al. (2016) McKinnon, R., Torrey, P., & Vogelsberger, M. 2016, MNRAS, 457, 3775
- Meinke et al. (2023) Meinke, J., Cohen, S., Moore, J., et al. 2023, ApJ, 954, 119
- Ménard & Fukugita (2012) Ménard, B. & Fukugita, M. 2012, ApJ, 754, 116
- Ménard et al. (2010) Ménard, B., Scranton, R., Fukugita, M., & Richards, G. 2010, MNRAS, 405, 1025
- Mörtsell & Goobar (2003) Mörtsell, E. & Goobar, A. 2003, J. Cosmology Astropart. Phys., 9, 009
- Nanni et al. (2020) Nanni, A., Burgarella, D., Theulé, P., Côté, B., & Hirashita, H. 2020, A&A, 641, A168
- Otsuki & Hirashita (2024) Otsuki, M. & Hirashita, H. 2024, MNRAS, 528, 5008
- Parente et al. (2023) Parente, M., Ragone-Figueroa, C., Granato, G. L., & Lapi, A. 2023, MNRAS, 521, 6105
- Peek et al. (2015) Peek, J. E. G., Ménard, B., & Corrales, L. 2015, ApJ, 813, 7
- Prochaska & Hennawi (2009) Prochaska, J. X. & Hennawi, J. F. 2009, ApJ, 690, 1558
- Qu et al. (2022) Qu, Z., Chen, H.-W., Rudie, G. C., et al. 2022, MNRAS, 516, 4882
- Ramesh et al. (2023) Ramesh, R., Nelson, D., & Pillepich, A. 2023, MNRAS, 518, 5754
- Rauch et al. (1999) Rauch, M., Sargent, W. L. W., & Barlow, T. A. 1999, ApJ, 515, 500
- Richie et al. (2024) Richie, H. M., Schneider, E. E., Abruzzo, M. W., & Torrey, P. 2024, arXiv e-prints, arXiv:2403.03711
- Sparre et al. (2020) Sparre, M., Pfrommer, C., & Ehlert, K. 2020, MNRAS, 499, 4261
- Steidel et al. (1994) Steidel, C. C., Dickinson, M., & Persson, S. E. 1994, ApJ, 437, L75
- Triani et al. (2020) Triani, D. P., Sinha, M., Croton, D. J., Pacifici, C., & Dwek, E. 2020, MNRAS, 493, 2490
- Tsai & Mathews (1995) Tsai, J. C. & Mathews, W. G. 1995, ApJ, 448, 84
- Valiante et al. (2011) Valiante, R., Schneider, R., Salvadori, S., & Bianchi, S. 2011, MNRAS, 416, 1916
- Veilleux et al. (2005) Veilleux, S., Cecil, G., & Bland-Hawthorn, J. 2005, ARA&A, 43, 769
- Wada et al. (2013) Wada, K., Tanaka, H., Okuzumi, S., et al. 2013, A&A, 559, A62
- Weingartner & Draine (2001) Weingartner, J. C. & Draine, B. T. 2001, ApJ, 548, 296
- Yajima et al. (2017) Yajima, H., Nagamine, K., Zhu, Q., Khochfar, S., & Dalla Vecchia, C. 2017, ApJ, 846, 30
- York et al. (2000) York, D. G., Adelman, J., Anderson, Jr., J. E., et al. 2000, AJ, 120, 1579
- York et al. (2006) York, D. G., Khare, P., Vanden Berk, D., et al. 2006, MNRAS, 367, 945
- Zu et al. (2011) Zu, Y., Weinberg, D. H., Davé, R., et al. 2011, MNRAS, 412, 1059
- Zubko et al. (1996) Zubko, V. G., Mennella, V., Colangeli, L., & Bussoletti, E. 1996, MNRAS, 282, 1321