# \setstackgapL12pt
Estimating Heterogeneous Treatment Effects with Item-Level Outcome Data: Insights from Item Response Theory
Analyses of heterogeneous treatment effects (HTE) are common in applied causal inference research. However, when outcomes are latent variables assessed via psychometric instruments such as educational tests, standard methods ignore the potential HTE that may exist among the individual items of the outcome measure. Failing to account for “item-level” HTE (IL-HTE) can lead to both estimated standard errors that are too small and identification challenges in the estimation of treatment-by-covariate interaction effects. We demonstrate how Item Response Theory (IRT) models that estimate a treatment effect for each assessment item can both address these challenges and provide new insights into HTE generally. This study articulates the theoretical rationale for the IL-HTE model and demonstrates its practical value using data from 20 randomized controlled trials containing 2.3 million item responses in economics, education, and health research. Our results show that the IL-HTE model reveals item-level variation masked by average treatment effects, provides more accurate statistical inference, allows for estimates of the generalizability of causal effects, resolves identification problems in the estimation of interaction effects, and provides estimates of standardized treatment effect sizes corrected for attenuation due to measurement error.
Keywords: causal inference, heterogeneous treatment effects, item response theory, psychometrics, generalizability
JEL Codes: C01, C1, C18, C31, C38
Corresponding author: joshua_gilbert@g.harvard.edu
1 Introduction
Analytic methods to assess heterogeneous treatment effects (HTE) play a critical role in program and policy evaluation. They reveal for whom and under what conditions an intervention works [270, 225, 298, 288, 220]. One common approach to HTE analyses is to interact treatment indicators with pretreatment covariates to estimate whether treatment efficacy differs by person or site characteristics. However, when the outcome is a latent variable [167] assessed using a psychometric instrument such as an educational test, psychological survey, or patient self-report of disease symptoms (e.g., [234, 223, 216, 224, 165, 181]), the traditional treatment-by-covariate interaction approach ignores an alternative heterogeneity: variation among the individual items of the outcome measure in their sensitivity to treatment. In this study, we demonstrate that ignoring this potential “item-level” HTE (IL-HTE) can create both causal identification challenges and inflated estimates of statistical precision. In addition, modeling IL-HTE can provide new insights into causal analyses in general. By ignoring IL-HTE, researchers conducting causal analyses of outcome data derived from psychometric instruments can reach incomplete or incorrect conclusions about the efficacy and policy implications of specific interventions.
To address these challenges, emerging scholarship in education, psychometrics, and epidemiology has proposed item response theory (IRT, [213]) modeling approaches that allow for unique treatment effects on each assessment item [267, 151, 206, 205]. Models for IL-HTE can offer new insights into the inference, identification, and generalizability of causal effects for both methodologists and applied researchers, although they have not yet been widely applied in policy analysis or program evaluation contexts. The purpose of this study is to articulate the rationale for the IL-HTE approach and demonstrate its wide applicability, illustrated through 20 item-level data sets containing 2.3 million item responses from randomized controlled trials (RCTs) in education, economics, and health research. Using these data, we explore five insights that the IL-HTE model provides for HTE analyses and illustrate the implications of each insight both theoretically and empirically.
We briefly summarize five insights the IL-HTE model provides for the applied researcher analyzing randomized evaluations with psychometric outcome measures. First, the IL-HTE model provides an interpretable measure of variation in item-specific or subscale effects potentially masked by the average treatment effect (ATE), a detail that would be lost in a conventional analysis of a single-number score outcome. Second, the IL-HTE model provides more realistic standard errors for the ATE because it accounts for the variation that arises from the selection of the items for the outcome measure, thus providing inference for the items that could have been included in the outcome measure, not just those that were included in the outcome measure. Third, the IL-HTE model allows for out-of-sample generalizations of treatment effects on untested items through prediction intervals covering a range of treatment effects on items drawn from a similar population of items that could have been included in the outcome measure. Fourth, the IL-HTE model solves critical identification problems in the estimation of treatment-by-covariate interaction effects by allowing for correlations between item location (i.e., item difficulty) and item-specific treatment effect size. Finally, the IL-HTE model (and all latent variable models) provide estimates of standardized effect sizes that are corrected for attenuation due to measurement error. Our approach therefore complements recent calls in the economics literature for greater consideration of measurement issues in empirical analyses [153].
The remainder of the study is organized as follows. We begin with a conceptual discussion of the potential causes of IL-HTE in Section 1.1 and review a potential outcomes framework for observed and latent variables in Section 1.2. Section 1.3 reviews the traditional treatment-by-covariate interaction effect approach to HTE analysis and introduces the IL-HTE model as an extension. Section 2 presents our data source and methods. We present our findings in Section 3. Section 4 concludes.
1.1 Potential Causes of Item-Level Heterogeneous Treatment Effects
We begin with a discussion of several potential causal mechanisms that might lead to IL-HTE. First, IL-HTE can arise when a test or other measure is not aligned appropriately with the intervention that is the object of study [199, 180]. For example, if a math intervention is focused on fractions, but the test covers all fifth-grade math content, only test items related to fractions may show a treatment effect as a result of this under-alignment. This scenario relates to the “instructional sensitivity” of the items on a measure [260, 253]. From a psychometric perspective, this issue could be conceptualized as having a subscale or testlet model as the true data-generating measurement model [262], where true treatment effects impact only certain subsections of a test, but the researcher estimates treatment effects using only the overall score. Evidence of this intervention-assessment alignment issue is abundant in studies showing that treatment effect estimates are much larger, on average, when the researcher conducting the study uses a measure designed for that intervention rather than a standardized instrument [292, 227].
Second, if an intervention takes place over the course of several months or years, the developmental appropriateness of the items may shift over time. For example, some test items from earlier grades (i.e., those that cover content relatively less covered in later grades) might paradoxically become more difficult as students move on to other material. Or, in the case of survey items, developmental changes might affect how strong an indicator of the latent construct an item is. For example, a survey item asking if the respondent “cries easily” is unlikely to be an equally meaningful indicator of depression when the respondent is 10 years old compared to 70 [184], and there is evidence that this item is not equally indicative of depression for boys versus girls [280]. From a technical perspective, measurement invariance failures that have nothing to do with the intervention can nonetheless introduce bias into RCTs [274].
Third, in education, IL-HTE could be the product of teaching to the test or “score inflation” [234, 233, 162, 222], whereby test scores can increase without a corresponding increase in latent ability. For example, an intervention focused on test-taking strategies such as process of elimination could have the effect of making multiple choice items easier in the treatment group while open response questions would be unaffected by treatment.
Other potential causes of IL-HTE could arise if the outcome of interest is measured with a psychological or social-emotional survey instrument. Specifically, research documents that response shifts can occur in intervention studies when observed changes in respondents’ scores reflect something other than true changes in the attribute of interest, such as when an intervention changes the way treated respondents interpret the items [254, 255]. For example, some medical studies on quality of life show that patients with serious health conditions can score better than healthy people, or that patients score better after deterioration of health [211]. Such results indicate that patients may adopt other frames of reference than healthy people, or adopt new perspectives when their health changes. A related explanation is that the intervention makes the treated better able to identify the responses the researcher wants to hear. Although less studied, differential response style bias, such as socially desirable responding for the treatment group post-intervention [168, 269, 287] or Hawthorne effects [240, 285, 239] could also lead to IL-HTE.
Note that in some cases, these explanations treat sources of heterogeneity as a nuisance resulting from failures of measurement invariance. However, other explanations such as instructional sensitivity allow us to better understand treatment effects by acknowledging that not all items respond equally to the treatment. Under any of the conditions discussed in this section, IL-HTE cannot be identified or understood without first modeling treatment heterogeneity in the item responses.
1.2 Potential Outcomes with Observed and Latent Variables
Consider some outcome for person . Using the potential outcomes framework [266, 221], we define the individual causal effect of binary treatment on person as , where 1 indicates the treatment counterfactual and 0 indicates the control counterfactual. Because only one counterfactual is observed, is in principle unobservable. Therefore, we define the sample average treatment effect (ATE) as , which is identifiable from the observed data. We can estimate the sample ATE by calculating the difference in means (denoted ) between the treated and control groups when treatment is randomly assigned, because random assignment ensures that the observed treatment status is independent of the potential outcomes. This independence implies that the conditional expectation of given is equal to the marginal expectation of :
| (1) | ||||
| (2) | ||||
| (3) |
In practical terms, we can recover the ATE by estimating the following linear regression model, where is an indicator variable for the treatment status of person , is the mean of the control group, is the difference in means between the groups, and is the error term [250, 221, 154, 265]:
| (4) |
When is observed, the difference in means approach provided by Equation 4 is standard. However, may be an unobserved or latent variable, which requires the use of a proxy observed variable in its place [167, 232]. Examples of latent variables and their proxies include an observed student math test score as a proxy for unobserved mathematical ability, or a sum score on a depression scale as a proxy for unobserved patient depression, each constructed from a set of items. Typical approaches to constructing include the Classical Test Theory sum score (, where is the item response and is the number of items in the measure) [243] or Item Response Theory (IRT) approaches that use more complex weighting schemes to calculate the observed score [213].
Thus, in many empirical applications, we estimate the causal effect on the proxy outcome :
| (5) |
In the case of classical measurement error in , the error gets absorbed into the residual term . As such, from Equation 5 still provides an unbiased estimator for the ATE, although the model for the proxy outcome is less efficient than a model of the true outcome due to the increased residual variance. For this reason, measurement error is not typically considered a challenge to causal identification. Consequently, attention to measurement issues in causal inference has received relatively less attention than other threats to internal validity, such as nonrandom attrition or covariate imbalance (e.g., [180]), although an emerging body of work has been to explore the implications of measurement issues for causal inference more generally [246, 271, 204, 277, 160].
Importantly, measurement error in the outcome is relevant for causal inference because it causes attenuation bias when the outcome variable is standardized, a common practice given that test scores and psychological surveys have no natural scale. This attenuation bias occurs because the residual standard deviation is inflated due to measurement error. Therefore, when calculating a standardized effect size such as Cohen’s using the standard formula , the resulting effect size from the proxy outcome model is driven downward relative to the effect size derived from a model of the true outcome. Attenuation bias can be addressed with both classical corrections and latent variable modeling approaches [204, Section 1.1], an issue that we return to in Section 3.5.111In simple linear regression with two (unstandardized) variables, measurement error in the predictor serves to attenuate the slope towards 0, whereas measurement error in the outcome does not create bias but reduces precision and power as the measurement error is absorbed into the residual term, though these simple rules of thumb do not always hold in more complex circumstances [204, 231, 271, 191, 182].
In contrast to a two-step approach in which we first construct some proxy and use the proxy as the outcome in a regression model, consider an alternative analytic approach that estimates the ATE directly from the responses to individual items of the outcome measure without the need to compute a summary score to be used as a proxy outcome in a separate step. For example, if the items are dichotomous, such as correct or incorrect answers on an educational test, we can use the following model to estimate the ATE directly on the latent trait :
| (6) | ||||
| (7) | ||||
| (8) | ||||
| (9) | ||||
| (10) |
Here, the log-odds that response to item by person equals 1 is a function of latent person trait and item location . is in turn a function of the control group mean and the treatment effect , analogous to Equation 4. The equation for can be expanded to include additional predictors, such as covariates or treatment-by-covariate interactions. In educational testing contexts, item location is typically interpreted as item easiness, in that items with higher values of are easier to answer correctly.
Equation 6 is an explanatory IRT model, an approach with origins in the psychometric literature [290, 291]. While IRT and associated models have a rich tradition in psychometrics, education, and psychology [259], applications in these disciplines have been mostly descriptive [202]. However, an emerging literature has begun to apply IRT models to causal inference applications in education, economics, and clinical trials, demonstrating the advantages of the IRT approach to causal analyses [151, 267, 202, 206, 208, 207, 205].222Though we rely on an IRT formulation, Equation 6 is similar to a structural equation model (SEM) that simultaneously accounts for both measurement and structural components in a single estimation procedure [231]. Continuous analogs to the IRT formulation explored here include the traditional factor analytic model and linear SEM [152, 164, 252, 273, 241, 231]. Note that treatment impacts can also be taken into account in a latent variable through a multigroup IRT model. That is, one can fit a model that constrains item parameters to be equal across control and treatment groups but allows control and treatment groups to have unique means and variances for the latent trait (by contrast, simply regressing the latent variable on a treatment indicator only shifts the latent mean). In addition to helping produce unbiased treatment effect estimates under certain conditions [277], such models can be adapted to match more complex, quasi-experimental scenarios such as difference-in-difference designs [275].
However, whether we use a single number score as a proxy for a latent outcome of interest in a two-step procedure, or a latent variable model such as Equation 6 that models treatment effects on the item responses directly in a single step, the approaches described so far ignore the HTE that may exist among participants or among items of the assessment. In other words, all models considered above assume that treatment effects are constant across people and the items of the measure. We can relax this assumption by allowing treatment effects to vary using models that allow for HTE.
1.3 Modeling Heterogeneous Treatment Effects (HTE)
1.3.1 Person-Level HTE
We can extend Equation 6 to allow for HTE by some person-level covariate as follows:
| (11) |
In this model, is the conditional ATE (CATE) when and is the HTE parameter. When , the treatment effect is constant across the range of ; when , the CATE depends on the value of . could include, for example, variables such as age, gender, baseline ability, or other person characteristics. Treatment-by-covariate interaction models serve as the workhorse of HTE analysis in many disciplines [284, 196, 195, 238, 157, 270, 200, 201], though they are but one approach among many to estimate HTE. Alternatives include quantile regression, mediation, instrumental variables, subgroup analysis, generalizability analysis, and post stratification [270, 286], as well as machine learning approaches [236, 210, 289, 158, 179, 156, 169]. In this study, we maintain focus on interaction effects because they are the most commonly applied and most widely understood approach to HTE analysis. Furthermore, no matter how flexibly we estimate the CATE as a function of person or site covariates, all such methods ignore the possibility of IL-HTE.
1.3.2 Item-Level HTE
As an alternative to the person-centered approach, we can similarly allow for item-level HTE by allowing a unique treatment effect on each item. Specifically, we extend Equation 6 to include an interaction between treatment and item through the term (where the added subscript allows for separate parameters for each group):
| (12) | ||||
| (13) | ||||
| (14) | ||||
| (15) | ||||
| (16) |
Here, represents the residual treatment effect on item —i.e., an effect that is above and beyond that of the ATE . That is, if , item shows a larger treatment effect than the average item in the outcome measure and the total treatment effect on item is equal to . Variation in item-specific treatment effects is parameterized by , which reflects the standard deviation (SD) of item-specific treatment effects around the average . The are equivalent to uniform differential item functioning (DIF) effects caused by the treatment, in that they reflect additional treatment effects on item after the ATE on has been accounted for [206, 248]. As discussed in Section 1.1, while differential item functioning, and by implication IL-HTE, is traditionally viewed as a nuisance or as evidence of potential measurement invariance (or both) [254, 271], we argue that the IL-HTE model can be informative because the unique content of some items may be truly more sensitive to a given treatment and thus revealing of a fine-grained profile of treatment efficacy, rather than indicative of a defective measure [207, 282, 206].
The correlation represents the association between item location and item-specific treatment effect . Thus, suggests that easier items were more responsive to treatment compared to more difficult items, and vice versa for . While may be of interest in itself [206], it is perhaps most relevant in that it can cause identification problems in the estimation of treatment-by-covariate interaction effects when omitted from the model [208], an issue that we return to in Section 3.4.
While IRT analyses conventionally treat items as fixed, our approach to IL-HTE analysis uses random effects for items [217, 185]. Econometric analyses of clustered data often prefer fixed to random effects specifications due to concerns about the assumption that the random effects are uncorrelated with the predictors in the model, though when this assumption is met, random effects models are more efficient than their fixed effects counterparts [261, 163, 296, 155]. The random effects assumption is not relevant in our proposed modeling approach because in most causal inference applications, our covariates of interest are at the item or person level. Confounding due to violations of the random effects assumption only affects variables that vary across each person-item combination, for example, response time [244].333In our application, is constant within person ; would suggest that a person received treatment on some items but not others. While such a treatment is conceivable, such as a computerized test that offers additional prompts on some subset of the items, it is unlikely to be the norm in most applied settings. Furthermore, the random effects assumption can be relaxed through a Mundlak specification that includes cluster means as covariates [249, 155, 261, 183, 296, 297], and extensions of the Mundlak approach apply to the models discussed here with only minor adjustments [212, 161].
The random effects approach also provides several benefits for our intended application. While in principle we could fit similar models with item fixed effects by interacting each item indicator with the treatment indicator , we argue that the random effects approach is more appropriate in general for addressing IL-HTE. [206, pp. 894-895] provide five arguments for the use of item random effects, summarized here. First, with item fixed effects, variables representing item characteristics (e.g., subscale, modality, content area) cannot be included in the model as they are collinear with item indicators. Second, each fixed item intercept and item-by-treatment interaction adds a parameter to the model, whereas the random effects approach only requires two parameters, the SD and the correlation . Thus, the random effects specification is more parsimonious and preserves degrees of freedom when the assumptions underlying the random effects model are met, leading to greater statistical efficiency. Third, the random effects approach provides a direct estimate of the variability of IL-HTE in the data in , a value that would be biased upward by measurement error if estimated in a fixed effects approach. Fourth, as a shrinkage estimator, empirical Bayes estimates of item random effects minimize total error and are more stable than their fixed effects counterparts, unless sample sizes are very large, and the empirical Bayes estimation effectively controls for inflated false positive rates due to multiple comparisons [267]. Finally, the conceptualization of items as representative of a broader pool of potential items that could have been selected for an assessment—either literally, as in large-scale standardized tests that draw from large item banks for each test administration, or hypothetically, as in a researcher-developed vocabulary assessment that could have plausibly selected different words—matches the random effects approach [223, 173, 185, 234].
2 Methods
2.1 Data
We use 20 publicly available RCT data sets containing over 2.3 million item responses in economics, education, and related fields. Inclusion criteria for our analysis are as follows: the data set must include (i) item-level outcome data, (ii) a baseline measure prior to intervention (either a lagged outcome or a similar metric to the final outcome)444While measurement error in pretest variables can create bias in the coefficients of other variables in the regression model, this is more of an issue in observational rather than experimental studies. See [242] for a discussion., and (iii) sufficient empirical information in the article or replication materials to verify the scoring of the items to determine whether any items needed to be reverse-coded. We identified our data sources by first examining existing studies of IL-HTE in education and epidemiology and then expanded our search to replication materials from studies published in the American Economic Review and Economic Journal using a keyword search that included the terms “randomized controlled trial,” “randomized trial,” “randomized evaluation”, and “experiment”. We focus on these two economic journals because they have strong editorial policies to encourage the publication of data alongside the articles. We also searched the Jameel Poverty Action Lab (JPAL) and Innovations for Poverty Action (IPA) Dataverse websites for replication materials. Our 20 examples are not intended to be exhaustive but rather illustrative of the advantages of IL-HTE analysis across a broad range of empirical and disciplinary settings.
We make the following simplifications to each data set in our cleaning to allow the highest degree of comparability between studies and for clarity of exposition. Our replication materials contain clearly documented cleaning code for each study that show where and how each of the following rules is applied.
-
1.
If multiple treatments are administered, we combine groups to represent any treatment (1) compared to any control (0).
-
2.
We use only the initial treatment assignment as our treatment indicator variable.
-
3.
We consider randomization as if it were conducted at the individual level, although we note that our models could easily be expanded to include randomization blocks, cluster-corrected standard errors, or multilevel models that include random intercepts for higher-level units such as schools.
-
4.
If multiple time points are available, we use only the first post-treatment follow-up.
-
5.
For studies reporting only summary measures of baseline or pretest variables, we standardize the pretest variable to mean 0 variance 1 in the sample. If item-level data are available for the pretest measure, we create pretest scores using a Rasch or one-parameter logistic (1PL) IRT model to match our outcome model, which is also a Rasch model.
-
6.
For the three studies in which the item responses include more than two response categories (e.g., Likert scales ranging from strongly disagree to strongly agree), we convert polytomous responses to dichotomous responses (e.g., strongly agree / agree = 1, disagree / strongly disagree = 0; there were no scales with an odd number of response categories in our data). While it is possible to extend the IL-HTE model to polytomous applications [205], we dichotomize to make the models directly comparable across all studies.
Our analyses therefore depart from many of the original analyses which included design features such as multiple treatments, randomization blocks, additional time points, or other covariates, to maintain focus on the consequences and interpretation of IL-HTE. Our analysis is therefore intended to be illustrative of the affordances of the IL-HTE model across a range of contexts rather than providing a direct replication of the analytic approach used in each original study. We return to extensions of the modeling approach demonstrated here in Section 4.
Descriptive information for each data set is summarized in Table 1. Our replication materials contain URLs to the original studies and the replication materials for each study.
| Study | Location | Outcome | N | I | |
|---|---|---|---|---|---|
| [206] | USA | Reading Comprehension | 7797 | 30 | 0.93 |
| [228] | USA | Reading Comprehension | 2174 | 20 | 0.84 |
| [205] | Europe | Depression (HDRS-17) | 5314 | 17 | 0.86 |
| [166] | Liberia | Crime and Violence | 916 | 20 | 0.94 |
| [294] | UK | Health Literacy | 2486 | 7 | 0.73 |
| [175] | Brazil | Financial Literacy | 15395 | 10 | 0.69 |
| [229]a | USA | Vocabulary | 1352 | 36 | 0.94 |
| [229]b | USA | Reading Comprehension | 1303 | 29 | 0.90 |
| [215] | Ecuador | Domestic Violence (VAWI) | 1284 | 19 | 0.97 |
| [159] | Colombia | Depression (CESD) | 1427 | 10 | 0.80 |
| [230]a | USA | Reading Self Concept | 4834 | 20 | 0.53 |
| [230]b | USA | Vocabulary | 2565 | 24 | 0.87 |
| [230]c | USA | Vocabulary | 2580 | 24 | 0.89 |
| [264]a | Liberia | Literacy | 3381 | 20 | 0.92 |
| [264]b | Liberia | Math | 3381 | 44 | 0.98 |
| [264]c | Liberia | Raven’s Progressive Matrices | 3381 | 10 | 0.75 |
| [187] | India | Math | 3202 | 32 | 0.93 |
| [197]a | Ghana | Math | 17344 | 21 | 0.93 |
| [197]b | Ghana | English | 17344 | 21 | 0.97 |
| [197]c | Ghana | Local Language | 17331 | 21 | 0.93 |
-
•
Notes: N = number of subjects, I = number of items, = the internal consistency of the test. The original patient data from [205] are private, but the authors provide a simulated data set of item responses set derived from their empirical results that we use in our analysis. [230]b and 2021c represent different vocabulary tests administered to Grade 1 and Grade 2 students, respectively. The letters after the study names do not indicate different publications, but different data sets from the same publication.
2.2 Models
We estimate the following five specifications using mixed effects logistic regression applied to each data set, presented below in reduced form, where :
| (17) | ||||
| (18) | ||||
| (19) | ||||
| (20) | ||||
| (21) |
Equation 17 includes only the treatment indicator, as both a baseline model for comparison and to estimate the residual standard deviation of , , which represents the pooled SD of the latent variable , which we use to standardize the estimates from the other models. That is, all figures in our tables and graphs are divided by from Equation 17 from each data set so that they can be interpreted in SD units and compared across both models and studies [174, 206]. Equation 18 adds the baseline covariate . Equation 19 adds IL-HTE as a random slope for treatment at the item level. Equation 20 adds an interaction between treatment and the baseline covariate, without IL-HTE, to represent the standard person-centered approach to HTE analysis in the IRT framework. Equation 21 fits a flexible approach that includes both the treatment by baseline covariate interaction and IL-HTE to allow for both person- and item-dependent HTE [208].
The complete hierarchical form of Equation 21 is as follows:
| (22) | ||||
| (23) | ||||
| (24) | ||||
| (25) | ||||
| (26) |
All other models can be interpreted as constrained versions of Equation 22. Compared to Equation 22, Equation 20 constrains to 0, Equation 19 constrains to 0, Equation 18 constrains both and to 0, and Equation 17 constrains and to 0. A directed acyclic graph for Equation 22 is displayed in Appendix D.555Equation 22 is a generalized linear mixed model (GLMM) with a logistic link function and random effects for items and persons. GLMMs can be fit using various statistical programs including Stata (melogit), SPSS (PROC NLMIXED), R (glmer), and Mplus. We conducted our analyses in R, and basic R syntax to fit each model is shown in Appendix C [203, 186].
3 Results
We focus on the broad patterns of results across studies to highlight the interpretation and implications of IL-HTE for empirical analysis. Our supplement shows the full regression output and fit statistics for each model applied to each data set. We categorize our results in terms of five insights provided by the IL-HTE model, each representing implications for causal inference, identification, or generalizability. Unless otherwise specified, the results and figures below are drawn from Equation 19.
3.1 The IL-HTE model reveals variation in item-specific or subscale effects potentially masked by the ATE
A single-number estimate of the ATE may mask significant variation item-specific or subscale effects. To illustrate the range of item-specific treatment effects in our data, Figure 1 shows the distribution of ATEs () and empirical Bayes estimates of item-specific effects () by study. The points are color-coded by whether the point estimate is statistically significant at the 5% level. We see a wide range of distributions of item-specific effects across studies. For example, we see that [159] shows a null ATE and [175] shows a positive ATE, and the effect appears nearly constant across all items in both cases. In contrast, [206] shows a null ATE with one item showing a significant positive effect, while [230]b shows one outlying item with a large positive effect over 3, and several items showing near null or non-significant effects, suggesting that a content analysis of this potentially outlying item could be informative. This level of fine-grained detail would be obscured in an analysis that did not model IL-HTE.
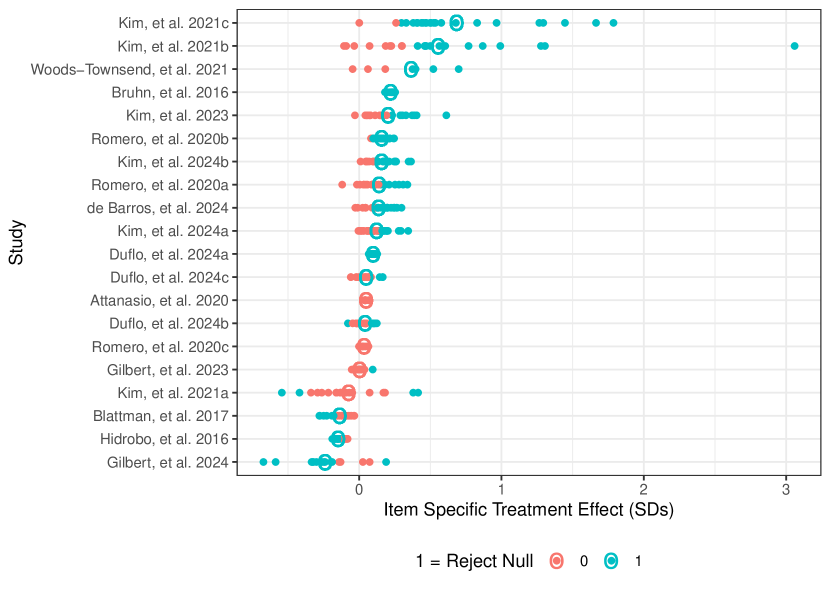
Notes: The figure shows the distribution of empirical Bayes estimates of item-specific treatment effects by study. The small points represent individual item effects. The hollow circles indicate study mean effects. The points are color coded by whether the effect is statistically significant at the 5% level.
In addition to the affordances offered by analysis of the individual item-specific treatment effects, we view a further promising application of the IL-HTE model to be the estimation of treatment-by-item characteristic or subscale effects. In interacting treatment status with an item-level variable, such as whether an item represents algebra or geometry on a math test, we can go beyond the unexplained variation of the random slopes model to the systematic variation of an interaction model that allows for more informative tests of specific hypotheses [207]. For example, [205] report that selective serotonin reuptake inhibitors (SSRIs) have the strongest impact on the subset of depression items measuring mood rather than more generalized physical symptoms of depression, such as loss of appetite; these findings align with the biochemical mechanisms through which SSRIs affect brain chemistry. While subscale analyses could in principle be carried out with separate regression models for each subscale, such an approach requires a priori selection of the subscale, the assumption that within each subscale, the item effects are constant, offers no direct test of the differences in effects by subscale, and does not adjust for the lower reliability of subscales measured with fewer items than the overall scale [203].666While testlet models (described in Section 1.1) provide an alternative to the treatment-by-subscale interactions described here, we view the IL-HTE approach as a more general method that encompasses both testlets and treatment by item characteristic interactions. For example, a testlet approach would likely be a poor model to test for differential treatment effects on, say, multiple choice vs. open response items, or the position of an item in a test, each of which could be included in the IL-HTE model as treatment-by-item characteristic interactions. Treatment-by-item characteristic interaction effects also allow us to calculate pseudo- values by comparing from a model without treatment by subscale interactions to one with the interactions to determine how the residual IL-HTE may be reduced. Previous treatment by subscale analyses have shown large explanatory power of subscale interactions; e.g., pseudo- values of when allowing differential effects by reading comprehension passage [206], when the mood-level subscale was allowed to vary relative to physical symptoms [205].
3.2 The IL-HTE model provides standard errors that account for the selection of items in the construction of the outcome
Standard errors from models that do not allow for IL-HTE ignore the variation caused by the selection of items onto an assessment. That is, models that assume that the treatment effects are constant across the items allow for only one source of uncertainty, namely, sampling variation at the person level. If treatment differentially impacts each item, the variability related to the selection of a specific set of items used to measure outcomes also matters. Had a different set of items been selected, the estimated treatment effect would be different in each realization of the test, holding the people constant [173, 209, 206, 207]. As a random slopes model, the IL-HTE approach explicitly accounts for the sampling error of the items selected onto the assessment and provides SEs that account for this added uncertainty [206, 163, 205]. We argue that the SEs provided by the IL-HTE model are therefore more meaningful given that in most applications the focus should be on making causal inferences to the population of items that could have been on an outcome measure, rather than the specific items included in a single realized outcome administration.777If a set of items on an assessment is truly fixed, then a model with item fixed effects or random intercepts would be appropriate. See [206, pp. 894-895] for a discussion. This is especially true when estimating causal effects on standardized educational assessments where specific items change over time, such as the SAT, ACT, NAEP, or state standardized tests, or on health outcomes such as hearing loss or depression where different symptoms could have been selected for measurement [205, 224].
When is large, the estimated SE of the ATE increases, sometimes substantially, according to the following formula derived from Generalizability Theory [173], where is the variance of from a model that assumes a constant treatment effect (i.e., the SEs provided by the random intercepts model in Equation 18) and is the number of items:
| (27) |
The inflation of SEs due to in our data is displayed in Figure 2, which plots the ratio of the SE derived from the IL-HTE model (Equation 19) to the SE derived from the constant effects model (Equation 18) against against . We observe a strong relationship between this SE ratio and , with the ratio exceeding a factor of 4 in the most extreme case, a large difference that is equivalent to reducing the effective sample size by a factor of 16. While such insights about the inflation of SEs have long been recognized in power analysis and sample size considerations for clustered data generally [226, 150, 283, 295], consideration of the same principles with regard to assessment items has so far been underappreciated [206, 151]. An important implication of Equation 27 is that when substantial IL-HTE is present, sampling more people will not substantially improve precision, only more items will [193, Figure S7].
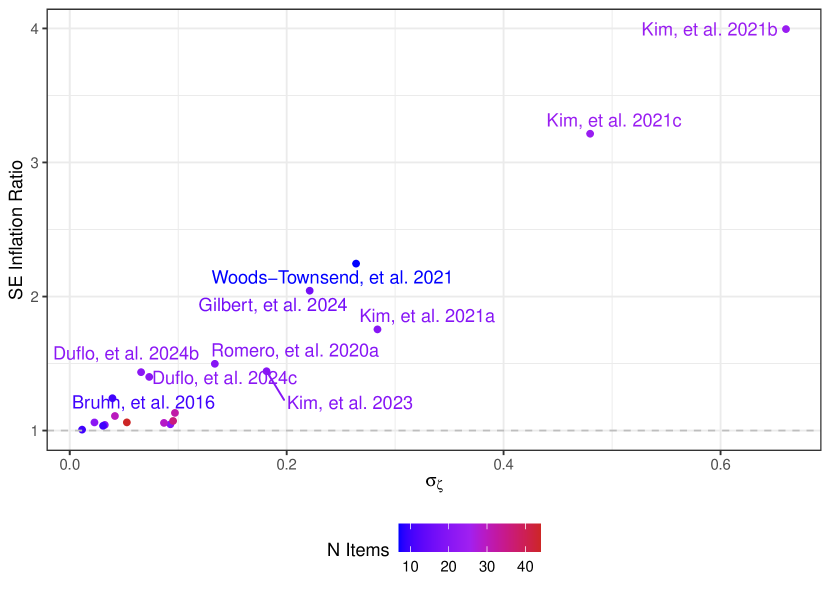
Notes: The vertical axis shows the ratio of SEs from the IL-HTE model to the random intercepts model. That is, a value of 1 indicates that the SEs are equal and a value of 2 indicates that the SE in the IL-HTE model is double that of the random intercepts model. The horizontal axis shows the SD of item-specific treatment effects in each data set (). The points are color coded by the number of items.
Furthermore, Equation 27 allows for a novel approach to sensitivity analysis to determine how robust a result is to unobserved IL-HTE [219, 256]. That is, for a given statistically significant treatment effect size, SE, and number of items , we can calculate how much IL-HTE would be required to render the result non-significant. Importantly, the sensitivity analysis can be easily calculated without item-level data using the formula presented in Equation 27 by solving for to determine the point at which an estimated treatment effect size would become non-significant. Assuming a positive treatment effect, the formula yields (the algebra is presented in Appendix A):
| (28) |
As an example, suppose an analysis of a total test score revealed . The critical value of required to render the effect non-significant is .52 for a 20-item test and .37 for a 10-item test. While large, these figures are consistent with the range of observed in our data and could thus make many observed effect sizes that ignore this source of variance non-significant, as we will explore in the next section.
3.3 The IL-HTE model allows for out-of-sample generalizations
Related to the SE considerations described in Section 3.2, the IL-HTE model also allows us to calculate a prediction interval (PI; [171, 257]) that covers a plausible range of expected treatment effects on out-of-sample items. A 95% PI could have important practical implications in, for example, medical contexts, to identify whether the treatment effects are positive for untested symptoms [205]. While a 95% CI may be far from 0 indicating a statistically significant ATE, a 95% PI that crosses zero could indicate negative side effects of a treatment. The formula for the PI is as follows [172, p. 130]:
| (29) |
Substituting in Equation 27, we can expand the formula for the PI to
| (30) |
Note that as both the number of persons and number of items increases, the 95% PI approaches .
Figure 3 shows the 95% CI for the random intercepts model (red), the IL-HTE model (blue), and the 95% PI for treatment effects on out-of-sample items (black). We highlight results for three illustrative studies: [175], who measure financial literacy, [230]b, who measure vocabulary, and [205], who measure depression. [175] shows a narrow 95% CI that is barely inflated when IL-HTE is taken into account, and the 95% PI is also narrow, suggesting that treatment effects on other indicators of financial literacy would likely be similarly affected by the intervention. In contrast, we see in [230]b that the narrow 95% CI from the random intercepts model dramatically increases in the IL-HTE model, and the 95% PI shows a very large range for out of sample vocabulary words, suggesting the intervention effects could vary widely depending on which vocabulary words are tested. As a middle ground, [205] shows a 95% CI that is moderately inflated by IL-HTE and a 95% PI that includes positive values, suggesting that some depression symptoms could be worsened by treatment. Whereas Figure 1 shows the observed distribution of item-specific treatment effects in a given study, the 95% PI provides a range of treatment effects on an untested item drawn from the same population of items—in the present case, other related vocabulary words, other depression symptoms, or other indicators of financial literacy. In sum, the IL-HTE approach provides novel insights on the generalizability of causal effects to untested circumstances.
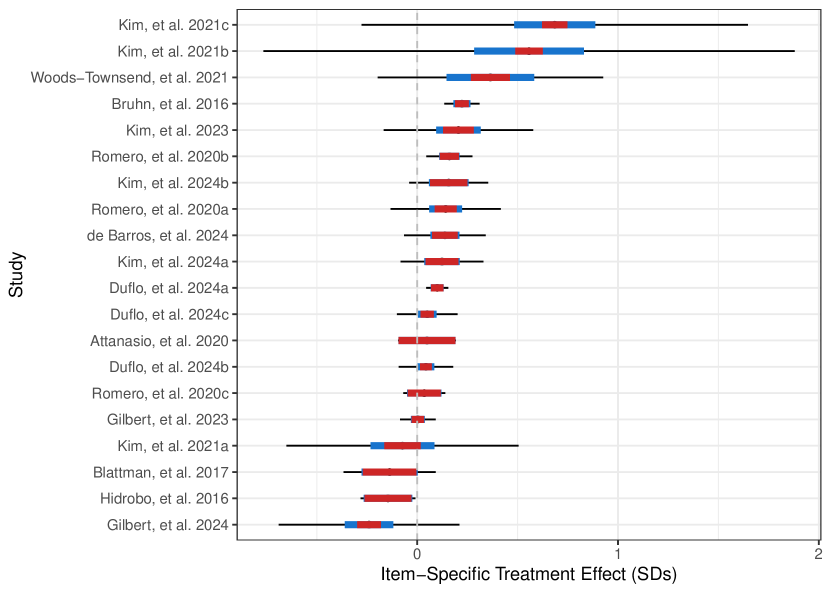
Notes: The red shows the 95% CI in the constant effects model. The blue shows the 95% CI in the IL-HTE model. The black shows the 95% PI, providing a range of item-specific treatment effects on out of sample items.
3.4 The IL-HTE model resolves identification problems in the estimation of treatment by covariate interaction effects
One serious problem associated with ignoring IL-HTE is that it can be impossible to distinguish between person-level and item-level HTE when the analysis focuses on aggregate outcomes. Suppose that there is interest in treatment heterogeneity as a function of some person-level covariate . It is possible to estimate a treatment-by-covariate interaction effect (Equation 20) when, in fact, the true model contains no interaction but instead IL-HTE (Equation 19). That is, the treatment effect is constant across , but the items constituting the outcome make the observed treatment effect appear heterogeneous across the . Put simply, IL-HTE creates an identification problem for treatment-by-covariate interaction effects when the analysis focuses on the score-level outcome alone.
To illustrate conceptually, imagine two educational interventions, each impacting a construct like math that consists of several subdomains ranging in difficulty (e.g., starting with basic addition and then progressing to multiplication and division of fractions). In the first intervention, the treatment helps previously low-achieving students the most, and this is true across all items. Such a pattern of treatment effects could be caused by, for example, a remedial intervention that provides more tutoring to low-ability students. In this scenario, there is true HTE by baseline achievement, with initially low-achieving students benefiting the most. In the second, there is no HTE by baseline achievement, only IL-HTE: the treatment improves all students’ capacity to correctly answer the easiest items the most. This pattern could be caused, for example, by a basic skills curriculum provided to all students that improves accuracy rates on easy items but not on hard ones. These two scenarios have distinct implications for policy and how the intervention should be targeted or refined, and yet it can be impossible to distinguish between them when using summary scores alone. Thus, we caution against using a sum score as an outcome variable in a conventional analysis [198, 247] when HTE is of interest, given that the pattern of results produced by each intervention is empirically indistinguishable [278].
However, we can leverage item-level outcome data with the IL-HTE model to solve this identification problem and identify the relevant data-generating process [208]. We illustrate this point conceptually, visually, and empirically with minor mathematical detail; we refer readers interested in a full treatment of this issue to prior publications that include a proof of a simple case and a Monte Carlo simulation study (ibid.). A toy example of the identification problem using a three-item test is displayed in Figure 4 [208]. The upper row shows the probability of a correct response to each item for each group as a function of the baseline covariate . The left panel shows “person-dependent” HTE, namely, an interaction between treatment status and , as shown by the different slopes of the item-specific curves by group. When we sum these curves to calculate the expected test score in the bottom left panel, we see a pattern in the overall test score that is the typical signature of an interaction effect. In contrast, the top right panel shows “item-dependent” HTE, where . That is, the easiest item (i.e., the leftmost item) shows a large positive effect, the middle item shows no treatment effect, and the hardest item shows a large negative effect. In essence, the combination of has stretched the item-specific curves with respect to by increasing the SD of the item locations, . When we sum these curves in the bottom right panel, the result is an essentially identical pattern in the sum score to the pattern in the bottom left panel. In other words, despite the different underlying data-generating processes, the sum scores displayed in the bottom row are empirically indistinguishable, which presents a serious problem for the interpretation of interaction effects on outcomes derived from psychometric instruments. However, the item-level patterns are quite distinct, suggesting that they can be identified with an appropriate analysis of item-level data. Previous simulation studies have confirmed that these two processes can become confounded, but a flexible model that allows for both person- and item-HTE (Equation 22) eliminates bias and identifies the correct DGP [208].888Tests in the online supplement of [208] show that a linear probability model or factor analytic approach that allows for IL-HTE fails to resolve the identification problem identified here. Furthermore, linear models generally perform poorly when estimating interaction effects for dichotomous or ordinal outcomes [194] We present a more formal mathematical expression of the identification problem shown in Figure 4 in Appendix B.
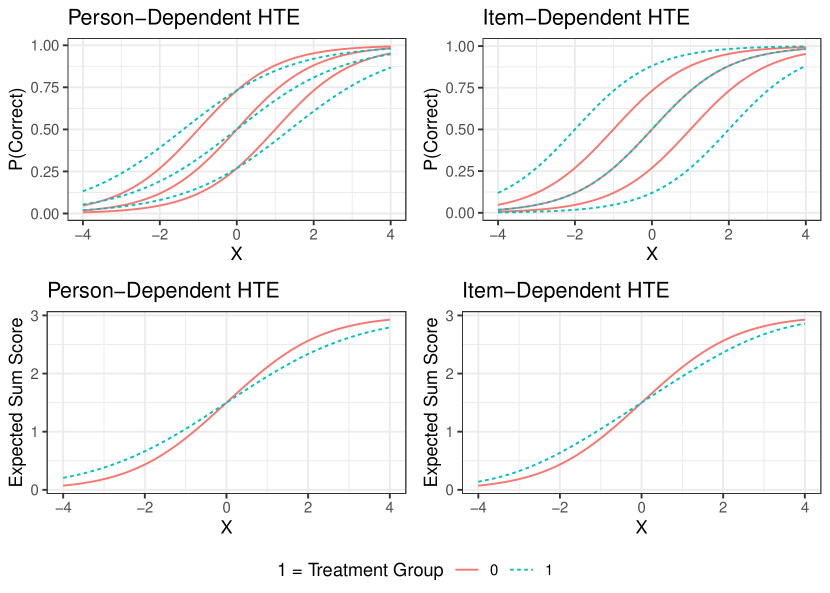
Notes: The top row presents probabilities of a correct response for each item and the bottom row sums the item curves to generate the expected sum score for each test. The horizontal axis represents some pretreatment covariate correlated with the outcome (not post intervention ability, or , as is typical in these types of plots). In the upper left panel, the treatment changes the slopes of the item curves with respect to the covariate and summing these curves to create the test score yields a similar pattern. In the top right panel, the treatment effect is correlated with the item location, yielding a nearly identical pattern in the bottom right panel. (Figure adapted from [208].)
To show what the confounding of person- and item-dependent HTE looks like in a single empirical data set, we illustrate with data from [230]b, who evaluate the effect of the Model of Reading Engagement (MORE) intervention on the vocabulary knowledge of Grade 1 students. The estimated treatment by baseline test score interaction effect is attenuated by about a third, reducing from in the model that does not allow for IL-HTE compared to in the IL-HTE model, a large reduction. The data are shown in Figure 5, which plots the mean scores (left panel), the correct response probabilities (middle) and the correct response log-odds (right) as a function of treatment status and baseline scores, and the items are ordered from most to least difficult. We see that the apparent treatment by baseline interaction in the mean scores is partially driven by (), suggesting that the treatment effect is largest on the most difficult vocabulary words, which, coupled with the large value of in this data set leads to an inflated interaction term, as we can see in the panels showing the item-level data, which show a much smaller difference in slopes compared to the mean scores. An advantage of the flexible model (Equation 22) is that it allows both sources of HTE to be estimated simultaneously, providing the most accurate view of HTE. In this case, we can see that the MORE intervention helped both the highest achieving students the most, on average across all items, and helped the most difficult content the most, on average across all students.
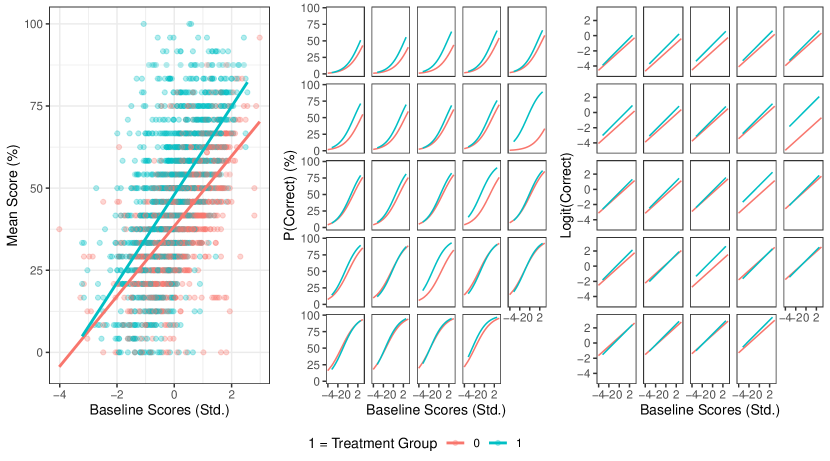
Notes: The left panel provides a scatter plot of the mean test score on a researcher-designed vocabulary assessment containing 36 items against standardized baseline scores and shows a large positive interaction between baseline scores and treatment status. The middle panel shows the probabilities of a correct response for each item, ordered from most difficult to least difficult, and we can see that the treatment effects appear to be the largest on the most difficult items. The right panel shows the item responses in log-odds, and we can see the pattern more clearly. While there is a slight difference in the slopes in the log-odds, the large interaction in the mean score is partially driven by the concentration of larger effects on the most difficult items. The item curves are derived from a fixed effects model of the correct response on treatment, item, and baseline score, with two-way interactions between treatment and item and treatment and baseline score.
How large a problem is the potential confounding of interaction effects through treatment-item easiness correlations empirically? [208] left this as an open question, given the relative paucity of item-level causal analyses examining this question, though at least one study suggests in an analysis of item-level data from 15 RCTs of educational interventions [151]. We explore the phenomenon in our data set in Figure 6, which plots the change in the estimated treatment-by-baseline interaction term from a model that does not allow for (Equation 20) against one that does (Equation 21) against the ratio of the SD of item locations in the treatment group (denoted ), compared to the SD of item locations in the control group () in each data set. According to the mathematical arguments presented in Appendix B, a ratio of 1 (i.e., no IL-HTE) will yield no difference in interaction terms, values less than 1 will yield a positive difference, and values greater than 1 will yield a negative difference.
Figure 6 provides three key insights. First, the empirical data are in excellent alignment with the theoretical arguments presented above and prior simulation studies showing that IL-HTE creates bias in treatment-by-covariate interaction effects. That is, the larger the ratio of SDs, the larger the difference between the interaction terms estimated from each model, in a direction that aligns with our theoretical arguments (). Second, varies widely in empirical data, ranging from near perfect negative correlations to moderately positive correlations in our data. Third, appears to be a relatively stable feature of interventions. For example, the three outcomes from [197], show , suggesting that the treatment effects were largest on the easiest items, and this was true across all outcomes. In contrast, studies by Kim et al., who examined variations of the Model of Reading Engagement (MORE) intervention show , suggesting that MORE helps more difficult content to a greater extent than easier content. In sum, given an observed treatment-by-baseline covariate interaction effect on a total score (e.g., a sum or IRT-based score), researchers should be quite cautious in interpretation when item-level data are not available and consider the possibility of IL-HTE and treatment-by-item easiness correlations as a potential explanation.
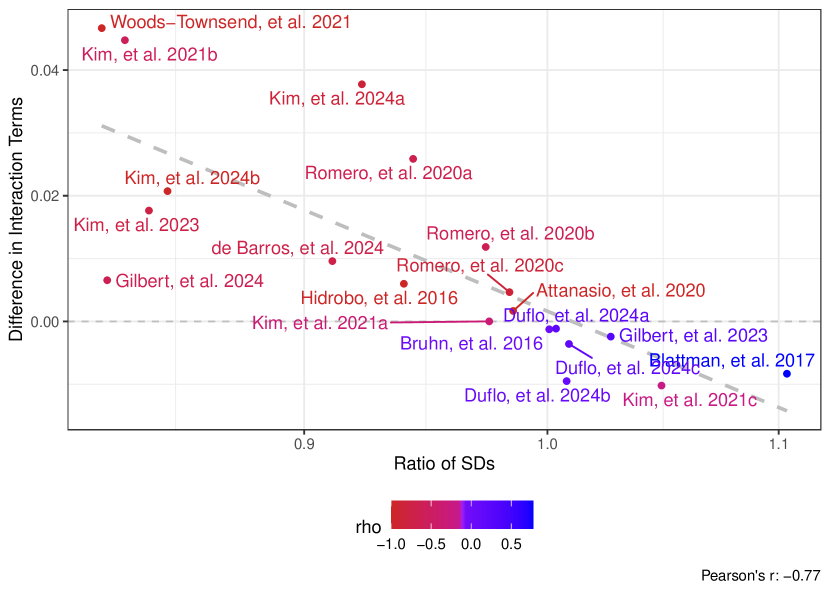
Notes: The vertical axis shows the difference in interaction terms from a model that assumes constant item effects ( in Equation 20) compared to a model that allows for IL-HTE ( in Equation 21). The horizontal axis shows the ratio of standard deviations of item locations in the treatment group () to the standard deviation in the control group ().
As an example of how these issues could affect the design of policies and interventions, consider school accountability systems. Some evidence suggests that school accountability policies can create incentives for teachers to focus on specific content or students to move as many students as possible above a predefined “proficiency” threshold that is used as an accountability metric [170, 293, 237, 188, 245, 258, 189, 190]. In this case, understanding whether a treatment improves the overall performance of low-ability students or improves the accuracy on the easiest items that best distinguish among low-ability students is an important distinction that is not easily addressed without item-level data.
3.5 The IL-HTE model provides estimates of standardized effect sizes corrected for attenuation due to measurement error
Many studies of assessment or survey outcomes report standardized effect sizes because they are more interpretable and comparable across different measures [268]. An underappreciated challenge of using standardized outcome variables is that they are biased downward by measurement error. This occurs because when we divide a regression coefficient by the pooled SD of the outcome variable to calculate an effect size such as Cohen’s , the estimated SD of is too large due to measurement error. In particular, the standardized effect size derived from an observed outcome score will be too large by a factor of , where is the reliability of the measure; the bias can therefore be corrected by dividing the standardized effect size by the square root of an estimate of reliability such as Cronbach’s [204, 271, 214].999Crucially, this bias can still occur in more complex IRT or factor analytic scoring procedures when one produces scores then estimates regressions in separate steps [204, 281, 174, 271]. More complex IRT scoring procedures such as multigroup models can also address attenuation bias; see [277] for a review. Combining this fact with the inflation of SEs due to IL-HTE described in Section 3.2 suggests the troubling result that models of psychometric outcomes may be, on average, understating magnitudes but overstating precision, thus yielding a more precise view of a biased estimate. In particular, various studies demonstrate that measurement model misspecification (namely, using a measurement model that does not match the experimental or quasi-experimental study design, or in the present case, assuming a constant effects model when IL-HTE is the true data-generating process) combined with the scoring approach used can affect Type I error rates and power due to the score variances that such model-by-scoring approach interactions produce [277, 275, 276].
As a latent variable model, the IL-HTE model mitigates this problem because the random effects variances and the fixed effects are simultaneously estimated and appropriately account for the measurement error in the outcome variable. In other words, from the model is an unbiased estimator for (in general and in the presence of IL-HTE), in contrast to . As a result, standardized effect sizes derived from latent variable models are not biased downward by measurement error and are therefore more comparable across different tests of varying reliability, or forms of the same test with different numbers of items. We demonstrate attenuation of the standardized effect sizes due to measurement error in our empirical data in Figure 7. The vertical axis shows the difference between the standardized effect size derived from Equation 18 plotted against the standardized effect size derived from a sum score model. We can see the downward forces of measurement error in that the effect sizes derived from the sum score models are consistently smaller in magnitude than those derived from the IRT model, in some cases exceeding .10, a large difference.
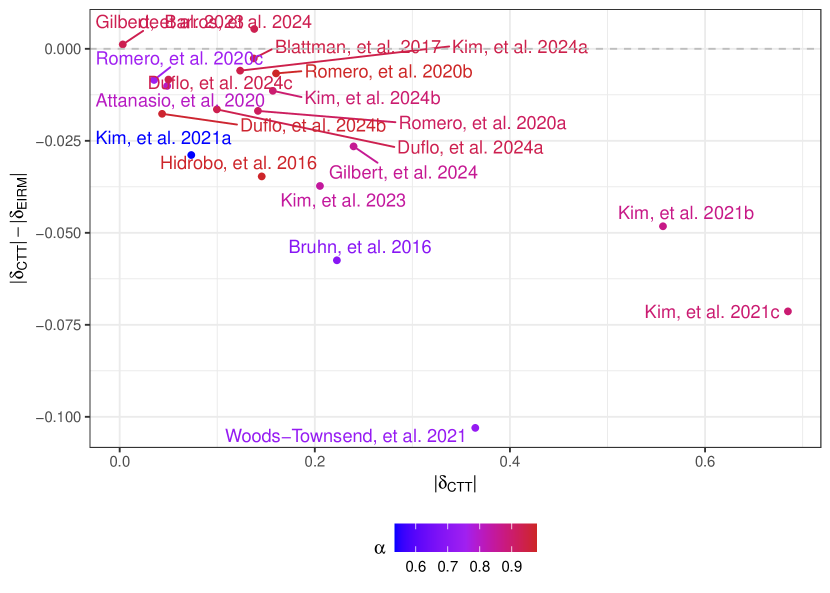
Notes: This figure shows the attenuation bias that arises from measurement error when the outcome variable is standardized. The horizontal axis shows the absolute value of the standardized effect size derived from a sum score (). The vertical axis show the difference between the sum score effect size and an effect size derived from the Explanatory Item Response Model (, Equation 18). The points are labelled by study and color coded by the internal consistency of the measure ().
4 Discussion
Traditional methods for HTE analysis that focus on treatment-by-person characteristic interactions are critical, but typically ignore the HTE that may exist among items of an outcome measure. To address this methodological shortcoming, IL-HTE models that allow for unique treatment effects on each assessment item offer an attractive approach. Our evaluation of more than 2.3 million item responses from 20 RCT data sets demonstrates the advantages of the IL-HTE model and the benefits it provides for inference, identification, and generalizability, all essential components of rigorous program evaluation and policy analysis. In short, the IL-HTE model provides a powerful measure of item-level treatment variation, standard errors that are more theoretically aligned with most applications, estimates of generalizability of treatment effects to untested items, the resolution of critical identification problems in the estimation of interaction effects, and standardized treatment effect sizes that are corrected for attenuation due to measurement error.
We maintained focus on the simple case of individual randomization with two groups at one time point for clarity and to illustrate the affordances of the IL-HTE model, but note that the model can be easily extended to more diverse applications. For example, the IL-HTE model can easily be extended by including additional covariates, randomization blocks, polytomous or continuous items101010When the items are truly continuous, the identification problem for interaction effects is resolved, which we can see by imagining Figure 4 with lines instead of curves. [205, 176], additional levels of hierarchy such as students nested within schools [206], longitudinal structures [207], or fully Bayesian approaches [177, 203]. One constraint of the models explored here is that they assume that each item is equally discriminating with respect to the latent trait. That is, they are Rasch or one-parameter logistic (1PL) IRT models. The IL-HTE model can be extended to the case of varying discriminations (i.e., a 2PL IRT model), although model implementation requires more advanced software and more computational power [177, 251, 263, 203]. Furthermore, previous simulation studies show that the 1PL IL-HTE model is relatively robust to 2PL data-generating process [206], and item discriminations that function as optimal scoring weights are not particularly consequential in causal inference applications where all subjects respond to the same set of items [204]. In other words, while more complex models are available, the marginal gains to the accuracy of the results may be low [193, 178, 204, 272]. Therefore, given its novelty, the 1PL IL-HTE model presented here has much to offer fields where item response data is commonly collected but rarely used. Furthermore, beyond RCTs, extensions of the IL-HTE model are applicable to alternative experimental and quasi-experimental designs, such as longitudinal growth models, regression discontinuity, multisite trials, and difference-in-differences designs [276, 275, 207, 235].
We acknowledge three primary limitations to our approach. First, item-level outcome data is not always available in secondary analysis. For example, in our search for data sets to include in our study, we found several examples of large-scale RCTs that would otherwise have met our inclusion criteria, except that they only provided summary score outcomes. As such, one implication of our results is that researchers should share item-level data in their replication packages [192]. Second, poorly designed assessment instruments could yield results that could be mistaken for IL-HTE. For example, if a single item is too easy (or too hard) such that every student in the treatment and control group gets the item right (or wrong), the observed treatment effect on that item would be 0, a result that could be mistaken for IL-HTE even if the true data-generating process is a constant treatment effect model. More generally, poor instrument design can create challenges for all causal identification, not just IL-HTE, for example, when floor or ceiling effects on items mask changes in the underlying latent trait [194]. Finally, the IL-HTE model requires large sample sizes and as such is best suited for relatively large data-analytic contexts, with previous simulation studies suggesting minimum sample sizes of approximately 500 subjects and 20 items [206, 207].
As a final note, the IL-HTE model and latent variable models are generally not nearly as widely used in causal, econometric, or policy evaluation applications as they are in psychology, education, and psychometrics, and as such the explanation and justification of such models may be a difficult task depending on the audience. However, we argue that such a task is a worthy one, given the affordances of latent variable models for causal analyses explored here. Communicability can be aided by the techniques described in this study, for example, by standardizing coefficients to create findings analogous to standardized effect sizes of sum score outcomes, with the added benefit of correcting for attenuation due to measurement error.
In conclusion, item-level outcome data represent a vast and mostly untapped resource for applied causal inference and the estimation of treatment heterogeneity. While item-level outcome data are ubiquitous in education, psychology, epidemiology, and economics, collapsing the item responses to a single summary score obscures important insights into the nature of treatment effects. Using the IL-HTE model, analysts in all quantitative disciplines can gain more valuable insight into for whom and on what items treatments are effective.
5 Acknowledgements
This research was supported in part by the Jacobs Foundation. The authors wish to thank Alex Bolves and seminar participants at Harvard University, Stanford University, and the University of Oslo for their helpful comments on drafts of this paper.
6 Data and Code Availability
The original data sets are publicly available. While we do not have permission to share them directly, our replication files contain URLs to both the original articles and replication packages. Our code and results are available at the following URL: https://researchbox.org/2877&PEER_REVIEW_passcode=KCJOZW.
References
- [1] Alberto Abadie, Susan Athey, Guido W Imbens and Jeffrey M Wooldridge “When should you adjust standard errors for clustering?” In The Quarterly Journal of Economics 138.1 Oxford University Press, 2023, pp. 1–35
- [2] Ishita Ahmed et al. “Heterogeneity of item-treatment interactions masks complexity and generalizability in randomized controlled trials” In Edworkingpapers. com, 2023
- [3] Dennis J Aigner, Cheng Hsiao, Arie Kapteyn and Tom Wansbeek “Latent variable models in econometrics” In Handbook of econometrics 2 Elsevier, 1984, pp. 1321–1393
- [4] Ingvild Almås, Orazio Attanasio and Pamela Jervis “Economics and Measurement: New measures to model decision making”, 2023
- [5] Joshua D Angrist and Jörn-Steffen Pischke “Mostly harmless econometrics: An empiricist’s companion” Princeton university press, 2009
- [6] John Antonakis, Nicolas Bastardoz and Mikko Rönkkö “On ignoring the random effects assumption in multilevel models: Review, critique, and recommendations” In Organizational Research Methods 24.2 Sage Publications Sage CA: Los Angeles, CA, 2021, pp. 443–483
- [7] Susan Athey and Guido W Imbens “The econometrics of randomized experiments” In Handbook of economic field experiments 1 Elsevier, 2017, pp. 73–140
- [8] Susan Athey and Guido W Imbens “The state of applied econometrics: Causality and policy evaluation” In Journal of Economic perspectives 31.2 American Economic Association 2014 Broadway, Suite 305, Nashville, TN 37203-2418, 2017, pp. 3–32
- [9] Susan Athey and Guido W Imbens “Machine learning methods that economists should know about” In Annual Review of Economics 11 Annual Reviews, 2019, pp. 685–725
- [10] Orazio Attanasio et al. “Estimating the production function for human capital: results from a randomized controlled trial in Colombia” In American Economic Review 110.1 American Economic Association 2014 Broadway, Suite 305, Nashville, TN 37203, 2020, pp. 48–85
- [11] Dale Ballou “Test scaling and value-added measurement” In Education finance and Policy 4.4 MIT Press One Rogers Street, Cambridge, MA 02142-1209, USA journals-info …, 2009, pp. 351–383
- [12] Badi H Baltagi “The two-way Mundlak estimator” In Econometric Reviews 42.2 Taylor & Francis, 2023, pp. 240–246
- [13] Gadi Barlevy and Derek Neal “Pay for percentile” In American Economic Review 102.5 American Economic Association, 2012, pp. 1805–1831
- [14] Andrew Bell, Malcolm Fairbrother and Kelvyn Jones “Fixed and random effects models: making an informed choice” In Quality & quantity 53 Springer, 2019, pp. 1051–1074
- [15] Peter M Bentler “Simultaneous equation systems as moment structure models: With an introduction to latent variable models” In Journal of Econometrics 22.1-2 Elsevier, 1983, pp. 13–42
- [16] Irina Bergenfeld et al. “Measurement invariance of the Center for Epidemiologic Studies Scale–Depression within and across six diverse intervention trials.” In Psychological Assessment American Psychological Association, 2023
- [17] Christopher Blattman, Julian C Jamison and Margaret Sheridan “Reducing crime and violence: Experimental evidence from cognitive behavioral therapy in Liberia” In American Economic Review 107.4 American Economic Association 2014 Broadway, Suite 305, Nashville, TN 37203, 2017, pp. 1165–1206
- [18] Kenneth A Bollen “Latent variables in psychology and the social sciences” In Annual review of psychology 53.1 Annual Reviews 4139 El Camino Way, PO Box 10139, Palo Alto, CA 94303-0139, USA, 2002, pp. 605–634
- [19] Daniel M Bolt and Timothy R Johnson “Addressing score bias and differential item functioning due to individual differences in response style” In Applied Psychological Measurement 33.5 Sage Publications Sage CA: Los Angeles, CA, 2009, pp. 335–352
- [20] Stéphane Bonhomme, Thibaut Lamadon and Elena Manresa “Discretizing unobserved heterogeneity” In Econometrica 90.2 Wiley Online Library, 2022, pp. 625–643
- [21] Jennifer Booher-Jennings “Below the bubble:“Educational triage” and the Texas accountability system” In American educational research journal 42.2 Sage Publications, 2005, pp. 231–268
- [22] Michael Borenstein “Avoiding common mistakes in meta-analysis: Understanding the distinct roles of Q, I-squared, tau-squared, and the prediction interval in reporting heterogeneity” In Research Synthesis Methods Wiley Online Library, 2023
- [23] Michael Borenstein, Larry V Hedges, Julian PT Higgins and Hannah R Rothstein “Introduction to meta-analysis” John Wiley & Sons, 2009
- [24] Robert L Brennan “Generalizability theory” In Educational Measurement: Issues and Practice 11.4 Wiley Online Library, 1992, pp. 27–34
- [25] Derek C Briggs “Using explanatory item response models to analyze group differences in science achievement” In Applied Measurement in Education 21.2 Taylor & Francis, 2008, pp. 89–118
- [26] Miriam Bruhn et al. “The impact of high school financial education: Evidence from a large-scale evaluation in Brazil” In American Economic Journal: Applied Economics 8.4 American Economic Association 2014 Broadway, Suite 305, Nashville, TN 37203-2425, 2016, pp. 256–295
- [27] Okan Bulut, Guher Gorgun and Seyma Nur Yildirim-Erbasli “Estimating explanatory extensions of dichotomous and polytomous Rasch models: The eirm package in R” In Psych 3.3 MDPI, 2021, pp. 308–321
- [28] Paul-Christian Bürkner “Bayesian Item Response Modeling in R with brms and Stan” In Journal of Statistical Software 100.5, 2021, pp. 1–54 DOI: 10.18637/jss.v100.i05
- [29] Katherine E Castellano and Andrew D Ho “Practical differences among aggregate-level conditional status metrics: From median student growth percentiles to value-added models” In Journal of Educational and Behavioral Statistics 40.1 SAGE Publications Sage CA: Los Angeles, CA, 2015, pp. 35–68
- [30] Victor Chernozhukov et al. “Double/debiased machine learning for treatment and structural parameters” Oxford University Press Oxford, UK, 2018
- [31] What Works Clearinghouse “What Works Clearinghouse procedures and standards handbook, version 5.0”, 2022
- [32] Amy L Cochran, Paul J Rathouz, Keith E Kocher and Gabriel Zayas-Cabán “A latent variable approach to potential outcomes for emergency department admission decisions” In Statistics in medicine 38.20 Wiley Online Library, 2019, pp. 3911–3935
- [33] David A Cole and Kristopher J Preacher “Manifest variable path analysis: potentially serious and misleading consequences due to uncorrected measurement error.” In Psychological methods 19.2 American Psychological Association, 2014, pp. 300
- [34] Patrick J Curran and Daniel J Bauer “The disaggregation of within-person and between-person effects in longitudinal models of change” In Annual review of psychology 62 Annual Reviews, 2011, pp. 583–619
- [35] Patrick J Curran et al. “Pooling data from multiple longitudinal studies: the role of item response theory in integrative data analysis.” In Developmental psychology 44.2 American Psychological Association, 2008, pp. 365
- [36] Paul De Boeck “Random item IRT models” In Psychometrika 73 Springer, 2008, pp. 533–559
- [37] Paul De Boeck et al. “The estimation of item response models with the lmer function from the lme4 package in R” In Journal of Statistical Software 39, 2011, pp. 1–28
- [38] Andreas Barros, Johanna Fajardo-Gonzalez, Paul Glewwe and Ashwini Sankar “The Limitations of Activity-Based Instruction to Improve the Productivity of Schooling” In The Economic Journal 134.659 Oxford University Press, 2024, pp. 959–984
- [39] Thomas S Dee and Brian Jacob “The impact of No Child Left Behind on student achievement” In Journal of Policy Analysis and management 30.3 Wiley Online Library, 2011, pp. 418–446
- [40] Thomas S Dee, Brian A Jacob, Jonah E Rockoff and Justin McCrary “Rules and discretion in the evaluation of students and schools: The case of the New York regents examinations” In Columbia Business School Research Paper, 2011
- [41] Thomas S Dee, Will Dobbie, Brian A Jacob and Jonah Rockoff “The causes and consequences of test score manipulation: Evidence from the New York regents examinations” In American Economic Journal: Applied Economics 11.3 American Economic Association 2014 Broadway, Suite 305, Nashville, TN 37203-2425, 2019, pp. 382–423
- [42] Richard P DeShon “A cautionary note on measurement error corrections in structural equation models.” In Psychological methods 3.4 American Psychological Association, 1998, pp. 412
- [43] Ben Domingue et al. “The InterModel Vigorish as a lens for understanding (and quantifying) the value of item response models for dichotomously coded items” PsyArXiv, 2022
- [44] Ben Domingue et al. “The Item Response Warehouse (IRW)” PsyArXiv, 2023
- [45] Benjamin W Domingue et al. “Ubiquitous bias and false discovery due to model misspecification in analysis of statistical interactions: The role of the outcome’s distribution and metric properties.” In Psychological Methods, 2022
- [46] Sarah Donegan, Paula Williamson, Umberto D’Alessandro and Catrin Tudur Smith “Assessing the consistency assumption by exploring treatment by covariate interactions in mixed treatment comparison meta-analysis: individual patient-level covariates versus aggregate trial-level covariates” In Statistics in medicine 31.29 Wiley Online Library, 2012, pp. 3840–3857
- [47] Sarah Donegan et al. “Exploring treatment by covariate interactions using subgroup analysis and meta-regression in cochrane reviews: a review of recent practice” In PloS one 10.6 Public Library of Science San Francisco, CA USA, 2015, pp. e0128804
- [48] Annie Duflo, Jessica Kiessel and Adrienne M Lucas “Experimental Evidence on Four Policies to Increase Learning at Scale” In The Economic Journal Oxford University Press, 2024, pp. ueae003
- [49] Jessica K Flake, Jolynn Pek and Eric Hehman “Construct validation in social and personality research: Current practice and recommendations” In Social Psychological and Personality Science 8.4 Sage Publications Sage CA: Los Angeles, CA, 2017, pp. 370–378
- [50] David J Francis et al. “Is the treatment weak or the test insensitive: Interrogating item difficulties to elucidate the nature of reading intervention effects” In Learning and individual differences 97 Elsevier, 2022, pp. 102167
- [51] Nicole B Gabler et al. “Dealing with heterogeneity of treatment effects: is the literature up to the challenge?” In Trials 10 Springer, 2009, pp. 1–12
- [52] Jennifer S Gewandter et al. “Demonstrating heterogeneity of treatment effects among patients: an overlooked but important step toward precision medicine” In Clinical Pharmacology & Therapeutics 106.1 Wiley Online Library, 2019, pp. 204–210
- [53] Joshua B Gilbert “Estimating treatment effects with the explanatory item response model” In Journal of Research on Educational Effectiveness Taylor & Francis, 2023, pp. 1–19
- [54] Joshua B Gilbert “Modeling item-level heterogeneous treatment effects: A tutorial with the glmer function from the lme4 package in R” In Behavior Research Methods Springer, 2023, pp. 1–13
- [55] Joshua B Gilbert “How measurement affects causal inference: Attenuation bias is (usually) more important than scoring weights” In Edworkingpapers. com, 2024
- [56] Joshua B Gilbert, Fredrik Hieronymus, Elias Eriksson and Benjamin W Domingue “Item-Level Heterogeneous Treatment Effects of Selective Serotonin Reuptake Inhibitors (SSRIs) on Depression: Implications for Inference, Generalizability, and Identification” In arXiv preprint arXiv:2402.04487, 2024
- [57] Joshua B Gilbert, James S Kim and Luke W Miratrix “Leveraging Item Parameter Drift to Assess Transfer Effects in Vocabulary Learning” In Applied Measurement in Education Taylor & Francis, 2024
- [58] Joshua B Gilbert, Luke W Miratrix, Mridul Joshi and Benjamin W Domingue “Disentangling Person-Dependent and Item-Dependent Causal Effects: Applications of Item Response Theory to the Estimation of Treatment Effect Heterogeneity” In Journal of Educational and Behavioral Statistics, 2024
- [59] Joshua B Gilbert, James S Kim and Luke W Miratrix “Modeling Item-Level Heterogeneous Treatment Effects With the Explanatory Item Response Model: Leveraging Large-Scale Online Assessments to Pinpoint the Impact of Educational Interventions” In Journal of Educational and Behavioral Statistics SAGE Publications Sage CA: Los Angeles, CA, 2023, pp. 10769986231171710
- [60] Goldine C Gleser, Lee J Cronbach and Nageswari Rajaratnam “Generalizability of scores influenced by multiple sources of variance” In Psychometrika 30.4 Springer, 1965, pp. 395–418
- [61] Xiajing Gong, Meng Hu, Mahashweta Basu and Liang Zhao “Heterogeneous treatment effect analysis based on machine-learning methodology” In CPT: Pharmacometrics & Systems Pharmacology 10.11 Wiley Online Library, 2021, pp. 1433–1443
- [62] Mogens Groenvold et al. “Anxiety and depression in breast cancer patients at low risk of recurrence compared with the general population: a valid comparison?” In Journal of Clinical Epidemiology 52.6 Elsevier, 1999, pp. 523–530
- [63] Yingchi Guo, Jeneesha Dhaliwal and Jason D Rights “Disaggregating level-specific effects in cross-classified multilevel models” In Behavior Research Methods Springer, 2023, pp. 1–35
- [64] Ronald K Hambleton and Hariharan Swaminathan “Item response theory: Principles and applications” Springer Science & Business Media, 2013
- [65] Larry V Hedges “Distribution theory for Glass’s estimator of effect size and related estimators” In journal of Educational Statistics 6.2 Sage Publications Sage CA: Thousand Oaks, CA, 1981, pp. 107–128
- [66] Melissa Hidrobo, Amber Peterman and Lori Heise “The effect of cash, vouchers, and food transfers on intimate partner violence: evidence from a randomized experiment in Northern Ecuador” In American Economic Journal: Applied Economics 8.3 American Economic Association 2014 Broadway, Suite 305, Nashville, TN 37203-2425, 2016, pp. 284–303
- [67] Fredrik Hieronymus, Alexander Lisinski, Staffan Nilsson and Elias Eriksson “Influence of baseline severity on the effects of SSRIs in depression: an item-based, patient-level post-hoc analysis” In The Lancet Psychiatry 6.9 Elsevier, 2019, pp. 745–752
- [68] Paul W Holland “On the sampling theory foundations of item response theory models” In Psychometrika 55 Springer, 1990, pp. 577–601
- [69] Francis L Huang “Analyzing cross-sectionally clustered data using generalized estimating equations” In Journal of Educational and Behavioral Statistics 47.1 SAGE Publications Sage CA: Los Angeles, CA, 2022, pp. 101–125
- [70] Kosuke Imai and Marc Ratkovic “Estimating treatment effect heterogeneity in randomized program evaluation”, 2013
- [71] Kosuke Imai, Luke Keele and Teppei Yamamoto “Identification, inference and sensitivity analysis for causal mediation effects”, 2010
- [72] Guido W Imbens and Donald B Rubin “Causal inference in statistics, social, and biomedical sciences” Cambridge university press, 2015
- [73] Brian Jacob and Steven D Levitt “Catching cheating teachers: The results of an unusual experiment in implementing theory” National Bureau of Economic Research Cambridge, Mass., USA, 2003
- [74] Brian Jacob and Jesse Rothstein “The measurement of student ability in modern assessment systems” In Journal of Economic Perspectives 30.3 American Economic Association 2014 Broadway, Suite 305, Nashville, TN 37203-2418, 2016, pp. 85–108
- [75] Annika Jessen et al. “Improving measurement efficiency of the Inner EAR scale with item response theory” In Otolaryngology–Head and Neck Surgery 158.6 SAGE Publications Sage CA: Los Angeles, CA, 2018, pp. 1093–1100
- [76] David M Kent, Ewout Steyerberg and David Klaveren “Personalized evidence based medicine: predictive approaches to heterogeneous treatment effects” In Bmj 363 British Medical Journal Publishing Group, 2018
- [77] Shersten Killip, Ziyad Mahfoud and Kevin Pearce “What is an intracluster correlation coefficient? Crucial concepts for primary care researchers” In The Annals of Family Medicine 2.3 Annals Family Med, 2004, pp. 204–208
- [78] James Kim, Joshua Gilbert, Qun Yu and Charles Gale “Measures matter: A meta-analysis of the effects of educational apps on preschool to grade 3 children’s literacy and math skills” In Aera Open 7 SAGE Publications Sage CA: Los Angeles, CA, 2021, pp. 23328584211004183
- [79] James S Kim et al. “Improving elementary grade students’ science and social studies vocabulary knowledge depth, reading comprehension, and argumentative writing: A conceptual replication” In Educational Psychology Review 33.4 Springer, 2021, pp. 1935–1964
- [80] James S Kim et al. “A longitudinal randomized trial of a sustained content literacy intervention from first to second grade: Transfer effects on students’ reading comprehension.” In Journal of Educational Psychology 115.1 American Psychological Association, 2023, pp. 73
- [81] James S Kim et al. “Time to transfer: Long-term effects of a sustained and spiraled content literacy intervention in the elementary grades.” In Developmental Psychology American Psychological Association, 2024
- [82] Rex B Kline “Principles and practice of structural equation modeling” Guilford publications, 2023
- [83] Jan Kmenta “Latent variables in econometrics” In Statistica neerlandica 45.2 Wiley Online Library, 1991, pp. 73–84
- [84] Daniel Koretz “Alignment, high stakes, and the inflation of test scores” In Teachers College Record 107.14 SAGE Publications Sage CA: Los Angeles, CA, 2005, pp. 99–118
- [85] Daniel M Koretz “Measuring up” Harvard University Press, 2008
- [86] Megan Kuhfeld and James Soland “Scoring assessments in multisite randomized control trials: Examining the sensitivity of treatment effect estimates to measurement choices.” In Psychological Methods American Psychological Association, 2023
- [87] Sören R Künzel, Jasjeet S Sekhon, Peter J Bickel and Bin Yu “Metalearners for estimating heterogeneous treatment effects using machine learning” In Proceedings of the national academy of sciences 116.10 National Acad Sciences, 2019, pp. 4156–4165
- [88] Kevin Lang “Measurement matters: Perspectives on education policy from an economist and school board member” In Journal of Economic Perspectives 24.3 American Economic Association, 2010, pp. 167–182
- [89] Myoung-Jae Lee “Micro-econometrics for policy, program and treatment effects” OUP Oxford, 2005
- [90] Kenneth L Leonard “Is patient satisfaction sensitive to changes in the quality of care? An exploitation of the Hawthorne effect” In Journal of health economics 27.2 Elsevier, 2008, pp. 444–459
- [91] Steven D Levitt and John A List “Was there really a Hawthorne effect at the Hawthorne plant? An analysis of the original illumination experiments” In American Economic Journal: Applied Economics 3.1 American Economic Association, 2011, pp. 224–238
- [92] Arthur Lewbel “Semiparametric latent variable model estimation with endogenous or mismeasured regressors” In Econometrica JSTOR, 1998, pp. 105–121
- [93] JR Lockwood and Daniel F McCaffrey “Correcting for test score measurement error in ANCOVA models for estimating treatment effects” In Journal of Educational and Behavioral Statistics 39.1 Sage Publications Sage CA: Los Angeles, CA, 2014, pp. 22–52
- [94] Frederic M Lord and Melvin R Novick “Statistical theories of mental test scores” IAP, 1968
- [95] Jing Lu, Chun Wang and Ningzhong Shi “A mixture response time process model for aberrant behaviors and item nonresponses” In Multivariate Behavioral Research 58.1 Taylor & Francis, 2023, pp. 71–89
- [96] Hugh Macartney, Robert McMillan and Uros Petronijevic “Teacher performance and accountability incentives” National Bureau of Economic Research Cambridge, MA, 2018
- [97] Karen Macours, Jessica Williams and Samuel Wolf “Measurement of holistic skills in RCTs: Review and guidelines” In Jameel Poverty Action Lab, 2023
- [98] Daniel McNeish and Melissa Gordon Wolf “Thinking twice about sum scores” In Behavior research methods 52 Springer, 2020, pp. 2287–2305
- [99] Amanda K Montoya and Minjeong Jeon “MIMIC models for uniform and nonuniform DIF as moderated mediation models” In Applied psychological measurement 44.2 SAGE Publications Sage CA: Los Angeles, CA, 2020, pp. 118–136
- [100] Yair Mundlak “On the pooling of time series and cross section data” In Econometrica: journal of the Econometric Society JSTOR, 1978, pp. 69–85
- [101] Richard J Murnane and John B Willett “Methods matter: Improving causal inference in educational and social science research” Oxford University Press, 2010
- [102] Bengt Muthén and Linda Muthén “Mplus” In Handbook of item response theory ChapmanHall/CRC, 2017, pp. 507–518
- [103] Bengt O Muthén “Beyond SEM: General latent variable modeling” In Behaviormetrika 29 Springer, 2002, pp. 81–117
- [104] Alexander Naumann, Jan Hochweber and Johannes Hartig “Modeling instructional sensitivity using a longitudinal multilevel differential item functioning approach” In Journal of Educational Measurement 51.4 Wiley Online Library, 2014, pp. 381–399
- [105] Margarita Olivera-Aguilar and Samuel H Rikoon “Intervention Effect or Measurement Artifact? Using Invariance Models to Reveal Response-Shift Bias in Experimental Studies” In Journal of Research on Educational Effectiveness Taylor & Francis, 2023, pp. 1–29
- [106] Frans J Oort, Mechteld RM Visser and Mirjam AG Sprangers “Formal definitions of measurement bias and explanation bias clarify measurement and conceptual perspectives on response shift” In Journal of clinical epidemiology 62.11 Elsevier, 2009, pp. 1126–1137
- [107] Emily Oster “Unobservable selection and coefficient stability: Theory and evidence” In Journal of Business & Economic Statistics 37.2 Taylor & Francis, 2019, pp. 187–204
- [108] JK Patel “Prediction intervals-a review” In Communications in Statistics-Theory and Methods 18.7 Taylor & Francis, 1989, pp. 2393–2465
- [109] Christina Payne-Tsoupros “No Child Left Behind: Disincentives to focus instruction on students above the passing threshold” In JL & Educ. 39 HeinOnline, 2010, pp. 471
- [110] Yaacov Petscher, Donald L Compton, Laura Steacy and Hannah Kinnon “Past perspectives and new opportunities for the explanatory item response model” In Annals of dyslexia 70 Springer, 2020, pp. 160–179
- [111] Morgan S Polikoff “Instructional sensitivity as a psychometric property of assessments” In Educational Measurement: Issues and Practice 29.4 Wiley Online Library, 2010, pp. 3–14
- [112] Sophia Rabe-Hesketh and Anders Skrondal “Multilevel and longitudinal modeling using Stata” STATA press, 2022
- [113] Frank Rijmen “Formal relations and an empirical comparison among the bi-factor, the testlet, and a second-order multidimensional IRT model” In Journal of Educational Measurement 47.3 Wiley Online Library, 2010, pp. 361–372
- [114] Nicholas J Rockwood and Minjeong Jeon “Estimating complex measurement and growth models using the R package PLmixed” In Multivariate Behavioral Research 54.2 Taylor & Francis, 2019, pp. 288–306
- [115] Mauricio Romero, Justin Sandefur and Wayne Aaron Sandholtz “Outsourcing education: Experimental evidence from Liberia” In American Economic Review 110.2 American Economic Association 2014 Broadway, Suite 305, Nashville, TN 37203, 2020, pp. 364–400
- [116] Paul Rosenbaum “Observation and experiment: An introduction to causal inference” Harvard University Press, 2017
- [117] Donald B Rubin “Causal inference using potential outcomes: Design, modeling, decisions” In Journal of the American Statistical Association 100.469 Taylor & Francis, 2005, pp. 322–331
- [118] Adam Sales, Ethan Prihar, Neil Heffernan and John F Pane “The Effect of an Intelligent Tutor on Performance on Specific Posttest Problems.” In International Educational Data Mining Society ERIC, 2021
- [119] Holger Schielzeth “Simple means to improve the interpretability of regression coefficients” In Methods in Ecology and Evolution 1.2 Wiley Online Library, 2010, pp. 103–113
- [120] Stefan Schneider “Extracting response style bias from measures of positive and negative affect in aging research” In The Journals of Gerontology: Series B 73.1 Oxford University Press US, 2018, pp. 64–74
- [121] Peter Z Schochet, Mike Puma and John Deke “Understanding Variation in Treatment Effects in Education Impact Evaluations: An Overview of Quantitative Methods. NCEE 2014-4017.” In National Center for Education Evaluation and Regional Assistance ERIC, 2014
- [122] Benjamin R Shear and Derek C Briggs “Measurement issues in causal inference” In Asia Pacific Education Review Springer, 2024, pp. 1–13
- [123] K. Sijtsma, J.. Ellis and D. Borsboom “Recognize the value of the sum score, psychometrics’ greatest accomplishment” In Psychometrika, 2024
- [124] Anders Skrondal and Sophia Rabe-Hesketh “Latent variable modelling: A survey” In Scandinavian Journal of Statistics 34.4 Wiley Online Library, 2007, pp. 712–745
- [125] James Soland “Is measurement noninvariance a threat to inferences drawn from randomized control trials? Evidence from empirical and simulation studies” In Applied Psychological Measurement 45.5 Sage Publications Sage CA: Los Angeles, CA, 2021, pp. 346–360
- [126] James Soland “Item Response Theory Models for Difference-in-Difference Estimates (and Whether They Are Worth the Trouble)” In Journal of Research on Educational Effectiveness Taylor & Francis, 2023, pp. 1–31
- [127] James Soland, Megan Kuhfeld and Kelly Edwards “How survey scoring decisions can influence your study’s results: A trip through the IRT looking glass.” In Psychological Methods, 2022
- [128] James Soland, Angela Johnson and Eli Talbert “Regression discontinuity designs in a latent variable framework.” In Psychological Methods 28.3 American Psychological Association, 2023, pp. 691
- [129] Andrea Spoto and Luca Stefanutti “Empirical indistinguishability: From the knowledge structure to the skills” In British Journal of Mathematical and Statistical Psychology 76.2 Wiley Online Library, 2023, pp. 312–326
- [130] Fiona Steele “Module 5: Introduction to multilevel modelling concepts” In LEMMA (Learning Environment for Multilevel Methodology and Applications), Centre for Multilevel Modelling, University of Bristol, 2008
- [131] Lynne Steinberg and David Thissen “Using effect sizes for research reporting: examples using item response theory to analyze differential item functioning.” In Psychological methods 11.4 American Psychological Association, 2006, pp. 402
- [132] Lukas Stoetzer, Xiang Zhou and Marco Steenbergen “Causal Inference with Latent Outcomes” OSF Preprints, 2022
- [133] Tia M Sukin “Item parameter drift as an indication of differential opportunity to learn: An exploration of item flagging methods & accurate classification of examinees” University of Massachusetts Amherst, 2010
- [134] Samuel B Thompson “Simple formulas for standard errors that cluster by both firm and time” In Journal of financial Economics 99.1 Elsevier, 2011, pp. 1–10
- [135] Lu Tian, Ash A Alizadeh, Andrew J Gentles and Robert Tibshirani “A simple method for estimating interactions between a treatment and a large number of covariates” In Journal of the American Statistical Association 109.508 Taylor & Francis, 2014, pp. 1517–1532
- [136] Verena Tiefenbeck “On the magnitude and persistence of the Hawthorne effect—evidence from four field studies” In Proceedings of the 4th European Conference on Behaviour and Energy Efficiency, Coimbra, Portugal, 2016, pp. 8–9
- [137] Elizabeth Tipton “How generalizable is your experiment? An index for comparing experimental samples and populations” In Journal of Educational and Behavioral Statistics 39.6 Sage Publications Sage CA: Los Angeles, CA, 2014, pp. 478–501
- [138] Hester Van Herk, Ype H Poortinga and Theo MM Verhallen “Response styles in rating scales: Evidence of method bias in data from six EU countries” In Journal of Cross-Cultural Psychology 35.3 Sage Publications, 2004, pp. 346–360
- [139] Stefan Wager and Susan Athey “Estimation and inference of heterogeneous treatment effects using random forests” In Journal of the American Statistical Association 113.523 Taylor & Francis, 2018, pp. 1228–1242
- [140] Guanbo Wang, Patrick J. Heagerty and Issa J. Dahabreh “Using Effect Scores to Characterize Heterogeneity of Treatment Effects” In JAMA, 2024 DOI: 10.1001/jama.2024.3376
- [141] Mark Wilson and Paul De Boeck “Descriptive and explanatory item response models” In Explanatory item response models: A generalized linear and nonlinear approach Springer, 2004, pp. 43–74
- [142] Mark Wilson, Paul De Boeck and Claus H Carstensen “Explanatory item response models: A brief introduction” In Assessment of competencies in educational contexts, 2008, pp. 91–120
- [143] Betsy Wolf and Erica Harbatkin “Making sense of effect sizes: Systematic differences in intervention effect sizes by outcome measure type” In Journal of Research on Educational Effectiveness 16.1 Taylor & Francis, 2023, pp. 134–161
- [144] Vivian C Wong “Games Schools Play: How Schools near the Proficiency Threshold Respond to Accountability Pressures under No Child Left Behind.” In Society for Research on Educational Effectiveness ERIC, 2011
- [145] Kathryn Woods-Townsend et al. “A cluster-randomised controlled trial of the LifeLab education intervention to improve health literacy in adolescents” In PLoS One 16.5 Public Library of Science San Francisco, CA USA, 2021, pp. e0250545
- [146] Jeffrey M Wooldridge “Cluster-sample methods in applied econometrics” In American Economic Review 93.2 American Economic Association, 2003, pp. 133–138
- [147] Jeffrey M Wooldridge “Econometric analysis of cross section and panel data” MIT press, 2010
- [148] Jeffrey M Wooldridge “Correlated random effects models with unbalanced panels” In Journal of Econometrics 211.1 Elsevier, 2019, pp. 137–150
- [149] Yu Xie, Jennie E Brand and Ben Jann “Estimating heterogeneous treatment effects with observational data” In Sociological methodology 42.1 Sage Publications Sage CA: Los Angeles, CA, 2012, pp. 314–347
References
- [150] Alberto Abadie, Susan Athey, Guido W Imbens and Jeffrey M Wooldridge “When should you adjust standard errors for clustering?” In The Quarterly Journal of Economics 138.1 Oxford University Press, 2023, pp. 1–35
- [151] Ishita Ahmed et al. “Heterogeneity of item-treatment interactions masks complexity and generalizability in randomized controlled trials” In Edworkingpapers. com, 2023
- [152] Dennis J Aigner, Cheng Hsiao, Arie Kapteyn and Tom Wansbeek “Latent variable models in econometrics” In Handbook of econometrics 2 Elsevier, 1984, pp. 1321–1393
- [153] Ingvild Almås, Orazio Attanasio and Pamela Jervis “Economics and Measurement: New measures to model decision making”, 2023
- [154] Joshua D Angrist and Jörn-Steffen Pischke “Mostly harmless econometrics: An empiricist’s companion” Princeton university press, 2009
- [155] John Antonakis, Nicolas Bastardoz and Mikko Rönkkö “On ignoring the random effects assumption in multilevel models: Review, critique, and recommendations” In Organizational Research Methods 24.2 Sage Publications Sage CA: Los Angeles, CA, 2021, pp. 443–483
- [156] Susan Athey and Guido W Imbens “The econometrics of randomized experiments” In Handbook of economic field experiments 1 Elsevier, 2017, pp. 73–140
- [157] Susan Athey and Guido W Imbens “The state of applied econometrics: Causality and policy evaluation” In Journal of Economic perspectives 31.2 American Economic Association 2014 Broadway, Suite 305, Nashville, TN 37203-2418, 2017, pp. 3–32
- [158] Susan Athey and Guido W Imbens “Machine learning methods that economists should know about” In Annual Review of Economics 11 Annual Reviews, 2019, pp. 685–725
- [159] Orazio Attanasio et al. “Estimating the production function for human capital: results from a randomized controlled trial in Colombia” In American Economic Review 110.1 American Economic Association 2014 Broadway, Suite 305, Nashville, TN 37203, 2020, pp. 48–85
- [160] Dale Ballou “Test scaling and value-added measurement” In Education finance and Policy 4.4 MIT Press One Rogers Street, Cambridge, MA 02142-1209, USA journals-info …, 2009, pp. 351–383
- [161] Badi H Baltagi “The two-way Mundlak estimator” In Econometric Reviews 42.2 Taylor & Francis, 2023, pp. 240–246
- [162] Gadi Barlevy and Derek Neal “Pay for percentile” In American Economic Review 102.5 American Economic Association, 2012, pp. 1805–1831
- [163] Andrew Bell, Malcolm Fairbrother and Kelvyn Jones “Fixed and random effects models: making an informed choice” In Quality & quantity 53 Springer, 2019, pp. 1051–1074
- [164] Peter M Bentler “Simultaneous equation systems as moment structure models: With an introduction to latent variable models” In Journal of Econometrics 22.1-2 Elsevier, 1983, pp. 13–42
- [165] Irina Bergenfeld et al. “Measurement invariance of the Center for Epidemiologic Studies Scale–Depression within and across six diverse intervention trials.” In Psychological Assessment American Psychological Association, 2023
- [166] Christopher Blattman, Julian C Jamison and Margaret Sheridan “Reducing crime and violence: Experimental evidence from cognitive behavioral therapy in Liberia” In American Economic Review 107.4 American Economic Association 2014 Broadway, Suite 305, Nashville, TN 37203, 2017, pp. 1165–1206
- [167] Kenneth A Bollen “Latent variables in psychology and the social sciences” In Annual review of psychology 53.1 Annual Reviews 4139 El Camino Way, PO Box 10139, Palo Alto, CA 94303-0139, USA, 2002, pp. 605–634
- [168] Daniel M Bolt and Timothy R Johnson “Addressing score bias and differential item functioning due to individual differences in response style” In Applied Psychological Measurement 33.5 Sage Publications Sage CA: Los Angeles, CA, 2009, pp. 335–352
- [169] Stéphane Bonhomme, Thibaut Lamadon and Elena Manresa “Discretizing unobserved heterogeneity” In Econometrica 90.2 Wiley Online Library, 2022, pp. 625–643
- [170] Jennifer Booher-Jennings “Below the bubble:“Educational triage” and the Texas accountability system” In American educational research journal 42.2 Sage Publications, 2005, pp. 231–268
- [171] Michael Borenstein “Avoiding common mistakes in meta-analysis: Understanding the distinct roles of Q, I-squared, tau-squared, and the prediction interval in reporting heterogeneity” In Research Synthesis Methods Wiley Online Library, 2023
- [172] Michael Borenstein, Larry V Hedges, Julian PT Higgins and Hannah R Rothstein “Introduction to meta-analysis” John Wiley & Sons, 2009
- [173] Robert L Brennan “Generalizability theory” In Educational Measurement: Issues and Practice 11.4 Wiley Online Library, 1992, pp. 27–34
- [174] Derek C Briggs “Using explanatory item response models to analyze group differences in science achievement” In Applied Measurement in Education 21.2 Taylor & Francis, 2008, pp. 89–118
- [175] Miriam Bruhn et al. “The impact of high school financial education: Evidence from a large-scale evaluation in Brazil” In American Economic Journal: Applied Economics 8.4 American Economic Association 2014 Broadway, Suite 305, Nashville, TN 37203-2425, 2016, pp. 256–295
- [176] Okan Bulut, Guher Gorgun and Seyma Nur Yildirim-Erbasli “Estimating explanatory extensions of dichotomous and polytomous Rasch models: The eirm package in R” In Psych 3.3 MDPI, 2021, pp. 308–321
- [177] Paul-Christian Bürkner “Bayesian Item Response Modeling in R with brms and Stan” In Journal of Statistical Software 100.5, 2021, pp. 1–54 DOI: 10.18637/jss.v100.i05
- [178] Katherine E Castellano and Andrew D Ho “Practical differences among aggregate-level conditional status metrics: From median student growth percentiles to value-added models” In Journal of Educational and Behavioral Statistics 40.1 SAGE Publications Sage CA: Los Angeles, CA, 2015, pp. 35–68
- [179] Victor Chernozhukov et al. “Double/debiased machine learning for treatment and structural parameters” Oxford University Press Oxford, UK, 2018
- [180] What Works Clearinghouse “What Works Clearinghouse procedures and standards handbook, version 5.0”, 2022
- [181] Amy L Cochran, Paul J Rathouz, Keith E Kocher and Gabriel Zayas-Cabán “A latent variable approach to potential outcomes for emergency department admission decisions” In Statistics in medicine 38.20 Wiley Online Library, 2019, pp. 3911–3935
- [182] David A Cole and Kristopher J Preacher “Manifest variable path analysis: potentially serious and misleading consequences due to uncorrected measurement error.” In Psychological methods 19.2 American Psychological Association, 2014, pp. 300
- [183] Patrick J Curran and Daniel J Bauer “The disaggregation of within-person and between-person effects in longitudinal models of change” In Annual review of psychology 62 Annual Reviews, 2011, pp. 583–619
- [184] Patrick J Curran et al. “Pooling data from multiple longitudinal studies: the role of item response theory in integrative data analysis.” In Developmental psychology 44.2 American Psychological Association, 2008, pp. 365
- [185] Paul De Boeck “Random item IRT models” In Psychometrika 73 Springer, 2008, pp. 533–559
- [186] Paul De Boeck et al. “The estimation of item response models with the lmer function from the lme4 package in R” In Journal of Statistical Software 39, 2011, pp. 1–28
- [187] Andreas Barros, Johanna Fajardo-Gonzalez, Paul Glewwe and Ashwini Sankar “The Limitations of Activity-Based Instruction to Improve the Productivity of Schooling” In The Economic Journal 134.659 Oxford University Press, 2024, pp. 959–984
- [188] Thomas S Dee, Will Dobbie, Brian A Jacob and Jonah Rockoff “The causes and consequences of test score manipulation: Evidence from the New York regents examinations” In American Economic Journal: Applied Economics 11.3 American Economic Association 2014 Broadway, Suite 305, Nashville, TN 37203-2425, 2019, pp. 382–423
- [189] Thomas S Dee and Brian Jacob “The impact of No Child Left Behind on student achievement” In Journal of Policy Analysis and management 30.3 Wiley Online Library, 2011, pp. 418–446
- [190] Thomas S Dee, Brian A Jacob, Jonah E Rockoff and Justin McCrary “Rules and discretion in the evaluation of students and schools: The case of the New York regents examinations” In Columbia Business School Research Paper, 2011
- [191] Richard P DeShon “A cautionary note on measurement error corrections in structural equation models.” In Psychological methods 3.4 American Psychological Association, 1998, pp. 412
- [192] Ben Domingue et al. “The Item Response Warehouse (IRW)” PsyArXiv, 2023
- [193] Ben Domingue et al. “The InterModel Vigorish as a lens for understanding (and quantifying) the value of item response models for dichotomously coded items” PsyArXiv, 2022
- [194] Benjamin W Domingue et al. “Ubiquitous bias and false discovery due to model misspecification in analysis of statistical interactions: The role of the outcome’s distribution and metric properties.” In Psychological Methods, 2022
- [195] Sarah Donegan et al. “Exploring treatment by covariate interactions using subgroup analysis and meta-regression in cochrane reviews: a review of recent practice” In PloS one 10.6 Public Library of Science San Francisco, CA USA, 2015, pp. e0128804
- [196] Sarah Donegan, Paula Williamson, Umberto D’Alessandro and Catrin Tudur Smith “Assessing the consistency assumption by exploring treatment by covariate interactions in mixed treatment comparison meta-analysis: individual patient-level covariates versus aggregate trial-level covariates” In Statistics in medicine 31.29 Wiley Online Library, 2012, pp. 3840–3857
- [197] Annie Duflo, Jessica Kiessel and Adrienne M Lucas “Experimental Evidence on Four Policies to Increase Learning at Scale” In The Economic Journal Oxford University Press, 2024, pp. ueae003
- [198] Jessica K Flake, Jolynn Pek and Eric Hehman “Construct validation in social and personality research: Current practice and recommendations” In Social Psychological and Personality Science 8.4 Sage Publications Sage CA: Los Angeles, CA, 2017, pp. 370–378
- [199] David J Francis et al. “Is the treatment weak or the test insensitive: Interrogating item difficulties to elucidate the nature of reading intervention effects” In Learning and individual differences 97 Elsevier, 2022, pp. 102167
- [200] Nicole B Gabler et al. “Dealing with heterogeneity of treatment effects: is the literature up to the challenge?” In Trials 10 Springer, 2009, pp. 1–12
- [201] Jennifer S Gewandter et al. “Demonstrating heterogeneity of treatment effects among patients: an overlooked but important step toward precision medicine” In Clinical Pharmacology & Therapeutics 106.1 Wiley Online Library, 2019, pp. 204–210
- [202] Joshua B Gilbert “Estimating treatment effects with the explanatory item response model” In Journal of Research on Educational Effectiveness Taylor & Francis, 2023, pp. 1–19
- [203] Joshua B Gilbert “Modeling item-level heterogeneous treatment effects: A tutorial with the glmer function from the lme4 package in R” In Behavior Research Methods Springer, 2023, pp. 1–13
- [204] Joshua B Gilbert “How measurement affects causal inference: Attenuation bias is (usually) more important than scoring weights” In Edworkingpapers. com, 2024
- [205] Joshua B Gilbert, Fredrik Hieronymus, Elias Eriksson and Benjamin W Domingue “Item-Level Heterogeneous Treatment Effects of Selective Serotonin Reuptake Inhibitors (SSRIs) on Depression: Implications for Inference, Generalizability, and Identification” In arXiv preprint arXiv:2402.04487, 2024
- [206] Joshua B Gilbert, James S Kim and Luke W Miratrix “Modeling Item-Level Heterogeneous Treatment Effects With the Explanatory Item Response Model: Leveraging Large-Scale Online Assessments to Pinpoint the Impact of Educational Interventions” In Journal of Educational and Behavioral Statistics SAGE Publications Sage CA: Los Angeles, CA, 2023, pp. 10769986231171710
- [207] Joshua B Gilbert, James S Kim and Luke W Miratrix “Leveraging Item Parameter Drift to Assess Transfer Effects in Vocabulary Learning” In Applied Measurement in Education Taylor & Francis, 2024
- [208] Joshua B Gilbert, Luke W Miratrix, Mridul Joshi and Benjamin W Domingue “Disentangling Person-Dependent and Item-Dependent Causal Effects: Applications of Item Response Theory to the Estimation of Treatment Effect Heterogeneity” In Journal of Educational and Behavioral Statistics, 2024
- [209] Goldine C Gleser, Lee J Cronbach and Nageswari Rajaratnam “Generalizability of scores influenced by multiple sources of variance” In Psychometrika 30.4 Springer, 1965, pp. 395–418
- [210] Xiajing Gong, Meng Hu, Mahashweta Basu and Liang Zhao “Heterogeneous treatment effect analysis based on machine-learning methodology” In CPT: Pharmacometrics & Systems Pharmacology 10.11 Wiley Online Library, 2021, pp. 1433–1443
- [211] Mogens Groenvold et al. “Anxiety and depression in breast cancer patients at low risk of recurrence compared with the general population: a valid comparison?” In Journal of Clinical Epidemiology 52.6 Elsevier, 1999, pp. 523–530
- [212] Yingchi Guo, Jeneesha Dhaliwal and Jason D Rights “Disaggregating level-specific effects in cross-classified multilevel models” In Behavior Research Methods Springer, 2023, pp. 1–35
- [213] Ronald K Hambleton and Hariharan Swaminathan “Item response theory: Principles and applications” Springer Science & Business Media, 2013
- [214] Larry V Hedges “Distribution theory for Glass’s estimator of effect size and related estimators” In journal of Educational Statistics 6.2 Sage Publications Sage CA: Thousand Oaks, CA, 1981, pp. 107–128
- [215] Melissa Hidrobo, Amber Peterman and Lori Heise “The effect of cash, vouchers, and food transfers on intimate partner violence: evidence from a randomized experiment in Northern Ecuador” In American Economic Journal: Applied Economics 8.3 American Economic Association 2014 Broadway, Suite 305, Nashville, TN 37203-2425, 2016, pp. 284–303
- [216] Fredrik Hieronymus, Alexander Lisinski, Staffan Nilsson and Elias Eriksson “Influence of baseline severity on the effects of SSRIs in depression: an item-based, patient-level post-hoc analysis” In The Lancet Psychiatry 6.9 Elsevier, 2019, pp. 745–752
- [217] Paul W Holland “On the sampling theory foundations of item response theory models” In Psychometrika 55 Springer, 1990, pp. 577–601
- [218] Francis L Huang “Analyzing cross-sectionally clustered data using generalized estimating equations” In Journal of Educational and Behavioral Statistics 47.1 SAGE Publications Sage CA: Los Angeles, CA, 2022, pp. 101–125
- [219] Kosuke Imai, Luke Keele and Teppei Yamamoto “Identification, inference and sensitivity analysis for causal mediation effects”, 2010
- [220] Kosuke Imai and Marc Ratkovic “Estimating treatment effect heterogeneity in randomized program evaluation”, 2013
- [221] Guido W Imbens and Donald B Rubin “Causal inference in statistics, social, and biomedical sciences” Cambridge university press, 2015
- [222] Brian Jacob and Steven D Levitt “Catching cheating teachers: The results of an unusual experiment in implementing theory” National Bureau of Economic Research Cambridge, Mass., USA, 2003
- [223] Brian Jacob and Jesse Rothstein “The measurement of student ability in modern assessment systems” In Journal of Economic Perspectives 30.3 American Economic Association 2014 Broadway, Suite 305, Nashville, TN 37203-2418, 2016, pp. 85–108
- [224] Annika Jessen et al. “Improving measurement efficiency of the Inner EAR scale with item response theory” In Otolaryngology–Head and Neck Surgery 158.6 SAGE Publications Sage CA: Los Angeles, CA, 2018, pp. 1093–1100
- [225] David M Kent, Ewout Steyerberg and David Klaveren “Personalized evidence based medicine: predictive approaches to heterogeneous treatment effects” In Bmj 363 British Medical Journal Publishing Group, 2018
- [226] Shersten Killip, Ziyad Mahfoud and Kevin Pearce “What is an intracluster correlation coefficient? Crucial concepts for primary care researchers” In The Annals of Family Medicine 2.3 Annals Family Med, 2004, pp. 204–208
- [227] James Kim, Joshua Gilbert, Qun Yu and Charles Gale “Measures matter: A meta-analysis of the effects of educational apps on preschool to grade 3 children’s literacy and math skills” In Aera Open 7 SAGE Publications Sage CA: Los Angeles, CA, 2021, pp. 23328584211004183
- [228] James S Kim et al. “A longitudinal randomized trial of a sustained content literacy intervention from first to second grade: Transfer effects on students’ reading comprehension.” In Journal of Educational Psychology 115.1 American Psychological Association, 2023, pp. 73
- [229] James S Kim et al. “Time to transfer: Long-term effects of a sustained and spiraled content literacy intervention in the elementary grades.” In Developmental Psychology American Psychological Association, 2024
- [230] James S Kim et al. “Improving elementary grade students’ science and social studies vocabulary knowledge depth, reading comprehension, and argumentative writing: A conceptual replication” In Educational Psychology Review 33.4 Springer, 2021, pp. 1935–1964
- [231] Rex B Kline “Principles and practice of structural equation modeling” Guilford publications, 2023
- [232] Jan Kmenta “Latent variables in econometrics” In Statistica neerlandica 45.2 Wiley Online Library, 1991, pp. 73–84
- [233] Daniel Koretz “Alignment, high stakes, and the inflation of test scores” In Teachers College Record 107.14 SAGE Publications Sage CA: Los Angeles, CA, 2005, pp. 99–118
- [234] Daniel M Koretz “Measuring up” Harvard University Press, 2008
- [235] Megan Kuhfeld and James Soland “Scoring assessments in multisite randomized control trials: Examining the sensitivity of treatment effect estimates to measurement choices.” In Psychological Methods American Psychological Association, 2023
- [236] Sören R Künzel, Jasjeet S Sekhon, Peter J Bickel and Bin Yu “Metalearners for estimating heterogeneous treatment effects using machine learning” In Proceedings of the national academy of sciences 116.10 National Acad Sciences, 2019, pp. 4156–4165
- [237] Kevin Lang “Measurement matters: Perspectives on education policy from an economist and school board member” In Journal of Economic Perspectives 24.3 American Economic Association, 2010, pp. 167–182
- [238] Myoung-Jae Lee “Micro-econometrics for policy, program and treatment effects” OUP Oxford, 2005
- [239] Kenneth L Leonard “Is patient satisfaction sensitive to changes in the quality of care? An exploitation of the Hawthorne effect” In Journal of health economics 27.2 Elsevier, 2008, pp. 444–459
- [240] Steven D Levitt and John A List “Was there really a Hawthorne effect at the Hawthorne plant? An analysis of the original illumination experiments” In American Economic Journal: Applied Economics 3.1 American Economic Association, 2011, pp. 224–238
- [241] Arthur Lewbel “Semiparametric latent variable model estimation with endogenous or mismeasured regressors” In Econometrica JSTOR, 1998, pp. 105–121
- [242] JR Lockwood and Daniel F McCaffrey “Correcting for test score measurement error in ANCOVA models for estimating treatment effects” In Journal of Educational and Behavioral Statistics 39.1 Sage Publications Sage CA: Los Angeles, CA, 2014, pp. 22–52
- [243] Frederic M Lord and Melvin R Novick “Statistical theories of mental test scores” IAP, 1968
- [244] Jing Lu, Chun Wang and Ningzhong Shi “A mixture response time process model for aberrant behaviors and item nonresponses” In Multivariate Behavioral Research 58.1 Taylor & Francis, 2023, pp. 71–89
- [245] Hugh Macartney, Robert McMillan and Uros Petronijevic “Teacher performance and accountability incentives” National Bureau of Economic Research Cambridge, MA, 2018
- [246] Karen Macours, Jessica Williams and Samuel Wolf “Measurement of holistic skills in RCTs: Review and guidelines” In Jameel Poverty Action Lab, 2023
- [247] Daniel McNeish and Melissa Gordon Wolf “Thinking twice about sum scores” In Behavior research methods 52 Springer, 2020, pp. 2287–2305
- [248] Amanda K Montoya and Minjeong Jeon “MIMIC models for uniform and nonuniform DIF as moderated mediation models” In Applied psychological measurement 44.2 SAGE Publications Sage CA: Los Angeles, CA, 2020, pp. 118–136
- [249] Yair Mundlak “On the pooling of time series and cross section data” In Econometrica: journal of the Econometric Society JSTOR, 1978, pp. 69–85
- [250] Richard J Murnane and John B Willett “Methods matter: Improving causal inference in educational and social science research” Oxford University Press, 2010
- [251] Bengt Muthén and Linda Muthén “Mplus” In Handbook of item response theory ChapmanHall/CRC, 2017, pp. 507–518
- [252] Bengt O Muthén “Beyond SEM: General latent variable modeling” In Behaviormetrika 29 Springer, 2002, pp. 81–117
- [253] Alexander Naumann, Jan Hochweber and Johannes Hartig “Modeling instructional sensitivity using a longitudinal multilevel differential item functioning approach” In Journal of Educational Measurement 51.4 Wiley Online Library, 2014, pp. 381–399
- [254] Margarita Olivera-Aguilar and Samuel H Rikoon “Intervention Effect or Measurement Artifact? Using Invariance Models to Reveal Response-Shift Bias in Experimental Studies” In Journal of Research on Educational Effectiveness Taylor & Francis, 2023, pp. 1–29
- [255] Frans J Oort, Mechteld RM Visser and Mirjam AG Sprangers “Formal definitions of measurement bias and explanation bias clarify measurement and conceptual perspectives on response shift” In Journal of clinical epidemiology 62.11 Elsevier, 2009, pp. 1126–1137
- [256] Emily Oster “Unobservable selection and coefficient stability: Theory and evidence” In Journal of Business & Economic Statistics 37.2 Taylor & Francis, 2019, pp. 187–204
- [257] JK Patel “Prediction intervals-a review” In Communications in Statistics-Theory and Methods 18.7 Taylor & Francis, 1989, pp. 2393–2465
- [258] Christina Payne-Tsoupros “No Child Left Behind: Disincentives to focus instruction on students above the passing threshold” In JL & Educ. 39 HeinOnline, 2010, pp. 471
- [259] Yaacov Petscher, Donald L Compton, Laura Steacy and Hannah Kinnon “Past perspectives and new opportunities for the explanatory item response model” In Annals of dyslexia 70 Springer, 2020, pp. 160–179
- [260] Morgan S Polikoff “Instructional sensitivity as a psychometric property of assessments” In Educational Measurement: Issues and Practice 29.4 Wiley Online Library, 2010, pp. 3–14
- [261] Sophia Rabe-Hesketh and Anders Skrondal “Multilevel and longitudinal modeling using Stata” STATA press, 2022
- [262] Frank Rijmen “Formal relations and an empirical comparison among the bi-factor, the testlet, and a second-order multidimensional IRT model” In Journal of Educational Measurement 47.3 Wiley Online Library, 2010, pp. 361–372
- [263] Nicholas J Rockwood and Minjeong Jeon “Estimating complex measurement and growth models using the R package PLmixed” In Multivariate Behavioral Research 54.2 Taylor & Francis, 2019, pp. 288–306
- [264] Mauricio Romero, Justin Sandefur and Wayne Aaron Sandholtz “Outsourcing education: Experimental evidence from Liberia” In American Economic Review 110.2 American Economic Association 2014 Broadway, Suite 305, Nashville, TN 37203, 2020, pp. 364–400
- [265] Paul Rosenbaum “Observation and experiment: An introduction to causal inference” Harvard University Press, 2017
- [266] Donald B Rubin “Causal inference using potential outcomes: Design, modeling, decisions” In Journal of the American Statistical Association 100.469 Taylor & Francis, 2005, pp. 322–331
- [267] Adam Sales, Ethan Prihar, Neil Heffernan and John F Pane “The Effect of an Intelligent Tutor on Performance on Specific Posttest Problems.” In International Educational Data Mining Society ERIC, 2021
- [268] Holger Schielzeth “Simple means to improve the interpretability of regression coefficients” In Methods in Ecology and Evolution 1.2 Wiley Online Library, 2010, pp. 103–113
- [269] Stefan Schneider “Extracting response style bias from measures of positive and negative affect in aging research” In The Journals of Gerontology: Series B 73.1 Oxford University Press US, 2018, pp. 64–74
- [270] Peter Z Schochet, Mike Puma and John Deke “Understanding Variation in Treatment Effects in Education Impact Evaluations: An Overview of Quantitative Methods. NCEE 2014-4017.” In National Center for Education Evaluation and Regional Assistance ERIC, 2014
- [271] Benjamin R Shear and Derek C Briggs “Measurement issues in causal inference” In Asia Pacific Education Review Springer, 2024, pp. 1–13
- [272] K. Sijtsma, J.. Ellis and D. Borsboom “Recognize the value of the sum score, psychometrics’ greatest accomplishment” In Psychometrika, 2024
- [273] Anders Skrondal and Sophia Rabe-Hesketh “Latent variable modelling: A survey” In Scandinavian Journal of Statistics 34.4 Wiley Online Library, 2007, pp. 712–745
- [274] James Soland “Is measurement noninvariance a threat to inferences drawn from randomized control trials? Evidence from empirical and simulation studies” In Applied Psychological Measurement 45.5 Sage Publications Sage CA: Los Angeles, CA, 2021, pp. 346–360
- [275] James Soland “Item Response Theory Models for Difference-in-Difference Estimates (and Whether They Are Worth the Trouble)” In Journal of Research on Educational Effectiveness Taylor & Francis, 2023, pp. 1–31
- [276] James Soland, Angela Johnson and Eli Talbert “Regression discontinuity designs in a latent variable framework.” In Psychological Methods 28.3 American Psychological Association, 2023, pp. 691
- [277] James Soland, Megan Kuhfeld and Kelly Edwards “How survey scoring decisions can influence your study’s results: A trip through the IRT looking glass.” In Psychological Methods, 2022
- [278] Andrea Spoto and Luca Stefanutti “Empirical indistinguishability: From the knowledge structure to the skills” In British Journal of Mathematical and Statistical Psychology 76.2 Wiley Online Library, 2023, pp. 312–326
- [279] Fiona Steele “Module 5: Introduction to multilevel modelling concepts” In LEMMA (Learning Environment for Multilevel Methodology and Applications), Centre for Multilevel Modelling, University of Bristol, 2008
- [280] Lynne Steinberg and David Thissen “Using effect sizes for research reporting: examples using item response theory to analyze differential item functioning.” In Psychological methods 11.4 American Psychological Association, 2006, pp. 402
- [281] Lukas Stoetzer, Xiang Zhou and Marco Steenbergen “Causal Inference with Latent Outcomes” OSF Preprints, 2022
- [282] Tia M Sukin “Item parameter drift as an indication of differential opportunity to learn: An exploration of item flagging methods & accurate classification of examinees” University of Massachusetts Amherst, 2010
- [283] Samuel B Thompson “Simple formulas for standard errors that cluster by both firm and time” In Journal of financial Economics 99.1 Elsevier, 2011, pp. 1–10
- [284] Lu Tian, Ash A Alizadeh, Andrew J Gentles and Robert Tibshirani “A simple method for estimating interactions between a treatment and a large number of covariates” In Journal of the American Statistical Association 109.508 Taylor & Francis, 2014, pp. 1517–1532
- [285] Verena Tiefenbeck “On the magnitude and persistence of the Hawthorne effect—evidence from four field studies” In Proceedings of the 4th European Conference on Behaviour and Energy Efficiency, Coimbra, Portugal, 2016, pp. 8–9
- [286] Elizabeth Tipton “How generalizable is your experiment? An index for comparing experimental samples and populations” In Journal of Educational and Behavioral Statistics 39.6 Sage Publications Sage CA: Los Angeles, CA, 2014, pp. 478–501
- [287] Hester Van Herk, Ype H Poortinga and Theo MM Verhallen “Response styles in rating scales: Evidence of method bias in data from six EU countries” In Journal of Cross-Cultural Psychology 35.3 Sage Publications, 2004, pp. 346–360
- [288] Stefan Wager and Susan Athey “Estimation and inference of heterogeneous treatment effects using random forests” In Journal of the American Statistical Association 113.523 Taylor & Francis, 2018, pp. 1228–1242
- [289] Guanbo Wang, Patrick J. Heagerty and Issa J. Dahabreh “Using Effect Scores to Characterize Heterogeneity of Treatment Effects” In JAMA, 2024 DOI: 10.1001/jama.2024.3376
- [290] Mark Wilson and Paul De Boeck “Descriptive and explanatory item response models” In Explanatory item response models: A generalized linear and nonlinear approach Springer, 2004, pp. 43–74
- [291] Mark Wilson, Paul De Boeck and Claus H Carstensen “Explanatory item response models: A brief introduction” In Assessment of competencies in educational contexts, 2008, pp. 91–120
- [292] Betsy Wolf and Erica Harbatkin “Making sense of effect sizes: Systematic differences in intervention effect sizes by outcome measure type” In Journal of Research on Educational Effectiveness 16.1 Taylor & Francis, 2023, pp. 134–161
- [293] Vivian C Wong “Games Schools Play: How Schools near the Proficiency Threshold Respond to Accountability Pressures under No Child Left Behind.” In Society for Research on Educational Effectiveness ERIC, 2011
- [294] Kathryn Woods-Townsend et al. “A cluster-randomised controlled trial of the LifeLab education intervention to improve health literacy in adolescents” In PLoS One 16.5 Public Library of Science San Francisco, CA USA, 2021, pp. e0250545
- [295] Jeffrey M Wooldridge “Cluster-sample methods in applied econometrics” In American Economic Review 93.2 American Economic Association, 2003, pp. 133–138
- [296] Jeffrey M Wooldridge “Econometric analysis of cross section and panel data” MIT press, 2010
- [297] Jeffrey M Wooldridge “Correlated random effects models with unbalanced panels” In Journal of Econometrics 211.1 Elsevier, 2019, pp. 137–150
- [298] Yu Xie, Jennie E Brand and Ben Jann “Estimating heterogeneous treatment effects with observational data” In Sociological methodology 42.1 Sage Publications Sage CA: Los Angeles, CA, 2012, pp. 314–347
Appendices
A Algebra for Sensitivity Analysis
Assuming a positive , we can solve for the point at which the treatment effect becomes non-significant:
| (31) | ||||
| (32) | ||||
| (33) | ||||
| (34) | ||||
| (35) | ||||
| (36) | ||||
| (37) |
B Additional Mathematical Detail for the Identification Problem in Section 3.4
We can formalize the intuition provided by Figures 4 and 5 by noting that the flattening of the sum score curves (i.e., the test response functions, or TRFs) with respect to can result from two distinct processes. First, through a direct flattening of the slopes of the individual item curves, as in the interaction case, and second, through an increase in the variance of the item locations in the treatment group that arises from the combination of and . That is, provides the SD of item locations in the control group, and the presence of IL-HTE changes the SD of item locations in the treatment group according to the following formula [279, pp. 29-32], where we define as the SD of item locations in the treatment group:
| (38) |
When , and the identification problem is resolved. Furthermore, because is typically larger than , and is typically less than 1 (relative to , as is the case in our data, as shown in Figure 2), when , the final term drops out and the resulting inflation of is much less severe. For example, consider the simple case where the SD of the item locations in the control group (), the SD of item-specific treatment effects (), and the location-treatment effect correlation () are all 1, so that will be twice as large as (i.e., the treatment doubles the SD of the item locations):
| (39) | ||||
| (40) | ||||
| (41) | ||||
| (42) |
This increase in relative to will attenuate the slope of the sum score curve. We can demonstrate this with the following formula that allows us to convert the slopes of the item curves to the slope of the sum score curve [218, p. 116]:
| (43) |
where is the slope of the sum score curve (on the logit scale) and is the slope of the item curve.
To illustrate, we apply Equation 43 to both the treatment and control groups, continuing with the simple case where and as described above. In the control group, if we assume , then is
| (44) | ||||
| (45) |
and in the treatment group,
| (46) | ||||
| (47) | ||||
| (48) |
Thus, even though the slopes of the item curves in the numerator are identical, the difference in the slopes of the sum scores is , which could easily be misinterpreted as an interaction effect between treatment and the baseline covariate in an analysis of the sum scores.
Similarly, will produce a spurious interaction in the other direction by “shrinking” the scale inward. Assuming ,
| (49) | ||||
| (50) | ||||
| (51) |
Here, the difference in slopes of the sum scores is . Thus, for the person-dependent and item-dependent processes to produce the same pattern of sum scores, the following equality must hold:
| (52) |
In the control group, these quantities will clearly be the same as both and are 0. For a given set of parameters we can choose infinitely many values of and that produce the equivalent pattern in the total score (to a point; can only compress the scale such that the individual item slope is not attenuated, when ). Clearly, therefore, an observed treatment by covariate interaction could result from either a true interaction, or a correlation of item-specific treatment effects and item location.111111Simulations in [208] show that this phenomenon is not an artifact of sum scores. The results apply equally to IRT-based scores and EIRMs that simultaneously estimate the measurement and structural models. We emphasize as the primary cause of the identification problem because, while theoretically a large enough value of could generate the same problem when , is typically less than and less than 1, so that . Furthermore, must be positive, whereas a negative value of can stretch the scale in either direction. As a final point, we note that any bias in interaction terms will necessarily bias main effects in models that omit the interaction, because the main effects are weighted averages of the effects in each subgroup.
C Sample R Code to Fit Various IL-HTE Models
The R code below illustrates how to fit various EIRMs to a data set dat with 0/1 outcome score, 0/1 treatment indicator treat, baseline covariate std_baseline, person identifier s_id, and item identifier item using the glmer function (generalized linear mixed effects models in R). For clarity, we omit data = dataset, family = binomial from each function call. For further resources, see the replication materials in our supplement or the various EIRM R tutorials listed in the references [203, 186].
# R Code
# load library
library(lme4)

# treatment indicator only
glmer(score ~ treat + (1|s_id) + (1|item))

# constant effects model with pretest
glmer(score ~ treat + std_baseline + (1|s_id) + (1|item))

# IL-HTE model
glmer(score ~ treat + std_baseline + (1|s_id) + (treat|item))

# person interaction model
glmer(score ~ treat*std_baseline + (1|s_id) + (1|item))

# flexible model
glmer(score ~ treat*std_baseline + (1|s_id) + (treat|item))
D Directed Acyclic Graph of the IL-HTE Model
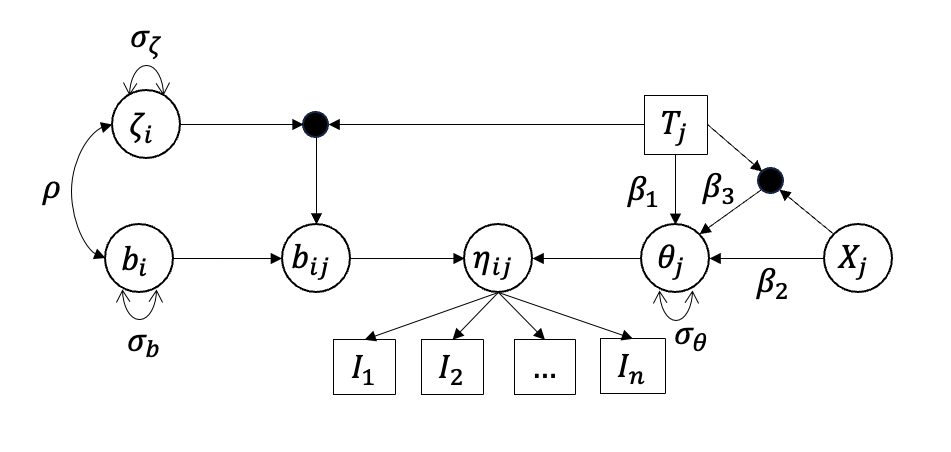
Notes: Squares indicate observed variables, hollow circles indicate latent variables, and solid circles represent cross product interaction terms. are item responses, is the treatment indicator, and is the covariate. represents the average treatment effect. represents the correlation between item location and item-specific treatment effect size. Path coefficients are fixed at 1 unless otherwise indicated. The terms represent residual standard deviations.