Simplot: Enhancing Chart Question Answering by Distilling Essentials
Abstract
Recently, interpreting complex charts with logical reasoning have emerged as challenges due to the development of vision-language models. A prior state-of-the-art (SOTA) model, Deplot, has presented an end-to-end method that leverages the vision-language model to convert charts into table format utilizing Large Language Models (LLMs) for reasoning. However, unlike natural images, charts contain a mix of essential and irrelevant information required for chart reasoning, and we discover that this characteristic can lower the performance of chart-to-table extraction. In this paper, we introduce Simplot, a method designed to extract only the elements necessary for chart reasoning. The proposed method involves two steps: 1) training to mimic a simple plot that contains only the essential information from a complex chart for table extraction, followed by 2) performing reasoning based on the table. Our model enables accurate chart reasoning without the need for additional annotations or datasets, and its effectiveness is demonstrated through various experiments. Furthermore, we propose a novel prompt addressing the shortcoming of recent SOTA model, ignoring visual attributes such as color. Our source code is available at https://github.com/sangwu99/Simplot.
Simplot: Enhancing Chart Question Answering by Distilling Essentials
Wonjoong Kim1††thanks: These authors contributed equally., Sangwu Park211footnotemark: 1, Yeonjun In1, Seokwon Han1, Chanyoung Park1††thanks: Corresponding author. 1KAIST 2Chung-Ang University {wjkim, yeonjun.in, dulwich10, cy.park}@kaist.ac.kr sangwu99@cau.ac.kr
1 Introduction
The rapid advancements in vision-language models have accelerated a wave of research into models capable of handling data that integrates both images and text (Zhang et al., 2021; Zhou et al., 2020; Kim et al., 2023, 2024), thus undertaking a variety of tasks. Among these tasks, the interest in models capable of advanced reasoning, including question answering, has significantly increased. This increasing field has seen considerable success in addressing visual question answering (VQA) tasks targeted at natural images, marking a trend towards models that can engage in complex reasoning based on images (Antol et al., 2015; Shao et al., 2023; Gardères et al., 2020). Despite these advancements, the domain of mathematical multimodal reasoning such as interpreting charts remains relatively unexplored. Mathematical reasoning in question answering poses unique challenges, as models proficient in natural images struggle with specific types, such as charts. Charts, with their unique formats and the need for logical interpretation, necessitate a different approach to learning compared to conventional VQA models targeting natural images.
Prior chart reasoning methodologies mainly rely on heuristic rule-based systems, and thus they are not only limited to pre-defined chart formats but also struggle with novel chart types without additional rule formulation (Luo et al., 2021). Moreover, the performance of models utilizing OCR or key-point detection modules are highly dependent on the performance of these modules, and also face significant annotation costs and are typically unable to perform end-to-end reasoning (Methani et al., 2020; Poco and Heer, 2017). In response to these limitations, recent approaches have adopted vision-language models trained in an end-to-end manner without heuristic rules (Cheng et al., 2023; Liu et al., 2022b), which, however, require fine-tuning for each specific downstream task, limiting their flexibility.
A novel approach, called Deplot (Liu et al., 2022a), that combines vision-language models with Large Language Models (LLMs) has emerged as an approach to address these issues. Deplot first transforms charts into tables (i.e., chart-to-table extraction), and then employs the extracted tables along with the LLMs for reasoning. This approach not only aims to solve the inherent problems of previous methodologies, but also leverages the capability of the LLMs to enhance performance in chart question answering. Converting charts into tables before reasoning offers several advantages, including improved interpretability and the ability to achieve high performance in table reasoning, thus facilitates more accurate and delicate reasoning compared to a direct image-based question answering.
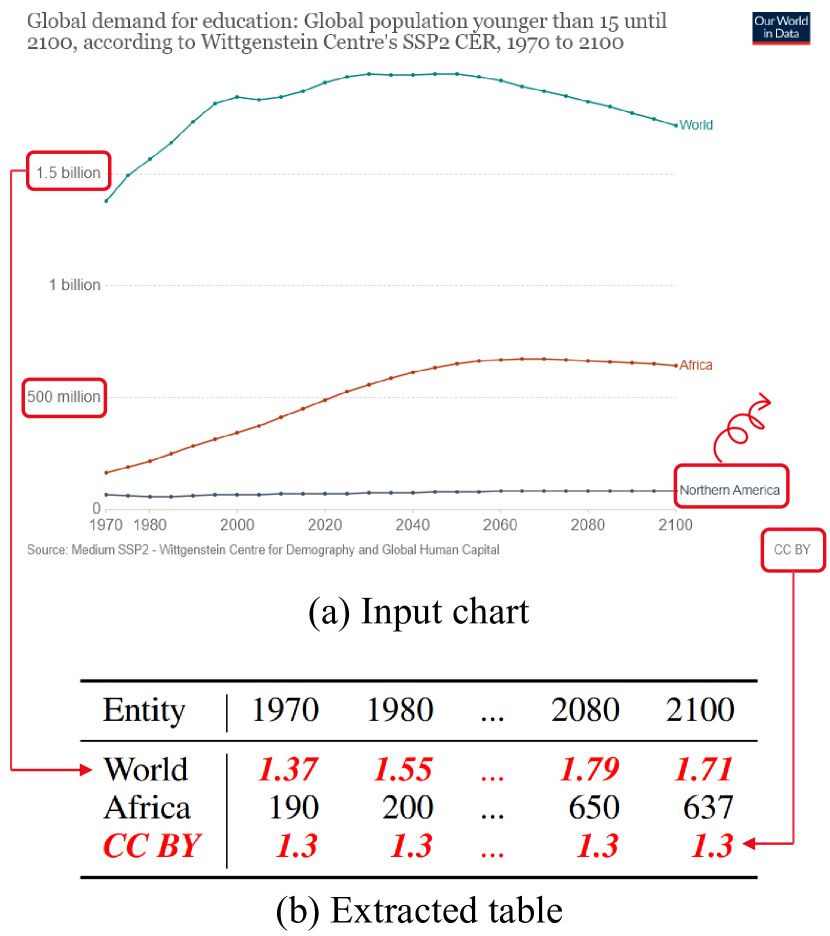
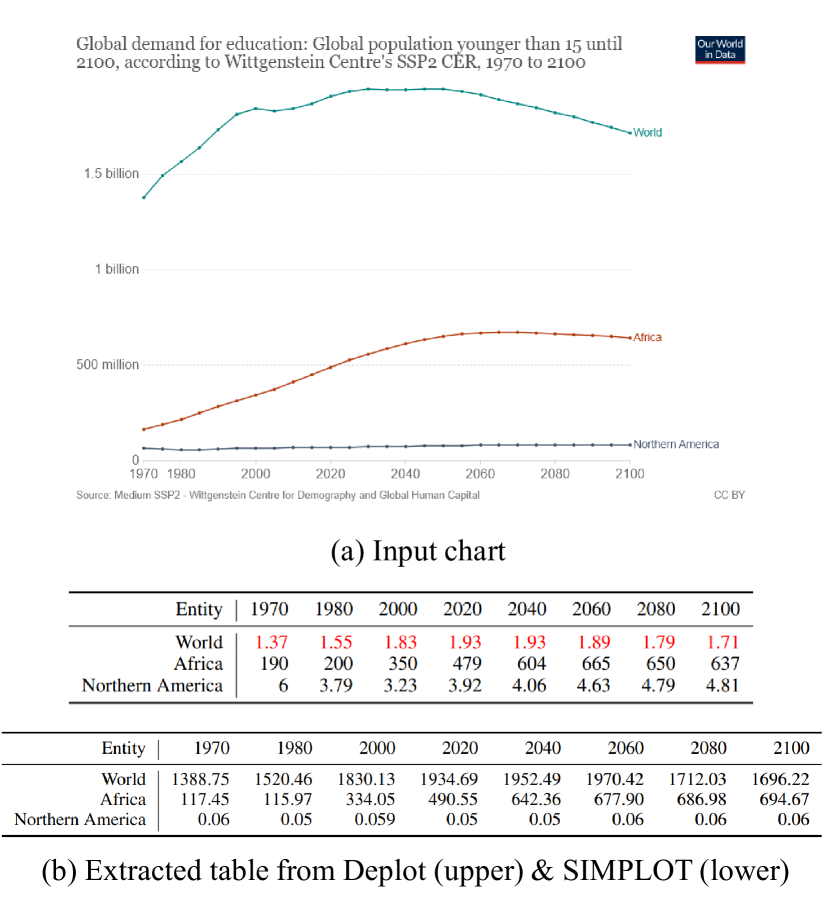
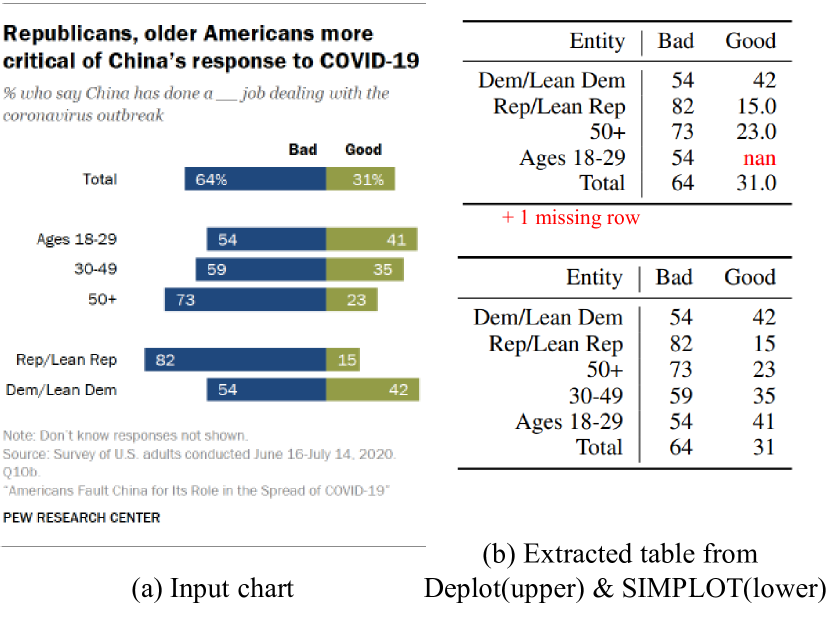
Despite the effectiveness of Deplot (Liu et al., 2022a), there exist two limitations that still need to be addressed. First, we discovered that Deplot struggles to fully utilize the textual context within the image containing the chart for chart-to-table extraction (See Fig. 1). For example, the counting unit (e.g., “million” or “billion”) is overlooked when converting a chart (Fig. 1(a)) into a table (Fig. 1(b)). Moreover, irrelevant information (e.g., “CC BY”) is extracted as an entity in the table, while relevant information (e.g., “Northern America”) is overlooked. However, as real-world charts often contain information that might not be helpful for chart reasoning (e.g., source credit and “CC BY”), it is crucial for the model to be able to differentiate between relevant and irrelevant information. Owing to these challenges, Deplot is prone to extracting inaccurate values, leading to failure to effectively interpret the information of the chart.
The second limitation of Deplot is that it solely relies on tables to solve chart reasoning tasks, while overlooking the visual information associated with the tables. For this reason, Deplot fails to answer questions regarding color or position (e.g., "What is the value of the third bar from the top?", "What year does the orange line represent?"), indicating a significant shortfall in the model’s capability to interpret visual data.
To address these two limitations of Deplot, we propose a simple yet effective method, named Simplot. The main idea is to pre-extract the textual information within an image containing a chart to provide a guideline for the model regarding the columns and rows of the table it needs to construct. More precisely, we divide the training process of Simplot into two phases. In Phase 1, we first convert the original chart, which often contains irrelevant information regarding the chart reasoning task, into a simple chart containing only the essential information for chart reasoning. Then, we train a teacher model to generate a table given the simple chart as input. During Phase 2, the student encoder is trained to ensure that the representation of an original chart image closely matches the representation of its corresponding simplified chart. This capability enables the student encoder to encode any original chart into the representation space of simplified chart images, thereby improving the accuracy of table generation. Furthermore, we leverage a Large Multimodal Model (LMM) to utilize the visual attributes of a chart such as colors and positions, and present a novel prompt for specifically designed for chart reasoning.
Our contributions are summarized as follows:
-
1.
We provide guidelines for utilizing textual information within images for reasoning that was previously overlooked.
-
2.
Simplot extracts only essential information from complex charts, preventing irrelevant information from entering the model, resulting in detailed reasoning .
-
3.
We present a prompt specifically designed for chart reasoning. Through this prompt, the LMM performs more accurate reasoning by mimicking how humans interpret charts.
-
4.
Various experiments and case studies validate that Simplot successfully addresses the two limitations of Deplot, showcasing significant improvements in both chart interpretation and reasoning capabilities.
2 Proposed Method: Simplot
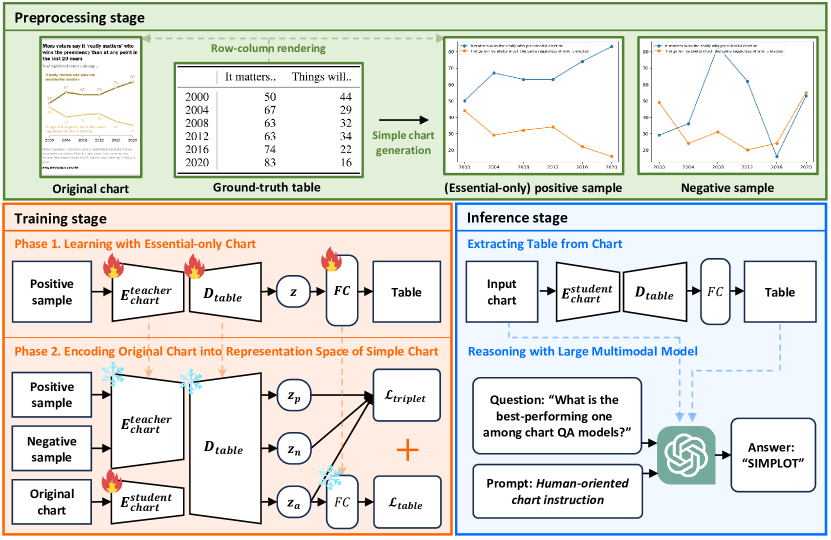
In this section, we describe our proposed method, Simplot, in detail. Fig 2 presents the overall framework of Simplot, where Simplot eventually performs reasoning with an LMM given the table extracted from a chart (Inference stage). In this work, we focus on chart-to-table extraction (Training stage) as a high-quality table enables precise reasoning with a powerful LMM. It is important to note that Simplot can be combined with diverse LMM variants, and various techniques such as Chain-of-Thought (CoT) (Wei et al., 2022) can further improve the accuracy of the chart reasoning.
2.1 Preprocessing Stage
Before the training stage, we conduct two preprocessing steps, i.e., 1) Simple Chart Generation, and 2) Row-Column Rendering. Note that as these steps can be readily done offline, they don’t increase the training time.
1) Simple Chart Generation. We generate a simple chart by excluding irrelevant information from the original, keeping only essential elements for reasoning. Specifically, since each of the original charts in the dataset is annotated with a table in the CSV format, we use a Python library (i.e., Matplotlib) to plot a chart based on the table. The chart generated in this manner is considered as a simplified version of the original chart, i.e., simple chart. This process requires no separate training or additional costs, and it can be executed offline by running a simple code snippet.
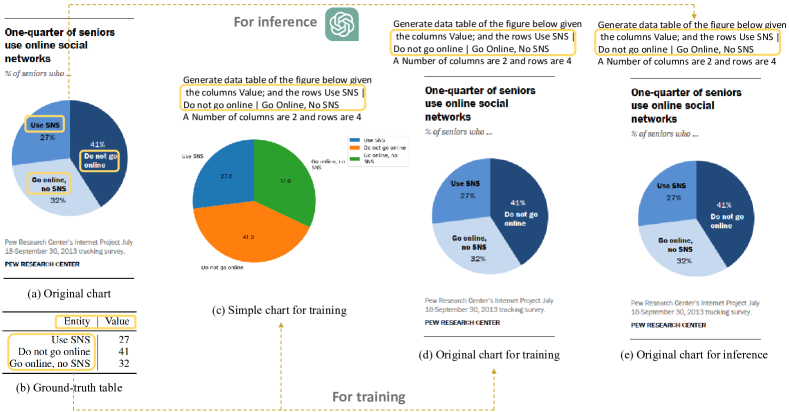
2) Row-Column Rendering. Inspired by rendering questions over images used for QA (Lee et al., 2023), we aim to improve the table extraction accuracy by rendering information about the rows and columns that should be included in the table onto the image, enabling the model to utilize this information to extract more accurate tables when converting charts to tables. Note that in the training stage, since we are given the ground-truth chart-table pairs, we simply render rows and columns of each table onto its paired image containing the chart. However, it would be not feasible in the inference stage, since we would be only given the charts without tables. Instead, in the inference stage, we utilize a LMM to extract rows and columns from the chart and render them onto the image. Despite the relative low performance of LMMs such as GPT-4 (Achiam et al., 2023) in reasoning about charts, we found they can accurately extract row and column information from charts, since such information is given as text and structured in a relatively simple manner. Detailed description of the process is presented in Appendix A.
2.2 Training Stage: Chart-to-Table Extraction
Our proposed chart-to-table extraction approach consists of two phases: Phase 1) Training a teacher encoder and a table decoder by performing the chart-to-table extraction given simple charts containing only the essential information for reasoning, rather than complex original charts; Phase 2) Training a student encoder via contrastive learning by extracting the table given the original chart, while being distilled the knowledge to embed original charts to the embedding space of simple charts.
2.2.1 Phase 1: Learning with Essential Part from Simple Chart
Our model learns the process of extracting tables from previously generated simple charts. Specifically, we use Deplot Liu et al. (2022a) as our backbone model, which is our baseline model that consists of an image encoder and a text decoder, and fine-tune it on the generated simple chart-table pairs. This facilitates the image encoder to obtain representations containing only essential information within the chart, while the text decoder converts this representation into a table format. In this paper, we name the encoder and decoder as chart encoder and table decoder , respectively.
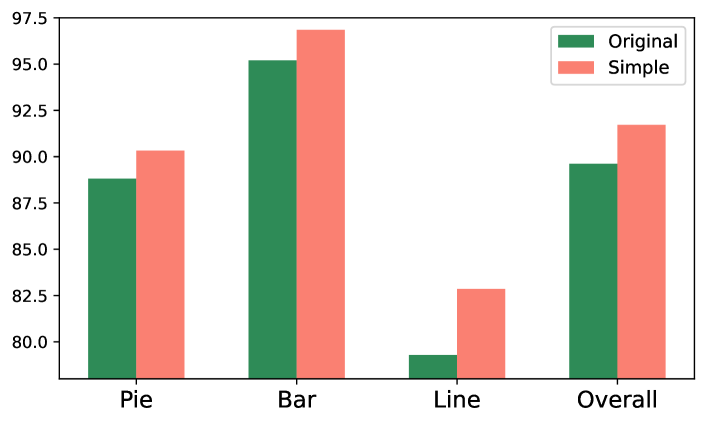
To support our model design that focuses on the essential parts when learning from charts, in Fig. 3, we compare the chart-to-table extraction performance of using two types of data for both training and inference, i.e., 1) original chart (in green), and 2) simple chart containing essential information only (in red). We observe that using simple charts for chart-to-table extraction greatly outperforms the case when original charts are used. The chart encoder trained here serves as the teacher encoder , providing guidelines for the representation that the student encoder should learn in the subsequent learning process to be described in Sec. 2.2.2. Following Deplot, we adopt ViT (Dosovitskiy et al., 2020) as the chart encoders. Note that the trained table decoder and a fully connected layer () remain frozen without further training in the next stage to generate tables.
2.2.2 Phase 2: Encoding Original Chart into Representation Space of Simple Chart
As shown in Fig. 2, after training the teacher encoder with simple charts as inputs, our goal is to train the student encoder in a way that the representation of an original chart image obtained from closely matches the representation of its corresponding simplified chart obtained from . This is to enable to encode any original chart into the representation space of simplified chart images, thereby improving the accuracy of table generation. Then, given the chart representations, we generate table representations using the frozen table decoder that is trained in Phase 1. More precisely, given an original chart and the simplified chart as the positive sample, we generate a negative sample by randomly shuffling values in the simple chart . Then, we define a triplet loss using the representations of the original chart , its corresponding positive sample , and negative sample obtained from the sequentially passing and into chart encoders and the table decoder as follows:
| (1) |
where denotes the distance defined as , and denotes the margin which induces the anchor to be closer to the positive sample and farther from the negative sample . Through this process, the student chart encoder is trained to extract only the essential information from original charts, even if they contain information that is irrelevant to chart reasoning. By optimizing Eq. 1, focuses on subtle differences in the representations of positive and negative samples that would be highly similar in the representation space, which is expected to enhance the precise value mapping for table generation.
The representation obtained after passing the original chart through the student encoder and the table decoder is then fed into the frozen fully connected layer () trained in Phase 1 to generate a table.
Furthermore, since our goal is not just to train to mimic the representation of simple charts, but to eventually generate tables effectively, we also introduce a cross-entropy loss for table generation as follows:
| (2) |
| (3) |
where a linearized textual sequence of the the generated table, and denote the length of the linearized textual sequence of the table , and the number of classes, respectively, and and denote the ground-truth token and the predicted token each belonging to one of the classes, i.e., if belongs to class and 0 otherwise. Note that, as in Deplot, lines of are separated by ’<0x0A>’ (line break symbol), and cells distinguished by ’|’.
The final loss function for chart-to-table extraction is defined with hyperparameter to balance two losses as follows:
| (4) |
Note that considering the scale of the two losses, i.e., and , we set to 0.1 to balance between them. However, the final performance is expected to improve when is carefully selected, which we leave as future work.
In summary, in Phase 2, we align the representation space of , which is trained with original charts, and , which is trained with simple charts, thereby allowing to generate chart representations that mainly contain essential information for chart reasoning. Based on the representations obtained from , we use the frozen decoder to generate tables that will be passed on to the LMM in the inference stage.
2.3 Inference Stage: Reasoning with Extracted Table
In the inference stage, we use a Large Multimodal Model (LMM) to perform various reasoning tasks given the tables obtained from the training stage as input. However, relying solely on tables without the associated visual information to solve chart reasoning tasks makes it impossible for the model to answer questions regarding color or position (e.g., "What is the value of the third bar from the top?", "What year does the orange line represent?"). To address this issue, we additionally provide the original chart as another input to the LMM to enable the model to provide answers to a wider range of questions. By doing so, we expect the model to not only answer to questions regarding precise chart values by referring to the tables, but also to answer about visual attributes not contained in the table by referring to the original chart.
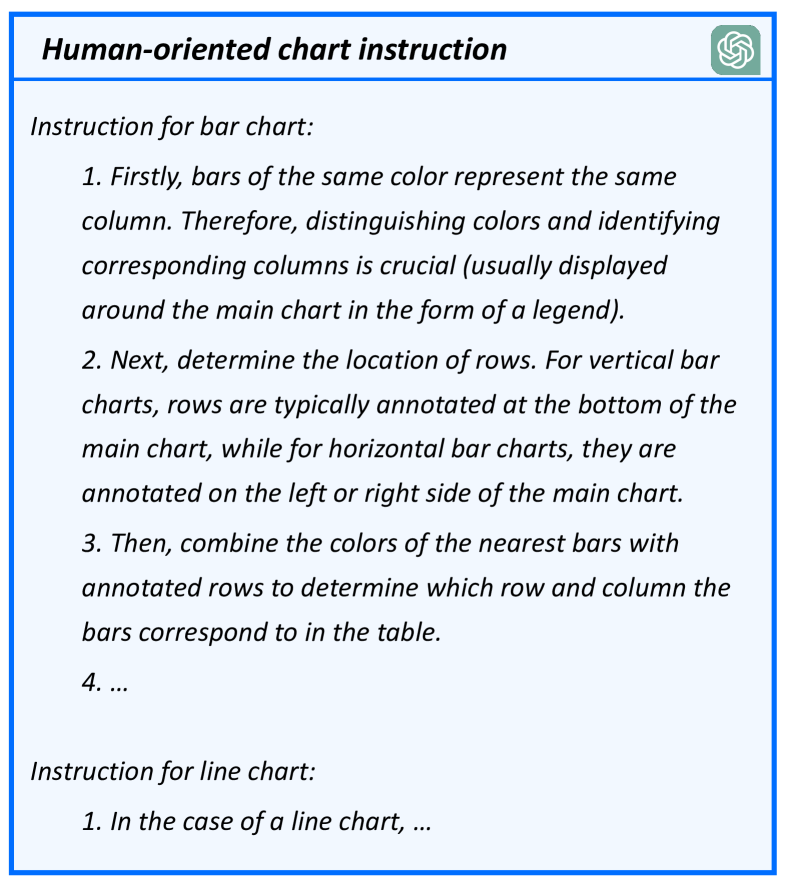
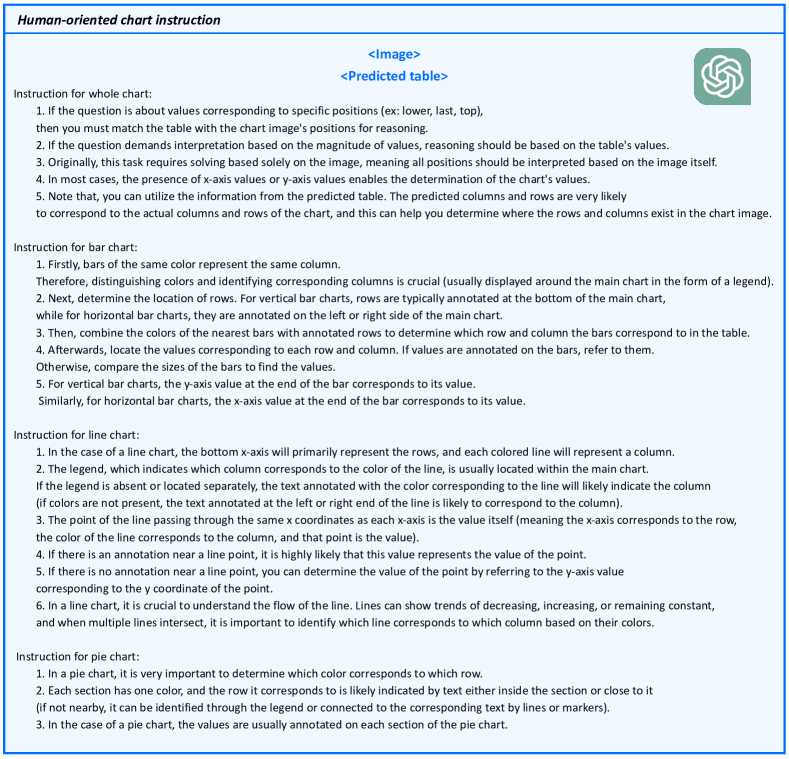
Human-oriented chart instruction. Furthermore, we present a novel prompt that is specifically designed for chart reasoning, named Human-oriented chart instruction. Although prompt engineering is a widely studied topic for processing natural images (Kim et al., 2023; Li et al., 2022), it is crucial to develop specialized prompts specifically tailored for charts, due to the inherent nature of chart reasoning tasks, i.e., they require more advanced advanced thinking steps for interpretation. Our proposed prompt provides instructions that mimic how humans interpret charts, enabling more accurate reasoning within the LMM. To our best knowledge, this is the first work to study a prompt specifically targeting charts, and its effectiveness is will be demonstrated in Section 3.2.2. We provide a snippet of our proposed prompt in Fig. 4. For detailed description of Human-oriented chart instruction, please refer to Appendix B.
3 Experiments
3.1 Experimental Setting
Dataset. In this paper, we evaluate Simplot using a widely used dataset, ChartQA (Masry et al., 2022) comprising three types of charts (i.e., pie, bar, and line). ChartQA also includes human-authored and LLM-augmented QA pairs. Detailed statistics of ChartQA dataset are presented in Table 1. Please note that we do not use QA pairs for training, but train the model to generate tables only from the charts in the training set, then use QA pairs from the test set for measuring reasoning performance. Further description of ChartQA dataset is presented in Appendix C.1.
| Pie | Bar | Line | QA pair | |
|---|---|---|---|---|
| Train set | 541 | 15,581 | 2,195 | - |
| Validation set | 48 | 837 | 171 | - |
| Test set | 78 | 1,230 | 211 | 2,500 |
Baselines. In this paper, we use various models as baselines that can perform chart reasoning. The baselines we employ are divided into three categories including Vision-Language pre-trained models (VLP), fully supervised models for chart reasoning, few-shot model which extracts table and reasoning using LLM. Detailed descriptions of the models are provided in the Appendix C.2.
Evaluation protocol. For question answering based on charts, we report Relaxed Accuracy (RA) of 2,500 questions in the test set following previous works (Lee et al., 2023; Kantharaj et al., 2022b; Masry et al., 2022; Kantharaj et al., 2022a; Liu et al., 2022b).
Furthermore, we propose a proper metric to evaluate for chart extraction, employing a slightly modified metric derived from Relative Mapping Similarity (), presented by Deplot (Liu et al., 2022a). We discover that does not accurately measure the chart-to-table performance in certain cases, we adopt a metric named Relative Distance (). For the differences between and , please refer to the Appendix C.3.
3.2 Experimental Results
3.2.1 Results on Chart-to-Table Extraction
In Table 2, we observe that Simplot exhibits superior chart-to-table extraction overall performance compared to existing methods including Deplot (Liu et al., 2022a) and UniChart (Masry et al., 2023). We argue that the superiority of Simplot in terms of chart-to-table extraction eventually leads to more precise reasoning as will be shown in Section 3.2.2.
Furthermore, to verify whether the proposed method demonstrates consistent performance regardless of chart type, we also evaluate the table extraction performance separately for each chart type. Except when comparing line performance with UniChart, Simplot consistently outperforms the baselines in all cases, with a marginally lower performance (0.42%) observed compared to UniChart specifically in line charts. However, considering the higher overall performance of Simplot and the fact that UniChart was pre-trained on over 600,000 data samples for chart-to-table extraction while we use a model pre-trained on approximately 60,000 data samples (Liu et al., 2022a), it is evident that our method is sufficiently effective. Moreover, our approach can be applied to any model pre-trained on large vision-text datasets, and there is room for performance improvement if we utilize more dataset.
| Models | Chart type | Overall | ||
|---|---|---|---|---|
| Pie | Bar | Line | ||
| UniChart | 84.86 | 92.58 | 85.16 | 88.03 |
| Deplot | 88.82 | 96.37 | 82.25 | 90.95 |
| Simplot | 91.41 | 96.87 | 84.74 | 92.32 |
3.2.2 Results on Chart Reasoning
The performance of question answering on ChartQA datasets are summarized in Table 3. We make the following key observations:
(1) In general, we observe that methods designed with a focus on chart reasoning outperform VLP in QA tasks in terms of overall performance. This demonstrates that despite the superior performance of vision-language models in performing a wide range of tasks in the traditional natural image domain, they face difficulties in interpreting charts due to the significantly different characteristics of natural images and charts. This highlights the need for research targeted at chart reasoning by focusing on the characteristics of charts.
(2) Furthermore, noticeable performance difference is observed among models aimed at chart reasoning. Methods using tables such as Deplot (Liu et al., 2022a) or our proposed method, Simplot, generally outperform models that conduct reasoning based solely on images. This suggests that going through tables allows for more detailed reasoning, aligning well with our motivation that emphasizes the importance of effectively extracting tables. Additionally, we would like to highlight that while other models are fine-tuned with fully supervision for question answering, Deplot (Liu et al., 2022a) or Simplot are only trained for table extraction, but they show higher performance even with few-shot reasoning. While models fine-tuned for chart reasoning need appropriate data and a new fine-tuning stage to perform other tasks such as text summarization, Simplot can efficiently handle various tasks without any additional tuning by utilizing extracted tables and LLM.
| Models | Data type | |||
|---|---|---|---|---|
| Human | Augmented | Overall | ||
| VLP models | TaPas | 28.72 | 53.84 | 41.28 |
| V-TaPas | 29.60 | 61.44 | 45.52 | |
| T5 | 25.12 | 56.96 | 41.04 | |
| VL-T5 | 26.24 | 56.88 | 41.56 | |
| PaLI | 30.40 | 64.90 | 47.65 | |
| Mini-GPT | 8.40 | 15.60 | 12.00 | |
| LLaVa | 37.68 | 72.96 | 55.32 | |
| GPT-4V | 56.48 | 63.04 | 59.76 | |
| Supervised | ChartQA | 40.08 | 63.60 | 51.84 |
| ChartT5 | 31.80 | 74.40 | 53.10 | |
| Pix2Struct | 30.50 | 71.60 | 56.05 | |
| MatCha | 38.20 | 90.20 | 64.20 | |
| Unichart | 43.92 | 88.56 | 66.24 | |
| ChartLlama | 48.96 | 90.36 | 69.66 | |
| Few-shot | Deplot | 62.71 | 78.63 | 70.67 |
| Deplot + img. | 72.39 | 85.01 | 78.70 | |
| Simplot | 73.91 | 85.67 | 79.79 | |
| Simplot++ | 78.07 | 88.42 | 83.24 | |
(3) Simplot outperforms Deplot (Liu et al., 2022a), which is the SOTA model. For a more fair comparison, we also report the performance when both the table extracted by Deplot and the original chart were provided as inputs to an LMM for reasoning (Deplot+img. in Table 3). We confirm that incorporating images along with tables can enhance reasoning performance compared with when solely relying on the tables, again highlighting our motivation, i.e., considering visual attributes of charts is crucial. The superior performance of Simplot compared to Deplot+img. is attributed to the effectiveness of our table extraction method based on contrastive learning. It is important to note that the performance difference solely originates from the chart extraction performance since the same prompts were used for both Deplot and Simplot for a fair comparison, without using our Human-oriented chart instruction.
(4) In Table 3, we observe that Simplot++, which is our model with the, Human-oriented chart instruction, outperforms vanilla Simplot. This confirms the importance of using appropriate prompts tailored to the task when employing LMMs, while also indicating how well our prompt mimics how humans think. It is notable that providing more diverse in-context examples could lead to even greater performance gains.
Discussion. The overall performance of Simplot is consistently higher than other baselines; however, on the augmented set, it sometimes exhibits slightly lower performance compared to some models. This can be attributed to the characteristic of the augmented set, which is obtained by fine-tuning the T5 model on the SQuAD QA dataset (Rajpurkar et al., 2016) to generate questions and answers. Consequently, the questions in the augmented set are mostly simpler and relatively easier to answer compared to those in the human set. Fine-tuned models on such questions with full supervision tend to show notably higher performance on augmented data. For instance, MatCha (Liu et al., 2022b) shows a performance of 90.2 on the augmented set, but its performance drops significantly to 38.2 on the human set which is composed of more complex QA pairs, resulting in an overall performance of 64.2. In contrast, Simplot’s high performance even on the human set without additional fine-tuning suggests that proposed method is effective for more complex reasoning tasks.
3.2.3 Case Study
We provide specific cases of how Simplot addresses the concerns we have raised, compared to the our main baseline, Deplot (Liu et al., 2022a).
(1) Firstly, we verify how our method addresses the issue of existing methods failing to properly reflect textual information within charts. Fig. 5 illustrates that the table extracted by Deplot (Liu et al., 2022a) fails to consider the counting unit, i.e., "million/billion", present in the chart, resulting in an inaccurate table. In contrast, Simplot generates a table that incorporates this information, enabling more accurate reasoning.
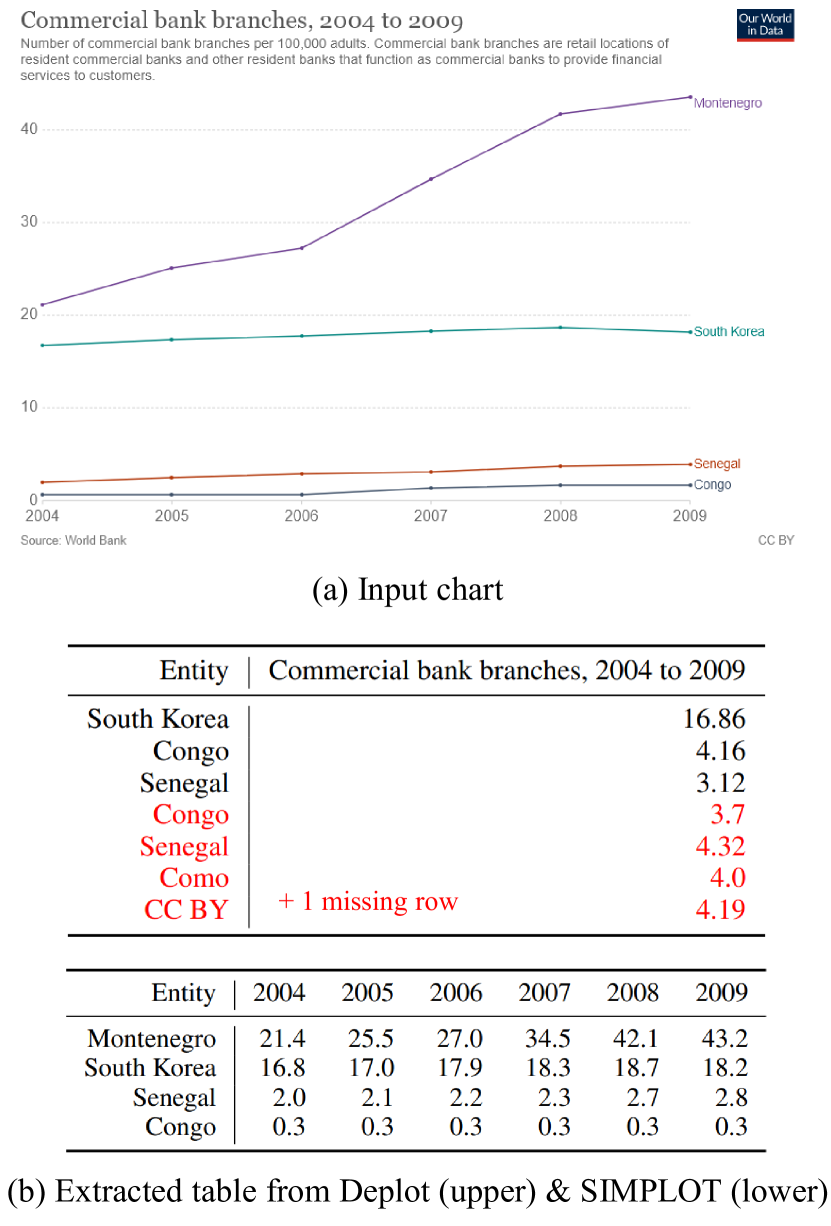
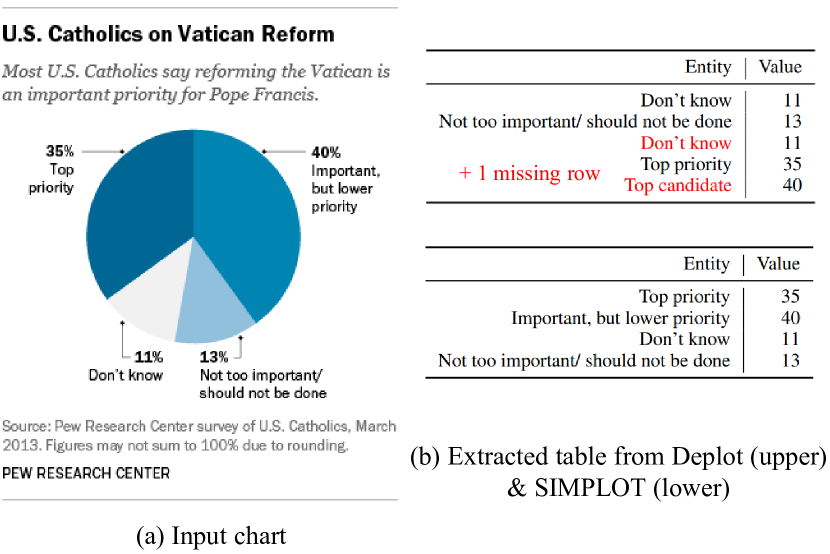
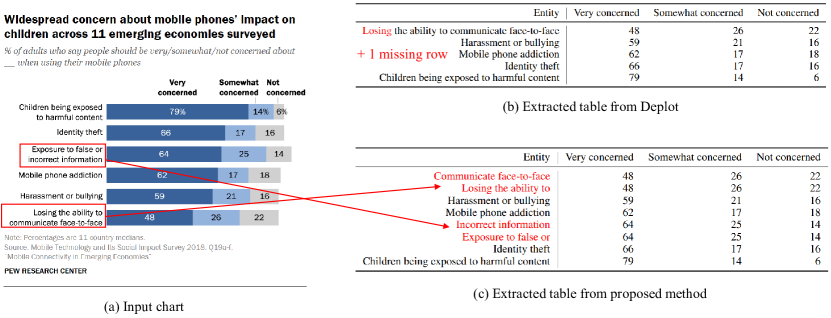
(2) Furthermore, we confirm that the process of rendering columns and rows of a table on the image to provide guidelines for table extraction is beneficial for extracting accurate an table. In Fig. 6, Deplot (Liu et al., 2022a) omits a relevant row, i.e., "Montenegro", redundantly extracts several rows, and even generates entirely irrelevant rows such as "CC BY," which would result in a poor performance in reasoning tasks. In contrast, Simplot accurately generates the table by extracting only the relevant rows, ensuring accurate reasoning.
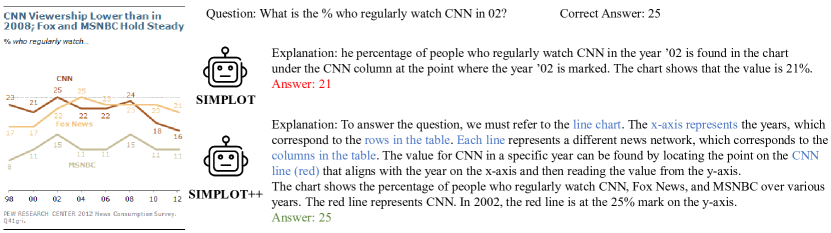
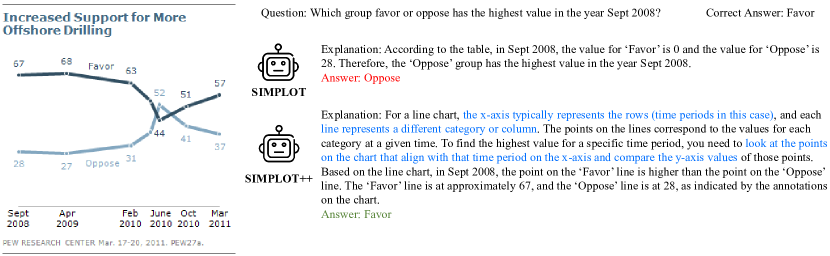
(3) Lastly, we demonstrate the effectiveness of our proposed prompt, Human-oriented chart instruction. Fig. 7 illustrates the difference between interpreting the same chart with/without using the proposed prompt. While the model fails to produce an accurate answer without the prompt, the model generates a correct answer in a process similar to how humans interpret charts when using the prompt. This highlights the effectiveness of our prompt designed to mimic human reasoning. Please refer to Appendix D for further case studies of other chart types.
Furthermore, we present typical errors that cause our model to fail in chart-to-table extraction or question answering, along with possible solutions, in the appendix E.
4 Related Work
Pre-trained vision-language models. Vision-language pre-training seeks to enhance the performance of downstream vision and language tasks such as visual question answering (VQA) (Tan and Bansal, 2019; Alayrac et al., 2022), image-text retrieval (Chen et al., 2020; Jia et al., 2021), and image captioning (Li et al., 2020, 2022).
Several models learn cross-modal representation from visual features and language tokens (Chen et al., 2020; Su et al., 2019). Specifically, Lu et al. (2019) employs two single-modal networks, alongside a cross-modal transformer layer integrating information from input sentences and images.
Radford et al. (2021) and Jia et al. (2021) facilitated zero-shot adaptation utilizing contrastive learning for various tasks on multimodal data. However, their drawback resides in their limitation to generate language, diminishing their suitability for open-ended tasks such as VQA.
Others propose a different approach to develop an enhanced Large Multimodal Model (LMM). For example, Liu et al. (2023) employs a visual encoder and a language decoder from other studies (Radford et al., 2021; Chiang et al., 2023). It is capable of performing various QA tasks including conversation, detail description, complex reasoning and focuses on chat capability.
Chart reasoning models. Early methods for processing charts predominantly utilized rule-based approaches (Balaji et al., 2018; Choi et al., 2019). However, they were specifically tailored to predefined chart formats, limiting their applicability only to certain types of charts. Moreover, incorporating new chart designs require additional rules, leading to the impracticality of immediate adaptation to new chart formats.
Due to above limitations, researchers utilize modules such as OCR and key-point detection (Poco and Heer, 2017; Zhou et al., 2023; Xue et al., 2023). However, these methods can be time-consuming and require dataset annotation for labeling, and rely on the performance of modules. For example, Luo et al. (2021) suffers from a drawback as it solely predicts the raw data values without establishing connections to their respective axes or legends.
In an effort to address these challenges, researchers develop vision-language models (Meng et al., 2024; Huang et al., 2023) without heuristic rules. Some approaches comprehend the chart and respond to questions in natural language (Masry et al., 2023; Han et al., 2023). However, such models require fine-tuning for each downstream task, constraining their adaptability for diverse tasks. Meanwhile, studies such as Methani et al. (2020); Lu et al. (2023a) have created datasets to enable more realistic mathematical reasoning.
To tackle these challenges, recent studies Liu et al. (2022a); Xia et al. (2023) introduce a two-step approach, chart-to-table extraction and reasoning with LLM. Recent advancements like Liu et al. (2022a); Xia et al. (2023) have introduced a two-step approach to tackle challenges in chart analysis. Firstly, charts are transformed into tables, improving interpretability and aiding in identifying inaccuracies. Lu et al. (2023b) utilizes Program of Thought (PoT), achieving significant performance gains. This approach enables more accurate and interpretable reasoning compared to traditional methods, indicating that table extraction is crucial.
5 Conclusion
In this paper, we propose Simplot, which extracts only the essential information required for chart reasoning from real-world charts containing a lot of unnecessary information. Focusing on essential information in charts, our model extracts precise tables from charts, resulting in accurate chart reasoning. Furthermore, by leveraging textual information and visual component such as colors inside the charts, Simplot enables accurate chart reasoning, which is crucial point but ignored in existing methods. Finally, we propose a novel prompt, Human-oriented chart instruction, specifically designed for chart reasoning. It provides instruction to LMM imitating how humans interpret chart, enabling more precise reasoning. Through extensive experiments and case studies, we demonstrate that Simplot effectively handle concerns raised by existing works while improving chart reasoning performance.
Limitations
Despite the outstanding performance of Simplot in chart-to-table extraction, there is room for improvement. During the process of rendering columns and rows, inaccuracies in extracting columns and rows can lead to failures in effectively converting charts into tables. Particularly, it can be challenging to extract appropriate columns and rows when the texts in the chart are complex. We provide a detailed error analysis related to this issue in the Appendix E. To address these problems, future work could involve refining the extraction process by understanding the context between extracted columns and rows before rendering.
Ethics Statement
Simplot has not been trained with private or sensitive data. This significantly reduces the risk of generating harmful or misleading content. The ChartQA dataset, which we utilize to collect chart-table pairs, is publicly accessible for research purposes. To make sure the transparency and reproducibility of our experiments, we provide detailed information on hyperparameter configurations in our paper and publicly share our source code. This careful approach mitigates the potential for unethical outcomes associated with data usage. While our models demonstrate state-of-the-art performance on ChartQA, however, we acknowledge the possibility of their misuse. There exists a risk that our models could be exploited to mislead the public about the content and implications of charts. Despite our models’ high performance, we cannot guarantee their outputs will always be accurate, emphasizing the need for critical interpretation and verification of results.
References
- Achiam et al. (2023) Josh Achiam, Steven Adler, Sandhini Agarwal, Lama Ahmad, Ilge Akkaya, Florencia Leoni Aleman, Diogo Almeida, Janko Altenschmidt, Sam Altman, Shyamal Anadkat, et al. 2023. Gpt-4 technical report. arXiv preprint arXiv:2303.08774.
- Alayrac et al. (2022) Jean-Baptiste Alayrac, Jeff Donahue, Pauline Luc, Antoine Miech, Iain Barr, Yana Hasson, Karel Lenc, Arthur Mensch, Katherine Millican, Malcolm Reynolds, et al. 2022. Flamingo: a visual language model for few-shot learning. Advances in Neural Information Processing Systems, 35:23716–23736.
- Antol et al. (2015) Stanislaw Antol, Aishwarya Agrawal, Jiasen Lu, Margaret Mitchell, Dhruv Batra, C Lawrence Zitnick, and Devi Parikh. 2015. Vqa: Visual question answering. In Proceedings of the IEEE international conference on computer vision, pages 2425–2433.
- Balaji et al. (2018) Abhijit Balaji, Thuvaarakkesh Ramanathan, and Venkateshwarlu Sonathi. 2018. Chart-text: A fully automated chart image descriptor. arXiv preprint arXiv:1812.10636.
- Biten et al. (2019) Ali Furkan Biten, Ruben Tito, Andres Mafla, Lluis Gomez, Marçal Rusinol, Minesh Mathew, CV Jawahar, Ernest Valveny, and Dimosthenis Karatzas. 2019. Icdar 2019 competition on scene text visual question answering. In 2019 International Conference on Document Analysis and Recognition (ICDAR), pages 1563–1570. IEEE.
- Bujard et al. (1987) Hermann Bujard, Reiner Gentz, Michael Lanzer, Dietrich Stueber, Michael Mueller, Ibrahim Ibrahimi, Marie-Therese Haeuptle, and Bernhard Dobberstein. 1987. [26] a t5 promoter-based transcription-translation system for the analysis of proteins in vitro and in vivo. In Methods in enzymology, volume 155, pages 416–433. Elsevier.
- Chen et al. (2022a) Wenhu Chen, Xueguang Ma, Xinyi Wang, and William W Cohen. 2022a. Program of thoughts prompting: Disentangling computation from reasoning for numerical reasoning tasks. arXiv preprint arXiv:2211.12588.
- Chen et al. (2022b) Xi Chen, Xiao Wang, Soravit Changpinyo, AJ Piergiovanni, Piotr Padlewski, Daniel Salz, Sebastian Goodman, Adam Grycner, Basil Mustafa, Lucas Beyer, et al. 2022b. Pali: A jointly-scaled multilingual language-image model. arXiv preprint arXiv:2209.06794.
- Chen et al. (2020) Yen-Chun Chen, Linjie Li, Licheng Yu, Ahmed El Kholy, Faisal Ahmed, Zhe Gan, Yu Cheng, and Jingjing Liu. 2020. Uniter: Universal image-text representation learning. In European conference on computer vision, pages 104–120. Springer.
- Cheng et al. (2023) Zhi-Qi Cheng, Qi Dai, Siyao Li, Jingdong Sun, Teruko Mitamura, and Alexander G Hauptmann. 2023. Chartreader: A unified framework for chart derendering and comprehension without heuristic rules. arXiv preprint arXiv:2304.02173.
- Chiang et al. (2023) Wei-Lin Chiang, Zhuohan Li, Zi Lin, Ying Sheng, Zhanghao Wu, Hao Zhang, Lianmin Zheng, Siyuan Zhuang, Yonghao Zhuang, Joseph E Gonzalez, et al. 2023. Vicuna: An open-source chatbot impressing gpt-4 with 90%* chatgpt quality. See https://vicuna. lmsys. org (accessed 14 April 2023).
- Cho et al. (2021) Jaemin Cho, Jie Lei, Hao Tan, and Mohit Bansal. 2021. Unifying vision-and-language tasks via text generation. In International Conference on Machine Learning, pages 1931–1942. PMLR.
- Choi et al. (2019) Jinho Choi, Sanghun Jung, Deok Gun Park, Jaegul Choo, and Niklas Elmqvist. 2019. Visualizing for the non-visual: Enabling the visually impaired to use visualization. In Computer Graphics Forum, volume 38, pages 249–260. Wiley Online Library.
- Dosovitskiy et al. (2020) Alexey Dosovitskiy, Lucas Beyer, Alexander Kolesnikov, Dirk Weissenborn, Xiaohua Zhai, Thomas Unterthiner, Mostafa Dehghani, Matthias Minderer, Georg Heigold, Sylvain Gelly, et al. 2020. An image is worth 16x16 words: Transformers for image recognition at scale. arXiv preprint arXiv:2010.11929.
- Gardères et al. (2020) François Gardères, Maryam Ziaeefard, Baptiste Abeloos, and Freddy Lecue. 2020. Conceptbert: Concept-aware representation for visual question answering. In Findings of the Association for Computational Linguistics: EMNLP 2020, pages 489–498.
- Han et al. (2023) Yucheng Han, Chi Zhang, Xin Chen, Xu Yang, Zhibin Wang, Gang Yu, Bin Fu, and Hanwang Zhang. 2023. Chartllama: A multimodal llm for chart understanding and generation. arXiv preprint arXiv:2311.16483.
- Holmgren et al. (2012) Johan Holmgren, Paul Davidsson, Jan A Persson, and Linda Ramstedt. 2012. Tapas: A multi-agent-based model for simulation of transport chains. Simulation Modelling Practice and Theory, 23:1–18.
- Huang et al. (2023) Kung-Hsiang Huang, Mingyang Zhou, Hou Pong Chan, Yi R Fung, Zhenhailong Wang, Lingyu Zhang, Shih-Fu Chang, and Heng Ji. 2023. Do lvlms understand charts? analyzing and correcting factual errors in chart captioning. arXiv preprint arXiv:2312.10160.
- Jia et al. (2021) Chao Jia, Yinfei Yang, Ye Xia, Yi-Ting Chen, Zarana Parekh, Hieu Pham, Quoc Le, Yun-Hsuan Sung, Zhen Li, and Tom Duerig. 2021. Scaling up visual and vision-language representation learning with noisy text supervision. In International conference on machine learning, pages 4904–4916. PMLR.
- Kafle et al. (2018) Kushal Kafle, Brian Price, Scott Cohen, and Christopher Kanan. 2018. Dvqa: Understanding data visualizations via question answering. In Proceedings of the IEEE conference on computer vision and pattern recognition, pages 5648–5656.
- Kantharaj et al. (2022a) Shankar Kantharaj, Xuan Long Do, Rixie Tiffany Ko Leong, Jia Qing Tan, Enamul Hoque, and Shafiq Joty. 2022a. Opencqa: Open-ended question answering with charts. arXiv preprint arXiv:2210.06628.
- Kantharaj et al. (2022b) Shankar Kantharaj, Rixie Tiffany Ko Leong, Xiang Lin, Ahmed Masry, Megh Thakkar, Enamul Hoque, and Shafiq Joty. 2022b. Chart-to-text: A large-scale benchmark for chart summarization. arXiv preprint arXiv:2203.06486.
- Kim et al. (2024) Kibum Kim, Kanghoon Yoon, Yeonjun In, Jinyoung Moon, Donghyun Kim, and Chanyoung Park. 2024. Adaptive self-training framework for fine-grained scene graph generation. arXiv preprint arXiv:2401.09786.
- Kim et al. (2023) Kibum Kim, Kanghoon Yoon, Jaehyeong Jeon, Yeonjun In, Jinyoung Moon, Donghyun Kim, and Chanyoung Park. 2023. Llm4sgg: Large language model for weakly supervised scene graph generation. arXiv e-prints, pages arXiv–2310.
- Lee et al. (2023) Kenton Lee, Mandar Joshi, Iulia Raluca Turc, Hexiang Hu, Fangyu Liu, Julian Martin Eisenschlos, Urvashi Khandelwal, Peter Shaw, Ming-Wei Chang, and Kristina Toutanova. 2023. Pix2struct: Screenshot parsing as pretraining for visual language understanding. In International Conference on Machine Learning, pages 18893–18912. PMLR.
- Li et al. (2022) Junnan Li, Dongxu Li, Caiming Xiong, and Steven Hoi. 2022. Blip: Bootstrapping language-image pre-training for unified vision-language understanding and generation. In International Conference on Machine Learning, pages 12888–12900. PMLR.
- Li et al. (2020) Xiujun Li, Xi Yin, Chunyuan Li, Pengchuan Zhang, Xiaowei Hu, Lei Zhang, Lijuan Wang, Houdong Hu, Li Dong, Furu Wei, et al. 2020. Oscar: Object-semantics aligned pre-training for vision-language tasks. In Computer Vision–ECCV 2020: 16th European Conference, Glasgow, UK, August 23–28, 2020, Proceedings, Part XXX 16, pages 121–137. Springer.
- Liu et al. (2022a) Fangyu Liu, Julian Martin Eisenschlos, Francesco Piccinno, Syrine Krichene, Chenxi Pang, Kenton Lee, Mandar Joshi, Wenhu Chen, Nigel Collier, and Yasemin Altun. 2022a. Deplot: One-shot visual language reasoning by plot-to-table translation. arXiv preprint arXiv:2212.10505.
- Liu et al. (2022b) Fangyu Liu, Francesco Piccinno, Syrine Krichene, Chenxi Pang, Kenton Lee, Mandar Joshi, Yasemin Altun, Nigel Collier, and Julian Martin Eisenschlos. 2022b. Matcha: Enhancing visual language pretraining with math reasoning and chart derendering. arXiv preprint arXiv:2212.09662.
- Liu et al. (2023) Haotian Liu, Chunyuan Li, Qingyang Wu, and Yong Jae Lee. 2023. Visual instruction tuning. arXiv preprint arXiv:2304.08485.
- Lu et al. (2019) Jiasen Lu, Dhruv Batra, Devi Parikh, and Stefan Lee. 2019. Vilbert: Pretraining task-agnostic visiolinguistic representations for vision-and-language tasks. Advances in neural information processing systems, 32.
- Lu et al. (2023a) Pan Lu, Hritik Bansal, Tony Xia, Jiacheng Liu, Chunyuan Li, Hannaneh Hajishirzi, Hao Cheng, Kai-Wei Chang, Michel Galley, and Jianfeng Gao. 2023a. Mathvista: Evaluating math reasoning in visual contexts with gpt-4v, bard, and other large multimodal models. arXiv e-prints, pages arXiv–2310.
- Lu et al. (2023b) Pan Lu, Baolin Peng, Hao Cheng, Michel Galley, Kai-Wei Chang, Ying Nian Wu, Song-Chun Zhu, and Jianfeng Gao. 2023b. Chameleon: Plug-and-play compositional reasoning with large language models. arXiv preprint arXiv:2304.09842.
- Luo et al. (2021) Junyu Luo, Zekun Li, Jinpeng Wang, and Chin-Yew Lin. 2021. Chartocr: Data extraction from charts images via a deep hybrid framework. In Proceedings of the IEEE/CVF winter conference on applications of computer vision, pages 1917–1925.
- Masry et al. (2023) Ahmed Masry, Parsa Kavehzadeh, Xuan Long Do, Enamul Hoque, and Shafiq Joty. 2023. Unichart: A universal vision-language pretrained model for chart comprehension and reasoning. arXiv preprint arXiv:2305.14761.
- Masry et al. (2022) Ahmed Masry, Do Xuan Long, Jia Qing Tan, Shafiq Joty, and Enamul Hoque. 2022. Chartqa: A benchmark for question answering about charts with visual and logical reasoning. arXiv preprint arXiv:2203.10244.
- Meng et al. (2024) Fanqing Meng, Wenqi Shao, Quanfeng Lu, Peng Gao, Kaipeng Zhang, Yu Qiao, and Ping Luo. 2024. Chartassisstant: A universal chart multimodal language model via chart-to-table pre-training and multitask instruction tuning. arXiv preprint arXiv:2401.02384.
- Methani et al. (2020) Nitesh Methani, Pritha Ganguly, Mitesh M Khapra, and Pratyush Kumar. 2020. Plotqa: Reasoning over scientific plots. In Proceedings of the IEEE/CVF Winter Conference on Applications of Computer Vision, pages 1527–1536.
- Poco and Heer (2017) Jorge Poco and Jeffrey Heer. 2017. Reverse-engineering visualizations: Recovering visual encodings from chart images. In Computer graphics forum, volume 36, pages 353–363. Wiley Online Library.
- Radford et al. (2021) Alec Radford, Jong Wook Kim, Chris Hallacy, Aditya Ramesh, Gabriel Goh, Sandhini Agarwal, Girish Sastry, Amanda Askell, Pamela Mishkin, Jack Clark, et al. 2021. Learning transferable visual models from natural language supervision. In International conference on machine learning, pages 8748–8763. PMLR.
- Rajpurkar et al. (2016) Pranav Rajpurkar, Jian Zhang, Konstantin Lopyrev, and Percy Liang. 2016. Squad: 100,000+ questions for machine comprehension of text. arXiv preprint arXiv:1606.05250.
- Shao et al. (2023) Zhenwei Shao, Zhou Yu, Meng Wang, and Jun Yu. 2023. Prompting large language models with answer heuristics for knowledge-based visual question answering. In Proceedings of the IEEE/CVF Conference on Computer Vision and Pattern Recognition, pages 14974–14983.
- Su et al. (2019) Weijie Su, Xizhou Zhu, Yue Cao, Bin Li, Lewei Lu, Furu Wei, and Jifeng Dai. 2019. Vl-bert: Pre-training of generic visual-linguistic representations. arXiv preprint arXiv:1908.08530.
- Tan and Bansal (2019) Hao Tan and Mohit Bansal. 2019. Lxmert: Learning cross-modality encoder representations from transformers. arXiv preprint arXiv:1908.07490.
- Wei et al. (2022) Jason Wei, Xuezhi Wang, Dale Schuurmans, Maarten Bosma, Fei Xia, Ed Chi, Quoc V Le, Denny Zhou, et al. 2022. Chain-of-thought prompting elicits reasoning in large language models. Advances in Neural Information Processing Systems, 35:24824–24837.
- Xia et al. (2023) Renqiu Xia, Bo Zhang, Haoyang Peng, Ning Liao, Peng Ye, Botian Shi, Junchi Yan, and Yu Qiao. 2023. Structchart: Perception, structuring, reasoning for visual chart understanding. arXiv preprint arXiv:2309.11268.
- Xue et al. (2023) Wenyuan Xue, Dapeng Chen, Baosheng Yu, Yifei Chen, Sai Zhou, and Wei Peng. 2023. Chartdetr: A multi-shape detection network for visual chart recognition. arXiv preprint arXiv:2308.07743.
- Zhang et al. (2021) Pengchuan Zhang, Xiujun Li, Xiaowei Hu, Jianwei Yang, Lei Zhang, Lijuan Wang, Yejin Choi, and Jianfeng Gao. 2021. Vinvl: Revisiting visual representations in vision-language models. In Proceedings of the IEEE/CVF conference on computer vision and pattern recognition, pages 5579–5588.
- Zhou et al. (2020) Luowei Zhou, Hamid Palangi, Lei Zhang, Houdong Hu, Jason Corso, and Jianfeng Gao. 2020. Unified vision-language pre-training for image captioning and vqa. In Proceedings of the AAAI conference on artificial intelligence, volume 34, pages 13041–13049.
- Zhou et al. (2023) Mingyang Zhou, Yi R Fung, Long Chen, Christopher Thomas, Heng Ji, and Shih-Fu Chang. 2023. Enhanced chart understanding in vision and language task via cross-modal pre-training on plot table pairs. arXiv preprint arXiv:2305.18641.
- Zhu et al. (2023) Deyao Zhu, Jun Chen, Xiaoqian Shen, Xiang Li, and Mohamed Elhoseiny. 2023. Minigpt-4: Enhancing vision-language understanding with advanced large language models. arXiv preprint arXiv:2304.10592.
Appendix A Row-column Rendering
Fig. 8 presents a detailed exemple of our row-column rendering process. For a simple chart and a original chart used in training stage, we extract rows and columns from table and directly render them on to the charts since we have ground-truth table in this stage. However, for original chart used in inference stage, since we can not access the ground-truth table, rows and columns are extracted from input chart and rendered onto the image with LMM utilizing its powerful performance extracting textual information in the image.
Appendix B Human-oriented Prompt for Chart Reasoning
We present instructions in the prompt to mimic the way humans commonly perceive charts. We name this approach Human-oriented chart instruction, which is a simple yet effective methodology as shown in the QA results. The detailed prompt is as shown in Fig. 9.
In the Human-oriented chart instruction, universal instructions applicable to all chart types are provided first. It includes certain components that every chart contains such as chart title, y-axis, x-axis, legend, and data labels, facilitating the LMM to comprehend the chart. Furthermore, we guide the alignment of charts and predicted tables by instructing the system within the prompt to effectively comprehend the positions of columns and rows as well as the outline of the chart, referring to the predicted table from Simplot.
Subsequently, instructions are described for each type of chart. When humans commonly recognize a bar chart, the initial observation would be columns distinguished by color. Following this observation, the legend within the image is consulted to identify which color denotes which column. Therefore, this intuitive recognition by humans has been incorporated into Bar Chart Instruction 1 in Fig 9.
Upon identifying the columns, humans would proceed to observe which row each bar corresponds to. Intuitively, for vertical bar graphs, the annotations beneath the main chart are referred to, whereas for horizontal bar graphs, annotations on the lateral sides are utilized to determine the rows. Bar Chart Instruction 2 in Fig 9 reflects this role.
Humans then match the color of the bar with the annotated row, thereby aligning each bar with its corresponding column and row. This process is incorporated into Bar Chart Instruction 3 in Fig 9.
Lastly, humans would figure out the value corresponding to each row and column by referencing the value annotated on the bar, the relative sizes between bars, and the x-axis and y-axis. Notably, it is understood intuitively that the value at the point where the bar terminates on the x-axis or y-axis represents the value of that bar. This understanding is into Bar Chart Instructions 4 and 5 in Fig 9, which is end of the instruction.
We generate instructions for line charts and pie charts in a similar manner as described above. We argue that developing a language model that captures the sequential and unconscious reasoning process involved in human chart recognition through Human-oriented chart instruction not only mimics human cognition effectively but also ensures the alignment of predicted tables with chart images, leading to substantial performance enhancements at a lower cost.
Appendix C Details regarding Experiments
C.1 Dataset Description
In this paper, we evaluate our proposed method with widely-used dataset, ChartQA (Masry et al., 2022). It consists of real-world charts containing complex information, making it more aligned with our motivation compared to other synthetic datasets such as PlotQA (Methani et al., 2020) and DVQA (Kafle et al., 2018), both of which only include simple charts. Furthermore, ChartQA comprises three types of charts (i.e., pie, bar, and line), whereas DVQA and PlotQA comprise only one or two types of chart. Therefore, ChartQA is a more challenging dataset and is desirable for evaluating performance on real-world chart reasoning tasks.
C.2 Compared Methods
We use a wide range of models capable of performing chart reasoning as baselines, categorizing them into three distinct categories.
The first category includes Vision-Language Pre-trained models (VLP) as follows:
The second category consists of supervised models, including followings:
The final category is few-shot model, represented by our main baseline, Deplot (Liu et al., 2022a). This model converts charts to tables similar to Simplot and employs prompt-based methodologies such as Chain-of-Thought (CoT) (Wei et al., 2022), Program-of-Thought (PoT) (Chen et al., 2022a) alongside LLM for question reasoning.
C.3 Details regarding Proposed Metric
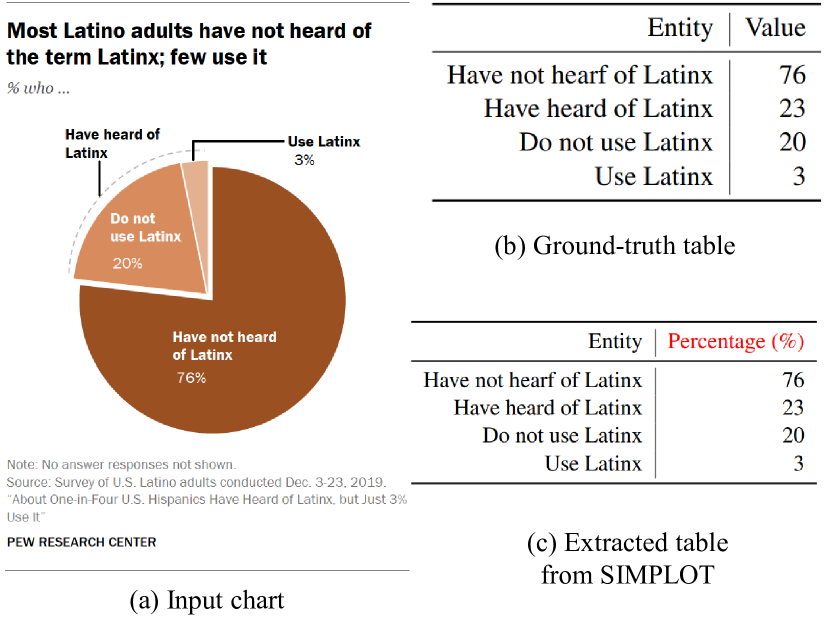
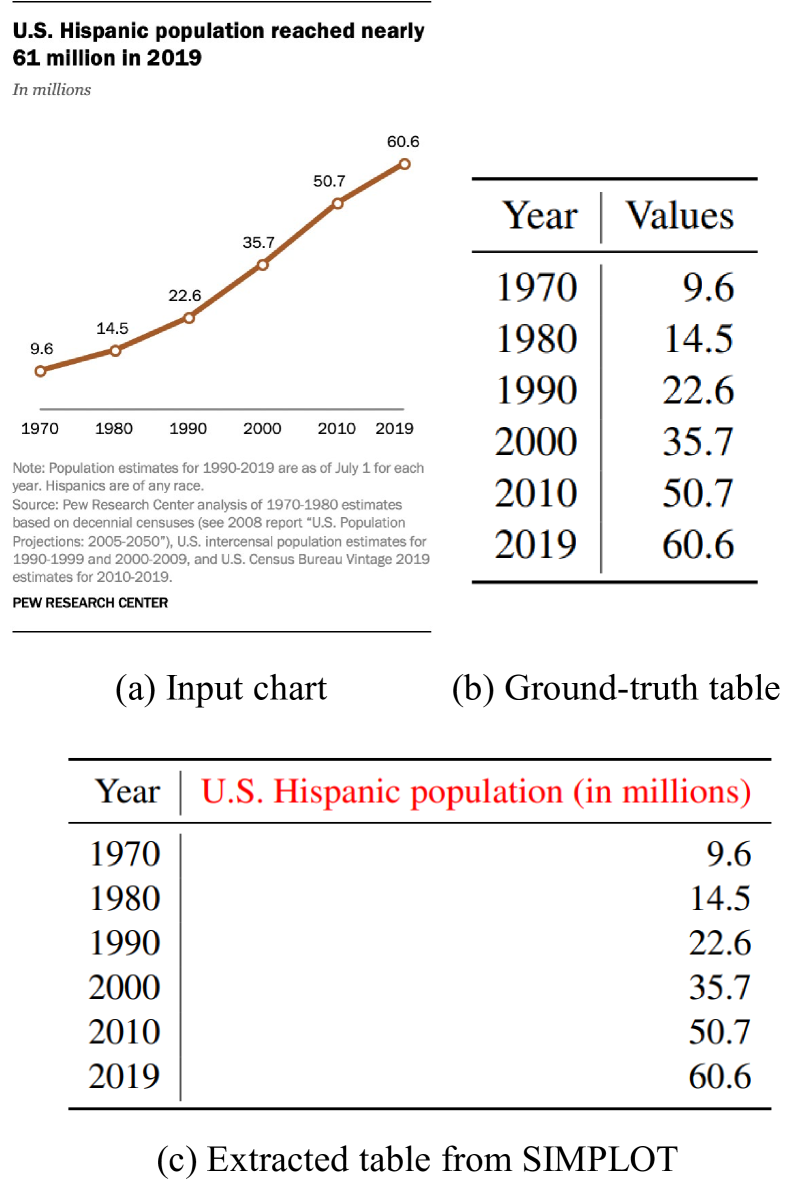
As illustrated on the right side of Fig. 10, columns generated by LMM such as GPT-4 (e.g., "Percentage (%)" in the figure) often carry the same meaning as the ground truth (e.g., "Value" in the figure) but have different Levenshtein distances. Additionally, as shown on the table below of Fig. 11, in cases where columns are not explicitly stated in the image, LMM without further fine-tuning generates arbitrary columns. We are sure that, in the both cases, there are absolutely no issues with chart reasoning using LMM. However, given that is composed of the product of Levenshtein distance (from columns and rows) and relative distance (from values), this leads to an apparent degradation in performance of chart-to-table task even when there are no issues with QA. Consequently, we construct a Levenshtein distance matrix by concatenating column and row predictions with the ground truth, followed by applying minimal cost matching to consider only the relative distance of each pair. We adopt this Relative Distance () as our main metric. This approach allows us to accurately assess performance in value mapping.
We follow Deplot (Liu et al., 2022a) to define RD as the following equation, with most formulas extracted from this paper. Following Liu et al. (2022a), we use basic concept of Related Mapping Similarity (), regarding tables as unordered sets of mappings from row and column headers () to a single value . and indicates each entity for the predicted table and the ground truth table , respectively. Utilizing Normalized Levenshtein Distance () (Biten et al., 2019), we denote the distance between two keys and as where indicates concatenation of string. The distance between values of table is computed with relative distance and distances larger than are set to the maximum of 1. Incorporating these two distances, we obtain the similarity between two entities in a mapping as .
For , Liu et al. (2022a) computes the pairwise similarity in and using the cost function , obtaining a similarity matrix in shape of and identifying the minimal cost matching between the keys (in the binary matrix form).
While precision and recall is obtained from two mappings in Deplot Liu et al. (2022a), we only use distance of the numeric entries to compute :
| (5) |
| (6) |
Similar to Deplot, we compute as the harmonic mean of the precision and recall.
Appendix D More Case Studies
Fig. 12 and 13 show that in both pie charts and bar charts, Deplot (Liu et al., 2022a) misses relevant rows, generates inaccurate rows, thus fails to create values, whereas Simplot consistently produces accurate tables. This directly proves that our proposed method can perform well across various chart types.
Furthermore, Fig. 14 presents how our Human-oriented chart instruction works well immitating the way of human interpretation for charts. Without the proposed prompt, LLM fails to detect exact location of the line component "Favor", leading to a wrong answer. However, utilizing Human-oriented chart instruction, LMM can locate the necessary component exactly, resulting in a correct answer.
Appendix E Error Analysis
Here we present examples of Simplot failures, their reasons, and possible solutions. In Fig. 15 (c), it can be observed that the extracted table from the proposed method contains inaccurate rows. This is attributed to a line break between the items "Exposure to false or incorrect information" and "Losing the ability to Communicate face-to-face" in the input chart, leading to the misinterpretation of each item as two separate entities during row extraction. To address such issues, one possible solution would be to refine the rows and columns by considering their contextual information before rendering.
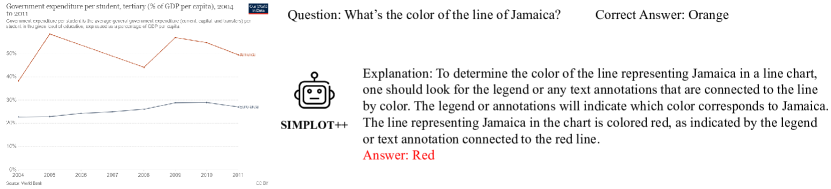
In addition, we find some examples where the LMM lacks specific abilities, such as color detection. In Fig. 16, there is a question asking about the color of "Jamaica" with the correct answer being orange, but the model recognizes it as red and answers incorrectly. One possible solution would be to broaden the range of similar colors for the model to answer together.