Investigating the correlations between IceCube high-energy neutrinos and Fermi-LAT -ray observations. II.
Abstract
Given that gamma rays with energies larger than TeV are severely absorbed by background radiation fields, for many extragalactic sources, the GeV-TeV gamma-ray observations are the messengers that are closest in energy to the TeV-PeV neutrinos observed by IceCube. Investigating whether there is a correlation between the gamma-ray and neutrino observations can help us identify high-energy neutrino sources and determine which sources are the main contributors to the all-sky diffuse neutrino flux of IceCube. In previous work, we have already studied the possible gamma-neutrino correlations by analyzing 10 years of IceCube muon-track data. In this work, we further investigate such correlations by employing the IceCube p-value sky map of the scan for point sources. We examine the spatial associations of hotspots in the neutrino sky map with various gamma-ray source samples: the third Fermi-LAT catalog of high-energy sources (3FHL), LAT 14-year source catalog (4FGL), the fourth catalog of active galactic nuclei (4LAC) and subsets of these samples. Among all the samples, the 3FHL sample shows a possible correlation with the neutrino hotspots, with a pre-trial p-value of (). However, this is found to be caused by three already known neutrino sources/source candidates: NGC 1068, TXS 0506+056, and PKS 1424+240. In order to validate our analysis procedure and to test the robustness of the previously claimed correlation between the 5BZCAT blazars and neutrino hotspots, we also consider 5BZCAT blazars in our correlation study. We find that the way in which mock sources are generated in the simulation used to derive the chance coincidence probability may have a large impact on the claimed correlation.
I Introduction
The TeV-PeV diffuse astrophysical neutrino flux detected by IceCube Aartsen et al. (2013a, 2014a, 2015a, 2016, 2020a); Abbasi et al. (2021a, 2022a) opens a new window for astrophysics Kistler and Beacom (2006); Beacom and Kistler (2007); Murase et al. (2011); Murase and Ioka (2013); Murase et al. (2013); Ahlers and Halzen (2014); Tamborra et al. (2014); Murase et al. (2014); Bechtol et al. (2017); Kistler and Laha (2018); Bartos et al. (2017); Sudoh et al. (2018); Bartos et al. (2019); Bustamante and Ahlers (2019); Hovatta et al. (2021) and particle physics Beacom et al. (2003); Gonzalez-Garcia et al. (2005); Hooper et al. (2005); Ioka and Murase (2014); Ng and Beacom (2014); Aartsen et al. (2017a); Bustamante and Connolly (2019); Zhou and Beacom (2020a, b, 2022); Aartsen et al. (2021); Guo et al. (2023); Lü et al. (2024). However, it is still not clear what astrophysical objects these neutrinos mainly originate from. A large number of works have been carried out to identify the sources of these astrophysical neutrinos Abbasi et al. (2011); Aartsen et al. (2013b, 2014b); Adrian-Martinez et al. (2016); Aartsen et al. (2017b, c, 2019a, 2020b, 2019b, 2020c). The two most promising sources of TeV-PeV neutrinos discovered by IceCube are TXS 0506+056 and NGC 1068 Aartsen et al. (2018a, b, 2020b); Abbasi et al. (2022b). TXS 0506+056 is found to be temporally and spatially correlated with a 300 TeV IceCube neutrino event IC-170922A Aartsen et al. (2018a); furthermore, a neutrino flare from the direction of TXS 0506+056 was detected between 2014 and 2015 Aartsen et al. (2018b). In a time-integrated analysis of searching for neutrino point sources using IceCube data between 2011 and 2020, neutrino emission from the Seyfert galaxy NGC 1068 Abbasi et al. (2022b) is found with a global significance of . More recently, the IceCube Collaboration reported the detection of neutrino emission from the Galactic plane using cascade events with a significance up to 4.7 Abbasi et al. (2023).
However, the above two point sources and the emission from the Galactic plane contribute only a small fraction of the entire diffuse astrophysical neutrino flux of IceCube, with the origin of the majority of the flux unclear. The high-energy neutrinos detected by IceCube are most likely to be generated by a large number of unresolved extragalactic sources. Many types of astrophysical sources have been considered as high-energy neutrino sources, including gamma-ray bursts Waxman and Bahcall (1997); Abbasi et al. (2010); He et al. (2012); Aartsen et al. (2015b), star-forming galaxies and starburst galaxies Loeb and Waxman (2006); He et al. (2013); Lunardini et al. (2019), blazars and non-blazar active galactic nuclei (AGNs) Stecker et al. (1991); Halzen and Zas (1997); Atoyan and Dermer (2001), tidal disruption events Wang and Liu (2016), and some other objects Pasumarti and Desai (2024); Bouri et al. (2024). Most of the works that search for neutrino emission from these objects display no significant signals, and therefore they are ruled out as only/primary sources of IceCube’s diffuse neutrino emission. For instance, by analyzing the IceCube observations toward the directions of gamma-ray blazars, Refs. Aartsen et al. (2017d); Hooper et al. (2019); Smith et al. (2021); Yuan et al. (2020) found that such a population of sources can contribute at most 15% of the diffuse neutrino flux. Zhou et al. (2021) studied the correlation between the radio-bright AGNs and TeV-PeV IceCube neutrinos, finding no strong correlation between them, implying these radio-bright AGNs contribute no more than 30% of the all-sky diffuse neutrino emission.
Recently, there have been some works on identifying high-energy neutrino sources displaying positive results. Ref. Neronov et al. (2024) selected two nearby Seyfert galaxies according to the intrinsic luminosity in the X-ray energy band and searched for neutrino emission from the two sources using 10 years of IceCube public muon-track data. Evidence of neutrino signals from both sources is found which supports that Seyfert galaxies are one population of TeV-PeV neutrino emitters. Refs. Stein et al. (2021); Reusch et al. (2022); van Velzen et al. (2024) performed ZTF follow-up observations of IceCube neutrino alert events and found that the tidal disruption events (TDEs) AT2019dsg, AT2019fdr, and AT2019aalc are temporally and spatially correlated with IC191001A, IC200530A, and IC191119A, respectively, implying that TDEs are likely to be an important class of neutrino sources. Note however that Liao et al. (2022) suggests the event IC-191001A is possibly related to the blazar GB6 J2113+1121 instead of AT2019dsg. By comparing the spatial positions of blazars with those of the IceCube alert events or the hotspots in the p-value skymaps of neutrino point source scan, several works Plavin et al. (2023); Buson et al. (2022, 2023) claim that there exists high confidence evidence proving that blazars are a population of extragalactic neutrino sources. However, a subsequent study argued that the strong correlation could be due to a statistical fluctuation and possibly the spatial and flux nonuniformities in the blazar sample Bellenghi et al. (2023).
This work will investigate the correlation between IceCube neutrinos and Fermi-LAT gamma-ray sources. The motivation is that high-energy astrophysical neutrinos are expected to be generated in a hadronic process, so that gamma rays will always be produced simultaneously accompanying the neutrino production. Since TeV-PeV gamma rays are severely absorbed by background radiation fields, for most extragalactic sources, the GeV-TeV gamma-ray observations from Fermi-LAT are the messengers with energies closest to the TeV-PeV neutrinos observed by IceCube. In our previous work, we have investigated the correlations between various Fermi-LAT gamma-ray samples and IceCube neutrinos Li et al. (2022). Some other analyses on Fermi-LAT catalogs using IceCube data include Refs.Aartsen et al. (2017d); Hooper et al. (2019); Smith et al. (2021); Huber (2020); Luo and Zhang (2020); Abbasi et al. (2021b, 2022c, c). This work will continue to test whether there exists a correlation between the GeV-TeV observations of Fermi-LAT and the IceCube neutrino observations. The difference from the previous work, Li et al. (2022) (hereafter L22), is that L22 handles directly the 10-year IceCube muon-track data using a likelihood ratio method and search for excess signals from the directions of Fermi-LAT gamma-ray point sources. In this work, we adopt an alternative approach as in Refs. Buson et al. (2022, 2023) (hotspots analysis), which claim the finding of evidence of correlation by comparing the spatial positions of the 5th edition of the Roma-BZCAT Multifrequency Catalogue (5BZCAT) of Blazars with the hotspots in the IceCube p-value sky map. The sky map is obtained from the northern-sky blind searches of neutrino point sources Abbasi et al. (2022b).
Advantages of the hotspots analysis compared to the direct likelihood analysis of 10 years of muon-track data (likelihood analysis) include: at present only the muon-track data in the 2008-2018 period is publicly released, while the p-value sky map from Ref. Abbasi et al. (2022b) is based on the data in the period 2011-2022, the hotspots analysis allows for the utilization of newer IceCube observations with higher sensitivity. In addition, if there exist systematic biases in the neutrino source localization that cause the neutrino signal to deviate from the true source position, a direct likelihood search at the source position would yield a null result even if the signal exceeds the background, whereas the hotspots analysis could take this into account by introducing an association radius. The hotspots analysis also does not require a priori assumptions of weighting factors.
We will search for evidence of correlations between various Fermi-LAT gamma-ray samples and IceCube neutrino hotspots. The gamma-ray catalogs/samples considered in this work include: the third Fermi-LAT catalog of high-energy sources (3FHL), LAT 14-year source catalog (4FGL), the fourth catalog of active galactic nuclei (4LAC) and subsets of these catalogs.
| Catalog Name | Energy Rangea | ||||||
| 4FGL-DR4 | 50 MeV-1 TeV | 5050 | 1.37 10-3 | 47 | 1.3 | 3.0 | 48 |
| 4FGL-DR4 Blazars | 3475 | 1.10 10-3 | 37 | 1.2 | 3.0 | 41 | |
| 4FGL-DR4 BL Lacs | 1407 | 1.32 10-3 | 27 | 1.35 | 3.0 | 27 | |
| 4FGL-DR4 FSRQs | 783 | 2.82 10-1 | 4 | 1.15 | 3.5 | 7 | |
| 4LAC-DR3 | 50 MeV-1 TeV | 3407 | 8.80 10-4 | 37 | 1.2 | 3.0 | 41 |
| 4LAC-DR3 Blazars | 3342 | 4.40 10-4 | 37 | 1.2 | 3.0 | 41 | |
| 4LAC-DR3 BL Lacs | 1379 | 1.52 10-3 | 3 | 0.2 | 3.5 | 26 | |
| 4LAC-DR3 FSRQs | 755 | 2.97 10-1 | 1 | 0.6 | 4.0 | 6 | |
| 3FHL | 10 GeV-2 TeV | 1216 | 1.10 10-4 | 3 | 0.25 | 4.0 | 20 |
| 3FHL Blazars | 1080 | 4.40 10-4 | 2 | 0.2 | 4.0 | 19 | |
| 3FHL BL Lacs | 697 | 5.00 10-4 | 2 | 0.2 | 4.0 | 17 | |
| 3FHL FSRQs | 165 | 1.37 10-1 | 2 | 1.15 | 3.5 | 2 | |
| BZcat | - | 3461 | 7.50 10-4 | 37 | 1.1 | 3.0 | 44 |
-
•
a The energy range of the Fermi-LAT data used to construct the catalog.
-
•
b Number of sources included in the sample. The sources categorized as pulsars or in the region have been excluded.
-
•
c The minimum p-value in the correlation analysis.
-
•
d The number of associations between Fermi-LAT/BZcat catalogs and neutrino hotspots corresponding to the minimum p-value.
-
•
e The and values that lead to the minimum p-value.
-
•
f The maximum association number corresponding to = 1.4∘.
II Fermi-LAT gamma-ray samples
The Large Area Telescope (LAT) on board the Fermi satellite is a wide field-of-view (FOV) imaging gamma-ray telescope, which detects gamma-ray photons in the energy range from to Atwood et al. (2009). Since 2008, the Fermi-LAT continuously surveys the entire sky. Its observation period and FOV overlap with the IceCube observation considerably. With more than 16 years of observations, a variety of source catalogs of Fermi-LAT have been compiled and released. To investigate the correlations between GeV-TeV gamma-ray sources and TeV-PeV neutrinos, we consider the following Fermi-LAT samples.
Among all the Fermi-LAT catalogs, the sources contained in the Third Catalog of Hard Fermi-LAT Sources (3FHL sample)111https://fermi.gsfc.nasa.gov/ssc/data/access/lat/3FHL/ Ajello et al. (2017) represent the hardest population of GeV gamma-ray sources, which are therefore more likely to be a hadronic origin. The 3FHL is constructed based on 7 years of Fermi-LAT data in the 10 GeV-2 TeV energy range Ajello et al. (2017). Besides the 3FHL, other samples considered in this work include, the gamma-ray sources of the fourth Fermi-LAT catalog (4FGL-DR4, for Data Release 4)222https://fermi.gsfc.nasa.gov/ssc/data/access/lat/14yr_catalog/ Abdollahi et al. (2020, 2022) and the fourth catalog of active galatic nuclei (4LAC-DR3, for Data Release 3)333https://fermi.gsfc.nasa.gov/ssc/data/access/lat/4LACDR3/ Ajello et al. (2020). We also consider some subsamples. A blazar subsample contains all sources classified as blazars in the catalog. Blazars are further divided into two subclasses: flat spectrum radio quasars (FSRQs) and BL Lacertae objects (BL Lacs). Totally, there are three subsamples (Blazar, BL Lac, FSRQ).
All these samples are summarized in Table 1. For each sample, we exclude the sources categorized as pulsars (PSRs) from the catalog. To avoid the complexity of the Galactic Plane, we only select sources from the catalogs.
III Analysis Method
The IceCube Neutrino Observatory detects neutrinos by detecting the Cherenkov light emitted by relativistic secondary charged particles from neutrino interactions Achterberg et al. (2006). In Ref. Abbasi et al. (2022b), IceCube Collaboration performed a blind search for high-energy neutrino point sources in the northern sky using the IceCube muon-track data from 2011 to 2020. They binned the entire sky into 786432 pixels (i.e. healpix pixelization with nside=256), and placed a putative neutrino point source at the center of each pixel for all pixels with . A likelihood analysis is performed to derive the statistical significance of existing excess neutrino emission at the corresponding position. A p-value sky map is obtained from this search. The significance of the neutrino excess is represented by a value, where is the p-value, i.e. the probability of obtaining the observed result due to a background fluctuation. We follow Plavin et al. (2023) and Buson et al. (2022) to denote the negative logarithm of local p-values mapping the neutrino sky as to avoid confusion with the p-values in the later correlation analyses. A larger value means a more significant neutrino excess beyond the background at that direction and thus a higher probability of the existence of a real neutrino source. So the points with large can be regarded as neutrino point source candidates.
In this work, we adopt this p-value sky map of Ref. Abbasi et al. (2022b) which is based on the 2011-2020 data and covers the northern sky of . We first define the hotspots in the sky map to be used for subsequent analysis. For better comparison with previous results, we use the same criteria for defining hotspots as in Ref. Buson et al. (2023). The hotspots in the p-value skymap are defined as the pixels with large values. We pick out the pixels in the sky map with (i.e. ) larger than a certain predefined threshold (). Adjacent pixels within a small region will be treated as one hotspot, namely two independent hotspots are required to have an angular distance of ( is the median angular uncertainty of the muon-track data of IceCube Abbasi et al. (2022b); Buson et al. (2023)). Different choices of lead to varying numbers of hotspots. We consider three values: 3.0, 3.5, and 4.0, which result in 81, 34, and 17 hotspots, respectively. The same as Ref. Buson et al. (2023), we only consider the hotspots with . After the Galactic plane cut, 66, 29 and 13 hotspots remain for , , and , well consistent with the hotspot numbers in Ref. Buson et al. (2023).
If the angular distance between a source and its nearest hotspot is less than a certain radius , we treat this source and the hotspot as positional associated. To be conservative, one neutrino hotspot will be matched with only one source at most. We scan all sources in the catalog and count the number of associations. We only consider the sources with and where is the declination. To know whether an association number can be interpreted as a chance coincidence or it implies a high confidence correlation between the catalog and the neutrino hotspots, we carry out Monte Carlo simulation to give the p-value corresponding to the association number . In the simulation, we keep the positions of the hotspots unchanged and randomly generate pseudo sources. For each simulation, the number of pseudo sources is the same as that of the real catalog.
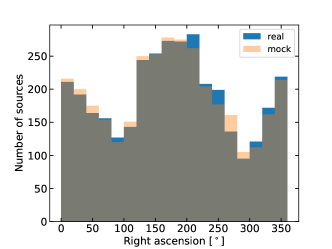
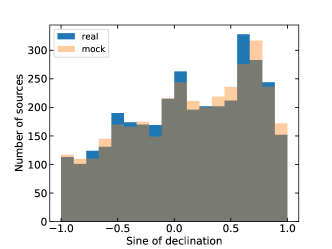
Considering that the Fermi-LAT gamma-ray sources are more symmetrically distributed in Galactic coordinates, we generate the longitudes and latitudes for mock sources in Galactic coordinates. To guarantee the generated mock source list has the same and distributions as those of the real catalog, we each time directly sample an from the real list and a from the real list. We obtain a pair by this way. Further, we impose an additional random shift to within a circle region of radius. The final coordinates of the mock source are , where and . Because the random shift is small, the mock source catalog generated in this way has almost identical spatial distribution as the real catalog (see Fig. 1 for a demonstration). Then we apply the and cuts, and perform absolutely the same correlation analysis with the hotspots. For each simulation, we obtain an association number . We run simulations, and the p-value corresponding to the associations of the real catalog can be derived based on the distribution of .
IV Results
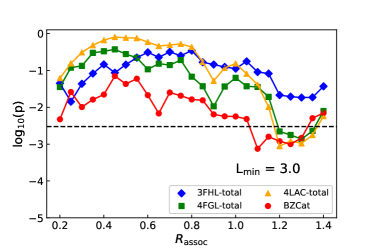
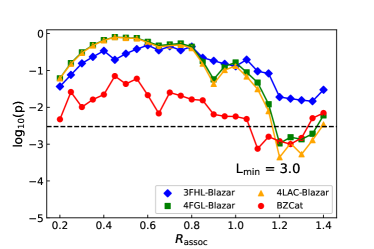
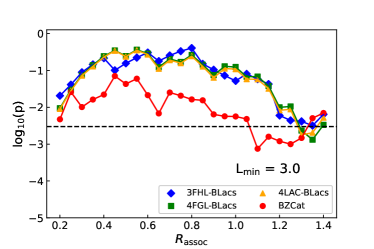
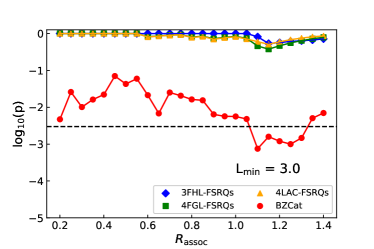
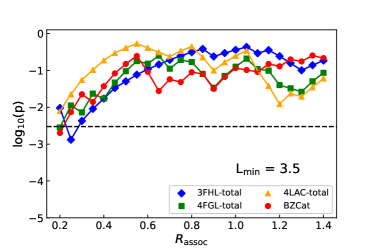
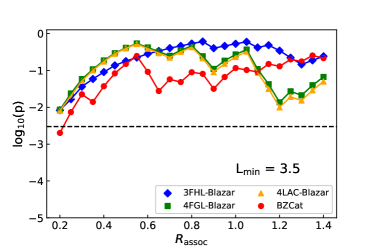
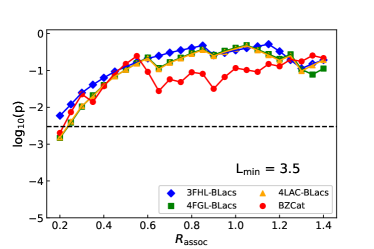
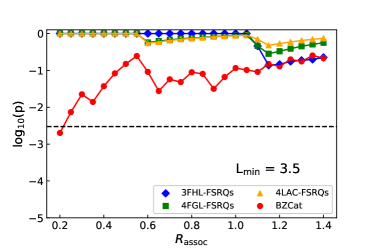
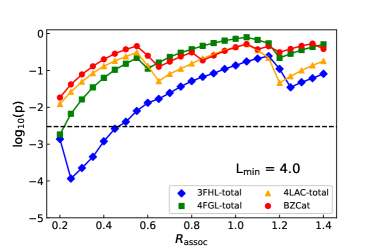
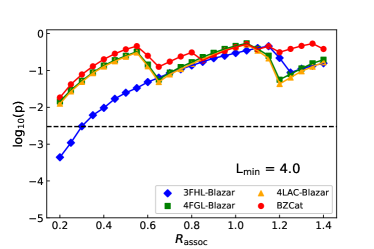
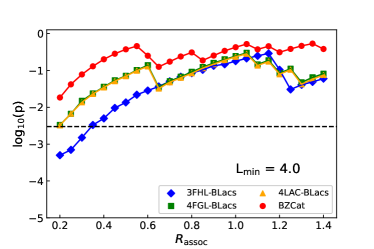
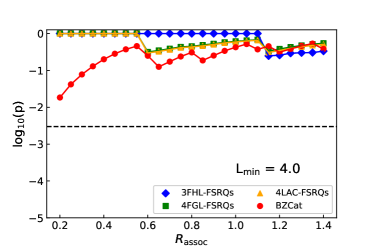
Utilizing the analysis method described above, we investigate the correlations between various Fermi-LAT gamma-ray source catalogs and IceCube neutrino hotspots. We consider 4FGL, 4LAC and 3FHL catalogs and some subsamples of them. A blazar subsample contains all sources classified as blazars in the catalog. We also further divide the blazars into two subclasses: flat spectrum radio quasars (FSRQs) and BL Lacertae objects (BL Lacs). Totally, we perform the analyses for three subsamples (Blazar, BL Lac, FSRQ). The results of our analyses are presented in Fig.2, Fig.3 and Fig.4, in which we show the local p-value, , for different choices of and . The minimum p-value for each sample and the corresponding association number are listed in Table 1.
We find that most samples except the FSRQ ones yield minimum p-values of . Among all the analyses, the 3FHL catalog shows the most significant correlation with the neutrino hotspots, , corresponding to a pre-trial significance of . Besides this, the second lowest p-value of comes from the analysis of 4LAC blazars.
Because we change/attempt different and in the analysis of each catalog, implying that we have introduced multiple trials, this effect should be considered and corrected to convert the local p-value to a global post-trial p-value. The post-trial p-value can be obtained by
| (1) |
where is the number of trials. We have considered 3 different and 25 different , so . After the trial correction, the above p-values of (for 3FHL TOTAL) and (for 4LAC blazars) correspond to post-trial significances of 2.6 and 2.1 , respectively. The post-trial significances of other samples will be even lower.
However, it is important to note that if the localization does not have significant systematic errors, a smaller in the correlation analysis is more preferred, and the mean spacing of pixels is for a pixelization of nside=256. Therefore, in the 3FHL-hotspot correlation the that yields the minimum p-value is the most natural/reasonable value of . In this case, we believe it is actually not needed to introduce the trial number related to , making the post significance being . Correcting further for having tested 12 samples in this work, the final post-trial significance reduces to .
We next examine which sources in the 3FHL sample are associated with neutrino hotspots, and lead to the relatively small p-value of . In Table 2 we list the three sources in 3FHL that are associated with the hotspots. We can see that, all three sources are those ones that have already been reported to be neutrino sources/source candidates in previous works Aartsen et al. (2018a, b, 2020b); Abbasi et al. (2021c, 2022b). Therefore, we do not identify any new neutrino source candidate. Nevertheless, considering the moderately high significance in the population analysis ( after trial correction), it may still hint there exists a connection between the high-energy gamma-ray and neutrino emissions. This is reasonable, since a neutrino emission represents the presence of accelerated particles, and inevitably has the ability to radiate gamma rays. Identifying high-energy neutrino sources in gamma-ray samples, as has been done in many previous works, may be a valid strategy.
| 3FHL name | RA | DEC | Counterpart | RA | DEC | ||
| 3FHL J1427.0+2348 | 216.76 | 23.80 | PKS 1424+240 | 216.91 | 23.81 | 4.18 | 0.143 |
| 3FHL J0509.4+0542 | 77.36 | 5.71 | TXS 0506+056 | 77.34 | 5.53 | 4.13 | 0.178 |
| 3FHL J0242.7-0.002 | 40.68 | NGC 1068 | 40.78 | 0.15 | 6.75 | 0.219 |
-
•
a The angular separation between the 3FHL position and the position of the hotspot.
V Discussion
V.1 Constraints on the contribution to IceCube’s diffuse neutrino flux
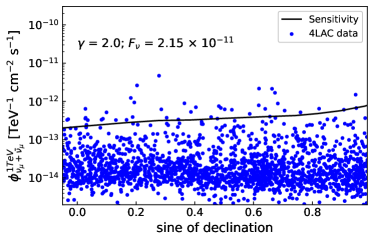
If we know the sensitivity of 2011-2020 data for point-source/hotspot detections, by assuming a relation between the neutrino flux and the gamma-ray flux or the source distance (namely the weighting factor in our previous works Zhou et al. (2021); Li et al. (2022)), for any catalog we can also derive its maximum contribution to the diffuse neutrino flux based on the analysis in this work. For example, in the case of , the 4LAC catalog maximally has 41 sources (for , see Table 1) that are associated with neutrino hotspots, meaning that IceCube has detected no more than 41 4LAC sources with . By assuming the neutrino flux is proportional to a certain quantity (i.e. gamma-ray flux or source distance ) and requiring that the expected neutrino fluxes exceed the detection sensitivity for exactly 41 sources, we can then determine the relationship between the neutrino flux and . More specifically, we assume with being or , then we can change to make just only 41 sources have beyond the sensitivity curve in the Northern sky. The whole catalog’s contribution to the diffuse neutrino flux can be estimated by summing the fluxes of all sources in the catalog together, .
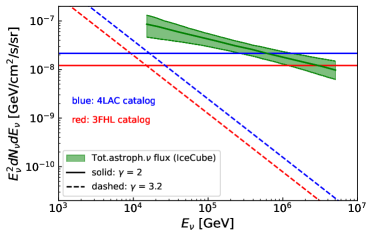
Using the sensitivity curve in Ref. Abbasi et al. (2022b) (see Figure S11 of the Supplementary Materials), we estimate the maximum fractions that the gamma-ray samples can contribute to the total IceCube diffuse neutrino flux, which are shown in Fig. 5. We find the constraints are weaker than those in L22. However, it should be noted that the results given by this method are potentially too conservative (since we believe a large proportion of the 41 associations are not real physical associations but chance coincidences).
V.2 Correlation study with 5BZCAT sources
This work adopts a similar analysis method of Ref. Buson et al. (2023), which mainly studies the correlation between neutrino hotspots and blazars of the 5BZCAT catalog and claims a significant spatial correlation between the two (post-trial for the northern-sky analysis and if combining the northern and southern results). To test our analysis pipeline and to verify the robustness of the claimed 5BZCAT-neutrino correlation, we also perform analysis using the 5BZCAT catalog. The analysis procedure is the same as the above analysis of Fermi-LAT gamma-ray samples, only changing the source list to 5BZCAT. The red line in Fig. 6 demonstrates the results of the 5BZCAT-neutrino correlation analysis.
As we can see, the obtained in our analysis is larger than the one () reported in Ref. Buson et al. (2023). We discuss the possible reason causing the difference. The only point throughout our analysis that differs from Ref. Buson et al. (2023) is that in the simulation of deriving the p-value, we assign positions to mock sources in different ways. Their Monte Carlo catalogs are generated by randomly shifting the sky position of the catalog sources within from their original position. While we independently sample and from the list and list of the real sources, and the are shifted within , smaller than their region. If using exactly the same approach of generating mock sources as in Ref. Buson et al. (2023), we get the result as shown as the yellow line in Fig. 6, which now coincides with their result.
To further investigate how large the manner of generating mock sources would affect the obtained p-value, we test some other methods of yielding the mock sources in the simulation. They are: (1) keep sources’ positions unchanged while randomly altering the hotspots’ RA within ; (2) randomize the 5BZCAT sources within radius from their original positions; (3) randomly shift the 5BZCAT sources within radius and meanwhile randomize the RA of the hotspots. The corresponding results are depicted in Fig. 6, represented by black, green, and blue lines, respectively.
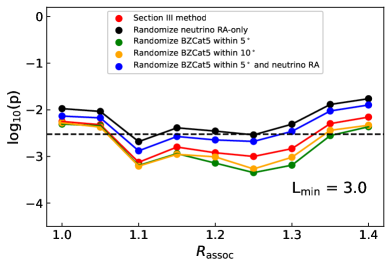
As shown in the figure, employing different simulation strategies yields minimum p-values in the range of , corresponding to significances between 3.0 and . Taking into account a total of trials, the post-trial p-values (significances) will be (1.8 to ). However, it’s worth noting, as pointed out by Ref. Bellenghi et al. (2023), that the choice of the prior range for in Ref. Buson et al. (2023) lacks strong justification. The large association radius of that leads to the minimum p-value is also not supported by the simulation analysis in Ref. Bellenghi et al. (2023), putting the reality of such associations in doubt. The only plausible explanation for such large is the presence of significant systematic errors in IceCube’s localization (though it should be noted that this possibility is not supported by the observations of TXS 0506+056 and NGC 1068). If the large is caused by / interpreted as systematic errors, the trials in the [0.2, 1.0] range should also be considered. Using a trial number of 75 as in this work, the significance will be much lower, just 1.3 to for the northern-sky analysis.
Therefore, the analysis in this section demonstrates the way in which mock sources are generated in the simulation used to derive the chance coincidence probability may have a large impact on the claimed correlation.
VI Summary
Currently, the observational connection between astrophysical sources’ gamma-ray and neutrino emissions is still obscure. For instance, the neutrino flare of TXS 0506+056 occurred during a low gamma-ray state Padovani et al. (2018); Garrappa et al. (2019), and another confirmed neutrino source NGC1068 exhibits relatively low gamma-ray flux in the Fermi-LAT observations Ajello et al. (2023); Ji et al. (2024). However, considering that the proton-proton and proton- processes that produce neutrinos will simultaneously accompany the production of gamma rays, the correlation between neutrino and gamma-ray observations is worth investigating. The GeV-TeV gamma rays observed by Fermi-LAT are the messengers with energies closest to IceCube’s TeV-PeV neutrinos. Hence, this work investigates the correlation between Fermi-LAT gamma-ray catalogs/samples and IceCube neutrino observations and is a follow-up to our last research Li et al. (2022). We conduct spatial correlation analysis between various gamma-ray samples (4FGL Abdollahi et al. (2020), 4LAC Ajello et al. (2020), 3FHL Ajello et al. (2017), etc.) and the hotspots in the IceCube p-value sky map of neutrino point-source scan (taken from Abbasi et al. (2022b)). By examining whether the number of source-hotspot associations significantly deviates from the expectation of complete chance coincidence, we probe the relationship between gamma-ray source samples and neutrino hotspots. Our results reveal weak evidence of a correlation between the 3FHL gamma-ray sample and neutrino hotspots, with a confidence level of . The significances given by other samples are not significant, especially after considering the correction of trial factors. By examining the associated sources in 3FHL, we find that the relatively high-confidence correlation is mainly contributed by three already known neutrino sources/source candidates: TXS 0506+056, NGC 1068, and PKS 1424+240. That is, we do not discover any new potential neutrino source of neutrino emission. However, considering the moderately high significance given by the population analysis, it may still indicate a possible correlation between hard gamma-ray sources and IceCube neutrinos. Identifying high-energy neutrino sources in samples such as 3FHL and the TeV catalog Wakely and Horan (2008) might be a promising strategy.
Acknowledgements.
This work is supported by the National Key Research and Development Program of China (Grant No. 2022YFF0503304).References
- Aartsen et al. (2013a) M. G. Aartsen et al. (IceCube Collaboration), “Evidence for High-Energy Extraterrestrial Neutrinos at the IceCube Detector,” Science 342, 1242856 (2013a), arXiv:1311.5238.
- Aartsen et al. (2014a) M. G. Aartsen et al. (IceCube Collaboration), “Observation of High-Energy Astrophysical Neutrinos in Three Years of IceCube Data,” Phys. Rev. Lett. 113, 101101 (2014a), arXiv:1405.5303.
- Aartsen et al. (2015a) M. G. Aartsen et al. (IceCube Collaboration), “A combined maximum-likelihood analysis of the high-energy astrophysical neutrino flux measured with IceCube,” Astrophys. J. 809, 98 (2015a), arXiv:1507.03991.
- Aartsen et al. (2016) M. G. Aartsen et al. (IceCube Collaboration), “Observation and Characterization of a Cosmic Muon Neutrino Flux from the Northern Hemisphere using six years of IceCube data,” Astrophys. J. 833, 3 (2016), arXiv:1607.08006.
- Aartsen et al. (2020a) M. G. Aartsen et al. (IceCube Collaboration), “Characteristics of the diffuse astrophysical electron and tau neutrino flux with six years of IceCube high energy cascade data,” Phys. Rev. Lett. 125, 121104 (2020a), arXiv:2001.09520.
- Abbasi et al. (2021a) R. Abbasi et al. (IceCube Collaboration), “The IceCube high-energy starting event sample: Description and flux characterization with 7.5 years of data,” Phys. Rev. D 104, 022002 (2021a), arXiv:2011.03545.
- Abbasi et al. (2022a) R. Abbasi et al. (IceCube Collaboration), “Improved Characterization of the Astrophysical Muon–neutrino Flux with 9.5 Years of IceCube Data,” Astrophys. J. 928, 50 (2022a), arXiv:2111.10299.
- Kistler and Beacom (2006) M. D. Kistler and J. F. Beacom, “Guaranteed and Prospective Galactic TeV Neutrino Sources,” Phys. Rev. D 74, 063007 (2006), arXiv:astro-ph/0607082.
- Beacom and Kistler (2007) J. F. Beacom and M. D. Kistler, “Dissecting the Cygnus Region with TeV Gamma Rays and Neutrinos,” Phys. Rev. D 75, 083001 (2007), arXiv:astro-ph/0701751.
- Murase et al. (2011) K. Murase, T. A. Thompson, B. C. Lacki, and J. F. Beacom, “New Class of High-Energy Transients from Crashes of Supernova Ejecta with Massive Circumstellar Material Shells,” Phys. Rev. D 84, 043003 (2011), arXiv:1012.2834.
- Murase and Ioka (2013) K. Murase and K. Ioka, “TeV–PeV Neutrinos from Low-Power Gamma-Ray Burst Jets inside Stars,” Phys. Rev. Lett. 111, 121102 (2013), arXiv:1306.2274.
- Murase et al. (2013) K. Murase, M. Ahlers, and B. C. Lacki, “Testing the Hadronuclear Origin of PeV Neutrinos Observed with IceCube,” Phys. Rev. D 88, 121301 (2013), arXiv:1306.3417.
- Ahlers and Halzen (2014) M. Ahlers and F. Halzen, “Pinpointing Extragalactic Neutrino Sources in Light of Recent IceCube Observations,” Phys. Rev. D 90, 043005 (2014), arXiv:1406.2160.
- Tamborra et al. (2014) I. Tamborra, S. Ando, and K. Murase, “Star-forming galaxies as the origin of diffuse high-energy backgrounds: Gamma-ray and neutrino connections, and implications for starburst history,” JCAP 09, 043 (2014), arXiv:1404.1189.
- Murase et al. (2014) K. Murase, Y. Inoue, and C. D. Dermer, “Diffuse Neutrino Intensity from the Inner Jets of Active Galactic Nuclei: Impacts of External Photon Fields and the Blazar Sequence,” Phys. Rev. D 90, 023007 (2014), arXiv:1403.4089.
- Bechtol et al. (2017) K. Bechtol, M. Ahlers, M. Di Mauro, M. Ajello, and J. Vandenbroucke, “Evidence against star-forming galaxies as the dominant source of IceCube neutrinos,” Astrophys. J. 836, 47 (2017), arXiv:1511.00688.
- Kistler and Laha (2018) M. D. Kistler and R. Laha, “Multi-PeV Signals from a New Astrophysical Neutrino Flux Beyond the Glashow Resonance,” Phys. Rev. Lett. 120, 241105 (2018), arXiv:1605.08781.
- Bartos et al. (2017) I. Bartos, M. Ahrens, C. Finley, and S. Marka, “Prospects of Establishing the Origin of Cosmic Neutrinos using Source Catalogs,” Phys. Rev. D 96, 023003 (2017), arXiv:1611.03861.
- Sudoh et al. (2018) T. Sudoh, T. Totani, and N. Kawanaka, “High-energy gamma-ray and neutrino production in star-forming galaxies across cosmic time: Difficulties in explaining the IceCube data,” Publ. Astron. Soc. Jap. 70, Publications of the Astronomical Society of Japan, Volume 70, Issue 3, 1 June 2018, 49, https://doi.org/10.1093/pasj/psy039 (2018), arXiv:1801.09683.
- Bartos et al. (2019) I. Bartos, D. Veske, A. Keivani, Z. Marka, S. Countryman, E. Blaufuss, C. Finley, and S. Marka, “Bayesian Multi-Messenger Search Method for Common Sources of Gravitational Waves and High-Energy Neutrinos,” Phys. Rev. D 100, 083017 (2019), arXiv:1810.11467.
- Bustamante and Ahlers (2019) M. Bustamante and M. Ahlers, “Inferring the flavor of high-energy astrophysical neutrinos at their sources,” Phys. Rev. Lett. 122, 241101 (2019), arXiv:1901.10087.
- Hovatta et al. (2021) T. Hovatta et al., “Association of IceCube neutrinos with radio sources observed at Owens Valley and Metsähovi Radio Observatories,” Astron. Astrophys. 650, A83 (2021), arXiv:2009.10523.
- Beacom et al. (2003) J. F. Beacom, N. F. Bell, D. Hooper, S. Pakvasa, and T. J. Weiler, “Decay of High-Energy Astrophysical Neutrinos,” Phys. Rev. Lett. 90, 181301 (2003), arXiv:hep-ph/0211305.
- Gonzalez-Garcia et al. (2005) M. C. Gonzalez-Garcia, F. Halzen, and M. Maltoni, “Physics reach of high-energy and high-statistics icecube atmospheric neutrino data,” Phys. Rev. D 71, 093010 (2005), arXiv:hep-ph/0502223.
- Hooper et al. (2005) D. Hooper, D. Morgan, and E. Winstanley, “Lorentz and CPT invariance violation in high-energy neutrinos,” Phys. Rev. D 72, 065009 (2005), arXiv:hep-ph/0506091.
- Ioka and Murase (2014) K. Ioka and K. Murase, “IceCube PeV–EeV neutrinos and secret interactions of neutrinos,” PTEP 2014, 061E01 (2014), arXiv:1404.2279.
- Ng and Beacom (2014) K. C. Y. Ng and J. F. Beacom, “Cosmic neutrino cascades from secret neutrino interactions,” Phys. Rev. D 90, 065035 (2014), [Erratum: Phys.Rev.D 90, 089904 (2014)], arXiv:1404.2288.
- Aartsen et al. (2017a) M. G. Aartsen et al. (IceCube Collaboration), “Measurement of the multi-TeV neutrino cross section with IceCube using Earth absorption,” Nature 551, 596 (2017a), arXiv:1711.08119.
- Bustamante and Connolly (2019) M. Bustamante and A. Connolly, “Extracting the Energy-Dependent Neutrino-Nucleon Cross Section above 10 TeV Using IceCube Showers,” Phys. Rev. Lett. 122, 041101 (2019), arXiv:1711.11043.
- Zhou and Beacom (2020a) B. Zhou and J. F. Beacom, “Neutrino-nucleus cross sections for W-boson and trident production,” Phys. Rev. D 101, 036011 (2020a), arXiv:1910.08090.
- Zhou and Beacom (2020b) B. Zhou and J. F. Beacom, “W-boson and trident production in TeV–PeV neutrino observatories,” Phys. Rev. D 101, 036010 (2020b), arXiv:1910.10720.
- Zhou and Beacom (2022) B. Zhou and J. F. Beacom, “Dimuons in neutrino telescopes: New predictions and first search in IceCube,” Phys. Rev. D 105, 093005 (2022), arXiv:2110.02974.
- Aartsen et al. (2021) M. G. Aartsen et al. (IceCube Collaboration), “Detection of a particle shower at the Glashow resonance with IceCube,” Nature 591, 220 (2021), [Erratum: Nature 592, E11 (2021)], arXiv:2110.15051.
- Guo et al. (2023) X.-K. Guo, Y.-F. Lü, Y.-B. Huang, R.-L. Li, B.-Y. Zhu, and Y.-F. Liang, “Searching for dark-matter induced neutrino signals in dwarf spheroidal galaxies using 10 years of IceCube public data,” Phys. Rev. D 108, 043001 (2023), arXiv:2306.02675.
- Lü et al. (2024) Y.-F. Lü, B.-Y. Zhu, R.-L. Li, X.-K. Guo, T.-C. Liu, Y.-B. Huang, and Y.-F. Liang, “Dark Matter Search in Dwarf Irregular Galaxies with Ten Years of Data from the IceCube Neutrino Observatory,” Res. Astron. Astrophys. 24, 035008 (2024), arXiv:2401.06571.
- Abbasi et al. (2011) R. Abbasi et al. (IceCube Collaboration), “Time-Integrated Searches for Point-like Sources of Neutrinos with the 40-String IceCube Detector,” Astrophys. J. 732, 18 (2011), arXiv:1012.2137.
- Aartsen et al. (2013b) M. G. Aartsen et al. (IceCube Collaboration), “Search for Time-independent Neutrino Emission from Astrophysical Sources with 3 yr of IceCube Data,” Astrophys. J. 779, 132 (2013b), arXiv:1307.6669.
- Aartsen et al. (2014b) M. G. Aartsen et al. (IceCube Collaboration), “Searches for Extended and Point-like Neutrino Sources with Four Years of IceCube Data,” Astrophys. J. 796, 109 (2014b), arXiv:1406.6757.
- Adrian-Martinez et al. (2016) S. Adrian-Martinez et al. (ANTARES, IceCube Collaboration), “The First Combined Search for Neutrino Point-sources in the Southern Hemisphere With the Antares and Icecube Neutrino Telescopes,” Astrophys. J. 823, 65 (2016), arXiv:1511.02149.
- Aartsen et al. (2017b) M. G. Aartsen et al. (IceCube Collaboration), “All-sky Search for Time-integrated Neutrino Emission from Astrophysical Sources with 7 yr of IceCube Data,” Astrophys. J. 835, 151 (2017b), arXiv:1609.04981.
- Aartsen et al. (2017c) M. G. Aartsen et al. (IceCube Collaboration), “Search for astrophysical sources of neutrinos using cascade events in IceCube,” Astrophys. J. 846, 136 (2017c), arXiv:1705.02383.
- Aartsen et al. (2019a) M. G. Aartsen et al. (IceCube Collaboration), “Search for steady point-like sources in the astrophysical muon neutrino flux with 8 years of IceCube data,” Eur. Phys. J. C 79, 234 (2019a), arXiv:1811.07979.
- Aartsen et al. (2020b) M. G. Aartsen et al. (IceCube Collaboration), “Time-Integrated Neutrino Source Searches with 10 Years of IceCube Data,” Phys. Rev. Lett. 124, 051103 (2020b), arXiv:1910.08488.
- Aartsen et al. (2019b) M. G. Aartsen et al. (IceCube Collaboration), “Search for Sources of Astrophysical Neutrinos Using Seven Years of IceCube Cascade Events,” Astrophys. J. 886, 12 (2019b), arXiv:1907.06714.
- Aartsen et al. (2020c) M. G. Aartsen et al. (IceCube Collaboration), “IceCube Search for High-Energy Neutrino Emission from TeV Pulsar Wind Nebulae,” Astrophys. J. 898, 117 (2020c), arXiv:2003.12071.
- Aartsen et al. (2018a) M. G. Aartsen et al. (IceCube, Fermi-LAT, MAGIC, AGILE, ASAS-SN, HAWC, H.E.S.S., INTEGRAL, Kanata, Kiso, Kapteyn, Liverpool Telescope, Subaru, Swift NuSTAR, VERITAS, VLA/17B-403 Collaboration), “Multimessenger observations of a flaring blazar coincident with high-energy neutrino IceCube-170922A,” Science 361, eaat1378 (2018a), arXiv:1807.08816.
- Aartsen et al. (2018b) M. G. Aartsen et al. (IceCube Collaboration), “Neutrino emission from the direction of the blazar TXS 0506+056 prior to the IceCube-170922A alert,” Science 361, 147 (2018b), arXiv:1807.08794.
- Abbasi et al. (2022b) R. Abbasi et al. (IceCube Collaboration), “Evidence for neutrino emission from the nearby active galaxy NGC 1068,” Science 378, 538 (2022b), arXiv:2211.09972.
- Abbasi et al. (2023) R. Abbasi et al. (IceCube Collaboration), “Observation of high-energy neutrinos from the Galactic plane,” Science 380, adc9818 (2023), arXiv:2307.04427.
- Waxman and Bahcall (1997) E. Waxman and J. N. Bahcall, “High-energy neutrinos from cosmological gamma-ray burst fireballs,” Phys. Rev. Lett. 78, 2292 (1997), arXiv:astro-ph/9701231.
- Abbasi et al. (2010) R. Abbasi et al. (IceCube Collaboration), “Search for muon neutrinos from Gamma-Ray Bursts with the IceCube neutrino telescope,” Astrophys. J. 710, 346 (2010), arXiv:0907.2227.
- He et al. (2012) H.-N. He, R.-Y. Liu, X.-Y. Wang, S. Nagataki, K. Murase, and Z.-G. Dai, “Icecube Nondetection of Gamma-Ray Bursts: Constraints on the Fireball Properties,” Astrophys. J. 752, 29 (2012), arXiv:1204.0857.
- Aartsen et al. (2015b) M. G. Aartsen et al. (IceCube Collaboration), “Search for Prompt Neutrino Emission from Gamma-Ray Bursts with IceCube,” Astrophys. J. Lett. 805, L5 (2015b), arXiv:1412.6510.
- Loeb and Waxman (2006) A. Loeb and E. Waxman, “The Cumulative background of high energy neutrinos from starburst galaxies,” JCAP 05, 003 (2006), arXiv:astro-ph/0601695.
- He et al. (2013) H.-N. He, T. Wang, Y.-Z. Fan, S.-M. Liu, and D.-M. Wei, “Diffuse PeV neutrino emission from ultraluminous infrared galaxies,” Phys. Rev. D 87, 063011 (2013), arXiv:1303.1253.
- Lunardini et al. (2019) C. Lunardini, G. S. Vance, K. L. Emig, and R. A. Windhorst, “Are starburst galaxies a common source of high energy neutrinos and cosmic rays?” JCAP 10, 073 (2019), arXiv:1902.09663.
- Stecker et al. (1991) F. W. Stecker, C. Done, M. H. Salamon, and P. Sommers, “High-energy neutrinos from active galactic nuclei,” Phys. Rev. Lett. 66, 2697 (1991), [Erratum: Phys.Rev.Lett. 69, 2738 (1992)].
- Halzen and Zas (1997) F. Halzen and E. Zas, “Neutrino fluxes from active galaxies: A Model independent estimate,” Astrophys. J. 488, 669 (1997), arXiv:astro-ph/9702193.
- Atoyan and Dermer (2001) A. Atoyan and C. D. Dermer, “High-energy neutrinos from photomeson processes in blazars,” Phys. Rev. Lett. 87, 221102 (2001), arXiv:astro-ph/0108053.
- Wang and Liu (2016) X.-Y. Wang and R.-Y. Liu, “Tidal disruption jets of supermassive black holes as hidden sources of cosmic rays: explaining the IceCube TeV-PeV neutrinos,” Phys. Rev. D 93, 083005 (2016), arXiv:1512.08596.
- Pasumarti and Desai (2024) V. Pasumarti and S. Desai, “A stacked search for spatial coincidences between IceCube neutrinos and radio pulsars,” JCAP 04, 010 (2024), arXiv:2306.03427.
- Bouri et al. (2024) S. Bouri, P. Parashari, M. Das, and R. Laha, “First Search for High-Energy Neutrino Emission from Galaxy Mergers,” (2024), arXiv:2404.06539.
- Aartsen et al. (2017d) M. G. Aartsen et al. (IceCube Collaboration), “The contribution of Fermi-2LAC blazars to the diffuse TeV-PeV neutrino flux,” Astrophys. J. 835, 45 (2017d), arXiv:1611.03874.
- Hooper et al. (2019) D. Hooper, T. Linden, and A. Vieregg, “Active Galactic Nuclei and the Origin of IceCube’s Diffuse Neutrino Flux,” JCAP 02, 012 (2019), arXiv:1810.02823.
- Smith et al. (2021) D. Smith, D. Hooper, and A. Vieregg, “Revisiting AGN as the source of IceCube’s diffuse neutrino flux,” JCAP 03, 031 (2021), arXiv:2007.12706.
- Yuan et al. (2020) C. Yuan, K. Murase, and P. Mészáros, “Complementarity of Stacking and Multiplet Constraints on the Blazar Contribution to the Cumulative High-Energy Neutrino Intensity,” Astrophys. J. 890, 25 (2020), arXiv:1904.06371.
- Zhou et al. (2021) B. Zhou, M. Kamionkowski, and Y.-f. Liang, “Search for High-Energy Neutrino Emission from Radio-Bright AGN,” Phys. Rev. D 103, 123018 (2021), arXiv:2103.12813.
- Neronov et al. (2024) A. Neronov, D. Savchenko, and D. V. Semikoz, “Neutrino Signal from a Population of Seyfert Galaxies,” Phys. Rev. Lett. 132, 101002 (2024).
- Stein et al. (2021) R. Stein et al., “A tidal disruption event coincident with a high-energy neutrino,” Nature Astronomy 5, 510 (2021), arXiv:2005.05340.
- Reusch et al. (2022) S. Reusch et al., “Candidate Tidal Disruption Event AT2019fdr Coincident with a High-Energy Neutrino,” Phys. Rev. Lett. 128, 221101 (2022), arXiv:2111.09390.
- van Velzen et al. (2024) S. van Velzen et al., “Establishing accretion flares from supermassive black holes as a source of high-energy neutrinos,” Mon. Not. Roy. Astron. Soc. 529, 2559 (2024), arXiv:2111.09391.
- Liao et al. (2022) N.-H. Liao, Z.-F. Sheng, N. Jiang, Y.-L. Chang, Y.-B. Wang, D.-L. Xu, X.-W. Shu, Y.-Z. Fan, and T.-G. Wang, “GB6 J2113+1121: A Multiwavelength Flaring -Ray Blazar Temporally and Spatially Coincident with the Neutrino Event IceCube-191001A,” Astrophys. J. Lett. 932, L25 (2022), arXiv:2202.03788.
- Plavin et al. (2023) A. V. Plavin, Y. Y. Kovalev, Y. A. Kovalev, and S. V. Troitsky, “Growing evidence for high-energy neutrinos originating in radio blazars,” Mon. Not. Roy. Astron. Soc. 523, 1799 (2023), arXiv:2211.09631.
- Buson et al. (2022) S. Buson et al., “Beginning a Journey Across the Universe: The Discovery of Extragalactic Neutrino Factories,” Astrophys. J. Lett. 933, L43 (2022), [Erratum: Astrophys.J.Lett. 934, L38 (2022), Erratum: Astrophys.J. 934, L38 (2022)], arXiv:2207.06314.
- Buson et al. (2023) S. Buson, A. Tramacere, L. Oswald, E. Barbano, G. F. de Clairfontaine, L. Pfeiffer, A. Azzollini, V. Baghmanyan, and M. Ajello, “Extragalactic neutrino factories,” (2023), arXiv:2305.11263.
- Bellenghi et al. (2023) C. Bellenghi, P. Padovani, E. Resconi, and P. Giommi, “Correlating High-energy IceCube Neutrinos with 5BZCAT Blazars and RFC Sources,” Astrophys. J. Lett. 955, L32 (2023), arXiv:2309.03115.
- Li et al. (2022) R.-L. Li, B.-Y. Zhu, and Y.-F. Liang, “Investigating the correlations between IceCube high-energy neutrinos and Fermi-LAT -ray observations,” Phys. Rev. D 106, 083024 (2022), arXiv:2205.15963.
- Huber (2020) M. Huber (IceCube Collaboration), “Searches for steady neutrino emission from 3FHL blazars using eight years of IceCube data from the Northern hemisphere,” PoS ICRC2019, 916 (2020), arXiv:1908.08458.
- Luo and Zhang (2020) J.-W. Luo and B. Zhang, “Blazar - IceCube neutrino association revisited,” Phys. Rev. D 101, 103015 (2020), arXiv:2004.09686.
- Abbasi et al. (2021b) R. Abbasi et al. (IceCube Collaboration), “Search for Multi-flare Neutrino Emissions in 10 yr of IceCube Data from a Catalog of Sources,” Astrophys. J. Lett. 920, L45 (2021b), arXiv:2109.05818.
- Abbasi et al. (2022c) R. Abbasi et al. (IceCube Collaboration), “Search for Astrophysical Neutrinos from 1FLE Blazars with IceCube,” (2022c), arXiv:2207.04946.
- Abbasi et al. (2021c) R. Abbasi et al. (IceCube Collaboration), “IceCube Data for Neutrino Point-Source Searches Years 2008-2018,” (2021c), 10.21234/CPKQ-K003, arXiv:2101.09836.
- Atwood et al. (2009) W. B. Atwood et al. (Fermi-LAT Collaboration), “The Large Area Telescope on the Fermi Gamma-ray Space Telescope Mission,” Astrophys. J. 697, 1071 (2009), arXiv:0902.1089.
- Ajello et al. (2017) M. Ajello et al. (Fermi-LAT Collaboration), “3FHL: The Third Catalog of Hard Fermi-LAT Sources,” Astrophys. J. Suppl. 232, 18 (2017), arXiv:1702.00664.
- Abdollahi et al. (2020) S. Abdollahi et al. (Fermi-LAT Collaboration), “ Large Area Telescope Fourth Source Catalog,” Astrophys. J. Suppl. 247, 33 (2020), arXiv:1902.10045.
- Abdollahi et al. (2022) S. Abdollahi et al. (Fermi-LAT Collaboration), “Incremental Fermi Large Area Telescope Fourth Source Catalog,” (2022), arXiv:2201.11184.
- Ajello et al. (2020) M. Ajello et al. (Fermi-LAT Collaboration), “The Fourth Catalog of Active Galactic Nuclei Detected by the Fermi Large Area Telescope,” Astrophys. J. 892, 105 (2020), arXiv:1905.10771.
- Achterberg et al. (2006) A. Achterberg et al. (IceCube Collaboration), “First Year Performance of The IceCube Neutrino Telescope,” Astropart. Phys. 26, 155 (2006), arXiv:astro-ph/0604450.
- Padovani et al. (2018) P. Padovani, P. Giommi, E. Resconi, T. Glauch, B. Arsioli, N. Sahakyan, and M. Huber, “Dissecting the region around IceCube-170922A: the blazar TXS 0506+056 as the first cosmic neutrino source,” Mon. Not. Roy. Astron. Soc. 480, 192 (2018), arXiv:1807.04461.
- Garrappa et al. (2019) S. Garrappa et al. (Fermi-LAT, ASAS-SN, IceCube Collaboration), “Investigation of two Fermi-LAT gamma-ray blazars coincident with high-energy neutrinos detected by IceCube,” Astrophys. J. 880, 880:103 (2019), arXiv:1901.10806.
- Ajello et al. (2023) M. Ajello, K. Murase, and A. McDaniel, “Disentangling the Hadronic Components in NGC 1068,” Astrophys. J. Lett. 954, L49 (2023), arXiv:2307.02333.
- Ji et al. (2024) S. Ji, Z. Wang, Y. Xing, D. Yan, and J. Zheng, “Dissecting the -Ray Emissions of the Nearby Galaxies NGC 1068 and NGC 253,” Astrophys. J. 961, 147 (2024), arXiv:2307.05142.
- Wakely and Horan (2008) S. P. Wakely and D. Horan, “TeVCat: An online catalog for Very High Energy Gamma-Ray Astronomy,” International Cosmic Ray Conference 3, 1341 (2008).