First-order rhombohedral to cubic phase transition in photoexcited GeTe
Abstract
Photoexcited GeTe undergoes a non-thermal phase transition from a rhombohedral to a rocksalt crystalline phase. The microscopic mechanism and the nature of the transition are unclear. By using constrained density functional perturbation theory and by accounting for quantum anharmonicity within the stochastic self-consistent harmonic approximation, we show that the non-thermal phase transition is strongly first order and does not involve phonon softening, at odd with the thermal one. The transition is driven by the closure of the single particle gap in the photoexcited rhombohedral phase. Finally, we show that ultrafast X-ray diffraction data are consistent with a coexistence of the two phases, as expected in a first order transition. Our results are relevant for the understanding of phase transitions and bonding in phase change materials.
Phase change materials (PCMs) have found commercial applications in all-optical memories and are promising candidates for the use in computation beyond Von Neumann Zhang et al. (2019). Their success is due to two fundamental properties: i) their amorphous and crystalline phases have a significantly different electrical resistance Ovshinsky (1968) and optical properties Lencer et al. (2008); Wuttig et al. (2017), and ii) they can be rapidly switched between both states. The electronic structure and structural properties of these materials result from a competition of resonant bonding and Peierls distortion Shportko et al. (2008). PCM structural properties are very sensitive to ultrafast photoexcitation that, in these systems, can trigger phase transitions Matsubara et al. (2016). However, a sound description of the mechanism responsible for the photoexcited phase transitions is lacking even for GeTe, the most simple PCM.
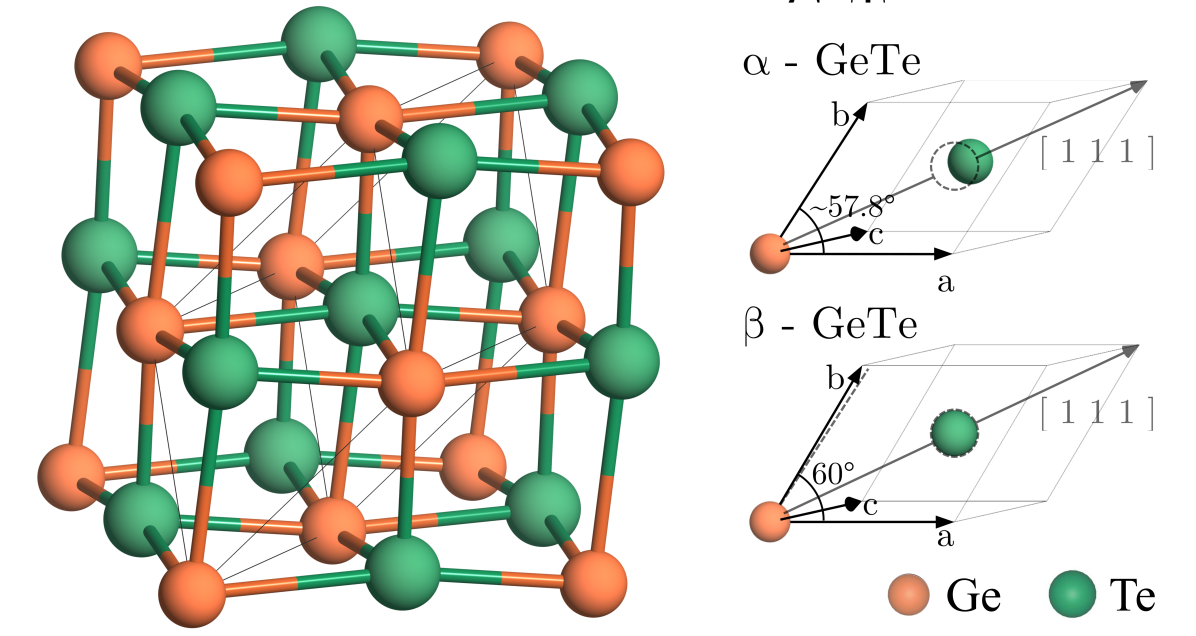
At ambient conditions, \ceGeTe crystallizes in a rhombohedral phase (-\ceGeTe) which exhibits a ferroelectric distortion along the body diagonal of the rhombohedral cell, making -\ceGeTe a ferroelectric compound Boschker et al. (2017). For Chattopadhyay et al. (1987), \ceGeTe adopts a paraelectric rock-salt crystal structure (-\ceGeTe) Chatterji et al. (2015) (see Fig. 1). The thermal displacive phase transition involves an optical phonon softening at zone center, as confirmed by Raman data Steigmeier and Harbeke (1970) and molecular dynamics (MD) simulations Sosso et al. (2012); Dangić et al. (2022). The transition has a weakly first order character, as shown by the detection of a latent heat Sist et al. (2018). EXAFS data Fons et al. (2010) show an apparent survival of long and short \ceGe-\ceTe bonds at K, suggesting an order-disorder phase transition Fons et al. (2010). However, the latter result has been reinterpreted as due to anharmonicity in the potential in Ref. Dangić et al. (2022). The common feature among all these interpretations of the thermal transition is the occurrence of a softening of the zone-center optical phonon mode.
Femtosecond visible laser pulses induce a non thermal transformation on GeTe from the initial rhombohedral phase to the cubic structure Hu et al. (2015); Matsubara et al. (2016). Even if apparently similar to the thermal one, the nature of this transition is rather controversial. A key feature is that even after 6 ps, the ultrafast X-ray diffraction (XRD) data are not consistent with a complete transition to a cubic structure as additional diffraction peaks and anomalous broadenings are still present. This led the authors of Ref. Matsubara et al. (2016) to speculate that the structure after photoexcitation is only on average cubic, with the Ge atoms performing an off-center rattling motion leading to the averaging effect. This interpretation, consistent with an order to disorder phase transition, has been questioned by time-dependent density functional theory MD calculations resulting in a coherent displacive second order phase transition to the cubic phase Chen et al. (2018). However, the time evolution of the XRD lines and the persistence of some rhombohedral features are not explained by a displacive coherent transition as proposed in Ref. Chen et al. (2018).
In this work we investigate the photoexcited phase transition in GeTe by using constrained density functional (cDFT) and density functional perturbation theory (cDFPT) calculations Hamann (2013); Perdew et al. (1997); Tangney and Fahy (2002); Marini and Calandra (2021) coupled with the stochastic self-consistent harmonic approximation (SSCHA) Monacelli et al. (2021) to treat non-perturbative quantum anharmonicity in the ground and in the excited state. The crystal under photoexcitation is here characterized by the presence of two independent thermal populations of photoexcited carriers: photoexcited electrons in the bottom of the conduction band ( in the following) and valence holes in the top of the valence band Marini and Calandra (2021) (more details in the Supplemental Material (SM)). We show that the photoinduced non-thermal phase transition is of the first order kind and does not involve a soft phonon mode, at odd with the thermal case. The behaviour of the ultrafast XRD peaks are naturally explained in this framework.
We first consider the thermal case and show that in the absence of photoexcitation the SSCHA correctly reproduces the displacive nature of the instability of the cubic phase at K.
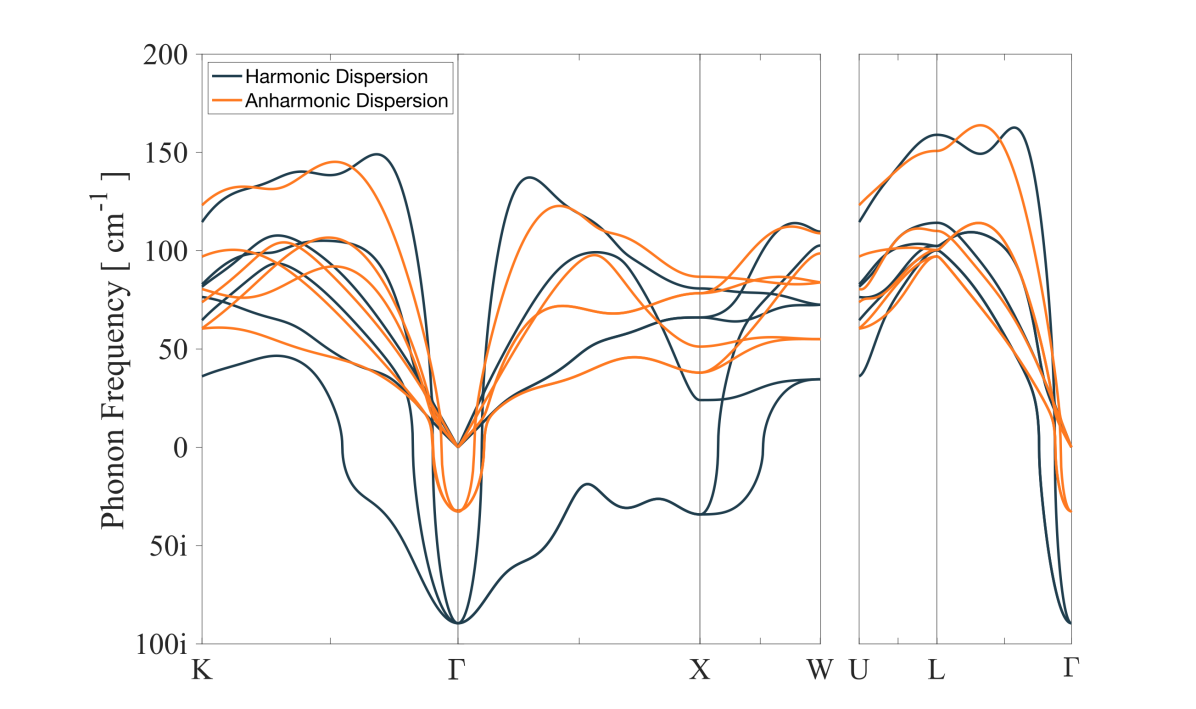
In Fig. 2, we show the harmonic phonon dispersion of -\ceGeTe calculated by using density functional perturbation theory Baroni et al. (2001); Giannozzi et al. (2009, 2020). In the harmonic approximation, the phase is dynamically unstable, with the complete optical band being imaginary and with the strongest instability located at zone center. We explicitly verify that the inclusion of the natural hole concentration due to the intrinsic Ge vacancies in \ceGeTe increases the harmonic optical phonon frequency by no more than ; thus, in the following, their presence will be neglected (see SM and Ref. Edwards et al. (2005) there included).
Non-perturbative quantum anharmonicity is treated within the SSCHA by calculating the positional free energy () Hessian at K. The static temperature dependent dynamical matrix is defined as a function of the free energy Hessian as:
| (1) |
where M is the matrix of the ionic masses with = and R is a cumulative variable for all the ionic positions (see Refs. Bianco et al., 2017 for a detailed explanation). By Fourier transforming the matrix D and by diagonalizing it, we obtain as the square root of the eigenvalues of the positional free energy Hessian. An imaginary frequency signals the occurrence of a second order phase transition as dictated by Landau theory. As shown in Fig. 2, quantum anharmonicity partially cures the instability as most of the optical band is now positive, but there remains an instability of the optical mode at zone center indicating the occurrence of a displacive phase transition, in agreement with experiments and previous calculations. Dangić et al. (2022).
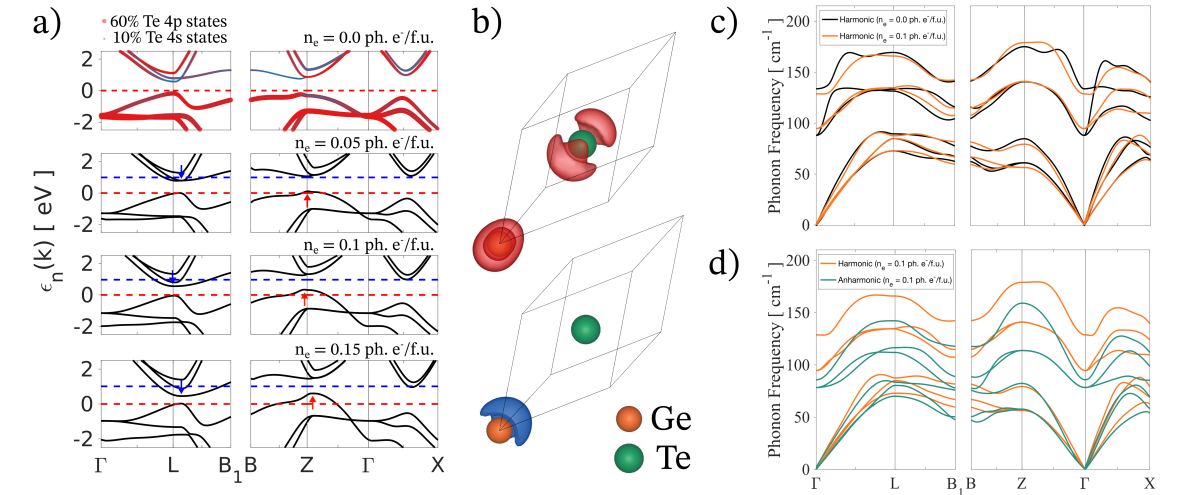
Having shown the capability of our formalism to describe the displacive phase transition in the ground state, we switch to the description of the photoexcited state. In Fig. 5 (c) we show the harmonic phonon dispersion of the -phase in the ground state and in the presence of excited electrons per formula unit (), which is compatible with the value that we calculate from the experimental fluence Matsubara et al. (2016) (see SM which includes Ref. Lewis (1973)). The ground state results are in perfect agreement with Refs. Wdowik et al. (2014); Shaltaf et al. (2008); Campi et al. (2017) and confirm the stability of the -phase at zero temperature. More interestingly, the rhombohedral phase remains stable even in the presence of a substantial photoexcitation and shows no tendency to a dynamical destabilization of the lattice. Quantum anharmonicity weakly affects the dispersion at , as show in Fig. 5 (d).
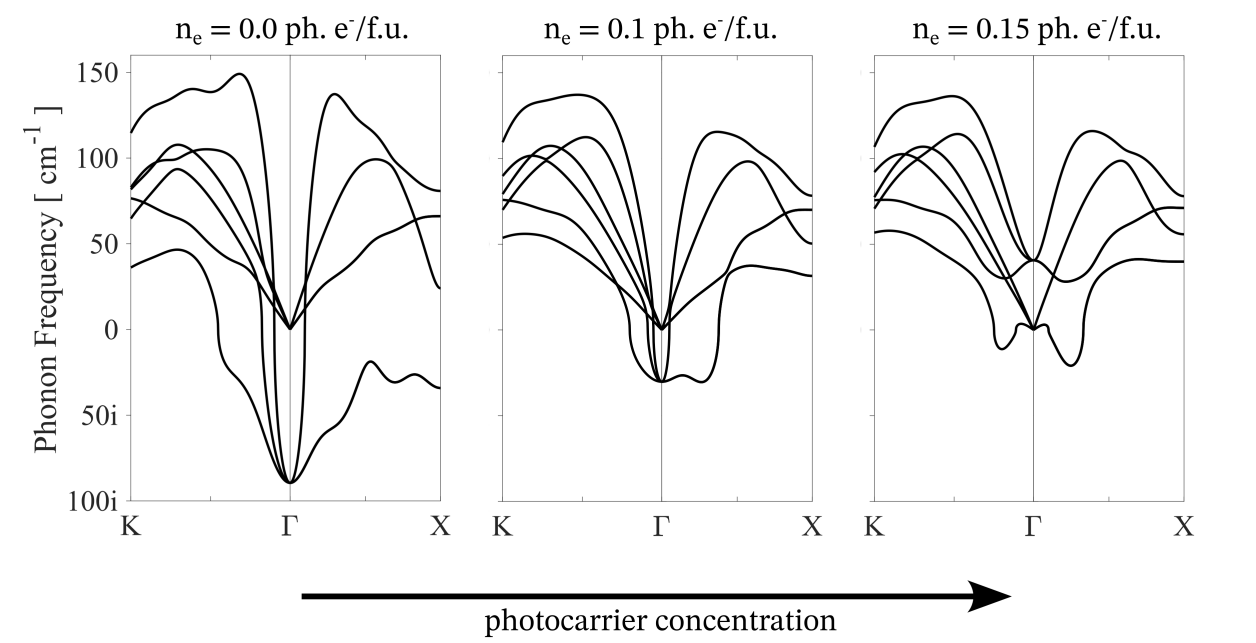
It is instructive to compare the persistent stability of the -\ceGeTe phase under photoexcitation with the harmonic phonon dispersion of the cubic phase as a function of the number of photoexcited carriers (Fig. 3). A non-zero photoexcited carriers population progressively reduces the displacive instability of the optical phonons at zone center. At the harmonic level and in the absence of photocarriers cubic \ceGeTe exhibits a deep dynamical instability at zone centre () and a secondary dynamical instability at (), in complete agreement with previous theoretical determination of the same vibrational spectrum Wdowik et al. (2014); Xia and Chan (2018); Wang et al. (2021).
At the instability of the zone-center optical-phonon is weak but still present, while it is completely removed at , although the acoustic modes are slightly imaginary close to zone center. We note here that photoinduced weakening of the zone centre dynamical instability can be correlated to the promotion of electrons to the conduction bands of -\ceGeTe which are predominantly derived from Ge p states and thus favour a more perfect octahedral atomic arrangement (see SM for the -GeTe band character) Wuttig and Yamada (2007).
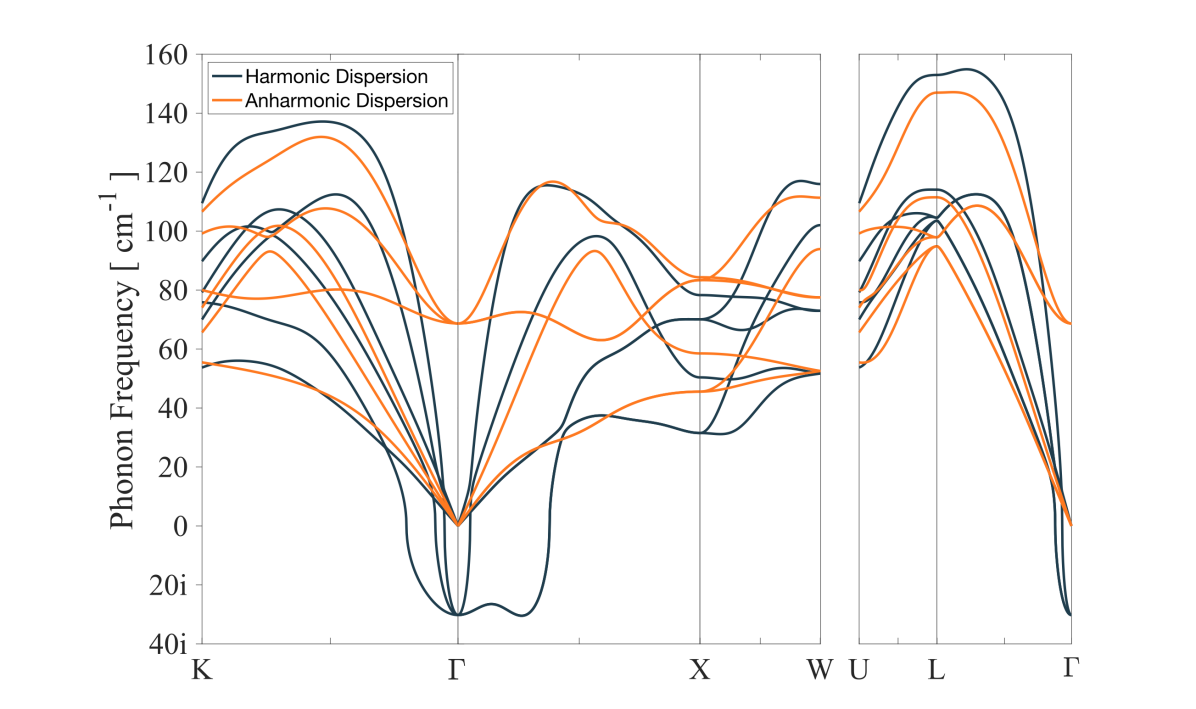
The residual weak instability at could, however, be removed by anharmonicity. In order to investigate this possibility we report the results of the SSCHA calculation at and in Fig. 4. Quantum anharmonic corrections are colossal and completely remove the instability. Thus, both the and phases have a positive definite positional free energy Hessian at this photoexcitation, meaning that both phases are local free energy minima and the transition among the two cannot be due to a displacive soft-phonon driven phase transition, at odd with the thermal case. Inclusion of volume effects and minimization of the Gibbs free energy do not qualitatively and quantitatively change this conclusion.
At the quantum free energy difference between the cubic and the rhombohedral phases is very small, namely at T = . Inclusion of volume effects and minimization of the Gibbs free energy changes only slightly this result and leads to a quantum free energy difference of at (the total energy difference being ). This has to be compared with the quantum free energy difference in the absence of photoexcitation at , that is (the total energy difference in the ground state is ). Thus, photoexcitation suppresses the free energy difference among the two structures by a factor , making them almost degenerate at . The reduction in is entirely due to the change in total energy difference by the photoexcitation, while the quantum anharmonic correction is almost equal in the ground state and in the excited state. Our results obtained within cDFPT strongly support the occurrence of a first order phase transition from the rhombohedral to the cubic phase with a region of coexistence among the two.
Before addressing the comparison with XRD data, we detail the microscopic mechanism responsible for the free energy difference reduction under photoexcitation. In Fig. 5 (a) we plot the evolution of the electronic structure of the -phase as a function of photoexcitation obtained with cDFT. As shown by the projection over the Te atomic character, in the ground state the valence band has a dominant Te character (at the valence band top approximately of Te and of Ge character), while the conduction band is mostly derived from Ge atomic states. This is also shown clearly in Fig. 5 (b), where the electronic charge density restricted to the top of the valence band (top) and to the bottom of the conduction band (bottom) is shown (see SM for more details). The former is almost equally distributed among the Ge and Te atoms, while the latter is mostly located close to the Ge atoms. As Ge (Te) is positively (negatively) charged in the ground state Singh (2013); Shaltaf et al. (2008), the photoexcitation reduces the ionicity of the bonding. As the stabilization of the rhombohedral structure in the ground state has been attributed to the smaller ionicity of the bonding Wuttig and Yamada (2007); Shportko et al. (2008); Shaltaf et al. (2008) and the consequent energy gain due to gap-opening, the stabilization of the cubic structure in the presence of photocarriers seems to be in apparent contradiction with previous works. However, we should recall that at , GeTe is in a metallic state. The concept of bond ionicity is lost as the Born effective charges are completely screened, no net polarization occurs in the phase and the band-gap is progressively reduced, as it can be seen in Fig. 5. On the contrary the gap of the cubic phase is essentially unaltered by photoexcitation (see SM). Thus, the reduction in and by the electron-hole plasma is mostly due to the gap closure.
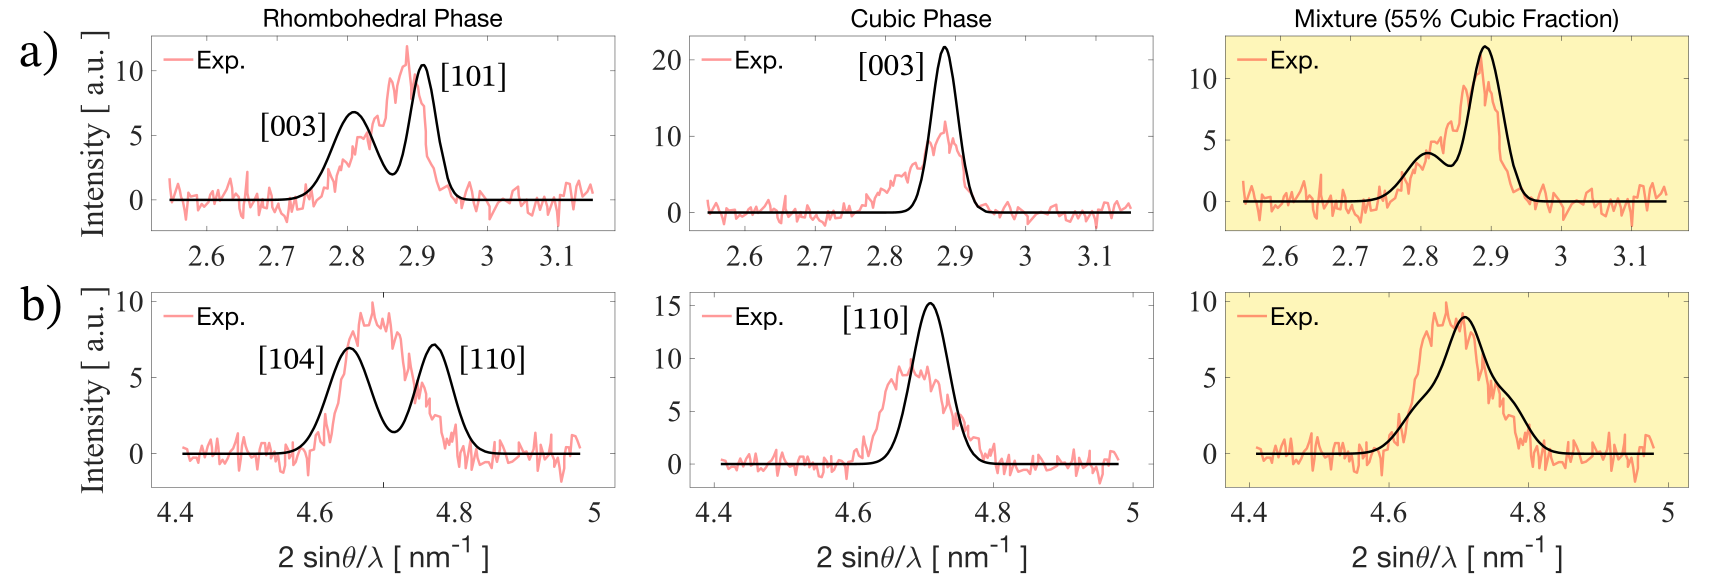
We now compare our findings with experimental data. Ultrafast XRD data in Ref. Matsubara et al. (2016) show a progressive emergence of the cubic peaks in the time period 4-26 after the transition. Yet, the behaviour of the , and peaks is anomalous, as shown in Fig. 6. In particular, in the cubic phase, only the peak should be visible in the range of nm-1, as shown in the simulated diffraction pattern (black line) in the middle panel in Fig. 6 (a). However, at 6 ps the experimental data of Ref. Matsubara et al. (2016), replotted in Fig. 6 (a), show the presence of a secondary peak as a left-shoulder. Similarly, in the case of a complete transition to -\ceGeTe, the cubic peak should be the only visible in the diffraction pattern in the range nm-1. On the contrary, the asymmetric shape of the experimental peak suggests a persistence of the rhombohedral at 6 ps (and also at larger times), see middle panel of Fig. 6 (b).
These anomalies in the XRD pattern were interpreted as a rattling motion of the central ion in the unit cell that experiences a shallow enough potential energy barrier at the geometric centre of the unit cell so to be able to rapidly move around it and leading, on average, to a cubic structure Matsubara et al. (2016). Although such an explanation was suggested to be consistent with the experimental observations through theoretical estimation of the structure factors in rhombohedral \ceGeTe, no clear evidence of this specific dynamics was provided. Such a scenario clearly differs significantly from the first order picture of the phase transition provided here. We believe that the progressive change in the diffraction patterns in Ref. Matsubara et al. (2016) could be more conveniently explained assuming that after the irradiation a certain portion of the sample transitions to the phase. The larger concentration of -\ceGeTe in the sample would then correlate with the observed enhancement of the diffraction peaks pertaining to the cubic structure. The remaining portion still in the phase would naturally give rise to additional features in the XRD patterns.
In Fig. 6, we provide a comparison of the diffraction peaks reported in Ref. Matsubara et al. (2016) with theoretically computed diffraction patterns Momma and Izumi (2011). For simplicity, we chose the linewidths of the theoretical peaks to be identical to the experimental ones for ground state -\ceGeTe (see Ref. Matsubara et al. (2016) and SM for further details). In Fig. 6 it is evident how purely rhombohedral or purely cubic diffraction patterns cannot explain the experimental observations. However, when considering mixtures of the two phases, the qualitative features of the experimental diffraction patterns are recovered (see 6 and SM for more details). Thus, the XRD in Ref. Matsubara et al. (2016) are better described by a phase mixture than by a second-order displacive transition.
In conclusion, by using first principles calculations in the presence of an electron-hole plasma and by including non-perturbative quantum anharmonicity, we showed that the non-thermal rhombohedral to cubic phase transition occurring in photoexcited GeTe is of the first order kind and does not involve softening of any optical zone centre mode, contrary to what happens in the thermal case. By performing a careful analysis of ultrafast XRD data Matsubara et al. (2016), we have shown that they are compatible with a mixture of the and phases and disagree with a second-order or with a coherently uniform transition to the phase Chen et al. (2018).
Our results are relevant for the broad class of phase change materials, as in several of these, such as SbTe3 or Ge2Sb2Te5, non-thermal phase transition induced by ultrafast pulses have been detected Hase et al. (2015). Moreover, as we have shown that the order of the transition is sensitive to the effective occupation of the valence band, our findings could be helpful to explain the weakly first order nature of the thermal transition in \ceGeTe and other phase change materials.
Acknowledgements.
We acknowledge EuroHPC access on LUMI (EHPC-REG-2022R03-090) for high performance computing resources and the CINECA award under the ISCRA initiative, for the availability of high-performance computing resources and support. This work was funded by the European Union (ERC, DELIGHT, 101052708). Views and opinions expressed are however those of the author(s) only and do not necessarily reflect those of the European Union or the European Research Council. Neither the European Union nor the granting authority can be held responsible for them.References
- Zhang et al. (2019) W. Zhang, R. Mazzarello, M. Wuttig, and E. Ma, Nature Reviews Materials 4, 150 (2019).
- Ovshinsky (1968) S. R. Ovshinsky, Phys. Rev. Lett. 21, 1450 (1968).
- Lencer et al. (2008) D. Lencer, M. Salinga, B. Grabowski, T. Hickel, J. Neugebauer, and M. Wuttig, Nature Materials 7, 972 (2008).
- Wuttig et al. (2017) M. Wuttig, H. Bhaskaran, and T. Taubner, Nature Photonics 11, 465 (2017).
- Shportko et al. (2008) K. Shportko, S. Kremers, M. Woda, D. Lencer, J. Robertson, and M. Wuttig, Nature Materials 7, 653 (2008).
- Matsubara et al. (2016) E. Matsubara, S. Okada, T. Ichitsubo, T. Kawaguchi, A. Hirata, P. F. Guan, K. Tokuda, K. Tanimura, T. Matsunaga, M. W. Chen, and N. Yamada, Phys. Rev. Lett. 117, 135501 (2016).
- Boschker et al. (2017) J. E. Boschker, R. Wang, and R. Calarco, CrystEngComm 19, 5324 (2017).
- Chattopadhyay et al. (1987) T. Chattopadhyay, J. X. Boucherle, and H. G. vonSchnering, Journal of Physics C: Solid State Physics 20, 1431 (1987).
- Chatterji et al. (2015) T. Chatterji, C. M. N. Kumar, and U. D. Wdowik, Phys. Rev. B 91, 054110 (2015).
- Steigmeier and Harbeke (1970) E. F. Steigmeier and G. Harbeke, Solid State Communications 8, 1275 (1970).
- Sosso et al. (2012) G. C. Sosso, G. Miceli, S. Caravati, J. Behler, and M. Bernasconi, Phys. Rev. B 85, 174103 (2012).
- Dangić et al. (2022) D. Dangić, S. Fahy, and I. Savić, Phys. Rev. B 106, 134113 (2022).
- Sist et al. (2018) M. Sist, H. Kasai, E. M. J. Hedegaard, and B. B. Iversen, Phys. Rev. B 97, 094116 (2018).
- Fons et al. (2010) P. Fons, A. V. Kolobov, M. Krbal, J. Tominaga, K. S. Andrikopoulos, S. N. Yannopoulos, G. A. Voyiatzis, and T. Uruga, Phys. Rev. B 82, 155209 (2010).
- Momma and Izumi (2011) K. Momma and F. Izumi, Journal of Applied Crystallography 44, 1272 (2011).
- Hu et al. (2015) J. Hu, G. M. Vanacore, Z. Yang, X. Miao, and A. H. Zewail, ACS Nano 9, 6728 (2015).
- Chen et al. (2018) N.-K. Chen, X.-B. Li, J. Bang, X.-P. Wang, D. Han, D. West, S. Zhang, and H.-B. Sun, Phys. Rev. Lett. 120, 185701 (2018).
- Hamann (2013) D. R. Hamann, Phys. Rev. B 88, 085117 (2013).
- Perdew et al. (1997) J. P. Perdew, K. Burke, and M. Ernzerhof, Phys. Rev. Lett. 78, 1396 (1997).
- Tangney and Fahy (2002) P. Tangney and S. Fahy, Phys. Rev. B 65, 054302 (2002).
- Marini and Calandra (2021) G. Marini and M. Calandra, Phys. Rev. B 104, 144103 (2021).
- Monacelli et al. (2021) L. Monacelli, R. Bianco, M. Cherubini, M. Calandra, I. Errea, and F. Mauri, Journal of Physics: Condensed Matter 33, 363001 (2021).
- Baroni et al. (2001) S. Baroni, S. de Gironcoli, A. Dal Corso, and P. Giannozzi, Rev. Mod. Phys. 73, 515 (2001).
- Giannozzi et al. (2009) P. Giannozzi, S. Baroni, N. Bonini, M. Calandra, R. Car, C. Cavazzoni, D. Ceresoli, G. L. Chiarotti, M. Cococcioni, I. Dabo, A. D. Corso, S. de Gironcoli, S. Fabris, G. Fratesi, R. Gebauer, U. Gerstmann, C. Gougoussis, A. Kokalj, M. Lazzeri, L. Martin-Samos, N. Marzari, F. Mauri, R. Mazzarello, S. Paolini, A. Pasquarello, L. Paulatto, C. Sbraccia, S. Scandolo, G. Sclauzero, A. P. Seitsonen, A. Smogunov, P. Umari, and R. M. Wentzcovitch, Journal of Physics: Condensed Matter 21, 395502 (2009).
- Giannozzi et al. (2020) P. Giannozzi, O. Baseggio, P. Bonfà, D. Brunato, R. Car, I. Carnimeo, C. Cavazzoni, S. de Gironcoli, P. Delugas, F. Ferrari Ruffino, A. Ferretti, N. Marzari, I. Timrov, A. Urru, and S. Baroni, The Journal of Chemical Physics 152, 154105 (2020).
- Edwards et al. (2005) A. H. Edwards, A. C. Pineda, P. A. Schultz, M. G. Martin, A. P. Thompson, and H. P. Hjalmarson, Journal of Physics: Condensed Matter 17, L329 (2005).
- Bianco et al. (2017) R. Bianco, I. Errea, L. Paulatto, M. Calandra, and F. Mauri, Physical Review B 96, 014111 (2017).
- Lewis (1973) J. E. Lewis, physica status solidi (b) 59, 367 (1973).
- Wdowik et al. (2014) U. D. Wdowik, K. Parlinski, S. Rols, and T. Chatterji, Phys. Rev. B 89, 224306 (2014).
- Shaltaf et al. (2008) R. Shaltaf, E. Durgun, J.-Y. Raty, P. Ghosez, and X. Gonze, Phys. Rev. B 78, 205203 (2008).
- Campi et al. (2017) D. Campi, L. Paulatto, G. Fugallo, F. Mauri, and M. Bernasconi, Phys. Rev. B 95, 024311 (2017).
- Xia and Chan (2018) Y. Xia and M. K. Y. Chan, Applied Physics Letters 113 (2018).
- Wang et al. (2021) C. Wang, J. Wu, Z. Zeng, J. Embs, Y. Pei, J. Ma, and Y. Chen, npj Computational Materials 7, 118 (2021).
- Wuttig and Yamada (2007) M. Wuttig and N. Yamada, Nature Materials 6, 824 (2007).
- Singh (2013) D. J. Singh, Journal of Applied Physics 113, 203101 (2013).
- Setyawan and Curtarolo (2010) W. Setyawan and S. Curtarolo, Computational Materials Science 49, 299 (2010).
- Kokalj (1999) A. Kokalj, Journal of Molecular Graphics and Modelling 17, 176 (1999).
- Hase et al. (2015) M. Hase, P. Fons, K. Mitrofanov, A. V. Kolobov, and J. Tominaga, Nature Communications 6, 8367 (2015).