SN 2024ggi in NGC 3621: Rising Ionization in a Nearby, CSM-Interacting Type II Supernova
Abstract
We present UV/optical/NIR observations and modeling of supernova (SN) 2024ggi, a type II supernova (SN II) located in NGC 3621 at 7.2 Mpc. Early-time (“flash”) spectroscopy of SN 2024ggi within +0.8 days of discovery shows emission lines of H i, He i, C iii, and N iii with a narrow core and broad, symmetric wings (i.e., IIn-like) arising from the photoionized, optically-thick, unshocked circumstellar material (CSM) that surrounded the progenitor star at shock breakout. By the next spectral epoch at +1.5 days, SN 2024ggi showed a rise in ionization as emission lines of He ii, C iv, N iv/v and O v became visible. This phenomenon is temporally consistent with a blueward shift in the UV/optical colors, both likely the result of shock breakout in an extended, dense CSM. The IIn-like features in SN 2024ggi persist on a timescale of days at which time a reduction in CSM density allows the detection of Doppler broadened features from the fastest SN material. SN 2024ggi has peak UV/optical absolute magnitudes of mag and mag that are consistent with the known population of CSM-interacting SNe II. Comparison of SN 2024ggi with a grid of radiation hydrodynamics and non-local thermodynamic equilibrium (nLTE) radiative-transfer simulations suggests a progenitor mass-loss rate of yr-1 (), confined to a distance of cm. Assuming a wind velocity of , the progenitor star underwent an enhanced mass-loss episode in the last years before explosion.
tablenum \restoresymbolSIXtablenum
1 Introduction
Shock breakout (SBO) from a red supergiant (RSG) star is characterized by an optical depth of , where is the speed of light and is the shock velocity. Consequently, the location and timescale of SBO photon escape is highly dependent on the density and extent of circumstellar material (CSM) that borders the RSG prior to explosion. In addition to light travel effects during SBO (Waxman & Katz, 2017; Goldberg et al., 2022), the SBO signal can be significantly enhanced and elongated by the presence of high density CSM directly above the stellar surface (Chevalier & Irwin, 2011; Dessart et al., 2017; Haynie & Piro, 2021). Once the shock has “broken out,” the associated burst of high-energy radiation will “flash ionize” the surrounding medium – observationally this manifests as a hot supernova (SN) continuum riddled with recombination lines from ionization CSM. However, to overcome the recombination timescale of the “flash ionized CSM” ( hours for cm-3, g cm-3 at , where is progenitor radius), SN ejecta interaction with dense CSM provides continuous photoionization of the medium for sufficiently large CSM densities (e.g., g cm-3).
For type II supernovae (SNe II) interacting with such dense CSM, high-energy photons will be emitted from the shock front as the post-shock gas cools primarily through free-free emission ( K; Chevalier & Irwin 2012; Chevalier & Fransson 2017). This process then prolongs the formation of high-ionization recombination lines (e.g., He ii, N iii/iv/v, C iii/iv) present during the “flash ionization” phase. Intriguingly, as recombination line photons try to exit the CSM, they electron-scatter off of free electrons in the ionized gas, which broadens the observed emission lines that will then appear as the combination of a narrow core and Lorentzian wings (i.e., “IIn-like features”; Chugai 2001; Dessart et al. 2009; Huang & Chevalier 2018a). However, as the CSM density and optical depth to electron-scattering drops, these electron-scattering profiles will fade on a characteristic timescale (), with the SN photosphere then revealing the fastest moving SN material (Dessart et al., 2017; Dessart & Jacobson-Galán, 2023; Jacobson-Galán et al., 2023, 2024).
Given the rapid evolution of CSM-interacting SNe II in their first hours-to-days, ultra-rapid (“flash”) spectroscopy is essential to both capture the SBO signal and persistent photo-ionization of dense CSM, but also to constrain the composition and mass-loss history of the progenitor star in its final year(s) before collapse (Gal-Yam et al., 2014; Khazov et al., 2016; Yaron et al., 2017; Terreran et al., 2022; Jacobson-Galán et al., 2023). To date, all-sky transient surveys have allowed for systematic discovery of SNe II within days of first light. Through modeling of early-time SN II spectra showing IIn-like features with non-LTE radiative transfer codes (e.g., CMFGEN; Hillier & Dessart 2012; Dessart et al. 2015), numerous single-object studies indicate enhanced RSG mass-loss (– M⊙ yr-1, –100 km s-1) in the final years before explosion (e.g., PTF11iqb, Smith et al. 2015; SN 2013fs, Yaron et al. 2017; Dessart et al. 2017; SN 2014G, Terreran et al. 2016; SN 2016bkv, Hosseinzadeh et al. 2018; Nakaoka et al. 2018; SN 2017ahn, Tartaglia et al. 2021; SN 2018zd, Zhang et al. 2020; Hiramatsu et al. 2021; SN 2019nyk, Dastidar et al. 2024; SN 2020pni, Terreran et al. 2022; SN 2020tlf, Jacobson-Galán et al. 2022; SN 2022jox, Andrews et al. 2023; SN 2023ixf, Jacobson-Galán et al. 2023; Bostroem et al. 2023; Teja et al. 2023; Smith et al. 2023; Zimmerman et al. 2024). Furthermore, sample studies suggest that 40% of SNe II discovered within 2 days of first light show IIn-like features from interaction with dense CSM (Bruch et al., 2021, 2023). Additionally, relative to standard SNe II, events with early-time IIn-like features are incredibly bright in the ultraviolet (Irani et al., 2023; Jacobson-Galán et al., 2024).
In this paper we present, analyze, and model photometric and spectroscopic observations of SN 2024ggi, first discovered by the Asteroid Terrestrial-impact Last Alert System (ATLAS) (Srivastav et al., 2024; Tonry et al., 2024) on 2024-04-11 (MJD 60411.14). SN 2024ggi was classified as a Type II SN (Hoogendam et al., 2024; Zhai et al., 2024) and is located at , in host galaxy NGC 3621. We adopt a time of first light of MJD days, which is based on the average between the times of last non-detection ( mag) and first detection mag. To validate this estimate of first light, we first fit the ATLAS -band light curve with a two-component power-law in the REDBACK software package (Sarin et al., 2023) and derive a time of first light of MJD . Additionally, using a uniform prior distribution derived from the last ATLAS non-detection on MJD 60410.45, we fit the bolometric light curve of SN 2024ggi to a suite of hydrodynamical models (e.g., see Moriya et al. 2023; Subrayan et al. 2023) which constrains the time of first light to be MJD . Both methods yield consistent explosion epochs to that derived above from the phases of last non-detection and first detection. All phases reported in this paper are with respect to this adopted time of first light (). In this paper, we use a redshift-independent host-galaxy distance of Mpc (Saha et al., 2006) and adopt a redshift of based on Na i D absorption in high-resolution spectra of SN 2024ggi obtained with the NEID Spectrograph on the WIYN Telescope (private communication).
Given detection and classification during its infancy, SN 2024ggi represents an incredible opportunity to study the SBO phase of a CSM-interacting SN II in unprecedented detail. In §2 we describe UV, optical, and NIR observations of SN 2024ggi. In §3 we present analysis, comparisons and modeling of SN 2024ggi’s optical photometric and spectroscopic properties. Finally, in §4 we discuss the progenitor environment and mass-loss history prior to SN 2024ggi. Conclusions are drawn in §5. All uncertainties are quoted at the 68% confidence level (c.l.) unless otherwise stated.
2 Observations
2.1 Photometric Observations
The Ultraviolet Optical Telescope (UVOT; Roming et al. 2005) onboard the Neil Gehrels Swift Observatory (Gehrels et al., 2004) started observing SN 2024ggi on 11 April 2024 ( days). We performed aperture photometry with a 5′′ region radius with uvotsource within HEAsoft v6.33111We used the most recent calibration database (CALDB) version., following the standard guidelines from Brown et al. (2014)222https://github.com/gterreran/Swift_host_subtraction. In order to remove contamination from the host galaxy, we employed pre-explosion images to subtract the measured count rate at the location of the SN from the count rates in the SN images and corrected for point-spread-function (PSF) losses following the prescriptions of Brown et al. (2014). We note that not all early-time UVOT observations are included in this analysis given the degree of saturation.
We obtained imaging of SN 2024ggi with the Las Cumbres Observatory (LCO) 1 m telescopes from 12 April to 26 April 2024 (Program ANU2024A-004). After downloading the BANZAI-reduced images from the LCO data archive (McCully et al., 2018), we used photpipe (Rest et al., 2005) to perform DoPhot PSF photometry (Schechter et al., 1993). All photometry was calibrated using PS1 stellar catalogs described above with additional transformations to SDSS -band derived from Finkbeiner et al. (2016). For additional details on our reductions, see Kilpatrick et al. (2018). We also obtained photometry using a 0.7 meter Thai Robotic Telescope at Cerro Tololo Inter-American Observatory in the bands. Images are bias subtracted and field flattened. Absolute photometry is obtained using stars in the 1010′ field of view. We also observed SN 2024ggi with the Lulin 1 m telescope in bands. Standard calibrations for bias and flat-fielding were performed on the images using IRAF, and we reduced the calibrated frames in photpipe using the same methods described above for the LCO images.
We also observed SN 2024ggi in -bands with the Rapid Eye Mount (REM; Antonelli et al. 2003) telescope located in La Silla, Chile. REM is equipped with two cameras, which can observe simultaneously the same field of view (10’10’) in the optical and near-IR. Single images have been initially corrected for dark and flat frames observed each night. Then, images obtained with the same setup have been stacked and finally corrected for cosmic rays, all using a dedicated pipeline written in Python. Magnitudes were measured with aperture photometry, with a variable aperture size according to the seeing of the night, and calibrated against selected field stars from the Skymapper DR4 (Onken et al., 2024) that also have 2MASS -band photometry. We also obtained imaging of SN 2024ggi with the 0.8 m T80S telescope at Cerro Tololo Inter-american Observatory, Chile. These were processed using the S-PLUS Transient Extension Program pipeline (Santos et al., 2024), including non-linearity to recover detections of SN 2024ggi close to the saturation level. Additionally, we include -band photometry by ATLAS that was downloaded from the forced photometry server (Tonry et al., 2018; Smith et al., 2020; Shingles et al., 2021). The complete multi-color light curve of SN 2024ggi is presented in Figure 1.
The Milky Way (MW) -band extinction and color excess along the SN line of sight is mag and E(B-V) = 0.07 mag (Schlegel et al., 1998; Schlafly & Finkbeiner, 2011), respectively, which we correct for using a standard Fitzpatrick (1999) reddening law ( = 3.1). In addition to the MW color excess, we estimate the contribution of galaxy extinction in the local SN environment. Using a high-resolution Kast spectrum of SN 2024ggi at days, we calculate Na i D2 and D1 equivalent widths (EWs) of 0.18 and 0.13 Å, respectively; these values are confirmed in a follow-up high resolution Gemini spectrum at days. We use /Å) from Stritzinger et al. (2018) to convert these EWs to an intrinsic host-galaxy and find a host galaxy extinction of mag, also corrected for using the Fitzpatrick (1999) reddening law.
2.2 Spectroscopic Observations
SN 2024ggi was observed with Shane/Kast (Miller & Stone, 1993) and the Goodman spectrograph (Clemens et al., 2004) at the Southern Astrophysical Research (SOAR) telescope between days. For all these spectroscopic observations, standard CCD processing and spectrum extraction were accomplished with IRAF333https://github.com/msiebert1/UCSC_spectral_pipeline. The data were extracted using the optimal algorithm of Horne (1986). Low-order polynomial fits to calibration-lamp spectra were used to establish the wavelength scale and small adjustments derived from night-sky lines in the object frames were applied. SN 2024ggi spectra were also obtained Gemini Multi-Object Spectrograph (GMOS) at Gemini South Observatory at days and reduced with the Data Reduction for Astronomy from Gemini Observatory North and South (DRAGONS) pipeline (Labrie et al., 2023). Spectra were also obtained with the TripleSpec4.1 NIR Imaging Spectrograph (TSpec) at the SOAR telescope, and reduced using a modified version of Spextool (Cushing et al., 2004). Telluric corrections were applied using xtellcor presented in Vacca et al. (2003). Additional modifications to calibrations are described in Kirkpatrick et al. (2011).
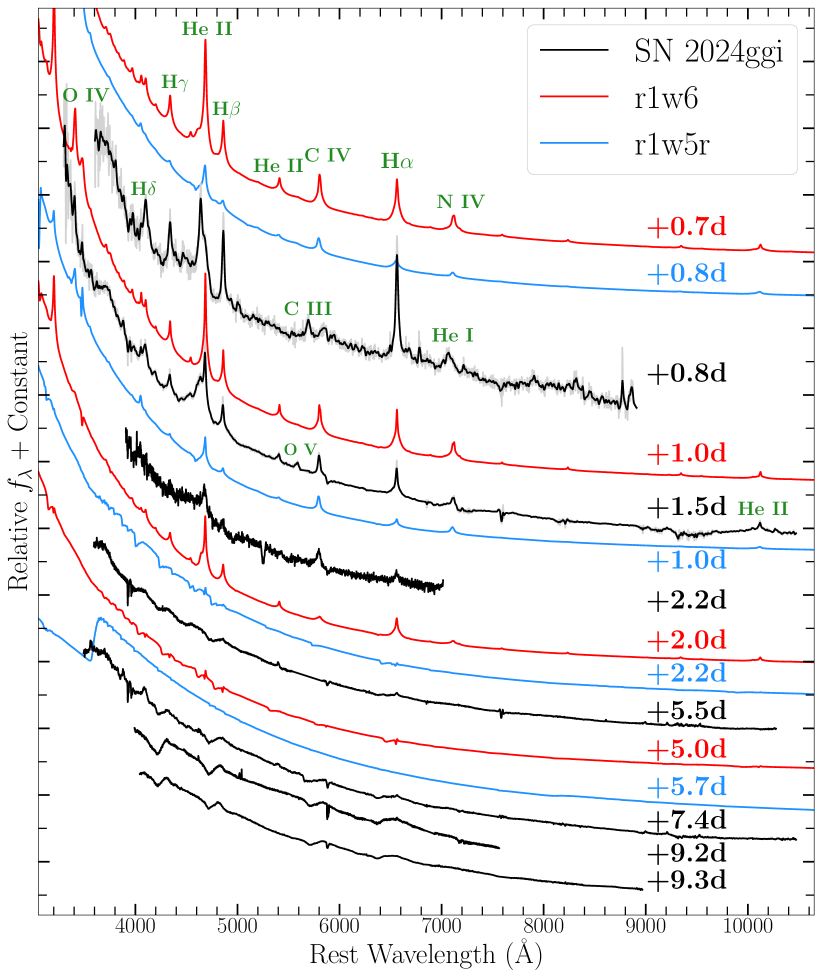
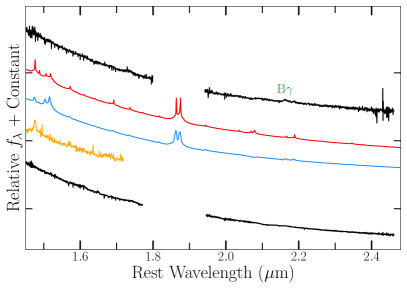
In Figure 2 we present the complete series of optical spectroscopic observations of SN 2024ggi from days. In this plot, we also show the classification spectrum of SN 2024ggi at days from the Lijiang 2.4m telescope (Zhai et al., 2024), which we only use for narrow line identification. The complete optical/NIR spectral sequence is shown in Figures 2 & 3 and the log of spectroscopic observations is presented in Appendix Table A1.
3 Analysis
3.1 Photometric Properties
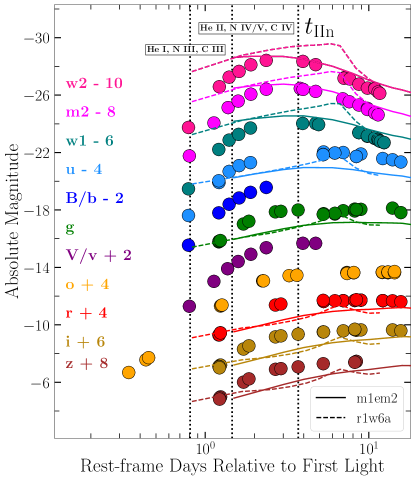
We present the complete early-time, multi-band light curve of SN 2024ggi in Figure 1. Given the estimated time of first light, SN 2024ggi was first detected by ATLAS at days with absolute magnitude of mag and then quickly increased in luminosity to mag by days. We fit high-order polynomials to -band light curves in order to estimate the peak luminosity and rise-time of SN 2024ggi. All measurements are reported in Table 1, with the uncertainty in peak magnitude being the error from the fit and the uncertainty in the peak phase being found from adding the uncertainties in both the time of peak magnitude and the time of first light in quadrature. We find that SN 2024ggi has UV and optical peak absolute magnitudes of mag and mag, respectively. Using the adopted time of first light, we estimate UV and optical rise-times of days and days.
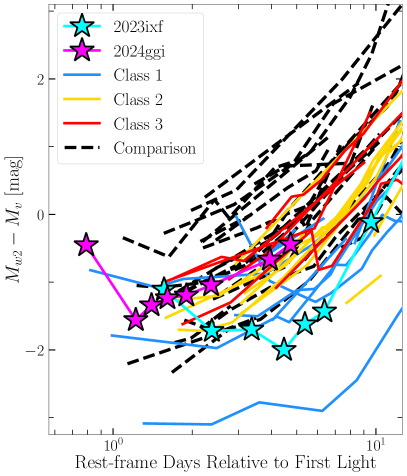
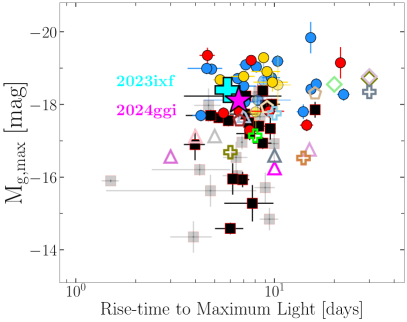
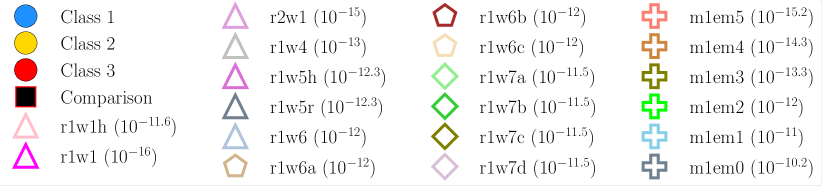
In Figure 4, we compare the observed peak absolute magnitudes of SN 2024ggi to a sample of 74 SNe II from Jacobson-Galán et al. (2024). This sample includes 39 SNe II with detected IIn-like features in their early-time spectra: “gold-sample” objects have spectra at days and “silver-sample” objects only have spectra obtained at days. As discussed in Jacobson-Galán et al. (2024) and delineated by color in Figure 4, the gold/silver-sample objects are classifed in three main groups: “Class 1” (blue) show emission lines of N iii, He ii, and C iv (e.g., SNe 1998S, 2017ahn, 2018zd, 2020pni, 2020tlf, 2023ixf), “Class 2” (yellow) have no N iii emission but do show He ii and C iv (e.g., SNe 2014G, 2022jox), and “Class 3” (red) only show weaker, narrow He ii emission superimposed with a blueshifted, Doppler-broadened He ii (e.g., SN 2013fs, 2020xua). However, this classification scheme is epoch dependent because emission lines of O v/vi and N iv/v are also present in some objects such as SN 2013fs at day owing to a more compact CSM than other CSM-interacting SNe II (Yaron et al., 2017; Dessart et al., 2017). Additionally, we present the comparison sample of 35 SNe II with spectra obtained at days but no detected IIn-like features.
As shown in Figure 4, SN 2024ggi is more luminous than most in the comparison sample SNe II without IIn-like features in all UV/optical filters. Furthermore, SN 2024ggi has a longer rise-time in UV filters than comparison sample objects but comparable rise-times in optical filters. However, SN 2024ggi shows consistent UV/optical luminosities and rise-times to gold/silver-sample objects such as iPTF11iqb (Smith et al., 2015) and SN 2014G (Terreran et al., 2016). Additionally, SN 2024ggi has a comparable optical luminosity to SN 2023ixf but is less luminous in the UV by 0.7 mags. In the right panel of Figure 1, we also compare the early-time ( days) colors of SN 2024ggi to gold, silver and comparison objects. Interestingly, SN 2024ggi shows a dramatic red-to-blue color evolution of mag to mag between days, followed by consistently blue colors as it evolves redward in its first week. This unusual color evolution is also observed in other SNe II with IIn-like features such as SN 2023ixf (Hosseinzadeh et al., 2023; Hiramatsu et al., 2023; Li et al., 2024; Zimmerman et al., 2024), which was proposed as evidence for SBO in an extended dense CSM. This phenomenon is a product of the breakout pulse and the subsequent continuous release of radiation from the shock diffusing through the CSM (Dessart et al., 2017) and also corresponds to the phase during which the photosphere moves outward, initially at and then out to (Dessart & Jacobson-Galán, 2023). We also fit a blackbody model to the SN 2024ggi UV/optical SED and find blackbody temperature[radii] during this red-to-blue color evolution of 20 kK[ cm] at days and 23 kK[ cm] at days. Furthermore, we find that the blackbody temperature of SN 2024ggi peaks at 34 kK on days. This is a similar peak blackbody temperature to the 34.3 kK found for SN 2023ixf at days (Zimmerman et al., 2024). However, we note that these blackbody temperatures correspond to the temperature at the thermalization depth and that the blackbody radius is not equivalent to the location of the photosphere (i.e., ).
3.2 Spectroscopic Properties
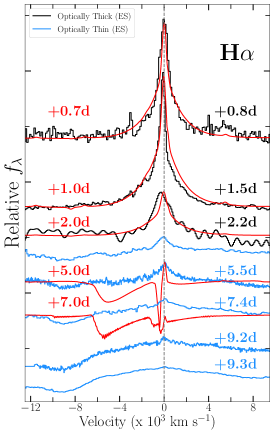
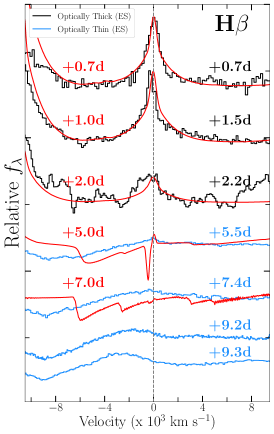
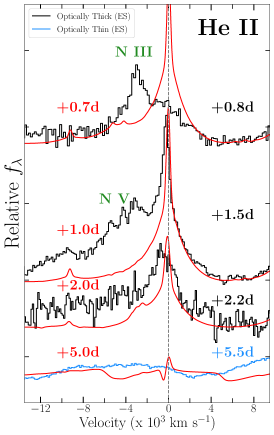
We present our sample of optical observations for SN 2024ggi spanning from to days in Figure 2. In the earliest spectrum at days, SN 2024ggi shows IIn-like features of H i ( eV), He i ( eV), N iii ( eV) and C iii ( eV). However, by the next spectral observation at days, SN 2024ggi shows prominent emission lines of He ii ( eV), N iii/iv/v ( eV), C iv ( eV) and O v ( eV), indicating a dramatic rise in ionization and temperature within 14 hours that is temporally consistent with the blueward evolution in colors (e.g., Fig. 1). There may also be a detection of O iv but the lower S/N in that spectral region makes the line identification uncertain. Interestingly, the detection of O iv/v has only been confirmed in one other SN II, 2013fs, and in that object the timescale of this emission was days (Yaron et al., 2017). Notably, the shift in ionization seen in SN 2024ggi was also observed in SN 2023ixf but at later phases of days (Jacobson-Galán et al., 2023). A two-component Lorentzian model fit to the H profile in the +1.5 d Kast spectrum shows a narrow component full width at half maximum (FWHM) velocity of 270 that traces the unshocked CSM combined with a broad symmetric component with velocity of 1320 that is caused by scattering of recombination line photons by free, thermal electrons in the ionized CSM (Chugai, 2001; Dessart et al., 2009; Huang & Chevalier, 2018b). However, the narrow component is likely affected by radiative acceleration of the CSM that causes the width of the narrow component to be larger than the true velocity of the progenitor wind (Dessart et al., 2015, 2017; Tsuna et al., 2023).
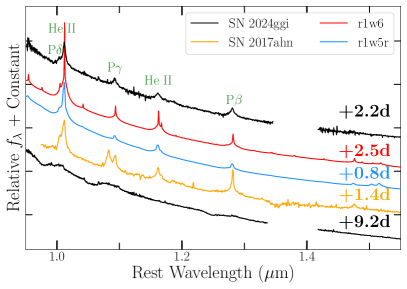
In addition to optical spectroscopy, we present NIR spectra of SN 2024ggi in Figure 3 that extend from m. The first spectrum at days shows IIn-like features of He ii as well as Hydrogen Paschen and Brackett transitions of P , P , P and B . We then compare this spectrum to SN II 2017ahn (Tartaglia et al., 2021), one of the only SN with IIn-like features to have a NIR spectrum during the dense CSM-interaction phase. Overall, the NIR spectrum of SN 2024ggi at days shows similar narrow emission lines to SN 2017ahn with the exception being that SN 2017ahn shows prominent He i emission while SN 2024ggi only shows He ii.
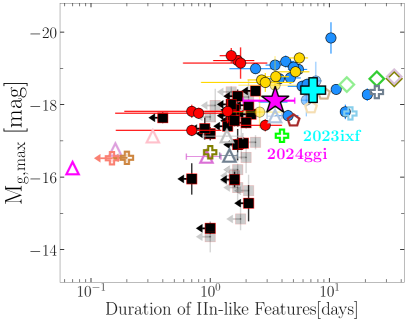
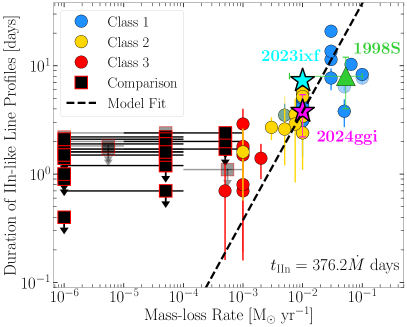
As shown in Figure 5, the IIn-like features in SN 2024ggi are already fading by the +2.2 day epoch, with possible blue-shifted, Doppler-broadened He ii emission as the fastest moving ejecta and/or the dense shell starts to become visible given a decrease in optical depth. Then, by days, the IIn-like features have vanished and SN 2024ggi shows a broad, blueshifted absorption profile in all Balmer transitions as well as a blue-shifted He ii profile extending out to (i.e., “ledge feature”; Dessart et al. 2016; Hosseinzadeh et al. 2022; Pearson et al. 2023; Chugai & Utrobin 2023; Shrestha et al. 2024). Based on this evolution, we estimate the duration of the IIn-like line profiles to be days, which marks the transition point at which the optical depth to electron-scattering has dropped enough to see the emerging fast-moving SN ejecta. At days, we observe broad absorption profiles in the H and H transitions that extend to , which provides a decent estimate of the velocities of the fastest moving H-rich material at the shock front. Using the estimated and a shock velocity of , the transition to lower density CSM likely occurs at a radius of cm (for ) and at a CSM density of g cm-3, for . This likely indicates a more confined CSM and/or lower mass-loss rate for SN 2024ggi than Class 1 gold/silver sample SNe II that have days e.g., SNe 2017ahn, 2018zd, 2020pni, 2020tlf, 2023ixf. However, as shown in Figure 4, the duration of IIn-like features in SN 2024ggi is similar to Class 2/3 objects, which reveals that if earlier time spectra (e.g., day) had been obtained for these objects, they may have shown N iii emission like Class 1 objects and SN 2024ggi at day.
3.3 Model Matching
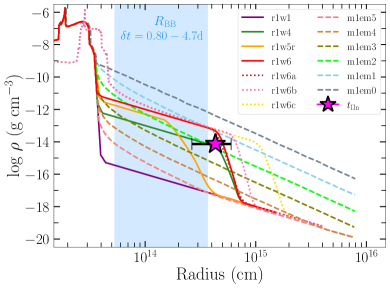
In order to quantify the CSM properties of SN 2024ggi, we compared the spectral and photometric properties of SN 2024ggi to a model grid of radiation hydrodynamics and non-LTE radiative transfer simulations covering a wide range of progenitor mass-loss rates ( yr-1; ) and CSM radii ( cm), all in spherical symmetry. Density profiles for a representative set of models are present in Figure 6. Simulations of the SN ejecta-CSM interaction were performed with the multi-group radiation-hydrodynamics code HERACLES (González et al., 2007; Vaytet et al., 2011; Dessart et al., 2015), which consistently computes the radiation field and hydrodynamics. Then, at selected snapshots in time post-explosion, the hydrodynamical variables are imported into the non-LTE radiative-transfer code CMFGEN (Hillier & Dessart, 2012; Dessart et al., 2015) for an accurate calculation of the radiative transfer, which includes a complete model atom, frequency points, and treatment of continuum and line processes as well as non-coherent electron scattering. For each model, we adopt an explosion energy of erg, a 15 progenitor with a radius ranging from , and a CSM composition set to the surface mixture of a RSG progenitor (Dessart et al., 2017). For the simulations presented in this work, the CSM extent is much greater than (500–1200 for a RSG mass range of 10–20 ) and has little impact during phases of ejecta-CSM interaction. The progenitor radius plays a more significant role on the light curve evolution during the plateau phase (e.g., see Dessart et al. 2013; Jacobson-Galán et al. 2022), i.e., once the interaction phase is over and the emission from the deeper ejecta layers dominate the SN luminosity. Specific methods for each simulation can be found in Dessart et al. (2016, 2017); Jacobson-Galán et al. (2022); Dessart & Jacobson-Galán (2023).
We determine the best-matched model to SN 2024ggi through direct spectral matching and peak/rise-time in all available UV/optical filters (see Jacobson-Galán et al. 2024 for specifics of the model matching procedure). As shown in Figure 2, the early-time evolution of SN 2024ggi is most consistent with the r1w6 model, suggesting a mass-loss rate of M⊙ yr-1and a dense CSM (i.e., optically thick to electron scattering) that extends to cm. In Figure 5 we show that the line profiles in SN 2024ggi during the first few days of SN 2024ggi are decently matched by the r1w6 model and that a lower mass-loss rate model (e.g., M⊙ yr-1; r1w5r) cannot match the duration of the IIn-like features. However, notable differences include the lack of N iii and the strong He ii at +0.8 days that is not present in SN 2024ggi and inability of the r1w6 model to adequately reproduce the complete N iii/He ii complex i.e., the model profile is too narrow as was observed in SN 2023ixf (Jacobson-Galán et al., 2023), which could be due to the fact that these simulations assume spherical symmetry and/or require higher kinetic energies. After , the r1w6 model spectra show a narrow P-Cygni profile combined with broad absorption that extends to in Balmer transitions. However, while this is qualitatively the behavior observed in SN 2024ggi, there is no narrow P Cygni observed until the day spectra and the absorption profiles in SN 2024ggi extend to much larger velocities of . This mismatch is likely due to increased ejecta deceleration in the models that is not present in SN 2024ggi and/or the CSM of SN 2024ggi is asymmetric, allowing for some parts of the SN ejecta that only encounter low density CSM to retain higher velocities. Asymmetric CSM has been proposed for similar events such as SNe 1998S and 2023ixf (Leonard et al., 2000; Vasylyev et al., 2023) based on spectropolarimetry. Furthermore, it is expected that the dense shell formed from post-shock gas should break up, even for a spherical explosion and spherical CSM, which would lead to a much more complicated structure than is obtained when spherical symmetry is imposed.
In addition to direct spectral comparison, we also use the peak absolute magnitudes and rise-times in all UV/optical filters to determine the best-matched models from the CMFGEN grid. Using the residuals between the model predictions and observables, we find that SN 2024ggi is best matched by the r1w4, m1em2, r1w6 and r1w6b models, which have a mass-loss range of M⊙ yr-1and radii of dense CSM that ranges from cm. We note that the m1em2 model (Dessart & Jacobson-Galán, 2023) does not have a confined shell of dense CSM but rather has a continuous density profile that extends to cm (e.g., see Fig. 6). Furthermore, the r1w4 model ( M⊙ yr-1) cannot reproduce the spectral evolution of SN 2024ggi because the IIn-like features are not sustained for a long enough timescale. Additionally, matching the observed in SN 2024ggi to the model grid produces only three consistent models: m1em2, r1w6, r1w6a, all with M⊙ yr-1. As shown in Figure 1, the complete m1em2 and r1w6a model light curves provide a decent match to the multi-band SN 2024ggi light curve at maximum light but cannot capture the steep rise to peak. This inconsistency is likely the result of the CSM density profile immediately beyond and/or the limitations of the simulations at very early phases (e.g., day).
| Host Galaxy | NGC 3621 | |
| Redshift | 0.002215 | |
| Distance | Mpc444Saha et al. (2006) | |
| Time of First Light (MJD) | ||
| 0.07 mag555Schlegel et al. (1998); Schlafly & Finkbeiner (2011) | ||
| mag666Stritzinger et al. (2018) | ||
| [] | mag[ d] | |
| [] | mag[ d] | |
| [] | mag[ d] | |
| [] | mag[ d] | |
| [] | mag[ d] | |
| [] | mag[ d] | |
| [] | mag[ d] | |
| RCSM | cm | |
| MCSM | ||
| 777Mass-loss within cm | yr-1 | |
| CSM Composition | Solar Metallicity888Not varied in model grid | |
| Time of | 3 years pre-SN |
4 Discussion
Observations of SN 2024ggi for 2 weeks after first light have helped to constrain both the explosion dynamics/physics as well as progenitor activity prior to core-collapse. Specifically, the observed change in ionization present in the day spectra (Fig. 5) and the rise in temperature shown by the red-to-blue color evolution (Fig. 1) suggests that we caught the SN as the shock broke out of the optically-thick envelope and into the extended, dense, and initially cold CSM. Rather than a prompt rise in temperature to K, the CSM heats up to a lower temperature and becomes progressively more ionized (e.g., He i/ii, C iii/iv, or N iii/iv/v) on a day timescale as the radiative precursor, and then the radiation from the shock/ejecta, diffuses through the CSM. Furthermore, comparison of the spectral series, , peak luminosities and rise-times to a grid of CMFGEN models indicates that the progenitor of SN 2024ggi was likely a RSG with a mass-loss rate of yr-1, which created dense CSM extending to cm that contained a total mass of . We also find that the observed light curve can be matched with standard explosion energy ( erg) and that the IIn-like signatures in SN 2024ggi can be modeled with a CSM composition that matches typical RSG surface abundances, which suggests that significant N or He enrichment to the CSM may not be required.
For a wind velocity of , the proposed CSM extent translates to a period of enhanced mass-loss in the last 3 years years prior to core-collapse. Similarly, for the observed and a shock velocity of , the dense CSM would extend to cm and would indicate enhanced mass-loss in the final years before first light, for a progenitor wind velocity of . From the spectral evolution of SN 2024ggi in its first two weeks, it is clear that a reduction in CSM density did occur at days because as the CSM optical depth to electron-scattering drops below unity, the Lorentzian wings of the IIn-like features disappear and absorption profiles from the fastest moving material become visible. However, the open question is whether the CSM detected in SN 2024ggi represents the only high-density shell of CSM (i.e. only one phase of enhanced mass-loss) that extends to cm (e.g., r1w6 model density profile) or if SN 2024ggi sustained enhanced mass-loss for several decades before explosion (e.g., m1em2 model density profile). As was done for SN 2023ixf, future multi-wavelength monitoring will be able to determine the CSM density at larger scales as the SN shock samples material that was liberated from the progenitor star years-to-decades before explosion (Grefenstette et al. 2023; Berger et al. 2023; Chandra et al. 2024; Panjkov et al. 2023, Nayana et al., in prep). Overall, both the confined high-density CSM shell and the extended low-density wind may have made the RSG progenitor star quite dust-obscured prior to explosion (Davies et al., 2022), similar to what was revealed by pre-explosion imaging of the SN 2023ixf RSG progenitor (Kilpatrick et al., 2023; Jencson et al., 2023; Qin et al., 2023; Soraisam et al., 2023; Van Dyk et al., 2023; Niu et al., 2023).
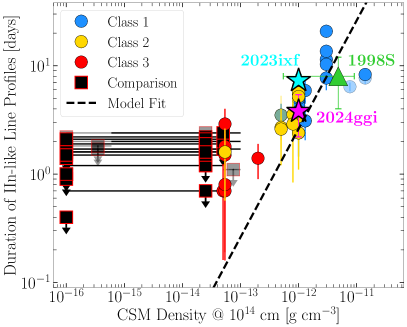
As shown in Figures 4 & 7, the observables and best-matched CSM properties of SN 2024ggi reside naturally within the continuum of SNe II, both with and without spectroscopic signatures of interaction with dense CSM. SN 2024ggi’s best-matched and CSM density at cm is lower than that inferred for more extreme Class 1 events such as SNe 1998S, 2017ahn, 2018zd, 2020tlf, 2020pni and 2023ixf, all of which likely have higher mass-loss rates, and/or dense CSM that extends to larger radii. Nonetheless, SN 2024ggi’s evolution requires a progenitor mass-loss rate that is significantly higher than what is inferred for standard SNe II as well as what is measured in local RSGs (Beasor et al., 2020). Overall, this continues to point towards a phase of enhanced mass-loss in the final years before explosion for some significant fraction of RSGs.
5 Conclusions
In this paper we have presented UV/optical/NIR observations of the nearby SN II, 2024ggi located in nearby spiral host galaxy NGC 3621 at Mpc. Below we summarize the primary observational findings of SN 2024ggi:
-
•
The first optical spectrum of SN 2024ggi shows prominent narrow emission lines of H i, He i, N iii and C iii that result from the photo-ionization of dense, optically thick CSM. Between days, SN 2024ggi exhibits a detectable rise in temperature and ionization that manifests as the appearance of higher ionization species such as He ii, N iv/v, C iv, and O v. This spectral evolution is temporally consistent with a dramatic red-to-blue evolution in colors and an increasing blackbody temperature. These phenomena suggest that SN 2024ggi was observed during the initial precursor associated with shock breakout inside dense CSM.
-
•
SN 2024ggi displayed electron-scattering broadened profiles (i.e., IIn-like) that persist on a characteristic timescale of days, after which time a decrease in optical depth to electron scattering due to a reduction in CSM density allows for the detection of broad absorption profiles from the fastest H-rich SN ejecta.
-
•
Interaction of the SN 2024ggi ejecta with dense, confined CSM yielded peak UV/optical absolute magnitudes (e.g., mag, mag) that are consistent with other SNe II with IIn-like features presented in sample studies (e.g., Jacobson-Galán et al. 2024).
-
•
Comparison of SN 2024ggi’s spectral evolution, peak absolute magnitudes, rise-times and duration of IIn-like profiles to a grid of CMFGEN simulations suggests a CSM that has a composition typical of a solar-metallicity RSG, confined to cm, and that is formed from a progenitor mass-loss rate of yr-1 (i.e., g cm-3 at cm). Adopting a wind velocity of , this scenario corresponds to a period of enhanced mass-loss during the last 3 years years before core-collapse.
-
•
SN 2024ggi is similar to SN 2023ixf in its rise in ionization within days of first light and the high-ionization species present in its early-time spectra, both objects likely observed during shock breakout within dense CSM. However, SN 2024ggi has a shorter timescale of IIn-like features ( days vs. days) and a more compact CSM ( cm vs cm) despite a similar mass-loss rate and CSM density at cm.
Like SN 2023ixf, SN 2024ggi represents a unique opportunity to study the long-term, multi-wavelength evolution of a SN II that interact with dense, confined CSM in exquisite detail. Future studies and multi-wavelength observations will probe the nature and late-stage evolution of the progenitor star as well as uncover the properties of the large-scale circumstellar environment, both of which tracing an unconstrained period of RSG evolution before core-collapse.
6 Acknowledgements
Research at UC Berkeley is conducted on the territory of Huichin, the ancestral and unceded land of the Chochenyo speaking Ohlone people, the successors of the sovereign Verona Band of Alameda County. Shane 3-m observations were conducted on the land of the Ohlone (Costanoans), Tamyen and Muwekma Ohlone tribes.
W.J.-G. is supported by the National Science Foundation Graduate Research Fellowship Program under Grant No. DGE-1842165. W.J.-G. acknowledges support through NASA grants in support of Hubble Space Telescope program GO-16075 and 16500. This research was supported in part by the National Science Foundation under Grant No. NSF PHY-1748958. R.M. acknowledges support by the National Science Foundation under Award No. AST-2221789 and AST-2224255. The Margutti team at UC Berkeley is partially funded by the Heising-Simons Foundation under grant # 2018-0911 and #2021-3248 (PI: Margutti).
MRD acknowledges support from the NSERC through grant RGPIN-2019-06186, the Canada Research Chairs Program, and the Dunlap Institute at the University of Toronto. Parts of this research were supported by the Australian Research Council Discovery Early Career Researcher Award (DECRA) through project number DE230101069. Y.-C.P. is supported by the National Science and Technology Council (NSTC grant 109-2112-M-008-031-MY3. CG is supported by a VILLUM FONDEN Young Investigator Grant (project number 25501). D.M. acknowledges NSF support from grants PHY-2209451 and AST-2206532. A.S. acknowledges the financial support from CNPq (402577/2022-1). G.D. is supported by the H2020 European Research Council grant no.758638. CRB acknowledges the financial support from CNPq (316072/2021-4) and from FAPERJ (grants 201.456/2022 and 210.330/2022) and the FINEP contract 01.22.0505.00 (ref. 1891/22). This research is based on observations made with the Thai Robotic Telescope under program ID TRTC11B006, which is operated by the National Astronomical Research Institute of Thailand (Public Organization). Part of the data were obtained with the REM telescope, located in Chile and operated by the d’REM team for INAF. This work is supported by the National Science Foundation under Cooperative Agreement PHY-2019786 (The NSF AI Institute for Artificial Intelligence and Fundamental Interactions, http://iaifi.org/).
The UCSC team is supported in part by NASA grants NNG17PX03C and 80NSSC22K1518, NSF grant AST–1815935, and by a fellowship from the David and Lucile Packard Foundation to R.J.F.
YSE-PZ (Coulter et al., 2023) was developed by the UC Santa Cruz Transients Team with support from NASA grants NNG17PX03C, 80NSSC19K1386, and 80NSSC20K0953; NSF grants AST-1518052, AST-1815935, and AST-1911206; the Gordon & Betty Moore Foundation; the Heising-Simons Foundation; a fellowship from the David and Lucile Packard Foundation to R.J.F.; Gordon and Betty Moore Foundation postdoctoral fellowships and a NASA Einstein fellowship, as administered through the NASA Hubble Fellowship program and grant HST-HF2-51462.001, to D.O.J.; and a National Science Foundation Graduate Research Fellowship, administered through grant No. DGE-1339067, to D.A.C.
A major upgrade of the Kast spectrograph on the Shane 3 m telescope at Lick Observatory, led by Brad Holden, was made possible through generous gifts from the Heising-Simons Foundation, William and Marina Kast, and the University of California Observatories. Research at Lick Observatory is partially supported by a generous gift from Google.
This work has made use of data from the Asteroid Terrestrial-impact Last Alert System (ATLAS) project. The Asteroid Terrestrial-impact Last Alert System (ATLAS) project is primarily funded to search for near earth asteroids through NASA grants NN12AR55G, 80NSSC18K0284, and 80NSSC18K1575; byproducts of the NEO search include images and catalogs from the survey area. This work was partially funded by Kepler/K2 grant J1944/80NSSC19K0112 and HST GO-15889, and STFC grants ST/T000198/1 and ST/S006109/1. The ATLAS science products have been made possible through the contributions of the University of Hawaii Institute for Astronomy, the Queen’s University Belfast, the Space Telescope Science Institute, the South African Astronomical Observatory, and The Millennium Institute of Astrophysics (MAS), Chile.
This research was supported by the Munich Institute for Astro-, Particle and BioPhysics (MIAPbP) which is funded by the Deutsche Forschungsgemeinschaft (DFG, German Research Foundation) under Germany’s Excellence Strategy – EXC-2094 – 390783311.
IRAF is distributed by NOAO, which is operated by AURA, Inc., under cooperative agreement with the National Science Foundation (NSF).
References
- Andrews et al. (2023) Andrews, J. E., Pearson, J., Hosseinzadeh, G., et al. 2023, arXiv e-prints, arXiv:2310.16092. https://arxiv.org/abs/2310.16092
- Antonelli et al. (2003) Antonelli, L. A., Zerbi, F. M., Chincarini, G., et al. 2003, Mem. Soc. Astron. Italiana, 74, 304
- Beasor et al. (2020) Beasor, E. R., Davies, B., Smith, N., et al. 2020, MNRAS, 492, 5994, doi: 10.1093/mnras/staa255
- Becker (2015) Becker, A. 2015, HOTPANTS: High Order Transform of PSF ANd Template Subtraction, Astrophysics Source Code Library. http://ascl.net/1504.004
- Berger et al. (2023) Berger, E., Keating, G., Alexander, K., et al. 2023, Transient Name Server AstroNote, 131, 1
- Bostroem et al. (2023) Bostroem, K. A., Pearson, J., Shrestha, M., et al. 2023, arXiv e-prints, arXiv:2306.10119, doi: 10.48550/arXiv.2306.10119
- Brown et al. (2014) Brown, P. J., Breeveld, A. A., Holland, S., Kuin, P., & Pritchard, T. 2014, Ap&SS, 354, 89, doi: 10.1007/s10509-014-2059-8
- Bruch et al. (2021) Bruch, R. J., Gal-Yam, A., Schulze, S., et al. 2021, ApJ, 912, 46, doi: 10.3847/1538-4357/abef05
- Bruch et al. (2023) Bruch, R. J., Gal-Yam, A., Yaron, O., et al. 2023, ApJ, 952, 119, doi: 10.3847/1538-4357/acd8be
- Chandra et al. (2024) Chandra, P., Chevalier, R. A., Maeda, K., Ray, A. K., & Nayana, A. J. 2024, ApJ, 963, L4, doi: 10.3847/2041-8213/ad275d
- Chevalier & Fransson (2017) Chevalier, R. A., & Fransson, C. 2017, in Handbook of Supernovae, ed. A. W. Alsabti & P. Murdin, 875, doi: 10.1007/978-3-319-21846-5_34
- Chevalier & Irwin (2011) Chevalier, R. A., & Irwin, C. M. 2011, ApJ, 729, L6, doi: 10.1088/2041-8205/729/1/L6
- Chevalier & Irwin (2012) —. 2012, ApJ, 747, L17, doi: 10.1088/2041-8205/747/1/L17
- Chugai (2001) Chugai, N. N. 2001, MNRAS, 326, 1448, doi: 10.1111/j.1365-2966.2001.04717.x
- Chugai & Utrobin (2023) Chugai, N. N., & Utrobin, V. P. 2023, Astronomy Letters, 49, 639, doi: 10.1134/S1063773723350013
- Clemens et al. (2004) Clemens, J. C., Crain, J. A., & Anderson, R. 2004, Society of Photo-Optical Instrumentation Engineers (SPIE) Conference Series, Vol. 5492, The Goodman spectrograph, ed. A. F. M. Moorwood & M. Iye, 331–340, doi: 10.1117/12.550069
- Coulter et al. (2022) Coulter, D. A., Jones, D. O., McGill, P., et al. 2022, YSE-PZ: An Open-source Target and Observation Management System, v0.3.0, Zenodo, Zenodo, doi: 10.5281/zenodo.7278430
- Coulter et al. (2023) —. 2023, PASP, 135, 064501, doi: 10.1088/1538-3873/acd662
- Cushing et al. (2004) Cushing, M. C., Vacca, W. D., & Rayner, J. T. 2004, PASP, 116, 362, doi: 10.1086/382907
- Dastidar et al. (2024) Dastidar, R., Pignata, G., Dukiya, N., et al. 2024, arXiv e-prints, arXiv:2403.00927, doi: 10.48550/arXiv.2403.00927
- Davies et al. (2022) Davies, B., Plez, B., & Petrault, M. 2022, MNRAS, 517, 1483, doi: 10.1093/mnras/stac2427
- Dessart et al. (2015) Dessart, L., Audit, E., & Hillier, D. J. 2015, MNRAS, 449, 4304, doi: 10.1093/mnras/stv609
- Dessart et al. (2016) Dessart, L., Hillier, D. J., Audit, E., Livne, E., & Waldman, R. 2016, MNRAS, 458, 2094, doi: 10.1093/mnras/stw336
- Dessart et al. (2009) Dessart, L., Hillier, D. J., Gezari, S., Basa, S., & Matheson, T. 2009, MNRAS, 394, 21, doi: 10.1111/j.1365-2966.2008.14042.x
- Dessart et al. (2013) Dessart, L., Hillier, D. J., Waldman, R., & Livne, E. 2013, MNRAS, 433, 1745, doi: 10.1093/mnras/stt861
- Dessart & Jacobson-Galán (2023) Dessart, L., & Jacobson-Galán, W. V. 2023, A&A, 677, A105, doi: 10.1051/0004-6361/202346754
- Dessart et al. (2017) Dessart, L., John Hillier, D., & Audit, E. 2017, A&A, 605, A83, doi: 10.1051/0004-6361/201730942
- Finkbeiner et al. (2016) Finkbeiner, D. P., Schlafly, E. F., Schlegel, D. J., et al. 2016, ApJ, 822, 66, doi: 10.3847/0004-637X/822/2/66
- Fitzpatrick (1999) Fitzpatrick, E. L. 1999, PASP, 111, 63, doi: 10.1086/316293
- Gal-Yam et al. (2014) Gal-Yam, A., Arcavi, I., Ofek, E. O., et al. 2014, Nature, 509, 471, doi: 10.1038/nature13304
- Gehrels et al. (2004) Gehrels, N., Chincarini, G., Giommi, P., et al. 2004, ApJ, 611, 1005, doi: 10.1086/422091
- Goldberg et al. (2022) Goldberg, J. A., Jiang, Y.-F., & Bildsten, L. 2022, ApJ, 933, 164, doi: 10.3847/1538-4357/ac75e3
- González et al. (2007) González, M., Audit, E., & Huynh, P. 2007, A&A, 464, 429, doi: 10.1051/0004-6361:20065486
- Grefenstette et al. (2023) Grefenstette, B. W., Brightman, M., Earnshaw, H. P., Harrison, F. A., & Margutti, R. 2023, ApJ, 952, L3, doi: 10.3847/2041-8213/acdf4e
- Haynie & Piro (2021) Haynie, A., & Piro, A. L. 2021, ApJ, 910, 128, doi: 10.3847/1538-4357/abe938
- Hillier & Dessart (2012) Hillier, D. J., & Dessart, L. 2012, MNRAS, 424, 252, doi: 10.1111/j.1365-2966.2012.21192.x
- Hiramatsu et al. (2021) Hiramatsu, D., Howell, D. A., Van Dyk, S. D., et al. 2021, Nature Astronomy, 5, 903, doi: 10.1038/s41550-021-01384-2
- Hiramatsu et al. (2023) Hiramatsu, D., Tsuna, D., Berger, E., et al. 2023, ApJ, 955, L8, doi: 10.3847/2041-8213/acf299
- Hoogendam et al. (2024) Hoogendam, W., Auchettl, K., Tucker, M., et al. 2024, Transient Name Server AstroNote, 103, 1
- Horne (1986) Horne, K. 1986, PASP, 98, 609, doi: 10.1086/131801
- Hosseinzadeh et al. (2018) Hosseinzadeh, G., Valenti, S., McCully, C., et al. 2018, ApJ, 861, 63, doi: 10.3847/1538-4357/aac5f6
- Hosseinzadeh et al. (2022) Hosseinzadeh, G., Kilpatrick, C. D., Dong, Y., et al. 2022, ApJ, 935, 31, doi: 10.3847/1538-4357/ac75f0
- Hosseinzadeh et al. (2023) Hosseinzadeh, G., Farah, J., Shrestha, M., et al. 2023, ApJ, 953, L16, doi: 10.3847/2041-8213/ace4c4
- Huang & Chevalier (2018a) Huang, C., & Chevalier, R. A. 2018a, MNRAS, 475, 1261, doi: 10.1093/mnras/stx3163
- Huang & Chevalier (2018b) —. 2018b, MNRAS, 475, 1261, doi: 10.1093/mnras/stx3163
- Irani et al. (2023) Irani, I., Morag, J., Gal-Yam, A., et al. 2023, arXiv e-prints, arXiv:2310.16885, doi: 10.48550/arXiv.2310.16885
- Jacobson-Galán et al. (2022) Jacobson-Galán, W. V., Dessart, L., Jones, D. O., et al. 2022, ApJ, 924, 15, doi: 10.3847/1538-4357/ac3f3a
- Jacobson-Galán et al. (2023) Jacobson-Galán, W. V., Dessart, L., Margutti, R., et al. 2023, ApJ, 954, L42, doi: 10.3847/2041-8213/acf2ec
- Jacobson-Galán et al. (2024) Jacobson-Galán, W. V., Dessart, L., Davis, K. W., et al. 2024, arXiv e-prints, arXiv:2403.02382, doi: 10.48550/arXiv.2403.02382
- Jencson et al. (2023) Jencson, J. E., Pearson, J., Beasor, E. R., et al. 2023, ApJ, 952, L30, doi: 10.3847/2041-8213/ace618
- Khazov et al. (2016) Khazov, D., Yaron, O., Gal-Yam, A., et al. 2016, ApJ, 818, 3, doi: 10.3847/0004-637X/818/1/3
- Kilpatrick et al. (2018) Kilpatrick, C. D., Takaro, T., Foley, R. J., et al. 2018, MNRAS, 480, 2072, doi: 10.1093/mnras/sty2022
- Kilpatrick et al. (2023) Kilpatrick, C. D., Foley, R. J., Jacobson-Galán, W. V., et al. 2023, arXiv e-prints, arXiv:2306.04722, doi: 10.48550/arXiv.2306.04722
- Kirkpatrick et al. (2011) Kirkpatrick, J. D., Cushing, M. C., Gelino, C. R., et al. 2011, ApJS, 197, 19, doi: 10.1088/0067-0049/197/2/19
- Labrie et al. (2023) Labrie, K., Simpson, C., Cardenes, R., et al. 2023, Research Notes of the American Astronomical Society, 7, 214, doi: 10.3847/2515-5172/ad0044
- Leonard et al. (2000) Leonard, D. C., Filippenko, A. V., Barth, A. J., & Matheson, T. 2000, ApJ, 536, 239, doi: 10.1086/308910
- Li et al. (2024) Li, G., Hu, M., Li, W., et al. 2024, Nature, 627, 754, doi: 10.1038/s41586-023-06843-6
- McCully et al. (2018) McCully, C., Volgenau, N. H., Harbeck, D.-R., et al. 2018, in Society of Photo-Optical Instrumentation Engineers (SPIE) Conference Series, Vol. 10707, Software and Cyberinfrastructure for Astronomy V, ed. J. C. Guzman & J. Ibsen, 107070K, doi: 10.1117/12.2314340
- Miller & Stone (1993) Miller, J. S., & Stone, R. P. S. 1993, LOTRM
- Moriya et al. (2023) Moriya, T. J., Subrayan, B. M., Milisavljevic, D., & Blinnikov, S. I. 2023, PASJ, 75, 634, doi: 10.1093/pasj/psad024
- Nakaoka et al. (2018) Nakaoka, T., Kawabata, K. S., Maeda, K., et al. 2018, ApJ, 859, 78, doi: 10.3847/1538-4357/aabee7
- Niu et al. (2023) Niu, Z., Sun, N.-C., Maund, J. R., et al. 2023, ApJ, 955, L15, doi: 10.3847/2041-8213/acf4e3
- Onken et al. (2024) Onken, C. A., Wolf, C., Bessell, M. S., et al. 2024, arXiv e-prints, arXiv:2402.02015, doi: 10.48550/arXiv.2402.02015
- Panjkov et al. (2023) Panjkov, S., Auchettl, K., Shappee, B. J., et al. 2023, arXiv e-prints, arXiv:2308.13101, doi: 10.48550/arXiv.2308.13101
- Pearson et al. (2023) Pearson, J., Hosseinzadeh, G., Sand, D. J., et al. 2023, ApJ, 945, 107, doi: 10.3847/1538-4357/acb8a9
- Qin et al. (2023) Qin, Y.-J., Zhang, K., Bloom, J., et al. 2023, arXiv e-prints, arXiv:2309.10022, doi: 10.48550/arXiv.2309.10022
- Rest et al. (2005) Rest, A., Stubbs, C., Becker, A. C., et al. 2005, ApJ, 634, 1103, doi: 10.1086/497060
- Roming et al. (2005) Roming, P. W. A., Kennedy, T. E., Mason, K. O., et al. 2005, Space Sci. Rev., 120, 95, doi: 10.1007/s11214-005-5095-4
- Saha et al. (2006) Saha, A., Thim, F., Tammann, G. A., Reindl, B., & Sandage, A. 2006, ApJS, 165, 108, doi: 10.1086/503800
- Santos et al. (2024) Santos, A., Kilpatrick, C. D., Bom, C. R., et al. 2024, MNRAS, 529, 59, doi: 10.1093/mnras/stae466
- Sarin et al. (2023) Sarin, N., Hübner, M., Omand, C. M. B., et al. 2023, arXiv e-prints, arXiv:2308.12806, doi: 10.48550/arXiv.2308.12806
- Schechter et al. (1993) Schechter, P. L., Mateo, M., & Saha, A. 1993, PASP, 105, 1342, doi: 10.1086/133316
- Schlafly & Finkbeiner (2011) Schlafly, E. F., & Finkbeiner, D. P. 2011, ApJ, 737, 103, doi: 10.1088/0004-637X/737/2/103
- Schlegel et al. (1998) Schlegel, D. J., Finkbeiner, D. P., & Davis, M. 1998, ApJ, 500, 525, doi: 10.1086/305772
- Shingles et al. (2021) Shingles, L., Smith, K. W., Young, D. R., et al. 2021, Transient Name Server AstroNote, 7, 1
- Shrestha et al. (2024) Shrestha, M., Pearson, J., Wyatt, S., et al. 2024, ApJ, 961, 247, doi: 10.3847/1538-4357/ad11e1
- Smith et al. (2020) Smith, K. W., Smartt, S. J., Young, D. R., et al. 2020, PASP, 132, 085002, doi: 10.1088/1538-3873/ab936e
- Smith et al. (2023) Smith, N., Pearson, J., Sand, D. J., et al. 2023, arXiv e-prints, arXiv:2306.07964, doi: 10.48550/arXiv.2306.07964
- Smith et al. (2015) Smith, N., Mauerhan, J. C., Cenko, S. B., et al. 2015, MNRAS, 449, 1876, doi: 10.1093/mnras/stv354
- Soraisam et al. (2023) Soraisam, M. D., Szalai, T., Van Dyk, S. D., et al. 2023, ApJ, 957, 64, doi: 10.3847/1538-4357/acef22
- Srivastav et al. (2024) Srivastav, S., Chen, T. W., Smartt, S. J., et al. 2024, Transient Name Server AstroNote, 100, 1
- Stritzinger et al. (2018) Stritzinger, M. D., Taddia, F., Burns, C. R., et al. 2018, A&A, 609, A135, doi: 10.1051/0004-6361/201730843
- Subrayan et al. (2023) Subrayan, B. M., Milisavljevic, D., Moriya, T. J., et al. 2023, ApJ, 945, 46, doi: 10.3847/1538-4357/aca80a
- Tartaglia et al. (2021) Tartaglia, L., Sand, D. J., Groh, J. H., et al. 2021, ApJ, 907, 52, doi: 10.3847/1538-4357/abca8a
- Teja et al. (2023) Teja, R. S., Singh, A., Basu, J., et al. 2023, ApJ, 954, L12, doi: 10.3847/2041-8213/acef20
- Terreran et al. (2016) Terreran, G., Jerkstrand, A., Benetti, S., et al. 2016, MNRAS, 462, 137, doi: 10.1093/mnras/stw1591
- Terreran et al. (2022) Terreran, G., Jacobson-Galán, W. V., Groh, J. H., et al. 2022, ApJ, 926, 20, doi: 10.3847/1538-4357/ac3820
- Tonry et al. (2024) Tonry, J., Denneau, L., Weiland, H., et al. 2024, Transient Name Server Discovery Report, 2024-1020, 1
- Tonry et al. (2018) Tonry, J. L., Denneau, L., Heinze, A. N., et al. 2018, PASP, 130, 064505, doi: 10.1088/1538-3873/aabadf
- Tsuna et al. (2023) Tsuna, D., Murase, K., & Moriya, T. J. 2023, arXiv e-prints, arXiv:2301.10667, doi: 10.48550/arXiv.2301.10667
- Vacca et al. (2003) Vacca, W. D., Cushing, M. C., & Rayner, J. T. 2003, PASP, 115, 389, doi: 10.1086/346193
- Van Dyk et al. (2023) Van Dyk, S. D., Srinivasan, S., Andrews, J. E., et al. 2023, arXiv e-prints, arXiv:2308.14844, doi: 10.48550/arXiv.2308.14844
- Vasylyev et al. (2023) Vasylyev, S. S., Yang, Y., Filippenko, A. V., et al. 2023, ApJ, 955, L37, doi: 10.3847/2041-8213/acf1a3
- Vaytet et al. (2011) Vaytet, N. M. H., Audit, E., Dubroca, B., & Delahaye, F. 2011, J. Quant. Spec. Radiat. Transf., 112, 1323, doi: 10.1016/j.jqsrt.2011.01.027
- Waxman & Katz (2017) Waxman, E., & Katz, B. 2017, in Handbook of Supernovae, ed. A. W. Alsabti & P. Murdin, 967, doi: 10.1007/978-3-319-21846-5_33
- Yaron et al. (2017) Yaron, O., Perley, D. A., Gal-Yam, A., et al. 2017, Nature Physics, 13, 510, doi: 10.1038/nphys4025
- Zhai et al. (2024) Zhai, Q., Li, L., Zhang, J., & Wang, X. 2024, Transient Name Server Classification Report, 2024-1031, 1
- Zhang et al. (2020) Zhang, J., Wang, X., József, V., et al. 2020, MNRAS, 498, 84, doi: 10.1093/mnras/staa2273
- Zimmerman et al. (2024) Zimmerman, E. A., Irani, I., Chen, P., et al. 2024, Nature, 627, 759, doi: 10.1038/s41586-024-07116-6
Here we present a log of optical spectroscopic observations of SN 2024ggi in Table A1.
| UT Date | MJD | PhaseaaRelative to first light (MJD 60410.80) | Telescope | Instrument | Wavelength Range |
|---|---|---|---|---|---|
| (days) | (Å) | ||||
| 2024-04-12T06:10:08.92 | 60412.26 | 1.46 | Shane | Kast | 3254–10495 |
| 2024-04-13T00:00:05.88 | 60413.00 | 2.20 | SOAR | TripleSpec | 8243.4–24667.1 |
| 2024-04-13T00:41:21.57 | 60413.03 | 2.22 | SOAR | Goodman | 3816–7030 |
| 2024-04-16 06:21:35.01 | 60416.26 | 5.46 | Shane | Kast | 3603–10293 |
| 2024-04-16T06:34:06.69 | 60416.27 | 5.47 | Shane | Kast | 5800–7000 |
| 2024-04-19T23:41:17.00 | 60419.99 | 9.19 | Gemini-S | GMOS | 4000–7580 |
| 2024-04-20T01:32:39.64 | 60420.06 | 9.26 | SOAR | TripleSpec | 8243.0–24667.5 |
| 2024-04-20T02:19:26.89 | 60420.10 | 9.30 | SOAR | Goodman | 3854–8986 |