CO Observations of Early-mid Stage Major-mergers in MaNGA Survey
Abstract
We present a study of the molecular gas in early-mid stage major-mergers, with a sample of 43 major-merger galaxy pairs selected from the Mapping Nearby Galaxies at Apache Point Observatory (MaNGA) survey and a control sample of 195 isolated galaxies selected from the xCOLD GASS survey. Adopting kinematic asymmetry as a new effective indicator to describe the merger stage, we aim to study the role of molecular gas in the merger-induced star formation enhancement along the merger sequence of galaxy pairs. We obtain the molecular gas properties from CO observations with the James Clerk Maxwell Telescope (JCMT), Institut de Radioastronomie Milimetrique (IRAM) 30-m telescope, and the MASCOT survey. Using these data, we investigate the differences in molecular gas fraction (), star formation rate (SFR), star formation efficiency (SFE), molecular-to-atomic gas ratio (), total gas fraction (), and the star formation efficiency of total gas () between the pair and control samples. In the full pair sample, our results suggest the of paired galaxies is significantly enhanced, while the SFE is comparable to that of isolated galaxies. We detect significantly increased and in paired galaxies at the pericenter stage, indicating an accelerated transition from atomic gas to molecular gas due to interactions. Our results indicate that the elevation of plays a major role in the enhancement of global SFR in paired galaxies at the pericenter stage, while the contribution of enhanced SFE in specific regions requires further explorations through spatially resolved observations of a larger sample spanning a wide range of merger stages.
monthyearday\THEYEAR \monthname[\THEMONTH] \twodigit\THEDAY \acceptjournalThe Astrophysical Journal Supplement Series
1 Introduction
Merging galaxies are believed to play a fundamental role in regulating hierarchical galaxy formation and evolution (e.g., Toomre & Toomre, 1972; Toomre, 1977; Barnes & Hernquist, 1992). Numerous observations and numerical simulations have revealed the drastic influences of galaxy interactions and mergers, such as the enhancement of star formation (e.g., Xu & Sulentic, 1991; Mihos & Hernquist, 1996; Ellison et al., 2008; Li et al., 2008; Xu et al., 2010), regulation of gas (e.g., Hibbard & van Gorkom, 1996; Ellison et al., 2018; Hani et al., 2018; Lisenfeld et al., 2019; Moreno et al., 2019), triggering of active galactic nucleus (AGN; e.g., Kennicutt & Keel, 1984; Ellison et al., 2011; Satyapal et al., 2014; Goulding et al., 2018), and redistribution of metallicities (e.g., Kewley et al., 2006; Rupke et al., 2010; Scudder et al., 2012; Torrey et al., 2012). As a crucial and evident effect, the enhancement of star formation rate (SFR) depends on multiple factors, such as the properties of the progenitor galaxies (e.g., Mihos & Hernquist, 1996; Cox et al., 2008; Xu et al., 2010), orbital parameters of the interacting galaxies (e.g., Kennicutt et al., 1987; Keel, 1993; Sparre & Springel, 2016; Xu et al., 2021), and the interacting phase of galaxies (Di Matteo et al., 2007; Scudder et al., 2012; Patton et al., 2013). The strongest SFR enhancement or starbursts are believed to occur after first pericenter and during coalescence, supported by studies of major-merger galaxy pairs (Nikolic et al., 2004; Scudder et al., 2012; Moreno et al., 2015; Pan et al., 2019) and (ultra) luminous infrared galaxies ((U)LIRGs) in interacting systems (e.g., Sanders & Mirabel, 1996; Veilleux et al., 2002; Haan et al., 2011; Ellison et al., 2013; Thorp et al., 2019).
Theoretical models and numerical simulations have predicted that the gravitational tidal torques induced by galaxy interactions can trigger strong gas inflows in the interstellar medium (ISM), resulting in the enhancement of SFR and nuclear starbursts (Barnes & Hernquist, 1991, 1996; Mihos & Hernquist, 1996; Iono et al., 2004; Hopkins et al., 2009, 2013). Hence, studies of the cold gas in the ISM provide a crucial approach for investigating how star formation is enhanced during galaxy interactions, and two major mechanisms have been commonly proposed by observational studies. The first scenario suggests that the merger-induced external pressure can accelerate the transition from atomic (H i) to molecular () gas (e.g., Braine & Combes, 1993; Elmegreen, 1993; Kaneko et al., 2017), leading to the observed enrichment of the molecular gas reservoir (traced by CO) and enhancement of SFR (Braine & Combes, 1993; Combes et al., 1994; Casasola et al., 2004; Wilson et al., 2008; Lisenfeld et al., 2019; Shangguan et al., 2019). The second perspective attributes enhanced star formation to the increased density of molecular gas in the galactic center, thereby boosting the efficiency of star formation (Solomon & Sage, 1988; Sofue et al., 1993; Gao & Solomon, 1999; Michiyama et al., 2016; Yamashita et al., 2017). Recent observations of galaxy pairs have found enhancement of both gas fraction () and SFE (Violino et al., 2018; Pan et al., 2018). Thus, it remains unclear whether the enhancement of SFR is driven by the total amount of molecular gas, SFE, or both.
To test the theoretical predictions and investigate the mutual impact of molecular gas and SFR along the evolutionary merger sequence, several factors that may affect the results should be addressed for observational studies. First, the selection and comparison of galaxy pairs and control galaxies could introduce biased results if the global properties are not carefully controlled between samples (Braine & Combes, 1993; Michiyama et al., 2016). Furthermore, single-dish CO observations provide a crucial and efficient approach to the evaluation and analysis of global galactic quantities. However, results from single-dish observations should be taken with caution considering the limitation of spatial resolution. Previous CO observations performed with interferometers have found consistent results relative to the single-dish observations but often suffered from limited numbers and types of targets (e.g., Iono et al., 2009; Ueda et al., 2014; Xu et al., 2021; Hou et al., 2023). A recent study used the Atacama Large Millimetre Array (ALMA) to observe 31 mergers selected from the MaNGA survey, and they have found that merger-induced star formation can be driven by a variety of mechanisms, with comparable contributions from both and SFE (Thorp et al., 2022). Another less explored but crucial factor pertains to the lack of rigorously defined merger stages, particularly in studies involving galaxy pairs (Pan et al., 2019).
The commonly adopted definition of the merger stage in galaxy pairs highly relies on the projected separation () and the difference between line-of-sight velocities () (Ellison et al., 2008; Zuo et al., 2018; Feng et al., 2019; Zhang et al., 2020), which has been hampered by several shortcomings. Considering the projection effect, relying solely on the projected separation () may introduce large uncertainty in deriving the physical separation of member galaxies (Soares, 2007). Furthermore, galaxy pairs with the same separation can be in different merger stages. Although the degree of interactions has been commonly characterized by galaxy morphology (e.g., Toomre, 1977; Barrera-Ballesteros et al., 2015; Smith et al., 2018; Pan et al., 2019), a more sensitive and quantitative indicator is required to study the early-stage galaxy pairs (Feng et al., 2020). With the emergence of integral field unit (IFU) surveys on nearby galaxies, such as the Calar Alto Legacy Integral Field Area survey (CALIFA, Sánchez et al., 2012) and the Sydney-AAO Multi-object Integral field spectrograph galaxy survey (SAMI, Croom et al., 2012), recent studies have exploited unique data of gas kinematics and revealed connections between the asymmetry of gas kinematics and galaxy interactions (Barrera-Ballesteros et al., 2015; Bloom et al., 2018). Using the IFU data from Mapping Nearby Galaxies at Apache Point Observatory (MaNGA) survey (Bundy et al., 2015), Feng et al. (2020) investigated the kinematic asymmetry of the ionized gas in a large sample of paired galaxies. By fitting the velocity maps of H gas, Feng et al. (2020) quantified the degree of kinematic asymmetry (), which depicts the asymmetry of velocity field contributed by the interaction-induced non-rotating motion. The value of serves as an indicator of galaxy interaction strength in statistical analyses (see details in Feng et al., 2020). They find a significant enhancement in the star formation rate of paired galaxies with high kinematic asymmetries, while those with low kinematic asymmetries show no enhancement of SFR whether at small or large projected separations. For paired galaxies with high kinematic asymmetries, the enhancement of SFR presents a tight anti-correlation with projected separation. These findings suggest that the combination of kinematic asymmetry and projected separation is effective in quantifying the stage of galaxy pairs, consistent with previous findings that used projected separation and morphology to determine merger stages (e.g., Pan et al., 2019). By employing 24 high-resolution idealized hydrodynamical galaxy merger simulations based on the “Feedback In Realistic Environment” (FIRE-2) model, this new method has been confirmed to be highly effective in distinguishing mergers in different stages, e.g., mergers during pericentric passages and in/after the final coalescence (McElroy et al., 2022).
Given that the enhancement of star formation during galaxy-galaxy interactions requires sustaining gas supply, we conduct studies on the cold gas properties of galaxy pairs at different merger stages. Yu et al. (2022) compiled a major-merger galaxy pair sample selected from the MaNGA survey to study the H i content of merging galaxies (Yu et al., 2022), adopting the kinematic asymmetry and projected separation as indicators of the merging stage (Feng et al., 2020). Their results suggest that the H i gas fraction of major-merger galaxy pairs, on average, is marginally decreased by 15% relative to isolated galaxies, implying mild H i depletion during galaxy interactions (Yu et al., 2022). In particular, galaxy pairs during the pericenter passage present the largest H i deficiency (26%, Yu et al., 2022). Based on these previous findings, it is necessary to observe the molecular gas to test whether the detection of H i deficiency is attributed to the accelerated conversion from atomic gas to molecular gas in galaxy pairs.
To study the interplay between galaxy-galaxy interactions and the molecular gas properties along the merger sequence, we conducted CO observations for a sample of 43 major-merger paired galaxies selected from the MaNGA survey (Bundy et al., 2015), with ancillary H i data from the HI-MaNGA survey (Stark et al., 2021) and Yu et al. (2022). This paper is organized as follows. In Section 2, we introduce the sample selection of galaxy pairs, observation setup, and data reduction in this work. We then present the main results of the molecular gas properties and star formation in Section 3, with a further discussion presented in Section 4. Finally, we summarize the main results in Section 5. Throughout the whole paper, we adopt the standard CDM cosmology with km s-1 Mpc-1, , and .
2 Samples and Data
2.1 Pair Sample
In our parent sample (Feng et al., 2019, 2020), we selected the isolated galaxy pairs based on the following criteria: (1) the projected separation for member galaxies: 5 kpc 200 kpc, (2) the line-of-sight velocity difference: 500 km , (3) each member of the pair has only one neighbor satisfying the above criteria, (4) at least one member galaxy of each pair has been observed in the MaNGA survey (Bundy et al., 2015), and the member galaxy has more than 70% spaxels with H emission at S/N 5 within 1.5 effective radius (), and (5) we only study star-forming galaxies (log) in this work. To study major-merger pairs, we constrain the mass ratio as , where and represent the stellar masses of primary galaxies and companions, respectively. Among the selected major-merger galaxy pairs, we adopt a mass cut of to match the stellar mass range of the control sample (Saintonge et al., 2017) used in this work (see section 2.2).
The final pair sample consists of 43 major-merger galaxies in pairs, of which 36 paired galaxies are observed through our PI programs, and 7 sources are adopted from the MaNGA-ARO Survey of CO Targets (MASCOT; Wylezalek et al., 2022). Based on the previous morphological classification (Yu et al., 2022), this sample comprises 36 spiral+spiral (S+S) and seven spiral+elliptical (S+E) pairs, and all the observed sources in the sample are spiral galaxies. The redshift range of this sample spans from 0.017 to 0.062. We adopt the SFR and stellar mass () for each pair from the public catalog of MPA-JHU DR7111https://wwwmpa.mpa-garching.mpg.de/SDSS/DR7/#derived. For all the galaxies in the pair sample, the following key parameters are presented in Table 1:
-
1.
MaNGA ID: source name presented by MaNGA plate-ifu, with B representing the companion galaxy of the primary MaNGA galaxy.
-
2.
R.A. : right ascension in degrees.
-
3.
Decl. : declination in degrees.
-
4.
z: SDSS spectroscopic redshift.
-
5.
log() : stellar mass from the MPA-JHU Catalog.
-
6.
log(SFR) : SFR from the MPA-JHU Catalog.
-
7.
: kinematic asymmetry measured from H velocity maps. The velocity map is divided into a sequence of concentric elliptical rings and fitted with the Fourier series, and the kinematic asymmetry is defined as the ratio between high-order (sum from two to five orders) and first-order coefficients: , where is the coefficient of the nth-order Fourier component (Feng et al., 2020).
-
8.
: projected separation.
- 9.
-
10.
: isophotal optical major radius at the isophotal level 25 mag arcsec-1 in the r band from the NASA/IPAC Extragalactic Database (NED)222https://ned.ipac.caltech.edu/.
-
11.
: inclination from NED.
-
12.
: aperture correction calculated with Equation (3).
-
13.
log(): molecular gas mass calculated from the total CO line luminosity after aperture correction, details in Section 2.4.
-
14.
Stage: merging stage based on and , see Section 2.2 for the definition; 1, 2, and 3 represent pre-passage, pericenter, and apocenter, respectively.
-
15.
Type: type of the galaxy pair, with SS and SE representing SpiralSpiral and SpiralElliptical pairs, respectively.
-
16.
Blending: source blending in H i observations, with Y and N representing yes and no for source blending problems, respectively.
| MaNGA ID | R.A. | Decl. | log() | log(SFR) | log() | log() | Stage | Type | Blending | ||||||||||
|---|---|---|---|---|---|---|---|---|---|---|---|---|---|---|---|---|---|---|---|
| (deg.) | (deg.) | () | () | ( kpc) | () | (″) | (°) | () | |||||||||||
| 8078-6104 | 42.73943 | 0.36941 | 0.04421 | 10\@alignment@align.03 | 0.66 | 0\@alignment@align.179 | 18.35 | 9.88 | 2\@alignment@align.9 | 58 | 1\@alignment@align.52 | 9.39 | 2 | SS | Y | ||||
| 8078-6104B | 42.73145 | 0.36689 | 0.04391 | 10\@alignment@align.21 | 0.49 | 0\@alignment@align.179 | 18.35 | 9.88 | 2\@alignment@align.8 | 34 | 1\@alignment@align.67 | 9.59 | 2 | SS | Y | ||||
| 8082-12703 | 49.51165 | -0.53896 | 0.02104 | 10\@alignment@align.33 | -0.11 | 0\@alignment@align.0295 | 63.14 | 9.50 | 5\@alignment@align.3 | 69 | 1\@alignment@align.73 | 9.65 | 3 | SS | Y | ||||
| 8085-12704 | 52.61990 | 0.81150 | 0.03080 | 10\@alignment@align.55 | -0.15 | 0\@alignment@align.0221 | 98.10 | 10.07 | 4\@alignment@align.6 | 65 | 1\@alignment@align.69 | 9.20 | 1 | SS | Y | ||||
| 8153-12701 | 39.63722 | -0.86747 | 0.03923 | 9\@alignment@align.72 | -0.35 | 0\@alignment@align.0422 | 158.83 | 10.00 | 3\@alignment@align.2 | 48 | 1\@alignment@align.65 | 8.79 | 3 | SS | Y | ||||
| 8250-6101 | 138.75315 | 42.02439 | 0.02790 | 10\@alignment@align.28 | 0.89 | 0\@alignment@align.0396 | 44.97 | 9.88 | 4\@alignment@align.1 | 53 | 1\@alignment@align.79 | 9.75 | 2 | SS | Y | ||||
| 8260-6101 | 182.40876 | 42.00967 | 0.02288 | 9\@alignment@align.89 | 0.15 | 0\@alignment@align.0293 | 28.93 | 9.50 | 3\@alignment@align.7 | 57 | 1\@alignment@align.69 | 8.86 | 2 | SS | Y | ||||
| 8338-6102 | 172.68267 | 22.36354 | 0.02236 | 9\@alignment@align.45 | -0.09 | 0\@alignment@align.0360 | 76.13 | 9.29 | 3\@alignment@align.0 | 41 | 1\@alignment@align.68 | 8.34 | 3 | SS | N | ||||
| 8450-6102 | 171.74883 | 21.14168 | 0.04177 | 10\@alignment@align.17 | 0.67 | 0\@alignment@align.0516 | 57.37 | 9.72 | 3\@alignment@align.1 | 34 | 1\@alignment@align.77 | 9.37 | 3 | SE | N | ||||
| 8456-12702 | 149.96826 | 45.28310 | 0.02349 | 9\@alignment@align.39 | -0.04 | 0\@alignment@align.0813 | 13.35 | 9.98 | 6\@alignment@align.5 | 76 | 1\@alignment@align.76 | 8.55 | 2 | SS | Y | ||||
| 8547-12702 | 217.91070 | 52.74946 | 0.04566 | 10\@alignment@align.62 | 0.02 | 0\@alignment@align.0187 | 137.28 | 10.40 | 5\@alignment@align.8 | 81 | 1\@alignment@align.64 | 9.31 | 1 | SE | N | ||||
| 8552-12702 | 227.92840 | 43.97044 | 0.02758 | 9\@alignment@align.25 | 0.05 | 0\@alignment@align.0558 | 90.60 | 9.73 | 4\@alignment@align.0 | 73 | 1\@alignment@align.55 | 8.92 | 3 | SS | Y | ||||
| 8588-12702 | 250.31305 | 39.29009 | 0.03054 | 9\@alignment@align.71 | -0.08 | 0\@alignment@align.0648 | 88.57 | 9.95 | 5\@alignment@align.2 | 54 | 1\@alignment@align.91 | 8.93 | 3 | SS | N | ||||
| 8656-1901 | 7.71740 | 0.52876 | 0.01914 | 9\@alignment@align.08 | -0.31 | 0\@alignment@align.0293 | 101.03 | 9.22 | 3\@alignment@align.1 | 44 | 1\@alignment@align.67 | 8.55 | 3 | SS | N | ||||
| 8656-3703 | 7.75250 | 0.43575 | 0.01917 | 9\@alignment@align.36 | -0.55 | 0\@alignment@align.0232 | 101.21 | 9.22 | 3\@alignment@align.3 | 54 | 1\@alignment@align.63 | 8.11 | 1 | SS | N | ||||
| 8657-12704 | 10.40833 | 0.25764 | 0.01807 | 9\@alignment@align.08 | -0.50 | 0\@alignment@align.0998 | 47.61 | 9.41 | 3\@alignment@align.1 | 35 | 1\@alignment@align.74 | 8.10 | 2 | SS | N | ||||
| 8728-12701 | 57.72958 | -7.06065 | 0.02841 | 10\@alignment@align.50 | -0.03 | 0\@alignment@align.0716 | 66.78 | 9.78 | 4\@alignment@align.8 | 20 | 2\@alignment@align.19 | 9.36 | 3 | SE | N | ||||
| 8981-6101 | 185.94406 | 36.15281 | 0.03332 | 10\@alignment@align.82 | 0.09 | 0\@alignment@align.0320 | 81.77 | 9.89 | 5\@alignment@align.0 | 49 | 1\@alignment@align.94 | 9.68 | 3 | SS | Y | ||||
| 8981-6101B | 186.00444 | 36.15589 | 0.03336 | 10\@alignment@align.82 | -0.22 | 0\@alignment@align.0320 | 81.77 | 9.59 | 2\@alignment@align.9 | 24 | 1\@alignment@align.75 | 9.10 | 3 | SS | Y | ||||
| 9027-12702 | 243.98368 | 31.40677 | 0.02256 | 10\@alignment@align.00 | 0.06 | 0\@alignment@align.0210 | 129.06 | 9.80 | 5\@alignment@align.7 | 65 | 1\@alignment@align.83 | 9.02 | 1 | SS | N | ||||
| 9027-9101 | 243.90740 | 31.32130 | 0.02220 | 10\@alignment@align.15 | -0.11 | 0\@alignment@align.0352 | 126.97 | 9.59 | 3\@alignment@align.8 | 66 | 1\@alignment@align.59 | 8.76 | 3 | SS | Y | ||||
| 9030-3702 | 241.23416 | 30.52573 | 0.05540 | 10\@alignment@align.67 | 0.86 | 0\@alignment@align.0219 | 48.27 | 10.49 | 2\@alignment@align.5 | 30 | 1\@alignment@align.66 | 9.79 | 1 | SS | Y | ||||
| 9032-3704 | 241.21561 | 30.52601 | 0.05537 | 10\@alignment@align.49 | 0.73 | 0\@alignment@align.0152 | 48.27 | 10.49 | 2\@alignment@align.3 | 34 | 1\@alignment@align.56 | 9.99 | 1 | SS | Y | ||||
| 9050-9101 | 245.99844 | 21.79503 | 0.03209 | 10\@alignment@align.24 | 0.52 | 0\@alignment@align.0310 | 41.92 | 9.20 | 3\@alignment@align.9 | 43 | 1\@alignment@align.82 | 9.71 | 2 | SS | Y | ||||
| 9050-9101B | 245.99284 | 21.82049 | 0.03209 | 10\@alignment@align.24 | 0.28 | 0\@alignment@align.0310 | 41.92 | 9.20 | 2\@alignment@align.8 | 35 | 1\@alignment@align.67 | 9.45 | 2 | SS | Y | ||||
| 9093-12701 | 239.75272 | 27.98539 | 0.05140 | 10\@alignment@align.61 | 0.30 | 0\@alignment@align.1533 | 24.43 | 4\@alignment@align.0 | 68 | 1\@alignment@align.58 | 9.90 | 2 | SS | Y | |||||
| 9094-12703 | 239.74204 | 27.98753 | 0.05210 | 10\@alignment@align.63 | 0.78 | 0\@alignment@align.0411 | 24.43 | 4\@alignment@align.6 | 73 | 1\@alignment@align.60 | 10.00 | 2 | SS | Y | |||||
| 9094-12705 | 240.46430 | 26.31944 | 0.04393 | 9\@alignment@align.85 | -0.11 | 0\@alignment@align.0445 | 176.34 | 10.05 | 4\@alignment@align.1 | 74 | 1\@alignment@align.54 | 9.24 | 3 | SE | N | ||||
| 9185-9101 | 256.21228 | 34.81733 | 0.05683 | 10\@alignment@align.81 | 1.39 | 0\@alignment@align.193 | 7.25 | 10.09 | 2\@alignment@align.3 | 21 | 1\@alignment@align.62 | 10.49 | 2 | SS | Y | ||||
| 9488-9102 | 126.70413 | 20.36485 | 0.02510 | 9\@alignment@align.75 | 0.27 | 0\@alignment@align.0804 | 190.82 | 10.31 | 4\@alignment@align.4 | 23 | 2\@alignment@align.14 | 8.48 | 3 | SS | N | ||||
| 9499-12703 | 118.42323 | 26.49270 | 0.03742 | 10\@alignment@align.82 | 0.07 | 0\@alignment@align.0281 | 78.04 | 10.17 | 4\@alignment@align.4 | 40 | 1\@alignment@align.98 | 9.60 | 1 | SE | N | ||||
| 9507-12701 | 128.25074 | 26.01405 | 0.01763 | 9\@alignment@align.87 | -0.47 | 0\@alignment@align.0668 | 21.83 | 9.62 | 12\@alignment@align.8 | 82 | 2\@alignment@align.14 | 9.09 | 2 | SE | N | ||||
| 9509-6103 | 123.06447 | 26.20257 | 0.02508 | 10\@alignment@align.04 | -0.06 | 0\@alignment@align.0147 | 87.35 | 9.71 | 3\@alignment@align.1 | 33 | 1\@alignment@align.75 | 9.30 | 1 | SS | N | ||||
| 9881-6102 | 205.21316 | 24.47331 | 0.02705 | 10\@alignment@align.77 | -0.05 | 0\@alignment@align.0195 | 152.23 | 9.99 | 5\@alignment@align.4 | 19 | 2\@alignment@align.32 | 9.81 | 1 | SE | N | ||||
| 9889-1902 | 234.85860 | 24.94357 | 0.02286 | 9\@alignment@align.98 | 0.63 | 0\@alignment@align.0240 | 7.92 | 9.13 | 3\@alignment@align.0 | 53 | 1\@alignment@align.58 | 8.91 | 1 | SS | Y | ||||
| 9889-1902B | 234.86460 | 24.94762 | 0.02291 | 10\@alignment@align.41 | 0.99 | 0\@alignment@align.0240 | 7.92 | 9.13 | 4\@alignment@align.7 | 46 | 1\@alignment@align.93 | 9.65 | 1 | SS | Y | ||||
| 8252-9101 | 144.69238 | 48.56287 | 0.02478 | 9\@alignment@align.45 | 0.13 | 0\@alignment@align.0383 | 82.20 | 9.27 | 0\@alignment@align.7 | 25 | 1\@alignment@align.09 | 9.04 | 3 | SS | Y | ||||
| 8624-12703 | 264.23954 | 59.20029 | 0.03070 | 10\@alignment@align.46 | 0.62 | 0\@alignment@align.0501 | 143.76 | 9.51 | 5\@alignment@align.0 | 66 | 1\@alignment@align.34 | 9.54 | 3 | SS | Y | ||||
| 8945-12701 | 171.89808 | 47.37939 | 0.03273 | 9\@alignment@align.94 | 0.45 | 0\@alignment@align.0578 | 100.36 | 10.32 | 3\@alignment@align.9 | 29 | 1\@alignment@align.43 | 8.89 | 3 | SS | Y | ||||
| 8979-3704 | 244.42297 | 40.93382 | 0.06209 | 10\@alignment@align.80 | 0.96 | 0\@alignment@align.0376 | 188.99 | 4\@alignment@align.3 | 51 | 1\@alignment@align.37 | 9.57 | 3 | SS | N | |||||
| 8987-3701 | 136.24989 | 28.34772 | 0.04864 | 10\@alignment@align.04 | 0.85 | 0\@alignment@align.0157 | 44.75 | 10.08 | 2\@alignment@align.2 | 38 | 1\@alignment@align.24 | 9.12 | 1 | SS | Y | ||||
| 9034-3702 | 226.28033 | 46.96366 | 0.03771 | 9\@alignment@align.83 | 0.39 | 0\@alignment@align.0174 | 63.88 | 3\@alignment@align.2 | 51 | 1\@alignment@align.29 | 9.10 | 1 | SS | Y | |||||
| 9508-6104 | 127.55302 | 26.62732 | 0.05299 | 10\@alignment@align.82 | 1.12 | 0\@alignment@align.0294 | 105.66 | 10.03 | 3\@alignment@align.7 | 66 | 1\@alignment@align.26 | 9.77 | 3 | SS | Y | ||||
Note. — A detailed description of this table’s contents is given in Section 2.1.
2.2 Subsamples and Control Sample
The definition of the merger stage follows previous H i observations (Yu et al., 2022) and the statistical studies of SFR enhancement in MaNGA galaxy pairs (Feng et al., 2020), which relies on the combination of kinematic asymmetry () and projected separation (). Adopting the statistical results of Feng et al. (2020), we divide the pair sample into two subsamples based on their values: low asymmetry () and high asymmetry (). We adopt the boundary of based on previous H i observations (Yu et al., 2022), which has also been confirmed to be effective in determining merger stages by simulations of 24 galaxy mergers using the FIRE-2 model (McElroy et al., 2022). In particular, paired galaxies after the pericentric passage exhibit a more disturbed velocity field compared to pairs before the passage (Hung et al., 2016; McElroy et al., 2022). Hence, we consider the galaxy pairs with low values as pairs to be in the pre-passage stage, indicating no significant interactions between member galaxies. During the sequence of galaxy interactions in pair-phase, simulations suggest a constant decrease in the physical separation before the pericentric passage, and then the separation will increase until the paired galaxies are approaching apocenter (Torrey et al., 2012; Moreno et al., 2015, 2019). In this work, we use the projected separation () as a reference to distinguish the pericenter and apocenter stages of galaxy pairs. Galaxy pairs with high value and 50 kpc are defined to be at the stage of pericenter passage, and those with high value and 50 kpc are regarded as being in the apocenter stage. The number of pairs in each stage is as follows: (1) Pre-passage: 13 ; (2) Pericenter passage: 12; (3) Apocenter passage: 18.
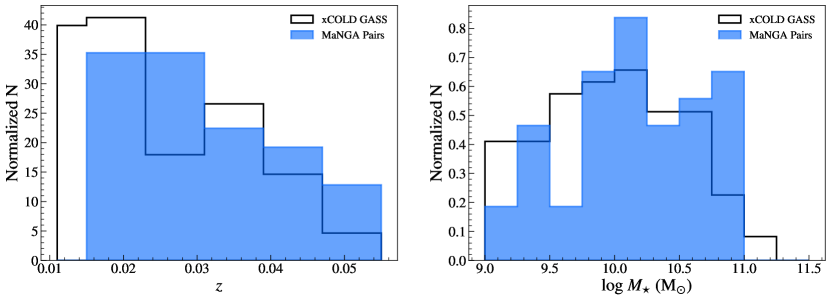
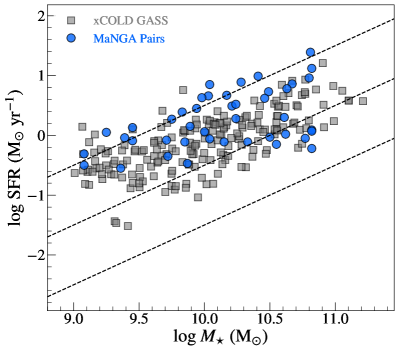
To systematically investigate the impacts of galaxy interactions on star formation and molecular gas properties, we compiled a control sample of isolated galaxies. The isolated galaxies are selected from the Extended CO Legacy Database for GASS (xCOLD GASS; Saintonge et al., 2017), with the requirement of having no bright neighbors () within 200 kpc and 500 km (Feng et al., 2020). To match with the star-forming galaxies in our pair sample, we require that the isolated galaxies have log. In total, we selected 195 isolated galaxies with both H i and CO data from xCOLD GASS as our control sample pool. To fairly compare with the paired galaxies, we also adopt the SFR and stellar mass () from the public catalog of MPA-JHU DR7 for the isolated galaxies. As shown in Figure 1, we compared the distributions of redshift and stellar mass between the galaxy pair sample and the control sample. The control sample tends to include more nearby galaxies at lower redshift () and more massive galaxies () at the high-mass end. To compare the galaxy properties in pairs and controls fairly, we conducted a galaxy-by-galaxy matching between the paired galaxies and isolated galaxies from the control sample pool for further analysis (see details in Section 3.3). Regarding kinematic asymmetry in isolated galaxies, a systematic study suggests that shows a significant anti-correlation with stellar mass only in low-mass galaxies at , and it is independent of H i gas content (Feng et al., 2022). Thus, after matching for stellar mass, we minimized potential bias due to the dependence of kinematic asymmetry on stellar mass at the low-mass end. In Figure 2, we present the distributions of paired galaxies and isolated galaxies in the SFR- plane. Galaxies in our galaxy pair sample are marked by blue circles. For the control sample, isolated galaxies selected from the xCOLD GASS survey are represented by grey squares. At a given stellar mass, the mean SFR of paired galaxies is higher than that of the isolated galaxies in the control sample.
2.3 Observations and Data
2.3.1 JCMT Observations
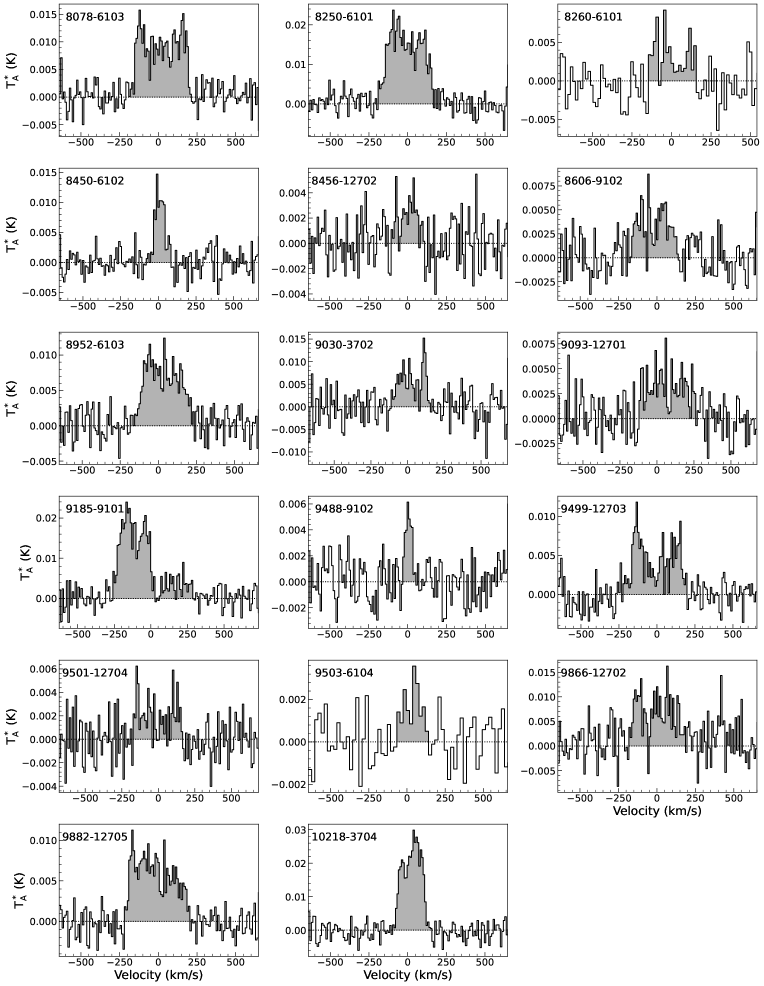
For part of the sources in our galaxy pair sample, we performed CO(21) observations through our PI program (M21BP051, PI: Q. Yu) with the James Clerk Maxwell Telescope (JCMT). 12CO(21) observations for 23 paired galaxies were carried out between September 2021 and December 2021, using the Nmakanui receiver at 230 GHz on JCMT. The beam size is 21 at the observed frequency. The observed sample consists of nine major-merger galaxy pairs and 14 minor merger pairs. The observations were conducted in beam switching mode with a throw of 180 in the azimuthal direction. The integration time for each source ranged between 10 and 60 minutes. The data were reduced using the Starlink software (Currie et al., 2014). We followed the standard procedure to calibrate individual exposures of each galaxy, and subsequently, we co-added the spectra for each source. After calibration, we rebinned the spectra to a velocity resolution of 10 . In some cases, the spectra were rebinned to a velocity of 20 to achieve tentative detections. By utilizing line-free channels as the fitting region, we subtracted a linear or second-order polynomial baseline from the spectrum. We converted the spectra from antenna temperature in K to Jy, adopting a conversion factor of 15.6/, where the aperture efficiency is 0.57. In total, we detected 17 CO(21) lines out of 23 sources, including nine major-merger galaxies and eight minor-merger galaxies. For each detected spectrum, we visually determined the line widths at zero level () and derived the velocity-integrated flux. For non-detections, we calculated the upper limits of velocity-integrated flux as
| (1) |
where is the channel width in kilometers per second, is the zero-level line width in kilometers per second, and rms is the root mean square noise in Kelvin. The non-detections are all minor mergers and are not included in the final pair sample. All the observing results are presented in Section 3.1 and Table 2.
2.3.2 IRAM 30m Observations
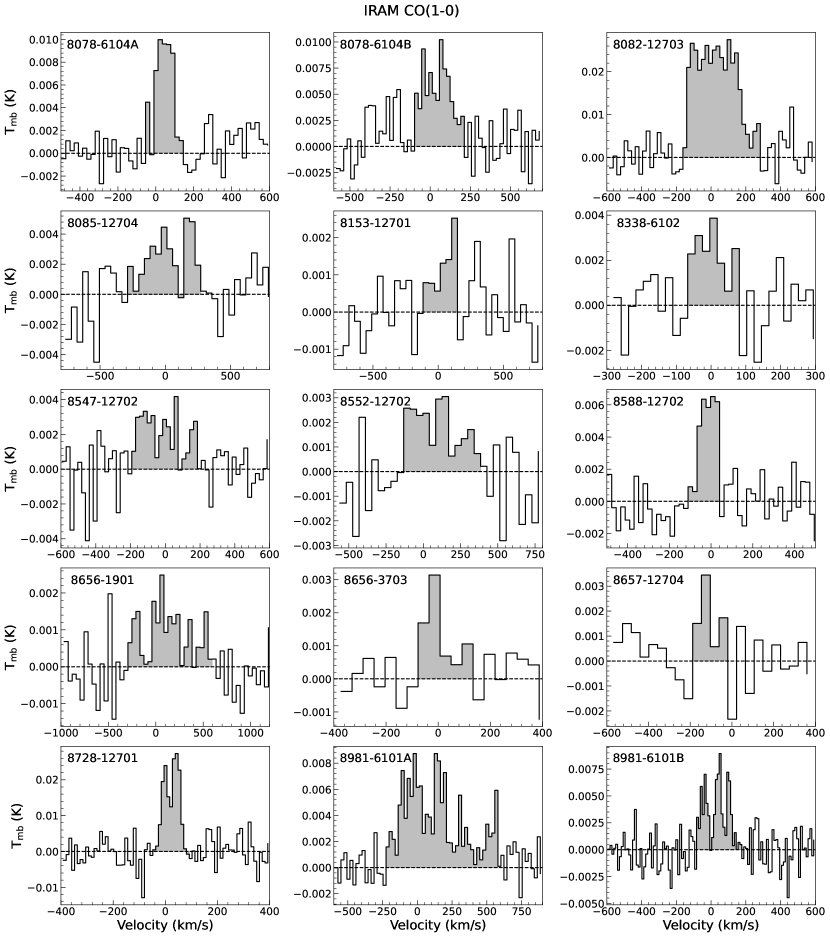
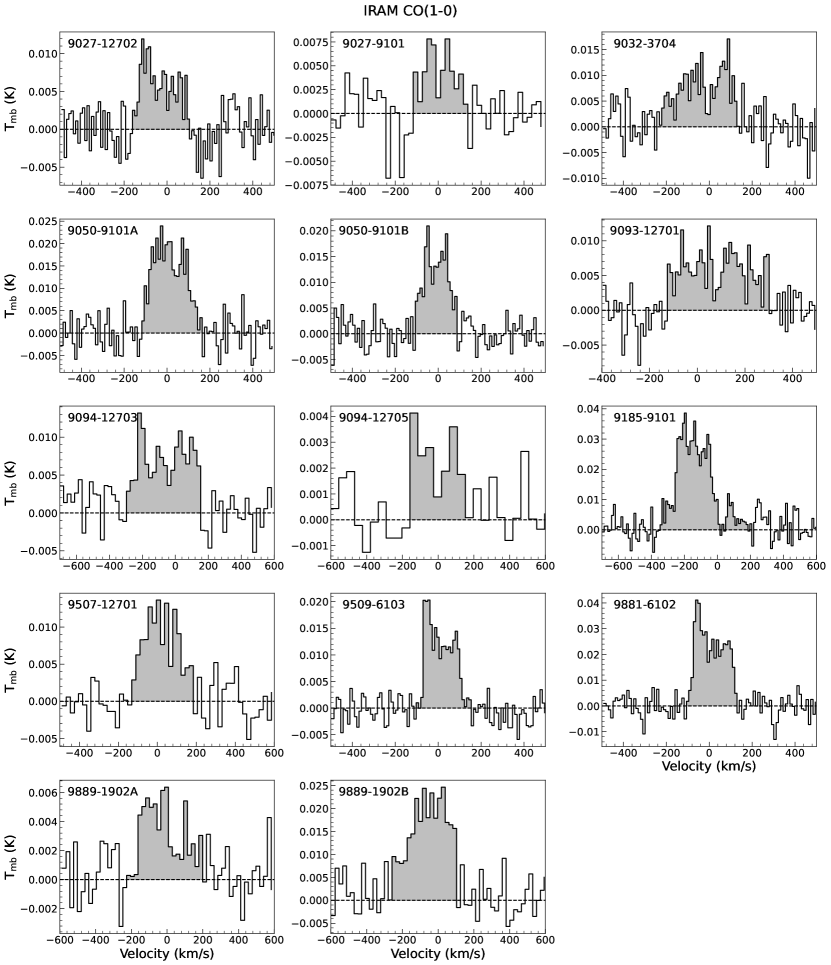
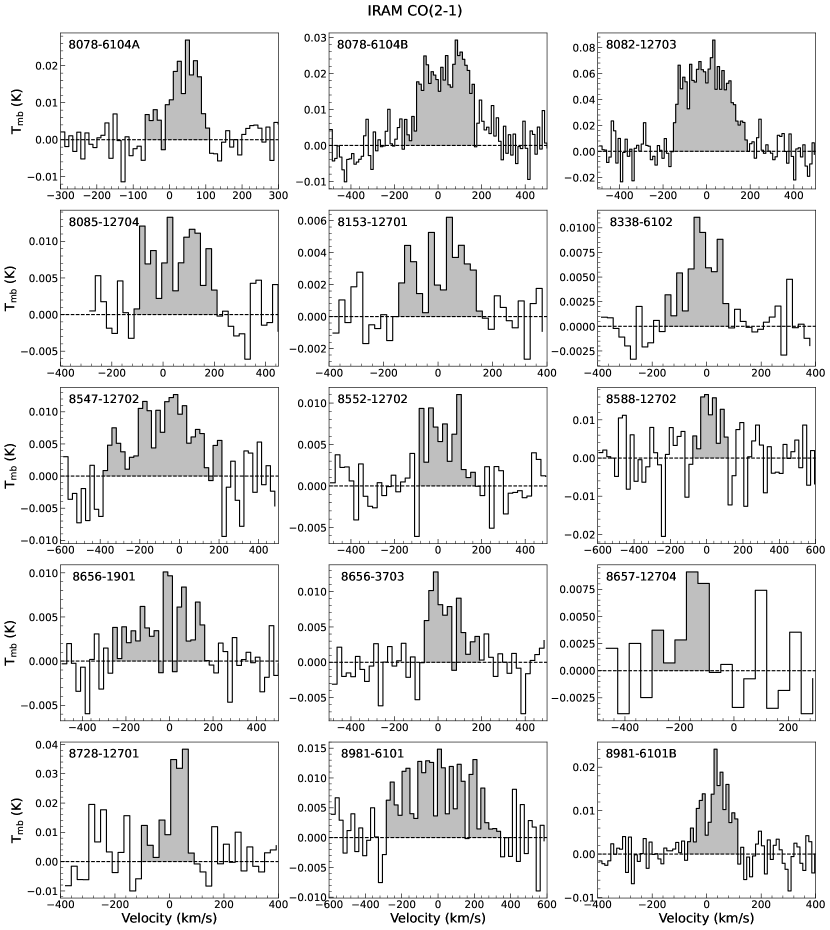
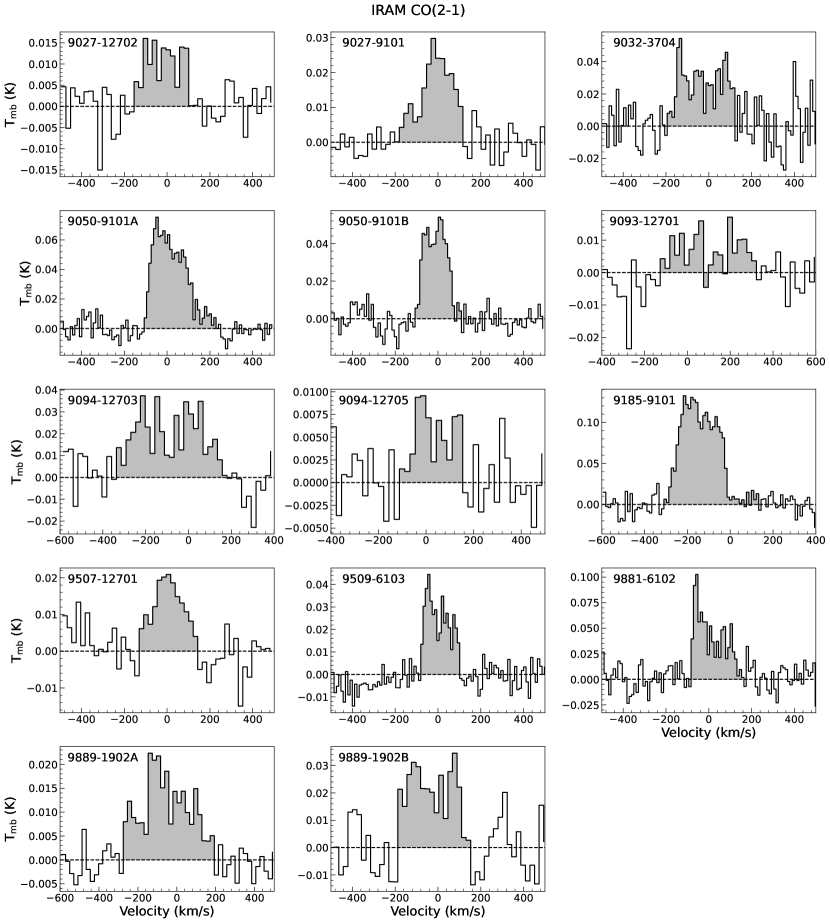
Through our PI programs (E01-21, 029-22, PI: Q. Yu) with the Institut de Radioastronomie Milimetrique (IRAM) 30 m telescope on Pico Veleta, we performed CO observations for 29 galaxies in the galaxy pair sample between 2022 March and 2022 July. For each target, the 12CO(10) and 12CO(21) lines were observed simultaneously, using the dual polarization receiver EMIR in combination with the autocorrelator FTS at a frequency resolution of 0.195 MHz (0.5 at CO(10)) and with the autocorrelator WILMA with a frequency resolution of 2 MHz (5 at CO(10)). The beam sizes are 22 and 11 for the CO(10) and CO(21) observations, respectively. We used wobbler switching mode to observe each source with a wobbler throw ranging between 90 and 110 in the azimuthal direction. The wobbler throw was individually chosen to mitigate potential contamination from the companion galaxy. We divided the observations of paired galaxies into different groups based on their redshifts, ensuring that both the CO(10) and CO(21) lines can be covered within the bandwidth of the receiver for each source. In our observing strategy, we continued observing each source until it achieved a detection with S/N 5 or until a rms of 2 mK () was achieved for a velocity resolution of 20 .
The data were reduced using the CLASS software in the GILDAS package333http://www.iram.fr/IRAMFR/GILDAS (Gildas Team, 2013). We initially inspected the spectra in individual scans and discarded low-quality scans with severe baseline issues before standard calibration. The baseline was subtracted with a constant or a linear function for each scan. Subsequently, we averaged and rebinned the spectra to achieve a velocity resolution of 20 . The final spectra were converted to the main beam temperature scale using the equation , where and represents the IRAM forward efficiency and the beam efficiency, respectively. For 115 GHz (230 GHz), the IRAM 30 m telescope has the of 0.95 (0.91) and the of 0.77 (0.58). In the subsequent analysis, we obtained the flux of the spectra by applying the -to-flux conversion factor of the IRAM 30 m telescope (5 Jy/K). We visually determined the line widths at zero level () and derived the velocity-integrated flux () for each spectrum. Given that the CO(10) and CO(21) lines were observed simultaneously, we constrained the line widths between the two transitions based on detected lines with higher S/N.
2.3.3 MASCOT Data
MASCOT (Wylezalek et al., 2022) is a CO(10) follow-up survey of MaNGA galaxies using the 12 m millimeter single dish telescope at the Arizona Radio Observatory (ARO). Aiming to measure the molecular gas content in MaNGA star-forming galaxies with , the MASCOT survey presents CO(1-0) observations for 187 MaNGA galaxies in its first data release (Wylezalek et al., 2022), with a beam size of 55″. After crossmatching with the parent sample described in Section 2.1, we included seven major-merger paired galaxies in our final galaxy pair sample, with CO data from the MASCOT survey.
2.4 Aperture Correction and Molecular Gas Mass
Considering the optical sizes of some galaxies are more extended than the telescope beams, single-pointing observations at the center of a galaxy need an aperture correction to derive the CO flux for the entire galaxy. Thus, we applied an aperture correction to all of the measured CO line fluxes following the method of Lisenfeld et al. (2011, 2019). We assume an exponential molecular gas disk with a scale length of , the CO flux can be described as:
| (2) |
where represents the CO flux in the central position and derived from the measured , is the CO scale length. Lisenfeld et al. (2011) has found the CO scale length well correlated to the optical radius at the 25 mag isophote, , and it can be derived as based on different CO observations of local spiral galaxies (Nishiyama et al., 2001; Regan et al., 2001; Leroy et al., 2008). Therefore, we collected the (see Table 1) measured in the band from the NASA/IPAC Extragalactic Database (NED) and calculated the for each source in the pair sample. Adopting the derived and inclination angle () from NED, we performed a 2D integration of the exponential disk following Equation (2) to compute the total CO flux from the entire disk (for details see Lisenfeld et al., 2011). After deriving the central CO flux () and the total CO flux (), the aperture correction factor () is defined as:
| (3) | ||||
where and are the molecular masses of the entire galaxy and the central pointing, respectively. The molecular gas mass is derived from the CO(10) luminosity as:
| (4) |
where is the CO-to- conversion factor. Considering the paired galaxies in our sample are mostly massive () and do not exhibit extreme starbursts, we adopt the Galactic value with (Bolatto et al., 2013). For the CO flux from the MASCOT survey, we performed the same aperture correction and adopted the Galactic value of . For isolated galaxies from xCOLD GASS, we adopted the same and recalculated the estimated mass. The is calculated following Solomon et al. (1997) as:
| (5) |
where is the total flux of CO(10) line in , represents the rest frequency of the spectral line in GHz, is the luminosity distance in Mpc, and is the redshift of the galaxy.
2.5 Atomic Gas
We use the H i data for 39 galaxy pairs from the pair sample taken from Yu et al. (2022). For the H i data used in this work, six sources were observed by our PI programs with the Five-hundred-meter Aperture Spherical radio Telescope (FAST). The remaining data are extracted from the HI-MaNGA survey. The HI-MaNGA survey is designed as an H i follow-up project for the SDSS-VI MaNGA survey, which mainly uses the Robert C. Byrd Green Bank Telescope (GBT) to perform H i observations in combination with data crossmatched from the Arecibo Legacy Fast ALFA (ALFALFA) survey (Haynes et al., 2018). The HI-MaNGA survey focuses on galaxies with a stellar mass in the range of and a redshift of (Masters et al., 2019; Stark et al., 2021). Due to the relatively large beam sizes, the H i observations of paired galaxies often suffered from the source blending problem (Zuo et al., 2018; Yu et al., 2022). Therefore, we adopt the same method of Yu et al. (2022) and consider a galaxy pair as a single system when calculating H i-related properties. For the S+S pairs, the and SFR are sums of two subcomponents, and then we divide these values and the H i mass by two to obtain the typical value for one of the member galaxies. For the S+E pairs, we follow the approach of previous studies (Zuo et al., 2018; Lisenfeld et al., 2019; Yu et al., 2022) and assume the H i content is mostly contributed by the spiral component, so only the spiral component is considered for and SFR.
| Source name | R.A. | Decl. | rms | S/N | |||
|---|---|---|---|---|---|---|---|
| (deg) | (deg) | (mK) | () | () | |||
| 8078-6103 | 42.41654 | -0.06985 | 2.10 | 26.4 | 3.47 0.37 | 415 10 | 1.93 |
| 8250-6101 | 138.75315 | 42.02439 | 2.11 | 39.7 | 4.94 0.51 | 368 10 | 1.79 |
| 8260-6101 | 182.40876 | 42.00967 | 2.35 | 6.1 | 1.02 0.19 | 320 10 | 1.69 |
| 8450-6102 | 171.74883 | 21.14168 | 2.02 | 11.2 | 0.93 0.12 | 174 10 | 1.77 |
| 8456-12702 | 149.96826 | 45.28310 | 1.78 | 5.4 | 0.43 0.09 | 215 10 | 1.76 |
| 8567-6102 | 119.31545 | 47.80304 | 0.75 | – | 0.28 | – | – |
| 8606-9102 | 255.70905 | 36.70675 | 1.84 | 10.4 | 1.07 0.15 | 324 10 | 1.69 |
| 8715-12704 | 121.17245 | 50.71853 | 0.98 | – | 0.37 | – | – |
| 8952-6103 | 204.67418 | 27.74241 | 1.95 | 19.9 | 2.5 0.28 | 431 10 | 1.85 |
| 8982-9102 | 202.68920 | 26.52161 | 1.02 | – | 0.39 | – | – |
| 9025-3701 | 246.41772 | 29.14761 | 1.18 | – | 0.46 | – | – |
| 9030-3702 | 241.23417 | 30.52578 | 3.08 | 9.3 | 1.51 0.22 | 278 10 | 1.66 |
| 9093-12703 | 239.75272 | 27.98539 | 1.94 | 10.2 | 1.24 0.17 | 395 10 | 1.60 |
| 9185-9101 | 256.21228 | 34.81733 | 2.41 | 27.3 | 4.96 0.53 | 569 10 | 1.65 |
| 9488-9102 | 126.70413 | 20.36485 | 1.52 | 6.3 | 0.28 0.05 | 94 10 | 2.14 |
| 9498-12704 | 118.18742 | 24.29509 | 0.81 | – | 0.32 | – | – |
| 9499-12703 | 118.42323 | 26.49270 | 1.33 | 21.0 | 1.80 0.20 | 432 10 | 1.98 |
| 9501-12704 | 129.37073 | 26.01438 | 1.62 | 7.1 | 0.68 0.12 | 350 10 | 1.56 |
| 9503-6104 | 120.40348 | 24.43890 | 1.07 | 4.6 | 0.34 0.08 | 229 20 | 1.46 |
| 9510-6101 | 127.85323 | 27.58001 | 0.82 | – | 0.31 | – | – |
| 9866-12702 | 243.20452 | 31.99319 | 4.02 | 10.1 | 2.43 0.34 | 380 10 | 1.99 |
| 9882-12705 | 207.78113 | 24.01823 | 1.47 | 25.7 | 2.42 0.26 | 434 10 | 1.88 |
| 10218-3704 | 119.16881 | 16.92011 | 2.26 | 34.9 | 3.94 0.41 | 264 10 | 1.86 |
Note. — The columns show (1) name of our targets; (2) R.A. in degrees; (3) Decl. in degrees (4) rms noise of the spectra at 10–40 , only non-detected spectra were rebinned to a velocity resolution of 40 ; (5) signal-to-noise ratio; (5) integrated flux in ; (6) the CO line width in measured at zero level; (7) aperture correction.
3 Results
| MaNGA ID | |||||||||
|---|---|---|---|---|---|---|---|---|---|
| plate-ifu | (mK) | (mK) | () | () | (mK) | (mK) | () | () | |
| 8078-6104 | 1.13 | 14.3 | 1.14 0.39 | 223 21 | 1.52 | 3.99 | 11.2 | 2.05 0.27 | 189 10 |
| 8078-6104B | 2.01 | 9.6 | 1.67 0.24 | 335 21 | 1.67 | 4.29 | 21.7 | 5.68 0.62 | 334 10 |
| 8082-12703 | 3.76 | 21.4 | 8.07 0.89 | 471 21 | 1.73 | 9.98 | 27.0 | 16.73 1.78 | 363 10 |
| 8085-12704 | 1.83 | 4.8 | 1.43 0.34 | 611 42 | 1.69 | 3.43 | 8.1 | 2.40 0.38 | 347 21 |
| 8153-12701 | 0.72 | 4.2 | 0.33 0.08 | 265 42 | 1.65 | 1.74 | 6.2 | 0.91 0.17 | 330 21 |
| 8338-6102 | 1.10 | 5.8 | 0.36 0.07 | 149 21 | 1.68 | 2.11 | 8.2 | 1.29 0.20 | 257 21 |
| 8547-12702 | 1.54 | 5.5 | 0.80 0.17 | 403 21 | 1.64 | 3.43 | 9.2 | 3.72 0.55 | 626 21 |
| 8552-12702 | 1.23 | 5.1 | 0.97 0.21 | 561 42 | 1.55 | 2.63 | 7.0 | 1.43 0.25 | 280 21 |
| 8588-12702 | 1.26 | 8.5 | 0.65 0.10 | 174 21 | 1.91 | 6.06 | 4.1 | 1.69 0.45 | 217 21 |
| 8656-1901 | 0.80 | 5.1 | 0.81 0.18 | 937 42 | 1.67 | 2.18 | 7.7 | 1.68 0.27 | 467 21 |
| 8656-3703 | 0.61 | 5.1 | 0.30 0.07 | 212 42 | 1.63 | 2.27 | 8.4 | 1.52 0.24 | 298 21 |
| 8657-12704 | 0.65 | 5.6 | 0.31 0.06 | 169 42 | 1.74 | 3.02 | 3.3 | 1.02 0.33 | 254 42 |
| 8728-12701 | 3.92 | 11.6 | 1.77 0.23 | 141 10 | 2.19 | 7.03 | 6.7 | 3.24 0.58 | 216 21 |
| 8981-6101 | 1.75 | 12.7 | 3.02 0.38 | 836 21 | 1.94 | 3.93 | 9.9 | 4.66 0.66 | 656 21 |
| 8981-6101B | 1.62 | 10.0 | 0.89 0.13 | 274 10 | 1.75 | 3.27 | 13.1 | 1.98 0.25 | 196 10 |
| 9027-12702 | 2.55 | 11.2 | 1.56 0.21 | 279 10 | 1.83 | 4.70 | 7.4 | 2.77 0.47 | 299 21 |
| 9027-9101 | 2.09 | 6.3 | 1.01 0.19 | 278 21 | 1.59 | 3.41 | 15.8 | 4.60 0.54 | 341 21 |
| 9032-3704 | 3.42 | 12.6 | 2.79 0.36 | 366 10 | 1.56 | 13.5 | 10.2 | 8.47 1.19 | 331 10 |
| 9050-9101 | 3.43 | 19.3 | 3.74 0.42 | 294 10 | 1.82 | 6.00 | 32.9 | 12.34 1.29 | 359 10 |
| 9050-9101B | 2.95 | 16.1 | 2.26 0.27 | 207 10 | 1.67 | 5.86 | 22.5 | 6.57 0.72 | 228 10 |
| 9093-12701 | 2.63 | 13.9 | 2.58 0.32 | 442 10 | 1.58 | 5.39 | 5.4 | 2.99 0.63 | 476 21 |
| 9094-12703 | 2.33 | 13.1 | 3.16 0.40 | 475 21 | 1.60 | 8.85 | 10.5 | 10.07 1.39 | 522 21 |
| 9094-12705 | 1.01 | 6.1 | 0.79 0.15 | 359 42 | 1.54 | 2.62 | 6.5 | 1.37 0.25 | 289 21 |
| 9185-9101 | 6.00 | 16.5 | 8.00 0.94 | 572 10 | 1.62 | 10.8 | 34.3 | 26.7 2.78 | 456 10 |
| 9507-12701 | 2.48 | 12.2 | 2.57 0.33 | 341 21 | 2.14 | 5.19 | 8.3 | 3.40 0.53 | 297 21 |
| 9509-6103 | 2.35 | 19.6 | 2.49 0.28 | 270 10 | 1.75 | 5.13 | 19.5 | 4.56 0.51 | 193 10 |
| 9881-6102 | 4.27 | 23.5 | 5.21 0.57 | 249 10 | 2.32 | 11.75 | 16.5 | 10.02 1.17 | 248 10 |
| 9889-1902 | 1.69 | 8.1 | 1.34 0.21 | 452 21 | 1.58 | 2.91 | 17.8 | 5.30 0.61 | 492 21 |
| 9889-1902B | 4.32 | 15.3 | 6.05 0.72 | 388 21 | 1.93 | 9.52 | 8.0 | 6.72 1.08 | 364 21 |
Note. — The columns show (1) source name; (2) rms noise of CO(10) line at the velocity resolution of 1042 ; (3) signal-to-noise ratio achieved in the CO(10) line; (4) intergated CO(10) line intensity measured after rebinning the spectra to velocity resolution of 1042 ; (5) zero-level line width of CO(10); (6) aperture correction; (7) rms noise of CO(21) line at the velocity resolution of 1042 ; (8) signal-to-noise ratio achieved in the CO(21) line; (9) intergated CO(21) line intensity measured after rebinning the spectra to velocity resolution of 1042 ; (10) zero-level line width of CO(21).
3.1 Molecular Gas Properties and SFR
We detected 17 CO(21) emission lines out of 23 paired galaxies from JCMT observations. The detailed results of JCMT observations are listed in Table 2, and the profiles of the emission line are shown in Figure A1 in the appendix. In our IRAM-30m observations, we observed 29 paired galaxies and all sources have detections of CO(10) and CO(21) lines, including a couple of tentative detections (S/N ). The results of IRAM observations are listed in Table 3, and the CO spectra are presented in the appendix (Figures A2-A3). The molecular gas mass is estimated from the CO luminosity using Equations (4) and (5). Given that JCMT observations only cover the CO(21) line, we adopt a CO(21)-to-CO(10) ratio of 0.8 when calculating the CO luminosity (Leroy et al., 2009). Considering JCMT observations contains minor-merger galaxy pairs that are beyond the scope of this paper, we performed the following analysis using major-merger galaxy pairs as described in Section 2.1. Therefore, we only consider 43 major-merger paired galaxies that have CO data from JCMT observations, IRAM-30m observations, and the MASCOT survey. For the tentative detections with S/N , we treat these measurements as upper limits in the statistical analysis, adopting the Kaplan-Meier estimator (Kaplan & Meier, 1958; Feigelson & Nelson, 1985) to calculate the mean values and errors for the corresponding physical properties.
After deriving the molecular mass, we compared the molecular gas fraction () and star formation efficiency (SFE) between paired galaxies and isolated galaxies. The molecular gas fraction is defined as:
| (6) |
Despite the definition of is used in some studies, here we adopt the definition frequently adopted by previous observational studies (Violino et al., 2018; Lisenfeld et al., 2019) for comparison.
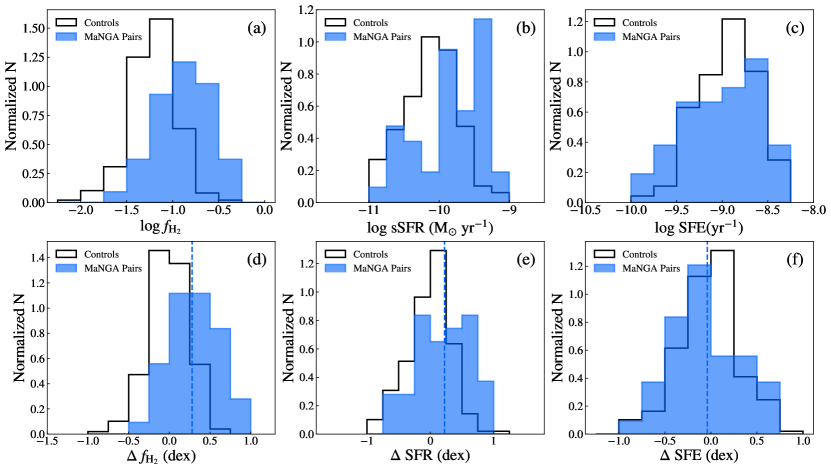
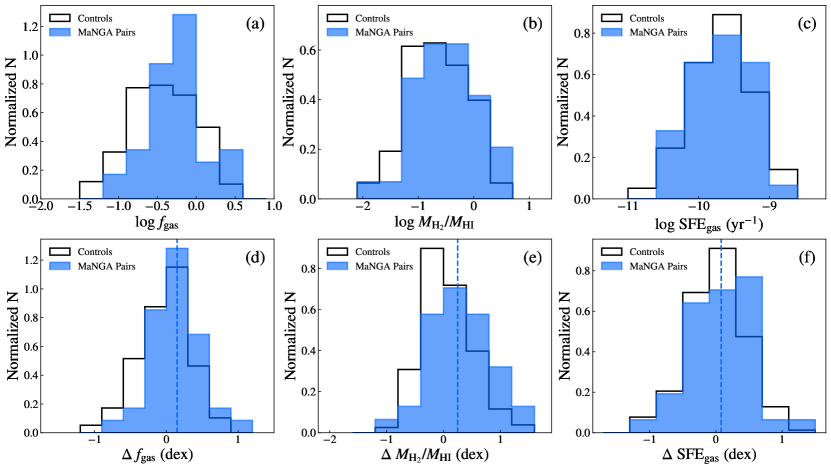
In Figure 3, we compare the distributions of galaxy properties in paired galaxies and control galaxies. The blue histogram represents the distribution of the pair sample, while the open histogram represents the control sample. As shown in Figure 3(a), we compare the distributions of for galaxies in pairs and controls. The mean molecular gas fraction of the pair sample in logarithm is log . In contrast, the mean molecular gas fraction of the control sample (log ) is lower by a factor of 2 compared to the pair sample. We conduct the Anderson-Darling (AD) two-sample test to check any discrepancy between distributions. The AD test is more sensitive than the classic Kolmogorov-Smirnov test to test whether the two distributions are drawn from the same parent distribution (Anderson & Darling, 1952; Feigelson & Babu, 2012). We use the scipy.stats.anderson_ksamp to perform the AD two-sample test, which calculates the truncated in the range between 0.001 and 0.25. In the following analysis, we adopt of 0.001 (significant) and 0.01 (moderate) as significance levels to reject the null hypothesis that the two samples are drawn from the same parent population. Therefore, the AD test suggests the distributions of for galaxies in pairs and controls are different (). However, multiple factors may contribute to the difference in molecular gas fraction. For example, more galaxies with lower stellar mass in the sample can bias the average towards a higher value, since is tightly anti-correlated with for star-forming galaxies (Boselli et al., 2014; Cicone et al., 2017; Saintonge et al., 2017). Therefore, in Section 3.3, we conduct a galaxy-by-galaxy matching between the galaxy pair sample and the control sample to minimize bias.
As shown in Figure 3(b), the sSFR of the pair sample is distributed at the higher region relative to the control sample. The average sSFR of the pair sample (log) is significantly higher than that of the control sample (log). The AD test suggests the distributions of sSFR in the pair sample and the control sample are distinct at the significance level of .
The SFE is defined as:
| (7) |
In Figure 3(c), we present the distributions of SFE in the pair sample and the control sample. The SFE of paired galaxies distributes from to , with the mean . In contrast, the SFE of isolated galaxies distributes from to , with the mean . The AD test returns a , suggesting the distributions of SFE in paired galaxies and isolated galaxies are likely drawn from the same distribution.
3.2 Molecular-to-atomic Gas Mass Ratio and Total Gas Mass
Utilizing the combination of molecular gas properties and H i data from previous observations (Stark et al., 2021; Yu et al., 2022), we further derived and analyzed the molecular-to-atomic gas mass ratio (), the total gas mass fraction (), and the star formation efficiency of the total gass (). The total gas mass is the sum of and , and the is defined as:
| (8) |
As shown in Figure 4(a), we compare the distributions of for galaxies in pairs and controls. The of paired galaxies tends to be distributed at higher values, with a mean log of . In contrast, the average total gas mass fraction is . Based on the AD test result (), the two distributions of could potentially be drawn from the same parent distribution. Figure 4(b) presents the distributions of for the pair sample and the control sample. The pair sample has an average log() of , while the mean log() for the control sample is . An AD test suggests the two distributions may be drawn from the same distribution (). The is defined as:
| (9) |
As shown in Figure 4(c), we present the distributions of for the paired galaxies and isolated galaxies. The mean values of log are and for the pair sample and the control sample, respectively. The AD test returned a of 0.25, indicating that the distributions of in the galaxy pair sample and the control sample are probably drawn from the same parent population.
3.3 Offset of Galaxy Properties
To reduce bias and fairly compare the SFR and gas properties of galaxies in pairs and controls, we follow the method of previous studies (Ellison et al., 2018; Pan et al., 2018) to calculate the offset quantities based on a galaxy-by-galaxy matching process. For the galaxy pair sample, each galaxy is matched in stellar mass and redshift with at least five isolated galaxies in the control pool. We require the matched galaxies to meet the criteria of and (Yu et al., 2022). If the minimum number of matched controls is not attained, the tolerances for stellar mass and redshift are increased by 0.1 dex and 0.005, respectively. Except for three sources requiring 2-3 iterations of matching, most paired galaxies were matched with at least five control galaxies in the first round of matching.
After matching stellar mass and redshift, the offset of molecular gas fraction, for example, is calculated as:
| (10) |
where the represents the molecular gas fraction of paired galaxy, and the is the median gas fraction of its matched control galaxies in the logarithmic scale. We apply the same procedure to compute the offsets of , SFE, , , and (Table 4). Notice that offsets of these galaxy properties are calculated in the logarithmic scale.
As shown in Figure 3(d), the mean gas fraction offset () for paired galaxies is dex, indicating that the of the galaxy pair sample is significantly higher than that of the control sample. The AD test returns a of 0.001, suggesting the distributions of in paired galaxies and control galaxies are distinct distributions. The distributions of the SFR offset () are presented in Figure 3(e). Paired galaxies have a mean dex, suggesting that the SFR of galaxies in pairs is enhanced by a factor of 1.7 compared to isolated galaxies at the significance level of 3.7. The AD test suggests a significant discrepancy between the distributions of in the pair sample and control sample (). Figure 3(f) presents the distributions of SFE for the pair sample and the control sample. For the galaxy pair sample, the average value of SFE is , indicating that the SFE of paired galaxies is comparable to isolated galaxies. Based on the AD test (), the distribution of SFE in paired galaxies is consistent with that in isolated galaxies.
As shown in Figure 4(d), the total gas fraction offset () of the pair sample has a mean value of , implying consistent in paired galaxies and isolated galaxies ( 3). The AD test indicates that ) in two samples may be drawn from the same parent sample with . In Figure 4(e), we present the distributions of for galaxies in pairs and controls. Paired galaxies have a mean of , suggesting the of the pair sample is not significantly different from that of the control sample within the error bar ( 3). The of the AD test is 0.01, indicating the distributions of in two samples may be drawn from the same parent population. For (Figure 4(f)), both the mean values () and AD test () suggest consistent distributions between the pair sample and the control sample.
3.4 Galaxy Properties along the Merger Sequence
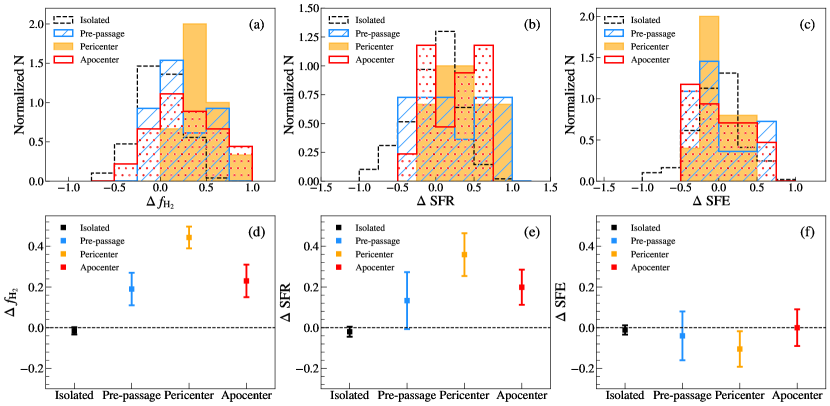
Based on the kinematic asymmetry and projected distance, we divided the galaxy pair sample into three subsamples at different merger stages. To further investigate the interplay between cold gas and galaxy interaction along the merger sequence, we compare the aforementioned gas properties and SFR between subsamples (Table 4). Our main results are presented in Figures 5 and 6, in which the upper panels show histograms of each galaxy property offset for different samples, and the lower panels represent the corresponding mean values with errors for each distribution. The histograms of isolated galaxies and paired galaxies at pre-passage, pericentric, and apocenter stages are plotted with black, blue, orange, and red bars, respectively. In the lower panels, the mean values of each distribution are indicated using the same color scheme as the histograms, and the error bar represents the error of the mean value for each distribution.
In Figure 5(a) and Figure 5(d), we plot the distributions of gas fraction offsets for isolated galaxies and paired galaxies at different merger stages. Compared to the controls, the mean values of each distribution indicate a significant elevation in the gas fraction of pairs at the pericenter stage by 0.44 0.05 dex. The AD test also returns a significant discrepancy () of between pericenter-stage pairs and isolated galaxies. At the pre-passage stage, the gas fraction of paired galaxies ( dex) is consistent with that of isolated galaxies considering the uncertainty ( 3). The of AD test indicates the distributions of in two samples may be drawn from the same parent population (=0.01). In contrast, the paired galaxies at the apocenter stage have dex), suggesting the mean is not significantly different from isolated galaxies ( 3). Based on the AD test, the distribution of in paired galaxies at the apocenter stage is different from that in isolated galaxies with .
The offset of SFR reveals enhanced star formation of galaxy pairs during galaxy interactions, especially when pairs are at the pericenter stage. In Figure 5(b) and (e), we plot the distributions of global SFR offsets for isolated galaxies and paired galaxies at different merger stages. Figure 5(b) shows that the of galaxy pairs at all stages tends to be distributed with positive values, indicating enhanced SFR during galaxy interactions. As shown in Figure 5(e), the paired galaxies during pericenter passage have an SFR enhancement by a factor of 2.3 with dex (3.3). The AD test suggests the in two samples are distinct distributions at the significance of . In contrast, the mean value of paired galaxies during pre-passage is dex, consistent with isolated galaxies. The of AD test also supports the consistency of between two samples (). Paired galaxies at the apocenter stage present consistent SFR ( dex) compared to isolated galaxies. The AD test indicates the distributions of in the two samples are moderately different at the significance level of .
In terms of SFE, our data suggest the SFE of paired galaxies at different stages is comparable to that of isolated galaxies. In Figure 5(c) and (f), we plot the distribution of SFE offsets for isolated galaxies and paired galaxies along the merger sequence. As shown in Figure 5(c), the distributions of SFE for pairs at different stages are mostly consistent with those of isolated galaxies within error bars. Our results in Figure 5(f) indicate that the mean for paired galaxies at the pre-passage stage is dex, and the paired galaxies at pericenter passage have mean dex. The mean SFE offset for pairs at the apocenter stage is dex. For each subsample of paired galaxies at different stages, the AD test indicates consistent distributions of SFE compared to isolated galaxies ().
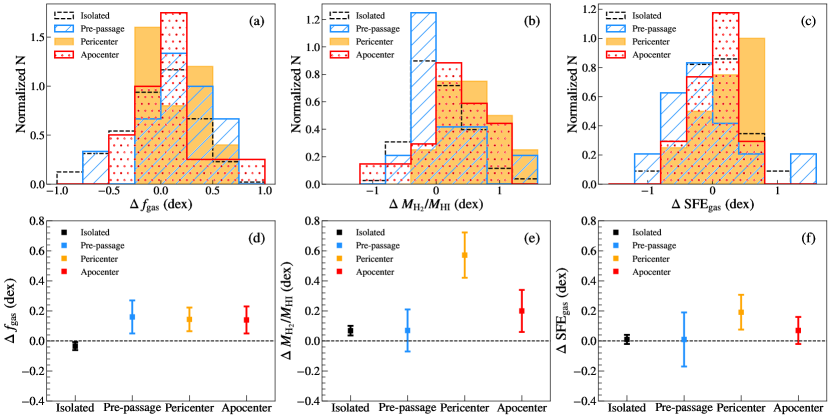
Combining with the H i data, we find the total gas fraction of paired galaxies is comparable to that of isolated galaxies. In Figures 6(a) and (d), we present the distributions of for galaxies in controls and pairs at different merger stages. As shown in Figure 6(d), our results () suggest the of paired galaxies at the pre-passage stage is consistent with that of isolated galaxies with the significance of 3. The AD test returns a of 0.06, indicating the two distributions may be drawn from the same parent population. Galaxy pairs () during pericentric passage also present consistent with isolated galaxies. Based on the AD test (), the distributions of in pericenter-stage pairs and isolated galaxies are consistent. Similarly, paired galaxies at the apocenter stage have the average , suggesting the is comparable to that of isolated galaxies within the error bar. The AD test indicates the distribution of in galaxies approaching the apocenter is consistent with that in isolated galaxies with .
The offset of suggests paired galaxies have various molecular-to-atomic gas ratios along the merger sequence, with pairs at the pericenter stage exhibiting increased . We present the distributions of in Figures 6(b) and (e). As shown in Figure 6(e), the pre-passage galaxy pairs () show comparable to those of isolated galaxies, with a of from the AD test. Paired galaxies during the pericentric passage have a mean , suggesting an enhancement of by a factor of 3.7 with respect to isolated galaxies at the significance of 3.8. The AD test indicates a moderate difference (=0.002) of distributions in pericenter-stage pairs and isolated galaxies. In contrast, galaxy pairs at the apocenter stage present a mean of , indicating that the is consistent with that of isolated galaxies. The AD test also suggests the two distributions are not significantly different ().
In Figures 6(c) and (f), we compare the distributions of the total gas fraction for galaxies in controls and pairs at different merger stages. As shown in Figure 6(f), paired galaxies during the pericentric passage present an average , indicating a consistent with isolated galaxies. The AD test suggests the two distributions are likely drawn from the same parent population (). In contrast, galaxy pairs at the pre-passage and the apocenter stages have comparable to that of isolated galaxies, with the mean of and , respectively. For these two subsamples of paired galaxies, the AD test indicates consistent distributions of compared to isolated galaxies ().
4 Discussions
| Property offset | Pre-passage | Pericenter | Apocenter | Total |
|---|---|---|---|---|
| 0.190.09 | 0.440.05 | 0.230.08 | 0.280.05 | |
| 0.130.14 | 0.360.11 | 0.200.09 | 0.220.06 | |
| 0.040.12 | 0.100.09 | 0.000.09 | 0.040.06 | |
| 0.160.11 | 0.140.08 | 0.140.09 | 0.150.06 | |
| 0.070.14 | 0.570.15 | 0.200.14 | 0.250.09 | |
| 0.010.18 | 0.190.12 | 0.070.09 | 0.080.07 |
Note. — Mean offsets of galaxy properties for which the difference 3 are shown in boldface.
4.1 Gas Fractions and SFR at Different Merger Stages
In this section, we further discuss the interplay between properties of the molecular gas and star formation along the merger sequence. By performing galaxy-by-galaxy matching between the paired galaxies and isolated galaxies, we derived the offset of , SFR, , and for each subsample in Section 3.3. When paired galaxies are at the pre-passage stage, the gravitational influence between member galaxies are not significant so the gas properties and star formation of paired galaxies should be similar to those of isolated galaxies. Indeed, our observations of paired galaxies are consistent with this expectation, suggesting that the defined merger sequence is effective in the identification of pre-passage galaxy pairs.
At the pericenter stage, our results reveal that the average SFR of paired galaxies is significantly enhanced by a factor of 2.3 with respect to isolated galaxies. In contrast, the enhancement of SFR in apocenter-stage pairs is weaker and less significant than in paired galaxies at the pericenter stage. The strongest enhancement of SFR occurs only during the pericentric passage, consistent with previous studies of interacting galaxy pairs (e.g., Barton et al., 2000; Ellison et al., 2008; Scudder et al., 2012; Patton et al., 2013). In the meantime, the CO data suggest pairs at this stage exhibit a significantly elevated . The increased has also been found by previous CO observations of close galaxy pairs (Combes et al., 1994; Casasola et al., 2004; Pan et al., 2018; Violino et al., 2018; Lisenfeld et al., 2019), as well as recent FIRE-2 simulations (Moreno et al., 2019). The increase of in paired galaxies is in good agreement with our previous H i observations (Yu et al., 2022), indicating that the marginal depletion of H i gas in paired galaxies may originate from the accelerated formation of the molecular gas. During the pericentric passage, merger-induced external pressure may lead to the accelerated transition from atomic to molecular gas (Braine & Combes, 1993; Elmegreen, 1993; Kaneko et al., 2017), which consumes the H i gas, thereby increasing the . In this scenario, the molecular-to-atomic gas ratio is theoretically predicted to be elevated, which is confirmed by our results at the significance of 3.8 (Figure 6(e)). The enhancement of has also been detected in previous observations, including the infrared luminous galaxies at the mid- and late-merger stages (Mirabel & Sanders, 1989) and galaxy pairs encountering close interactions (Lisenfeld et al., 2019).
On the other hand, our data suggest SFR of pairs approaching the apocenter is consistent with that of isolated galaxies. The marginal difference in SFR aligns with previous observations indicating the enhancement of SFR declines as the separations become larger (Scudder et al., 2012; Patton et al., 2013; Feng et al., 2020). Recent simulations also indicate that the merger-induced star formation will be gradually alleviated when galaxy pairs are heading toward the apocenter after the close encounter (Moreno et al., 2015, 2019). Similarly, the increase in becomes weaker with the significance 3 when paired galaxies are at the apocenter stage (Figure 5(d)). Correspondingly, the mean of the apocenter-stage pairs is comparable to that of isolated galaxies, indicating that the accelerated transition from atomic to molecular gas may only occur when paired galaxies undergo strong interactions. Thus, the decrease of relative to pericenter-stage pairs could be explained by the consumption due to star formation and a decelerated transition from H i to gas.
The enhancement of at the pericenter stage may play a crucial role in the rise of . While the enhanced is in agreement with the findings of Lisenfeld et al. (2019), early observations of interacting galaxies yielded a contrary result that the is not significantly different from that of the control sample (Casasola et al., 2004). The inconsistent results may be contributed by the mixed pair types and merger stages in the sample of Casasola et al. (2004), as the significant enhancement of is detected in close SS pairs with interaction signs Lisenfeld et al. (2019), corresponding to the pairs at the pericenter stage in our sample.
In terms of the total gas fraction, paired galaxies at all stages show comparable with respect to isolated galaxies. The consistency of between paired galaxies and isolated galaxies has also been revealed by previous observations (Lisenfeld et al., 2019).
4.2 Star formation Efficiency at Different Merger Stages
As demonstrated in Section 3.3, we calculated the offset of SFE and and investigated the variations of SFE and along the merger sequence. Similar to gas fractions, paired galaxies at the pre-passage stage also exhibit comparable SFE and compared to the controls. Previous investigations on star formation efficiency of the H i gas () have also indicated the consistency of the pre-passage pairs and isolated galaxies (Yu et al., 2022).
In pericenter-stage pairs, the SFE is comparable to that of isolated galaxies (Figure 5(f)), aligning with findings from previous observational studies (Combes et al., 1994; Casasola et al., 2004; Lisenfeld et al., 2019; Li et al., 2023). Similarly, galaxies in apocenter-stage pairs also exhibit consistent SFE. The observed consistency of integrated SFE between local interacting pairs and isolated systems is in line with recent simulations. Renaud et al. (2014) performed a suite of parsec-resolution simulations and found that the tidal interactions and inflows at the early stage are not strong enough to significantly increase the gas density, leading to a similar SFE as the isolated star-forming galaxies. However, the enhancement of SFE in close galaxy pairs has also been suggested by other previous CO observations (Sofue et al., 1993; Michiyama et al., 2016; Violino et al., 2018; Pan et al., 2018). Various factors may contribute to this discrepancy in integrated SFE. For example, as discussed by Pan et al. (2018), the selection and comparison of galaxy pairs and control galaxies could introduce biased results if the global properties are not carefully controlled between samples. Furthermore, various types of interacting galaxy pairs may also contribute to the discrepancy. Taking into account the mass ratio, major-merger pairs tend to show a weakly enhanced SFE, while minor-merger pairs do not (Pan et al., 2018). Lisenfeld et al. (2019) suggest that SS pairs present a higher SFE relative to SE pairs. In addition, the enhancement of SFE at specific regions (e.g., the nuclear region) could be diluted in single-dish observations. A recent spatially resolved CO study of galaxy mergers has revealed the complexity and variations of and SFE among different individual mergers (Thorp et al., 2022), which demonstrates the importance of kpc-scale observations to study various SFR, and SFE in different regions of mergers. Therefore, spatially resolved CO observations for a large sample of interacting galaxies are required for understanding the fraction and specific regions of the enhanced SFE along the evolutionary sequence of interacting galaxies.
The of paired galaxies at the pericenter stage is weakly enhanced compared to isolated galaxies, but the difference is marginal. In previous H i observations, the is also found to be enhanced at the pericenter stage (Yu et al., 2022). The slight enhancement in could be attributed to the H i- transition during the pericentric passage, consistent with the depletion of H i gas detected in previous work (Yu et al., 2022). In contrast, paired galaxies at the apocenter stage pairs show consistent compared to isolated galaxies.
4.3 What Drives the Enhancement of SFR in Paired Galaxies?
To investigate what galaxy property drives the enhancement of SFR during the merger, we analyzed the correlation between the enhanced SFR and gas properties in the full pair sample and subsamples. Using the derived offset of galaxy properties in Section 3.3, we calculated the Spearman’s rank order coefficients among , , , and . During the analysis, we evaluate the strength of correlation using Spearman’s rank order coefficient (; ), with or regarded as a tight or weak correlation, and suggests no correlation. The of Spearman’s rank order describes the significance of each correlation. In the following analysis, we adopt a as the significance level to reject the null hypothesis that there is no correlation between parameters.
As shown in Table 5, we list Spearman’s rank order coefficient with the p-value for each correlation in the control sample and subsamples of pairs. Our results show that both and have positive correlations with . In the full pair sample, present a weak correlation with . is also weakly correlated to . Contrastingly, there is no correlation between and . For isolated galaxies, we find there is a weak correlation between and at the significance level of . In terms of versus , isolated galaxies present no correlation. In contrast, the of isolated galaxies exhibits no correlation with ().
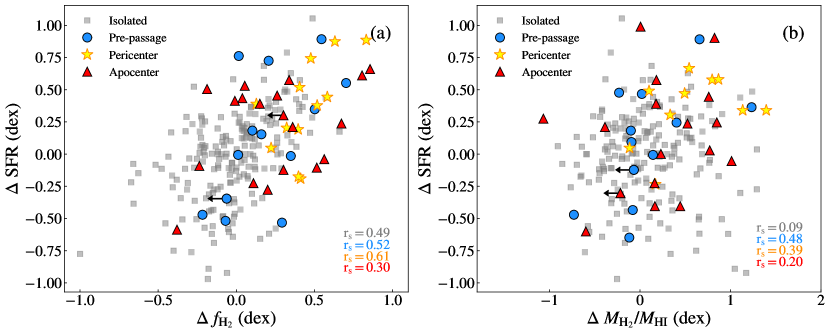
To compare correlations in different merger stages, we plot as a function of and a function of in Figure 7. In each panel, isolated galaxies and paired galaxies at different stages are represented by grey squares, blue circles, golden stars, and red triangles, respectively. Regarding versus , paired galaxies at the pericenter stage exhibit a hint of a strong correlation , but the significance (see Table 5, ) cannot reject the null hypothesis of no correlation. As shown in Figure 7 and Table 5, although the values show a hint of a weak correlation between and in paired galaxies at the pre-passage and pericenter stages, the suggest 1127% chance of no correlation. The of paired galaxies at all stages show no correlation with . Given that the could be affected by the low numbers in the subsamples, a further correlation test with a larger sample is required to study any potential correlations.
Although the correlation tests between subsamples suggest marginal significance, our results in Section 3.4 indicate that the enhancement of SFR is mainly driven by the elevation of in the pericenter stage, which is consistent with previous CO observations of galaxy pairs (Pan et al., 2018; Lisenfeld et al., 2019). Based on our results, the enhanced and SFR can be explained by the merger-induced external pressure that enhanced (Braine & Combes, 1993; Elmegreen, 1993; Kaneko et al., 2017), which has been detected in the pericenter stage (Figure 6(e)). When paired galaxies are approaching the pericenter, the shock-triggered external pressure accelerates the transition from atomic gas to molecular gas, resulting in the increment of and the further enhancement of SFR. However, we cannot rule out the contribution of enhanced SFE in specific regions during these stages, since the enhancement could be diluted by the unresolved single-dish observations.
A recent study performed spatially resolved CO observations of galaxy mergers and found that and SFE have comparable contributions in the enhanced star formation, with the driving mechanisms varying among individual galaxies (Thorp et al., 2022). Global star formation of individual mergers can be driven by either the molecular gas fuel or the efficiency of forming stars, and some mergers are dominated by the fuel- and efficiency-driven star formation equally (Thorp et al., 2022). These authors claimed to find a trend that paired galaxies are more likely to have SFE enhancement than mergers at coalescence, and they proposed a scenario where efficiency-driven star formation becomes less important towards coalescence. This contradicts our results and those of Lisenfeld et al. (2019), both found no SFE enhancement for paired galaxies. Also, ULIRGs, which are mostly mergers at coalescence, have very strong SFE enhancement (Solomon & Sage, 1988; Mirabel & Sanders, 1989), probably because in a ULIRG (e.g., Arp 220), the molecular gas may be compressed into a central gas disk with a much higher dense gas () fraction than in normal giant molecular clouds (GMCs), resulting in very high SFE (Scoville et al., 1997, 2017). On the other hand, for paired galaxies, the effect of interaction on SFE can be very complex. Xu et al. (2021) resolved the CO (1-0) emission in two close major-merger pairs, Arp 238 (S+S) and Arp 142 (S+E). They found significant differences in local SFE among the two systems. The SFR in Arp 238 is concentrated in the two nuclei, with an SFE enhancement of 0.7 dex. On the other hand, the disk of the star-forming galaxy of Arp 142 has an SFE 0.4 dex below the mean SFE of control galaxies. These authors attribute this difference to the very different interaction orbits: while the low-speed coplanar orbit of Arp 238 results in strong tidal torque which triggers nuclear starbursts, the high-speed head-on collision in Arp 142 produces a density-wave shock that suppresses the SFR in the system.
In summary, our results indicate that the elevation of can drive the enhancement of global SFR in paired galaxies at the pericenter stages, while the contribution of enhanced SFE in specific regions cannot be ruled out through current unresolved observations. Although our results suggest the contribution of , , and SFE in the SFR enhancement may vary along the merger sequence, spatially resolved CO observations of a large sample are required to pinpoint the driving mechanisms and their variations during the evolution of the merger-induced star formation. A caveat should be noted that all these correlation analyses for the subsamples suffer from low number statistics and require further examination with larger samples.
| Sample | vs. | vs. | vs. |
|---|---|---|---|
| Pre-passage | 0.52 (0.07) | 0.48 (0.11) | 0.17 (0.60) |
| Pericenter | 0.61 (0.04) | 0.39 (0.27) | 0.13 (0.73) |
| Apocenter | 0.30 (0.23) | 0.20 (0.44) | 0.13 (0.62) |
| All pairs | 0.44 (3.52) | 0.43 (5.96) | 0.17 (0.31) |
| Isolated galaxies | 0.49 (6.58) | 0.09 (0.19) | 0.24 (1.94) |
Note. — Spearman’s rank order coefficient with the as significance in the parentheses. The coefficients of strong or weak correlations with are printed in boldface. The columns are (1) subsamples of paired galaxies at different stages, the full pair sample, and isolated galaxies as the control sample; (2) the Spearman’s rank order coefficient and significance of versus ; (3) the Spearman’s rank order coefficient and significance of versus ; (4) the Spearman’s rank order coefficient and significance of versus .
5 Summary
We investigate the interplay between molecular gas, atomic gas, and star formation of galaxies along the merger sequence, using a sample of 43 paired galaxies selected from the MaNGA survey. The merger stage is defined with the combination of the projected separation and kinematic asymmetry derived from the velocity field of H gas. We obtained the molecular gas properties from new CO observations with JCMT and IRAM 30-m telescope, as well as data from the MASCOT survey. By combining these data with ancillary H i data from FAST and HI-MaNGA, we study the molecular gas fraction (), molecular-to-atomic gas ratio (), star formation efficiency (SFE), the total gas fraction (), and the star formation efficiency of total gas () in paired galaxies at different merger stages, with isolated galaxies selected from the xCOLD GASS survey as the control sample. The main conclusions are as follows:
-
1.
For the full pair sample, our results suggest the of paired galaxies is significantly increased compared to that of isolated galaxies, while the SFE is comparable. In contrast, We do not find statistically significant differences in , , and between paired galaxies and isolated galaxies. Additionally, the correlation analyses suggest that the enhancement of SFR is weakly correlated to the elevation of and in paired galaxies, implying galaxy interactions may impact the transition from H i to gas and alter star formation.
-
2.
We find the molecular and atomic gas fractions in galaxy pairs vary along the merger sequence. When paired galaxies are at the pre-passage stage, the , , and are consistent with the isolated galaxies. For galaxy pairs during the pericentric passage, the and are significantly elevated, while the has no difference with that of isolated galaxies. At the apocenter stage, the , , and of paired galaxies are comparable to those of isolated galaxies.
-
3.
We find the SFE and of paired galaxies have no significant variations along the merger sequence. For paired galaxies at different merger stages, the SFE and are consistent with those of isolated galaxies.
-
4.
Our results indicate that the elevation of can drive the enhancement of global SFR in paired galaxies at the pericenter stage, while the contribution of enhanced SFE in specific regions cannot be ruled out through current unresolved observations. As for paired galaxies in different merger stages, further investigations with larger samples are required to test any correlations between the enhancements of SFR and gas properties.
Our results indicate the enhancement of star formation in major-merger galaxy pairs is mainly driven by the elevation of the molecular gas fraction. The significant increase in molecular gas fraction occurs at the pericenter stage, indicating the accelerated transition from atomic gas to molecular gas due to external pressure induced by strong tidal forces after close interactions. However, the contribution of enhanced SFE in specific regions cannot be ruled out through current unresolved observations. Furthermore, the effects due to different orbital parameters of the interacting galaxies require further investigation. In future work, it is necessary to conduct spatially resolved observations of both H i and CO lines for a large galaxy merger sample that spans a wide range of merger stages, allowing us to extend our understanding and constraints on where and how the SFR, , , SFE vary along the evolutionary sequence.
Appendix A CO Spectra
We present the calibrated and rebinned CO spectra from JCMT observations and IRAM 30 m observations as follows. The data can be obtained from the corresponding author upon reasonable request.
References
- Anderson & Darling (1952) Anderson, T. W., & Darling, D. A. 1952, The Annals of Mathematical Statistics, 23, 193
- Astropy Collaboration et al. (2013) Astropy Collaboration, Robitaille, T. P., Tollerud, E. J., et al. 2013, A&A, 558, A33
- Barnes & Hernquist (1992) Barnes, J. E., & Hernquist, L. 1992, ARA&A, 30, 705
- Barnes & Hernquist (1991) Barnes, J. E., & Hernquist, L. E. 1991, ApJ, 370, L65
- Barnes & Hernquist (1996) Barnes, J. E., & Hernquist, L. 1996, ApJ, 471, 115
- Barrera-Ballesteros et al. (2015) Barrera-Ballesteros, J. K., García-Lorenzo, B., Falcón-Barroso, J., et al. 2015, A&A, 582, A21
- Barton et al. (2000) Barton, E. J., Geller, M. J., & Kenyon, S. J. 2000, ApJ, 530, 660
- Bloom et al. (2018) Bloom, J. V., Croom, S. M., Bryant, J. J., et al. 2018, MNRAS, 476, 2339
- Bolatto et al. (2013) Bolatto, A. D., Wolfire, M., & Leroy, A. K. 2013, ARA&A, 51, 207
- Boselli et al. (2014) Boselli, A., Cortese, L., Boquien, M., et al. 2014, A&A, 564, A66
- Braine & Combes (1993) Braine, J., & Combes, F. 1993, A&A, 269, 7
- Bundy et al. (2015) Bundy, K., Bershady, M. A., Law, D. R., et al. 2015, ApJ, 798, 7
- Casasola et al. (2004) Casasola, V., Bettoni, D., & Galletta, G. 2004, A&A, 422, 941
- Cicone et al. (2017) Cicone, C., Bothwell, M., Wagg, J., et al. 2017, A&A, 604, A53
- Combes et al. (1994) Combes, F., Prugniel, P., Rampazzo, R., & Sulentic, J. W. 1994, A&A, 281, 725
- Cox et al. (2008) Cox, T. J., Jonsson, P., Somerville, R. S., et al. 2008, MNRAS, 384, 386
- Croom et al. (2012) Croom, S. M., Lawrence, J. S., Bland-Hawthorn, J., et al. 2012, MNRAS, 421, 872
- Currie et al. (2014) Currie, M. J., Berry, D. S., Jenness, T., et al. 2014, Astronomical Society of the Pacific Conference Series, 485, 391
- Di Matteo et al. (2007) Di Matteo, P., Combes, F., Melchior, A. L., & Semelin, B. 2007, A&A, 468, 61
- Ellison et al. (2018) Ellison, S. L., Catinella, B., & Cortese, L. 2018, MNRAS, 478, 3447
- Ellison et al. (2013) Ellison, S. L., Mendel, J. T., Scudder, J. M., et al. 2013, MNRAS, 430, 3128
- Ellison et al. (2011) Ellison, S. L., Patton, D. R., Mendel, J. T., & Scudder, J. M. 2011, MNRAS, 418, 2043
- Ellison et al. (2008) Ellison, S. L., Patton, D. R., Simard, L., & McConnachie, A. W. 2008, AJ, 135, 1877
- Elmegreen (1993) Elmegreen, B. G. 1993, ApJ, 411, 170
- Feigelson & Babu (2012) Feigelson, E. D., & Babu, G. J. 2012, Modern Statistical Methods for Astronomy (Cambridge: Cambridge Univ. Press)
- Feigelson & Nelson (1985) Feigelson, E. D., & Nelson, P. I. 1985, ApJ, 293, 192
- Feng et al. (2022) Feng, S., Shen, S.-Y., Yuan, F.-T., et al. 2022, ApJS, 262, 6
- Feng et al. (2020) Feng, S., Shen, S.-Y., Yuan, F.-T., et al. 2020, ApJ, 892, L20
- Feng et al. (2019) Feng, S., Shen, S.-Y., Yuan, F.-T., et al. 2019, ApJ, 880, 114
- Gao & Solomon (1999) Gao, Y., & Solomon, P. M. 1999, ApJ, 512, L99
- Gildas Team (2013) Gildas Team. 2013, GILDAS: Grenoble Image and Line Data Analysis Software, Astrophysics Source Code Library, record ascl:1305.010, Astrophysics Source Code Library, record ascl:1305.010
- Goulding et al. (2018) Goulding, A. D., Greene, J. E., Bezanson, R., et al. 2018, PASJ, 70, S37
- Haan et al. (2011) Haan, S., Surace, J. A., Armus, L., et al. 2011, AJ, 141, 100
- Hani et al. (2018) Hani, M. H., Sparre, M., Ellison, S. L., et al. 2018, MNRAS, 475, 1160
- Haynes et al. (2018) Haynes, M. P., Giovanelli, R., Kent, B. R., et al. 2018, ApJ, 861, 49
- Hibbard & van Gorkom (1996) Hibbard, J. E., & van Gorkom, J. H. 1996, AJ, 111, 655
- Hopkins et al. (2013) Hopkins, P. F., Cox, T. J., Hernquist, L., et al. 2013, MNRAS, 430, 1901
- Hopkins et al. (2009) Hopkins, P. F., Cox, T. J., Younger, J. D., & Hernquist, L. 2009, ApJ, 691, 1168
- Hou et al. (2023) Hou, M., Li, Z., Liu, X., et al. 2023, ApJ, 943, 50
- Hung et al. (2016) Hung, C.-L., Hayward, C. C., Smith, H. A., et al. 2016, ApJ, 816, 99
- Iono et al. (2004) Iono, D., Yun, M. S., & Mihos, J. C. 2004, ApJ, 616, 199
- Iono et al. (2009) Iono, D., Wilson, C. D., Yun, M. S., et al. 2009, ApJ, 695, 1537
- Kaneko et al. (2017) Kaneko, H., Kuno, N., Iono, D., et al. 2017, PASJ, 69, 66
- Kaplan & Meier (1958) Kaplan, E. L., & Meier, P. 1958, JASA, 53, 457
- Keel (1993) Keel, W. C. 1993, AJ, 106, 1771
- Kennicutt & Keel (1984) Kennicutt, R. C., J., & Keel, W. C. 1984, ApJ, 279, L5
- Kennicutt et al. (1987) Kennicutt, Robert C., J., Keel, W. C., van der Hulst, J. M., et al. 1987, AJ, 93, 1011
- Kewley et al. (2006) Kewley, L. J., Geller, M. J., & Barton, E. J. 2006, AJ, 131, 2004
- Leroy et al. (2008) Leroy, A. K., Walter, F., Brinks, E., et al. 2008, AJ, 136, 2782
- Leroy et al. (2009) Leroy, A. K., Walter, F., Bigiel, F., et al. 2009, AJ, 137, 4670
- Li et al. (2008) Li, C., Kauffmann, G., Heckman, T. M., et al. 2008, MNRAS, 385, 1903
- Li et al. (2023) Li, Y. A., Ho, L. C., & Shangguan, J. 2023, ApJ, 953, 91
- Lisenfeld et al. (2019) Lisenfeld, U., Xu, C. K., Gao, Y., et al. 2019, A&A, 627, A107
- Lisenfeld et al. (2011) Lisenfeld, U., Espada, D., Verdes-Montenegro, L., et al. 2011, A&A, 534, A102
- Masters et al. (2019) Masters, K. L., Stark, D. V., Pace, Z. J., et al. 2019, MNRAS, 488, 3396
- McElroy et al. (2022) McElroy, R., Bottrell, C., Hani, M. H., et al. 2022, MNRAS, 515, 3406
- Michiyama et al. (2016) Michiyama, T., Iono, D., Nakanishi, K., et al. 2016, PASJ, 68, 96
- Mihos & Hernquist (1996) Mihos, J. C., & Hernquist, L. 1996, ApJ, 464, 641
- Mirabel & Sanders (1989) Mirabel, I. F., & Sanders, D. B. 1989, ApJ, 340, L53
- Moreno et al. (2015) Moreno, J., Torrey, P., Ellison, S. L., et al. 2015, MNRAS, 448, 1107
- Moreno et al. (2019) Moreno, J., Torrey, P., Ellison, S. L., et al. 2019, MNRAS, 485, 1320
- Nikolic et al. (2004) Nikolic, B., Cullen, H., & Alexander, P. 2004, MNRAS, 355, 874
- Nishiyama et al. (2001) Nishiyama, K., Nakai, N., & Kuno, N. 2001, PASJ, 53, 757
- Pan et al. (2018) Pan, H.-A., Lin, L., Hsieh, B.-C., et al. 2018, ApJ, 868, 132
- Pan et al. (2019) Pan, H.-A., Lin, L., Hsieh, B.-C., et al. 2019, ApJ, 881, 119
- Patton et al. (2013) Patton, D. R., Torrey, P., Ellison, S. L., et al. 2013, MNRAS, 433, L59
- Regan et al. (2001) Regan, M. W., Thornley, M. D., Helfer, T. T., et al. 2001, ApJ, 561, 218
- Renaud et al. (2014) Renaud, F., Bournaud, F., Kraljic, K., & Duc, P. A. 2014, MNRAS, 442, L33
- Rupke et al. (2010) Rupke, D. S. N., Kewley, L. J., & Chien, L. H. 2010, ApJ, 723, 1255
- Saintonge et al. (2017) Saintonge, A., Catinella, B., Tacconi, L. J., et al. 2017, ApJS, 233, 22
- Sánchez et al. (2012) Sánchez, S. F., Kennicutt, R. C., Gil de Paz, A., et al. 2012, A&A, 538, A8
- Sanders & Mirabel (1996) Sanders, D. B., & Mirabel, I. F. 1996, ARA&A, 34, 749
- Satyapal et al. (2014) Satyapal, S., Ellison, S. L., McAlpine, W., et al. 2014, MNRAS, 441, 1297
- Scoville et al. (2017) Scoville, N., Murchikova, L., Walter, F., et al. 2017, ApJ, 836, 66
- Scoville et al. (1997) Scoville, N. Z., Yun, M. S., & Bryant, P. M. 1997, ApJ, 484, 702
- Scudder et al. (2012) Scudder, J. M., Ellison, S. L., Torrey, P., et al. 2012, MNRAS, 426, 549
- Shangguan et al. (2019) Shangguan, J., Ho, L. C., Li, R., et al. 2019, ApJ, 870, 104
- Smith et al. (2018) Smith, B. J., Campbell, K., Struck, C., et al. 2018, AJ, 155, 81
- Soares (2007) Soares, D. S. L. 2007, AJ, 134, 71
- Sofue et al. (1993) Sofue, Y., Wakamatsu, K.-I., Taniguchi, Y., & Nakai, N. 1993, PASJ, 45, 43
- Solomon et al. (1997) Solomon, P. M., Downes, D., Radford, S. J. E., & Barrett, J. W. 1997, ApJ, 478, 144
- Solomon & Sage (1988) Solomon, P. M., & Sage, L. J. 1988, ApJ, 334, 613
- Sparre & Springel (2016) Sparre, M., & Springel, V. 2016, MNRAS, 462, 2418
- Stark et al. (2021) Stark, D. V., Masters, K. L., Avila-Reese, V., et al. 2021, MNRAS, 503, 1345
- Thorp et al. (2022) Thorp, M. D., Ellison, S. L., Pan, H.-A., et al. 2022, MNRAS, 516, 1462
- Thorp et al. (2019) Thorp, M. D., Ellison, S. L., Simard, L., et al. 2019, MNRAS, 482, L55
- Toomre (1977) Toomre, A. 1977, 401
- Toomre & Toomre (1972) Toomre, A., & Toomre, J. 1972, ApJ, 178, 623
- Torrey et al. (2012) Torrey, P., Cox, T. J., Kewley, L., & Hernquist, L. 2012, ApJ, 746, 108
- Ueda et al. (2014) Ueda, J., Iono, D., Yun, M. S., et al. 2014, ApJS, 214, 1
- Veilleux et al. (2002) Veilleux, S., Kim, D. C., & Sanders, D. B. 2002, ApJS, 143, 315
- Violino et al. (2018) Violino, G., Ellison, S. L., Sargent, M., et al. 2018, MNRAS, 476, 2591
- Virtanen et al. (2020) Virtanen, P., Gommers, R., Oliphant, T. E., et al. 2020, NatMe, 17, 261
- Wilson et al. (2008) Wilson, C. D., Petitpas, G. R., Iono, D., et al. 2008, ApJS, 178, 189
- Wylezalek et al. (2022) Wylezalek, D., Cicone, C., Belfiore, F., et al. 2022, MNRAS, 510, 3119
- Xu & Sulentic (1991) Xu, C., & Sulentic, J. W. 1991, ApJ, 374, 407
- Xu et al. (2021) Xu, C. K., Lisenfeld, U., Gao, Y., & Renaud, F. 2021, ApJ, 918, 55
- Xu et al. (2010) Xu, C. K., Domingue, D., Cheng, Y.-W., et al. 2010, ApJ, 713, 330
- Yamashita et al. (2017) Yamashita, T., Komugi, S., Matsuhara, H., et al. 2017, ApJ, 844, 96
- Yu et al. (2022) Yu, Q., Fang, T., Feng, S., et al. 2022, ApJ, 934, 114
- Zhang et al. (2020) Zhang, H., Fang, T., Zaritsky, D., et al. 2020, ApJ, 893, L3
- Zuo et al. (2018) Zuo, P., Xu, C. K., Yun, M. S., et al. 2018, ApJS, 237, 2