A dusty proto-cluster surrounding the binary galaxy HerBS-70 at
Abstract
We report on deep SCUBA-2 observations at 850 µm and NOEMA spectroscopic measurements at 2 mm of the environment surrounding the luminous, massive ( M⊙) Herschel-selected source HerBS-70. This source was revealed by previous NOEMA observations to be a binary system of dusty star-forming galaxies at , with the East component (HerBS-70E) hosting an Active Galactic Nucleus (AGN). The SCUBA-2 observations detected, in addition to the binary system, twenty-one sources at over an area of square comoving Mpc with a sensitivity of mJy. The surface density of continuum sources around HerBS-70 is three times higher than for field galaxies. The NOEMA spectroscopic measurements confirm the protocluster membership of three of the nine brightest sources through their CO(4–3) line emission, yielding a volume density 36 times higher than for field galaxies. All five confirmed sub-mm galaxies in the HerBS-70 system have relatively short gas depletion times ( Myr), indicating the onset of quenching for this protocluster core due to the depletion of gas. The dark matter halo mass of the HerBS-70 system is estimated around M⊙, with a projected current-day mass of M⊙, similar to the local Virgo and Coma clusters. These observations support the claim that DSFGs, in particular the ones with observed multiplicity, can trace cosmic overdensities.
keywords:
galaxies: clusters: general – galaxies: evolution - submillimetre: galaxies – galaxies: high-redshift1 Introduction
The evolution of the cosmic star-formation rate density (Madau & Dickinson 2014) paints a dynamic picture of galaxy evolution, with rapid stellar build-up at redshifts above 2, followed by a stark drop in star-formation rates of galaxies towards the present day. The origins of this down-turn are likely due to a mixture of feedback processes, broadly categorized as caused by environmental (strangulation, harassment and ram-pressure stripping) and internal (star-formation and active-galactic nuclei) quenching effects (e.g., Peng et al., 2015; Man & Belli, 2018; Walter et al., 2020).
Cosmic overdensities form pockets where the Universe is matter-dominated, and can trace galaxy evolution in more extreme environments, where the processes that characterize star-formation (i.e., fueling and feedback) happen on faster timescales and at earlier epochs (Chiang et al., 2013; Muldrew et al., 2015; Contini et al., 2016; Overzier, 2016). Notably, models predict that the majority of high-redshift star formation occurs in overdense environments, where the compact regions drive gas away by environmental quenching through processes of gas stripping and the cessation of infalling gas that feeds star-formation. Meanwhile, the rapid evolution of galaxies can trigger Active Galactic Nuclei (AGN) which disrupt gas flow and star-formation from within (Vayner et al., 2021).
Hydrodynamical and parametric models of galaxy clusters predict that the intra-cluster medium (ICM) becomes too warm to readily collapse onto galaxies at redshifts 3 to 5, needing to form cold streams that fuel star-formation until (e.g., Dekel & Birnboim, 2006). Cold flows could still persist further into the local Universe, however their extent might be more limited (Dressler, 1980; Webb et al., 2015, 2017; Trudeau et al., 2019; Finner et al., 2020; Hlavacek-Larrondo et al., 2020). This generic picture (Shimakawa et al., 2018) then predicts rapid quenching through a lack of fueling of the central galaxies, resulting in passive galaxy clusters at redshift 0 such as the 1015 M⊙ Virgo cluster (Fouqué et al., 2001). In particular, this sudden lack of inflowing gas in dense environments at allows for a unique test of galaxy quenching (Smail, 2024).
Studies into the properties of these protocluster galaxies, however, find varying properties from protocluster to protocluster. They have measured metallicities deficient (Valentino et al., 2015) or enhanced (Shimakawa et al., 2015; Biffi et al., 2018) relative to field galaxies; they have star-formation rates boosted (Shimakawa et al., 2018) or suppressed (Tran et al., 2015) relative to field galaxies; they are more gas-rich than field galaxies (Noble et al., 2017; Tadaki et al., 2019), or show similar gas-richness (Castignani et al., 2020; Lee et al., 2021), or they show evidence of the re-distribution of metals across the galaxies through their circum-galactic medium (CGM – Wang et al., 2021).
The galaxy populations within protoclusters appear diverse, and we are currently limited in our understanding through a sheer lack of identified high- protocluster environments. This diversity, however, could also be a selection bias, since protoclusters are found across the entire electromagnetic spectrum, from UV (Steidel et al., 1998; Venemans et al., 2007; Toshikawa et al., 2012), optical (Hatch et al., 2011; Spitler et al., 2012) to radio (Galametz et al., 2013), each of which are likely sensitive to a specific galaxy population and therefore to a specific phase of cluster evolution.111An important exception to this are protoclusters selected by the Sunyaev-Zeldovich effect, which can accurately trace the total mass of dark matter haloes – important for a cosmic census. However, this method becomes increasingly difficult to detect protoclusters (e.g., Di Mascolo et al. 2021; Meinke et al. 2021).
To extend these studies out to higher redshifts, various rare populations of galaxies or quasars have been proposed to trace overdense regions, with mixed results. For example, quasars have been shown to trace protoclusters by Kim et al. (2009); Utsumi et al. (2010); Morselli et al. (2014); Kikuta et al. (2017, 2019); Ota et al. (2018); García-Vergara et al. (2022), however the studies by Bañados et al. 2013; Mazzucchelli et al. 2017; Goto et al. 2017 failed to reveal any overdense environments, suggesting that this method is not necessarily robust (e.g., Champagne et al., 2018).
Dusty star-forming galaxies (DSFGs) (Blain et al., 2002; Casey et al., 2014; Hodge & da Cunha, 2020) are known to trace some of the most active star-forming regions in the Universe, with very short gas depletion timescales (Swinbank et al., 2014; Aravena et al., 2016a; Cañameras et al., 2018). Observational studies have shown a strong connection between these galaxies and their wider CGM (Banerji et al., 2011; Dannerbauer et al., 2014; Emonts et al., 2016, 2018; Spilker et al., 2020a, b; Berta et al., 2021; Butler et al., 2021; Riechers et al., 2021) rapidly enriching their environments while also showcasing examples of gas feeding at . Far-infrared cameras have successfully identified such protocluster systems, requiring multi-hour observations to reveal a handful to tens of components (Ivison et al., 2000; Stevens et al., 2003, 2005, 2010; De Breuck et al., 2004; Chapman et al., 2009; Tamura et al., 2009; Aravena et al., 2010; Capak et al., 2011; Casey et al., 2013; Dannerbauer et al., 2014; Miller et al., 2018; Zeballos et al., 2018; Smith et al., 2019b; Gómez-Guijarro et al., 2019; Lacaille et al., 2019; Guaita et al., 2022; Zhang et al., 2022). The small number of sources revealed by continuum cameras limit the statistical power of sub-mm observations (e.g., Lewis et al. 2018), however it is important to characterize these sources, as they dominate the star-formation in these environments (e.g., Casey et al., 2013; Dannerbauer et al., 2014; Bussmann et al., 2015; Miller et al., 2018; Oteo et al., 2018; Long et al., 2020; Stach et al., 2021). Stacking experiments by Kubo et al. (2019) and Alberts et al. (2021) further show an excess of mid- and far-infrared emission from protoclusters in WISE and Planck data. Environmental studies of DSFGs also help characterize the evolution of the massive end of star-formation, as DSFGs are the likely progenitors of massive ellipticals, which could help identify potential environmental effects in order to explain recent observations of massive quenched galaxies being found at (Straatman et al., 2014; Glazebrook et al., 2017; Simpson et al., 2017; Schreiber et al., 2018; Looser et al., 2023). Meanwhile, simulations suggest that source multiplicity might be a better indicator than the more time-variable measure of star-formation rate (Remus et al., 2022). In order to efficiently identify overdensities, tracing out the environments around distant DSFGs with neighbouring sources, we would address both strong selection criteria for overdense environments.
Follow-up observations of luminous high-redshift galaxies detected in large surveys such as Herschel, in particular using sub-millimetre facilities, have enabled to identify candidate proto-clusters by resolving the sources in multiple galaxies at similar redshift. A recent example is the z-GAL survey that measured, using the NOrthern Extended Millimetre Array (NOEMA), precise spectroscopic redshifts of 135 dusty, bright Herschel-selected galaxies (Cox et al., 2023; Neri et al., 2020). In some cases, the fields displayed multiplicity and revealed candidate proto-clusters. One example is the Herschel galaxy H-ATLAS J130140.2+292918 (HerBS-70), that was revealed by the NOEMA observations to be a binary system of dusty star-forming galaxies at , where the two components are separated by and the East component (HerBS-70E) hosts an Active Galactic Nucleus (AGN - Neri et al. 2020; Stanley et al. 2023).
In this work, we report on deep continuum observations at 850 µm of the environment around HerBS-70 using SCUBA-2 on the James Clerk Maxwell Telescope (JCMT) and targeted NOEMA spectroscopic measurements of the most likely protocluster candidates in the field. In Section 2, we describe the properties of HerBS-70, and why it is a good candidate lighthouse for a cosmic overdensity. We then report on the continuum map observations using the SCUBA-2 instrument on the JCMT and spectroscopic observations using NOEMA at 2 mm, including the reduction steps, flux extraction, completion and flux boosting estimates in Section 3. Section 4 characterizes the overdensity in HerBS-70 using the spectroscopic and continuum observations. We continue our discussion on the Herschel photometry to produce photometric redshifts, and evaluates the continuum overdensity estimates based on source counts and spatial source distribution. Subsequently, this Section places the wider environment around HerBS-70 in its cosmological context, and looks forward to expanded studies of the environments surrounding dusty star-forming galaxies in general. We provide our conclusions in Section 5. Throughout this paper, we assume a flat -CDM cosmology with the best-fit parameters derived from the Planck results (Planck Collaboration et al., 2020), which are , and .
2 HerBS-70: A rapidly-quenching, AGN-hosting source with a nearby companion
| HerBS-70E | HerBS-70W | ||||||
|---|---|---|---|---|---|---|---|
| LIR (1011 ) | Berta et al. (2023) | ||||||
| SFR (/yr) | Berta et al. (2023) | ||||||
| Mdust (1010 ) | Neri et al. (2020) | ||||||
| Mgas (1011 ) | Berta et al. (2023) | ||||||
| Stanley et al. (2023) | |||||||
| tdepl (109 yr) | Berta et al. (2023) | ||||||
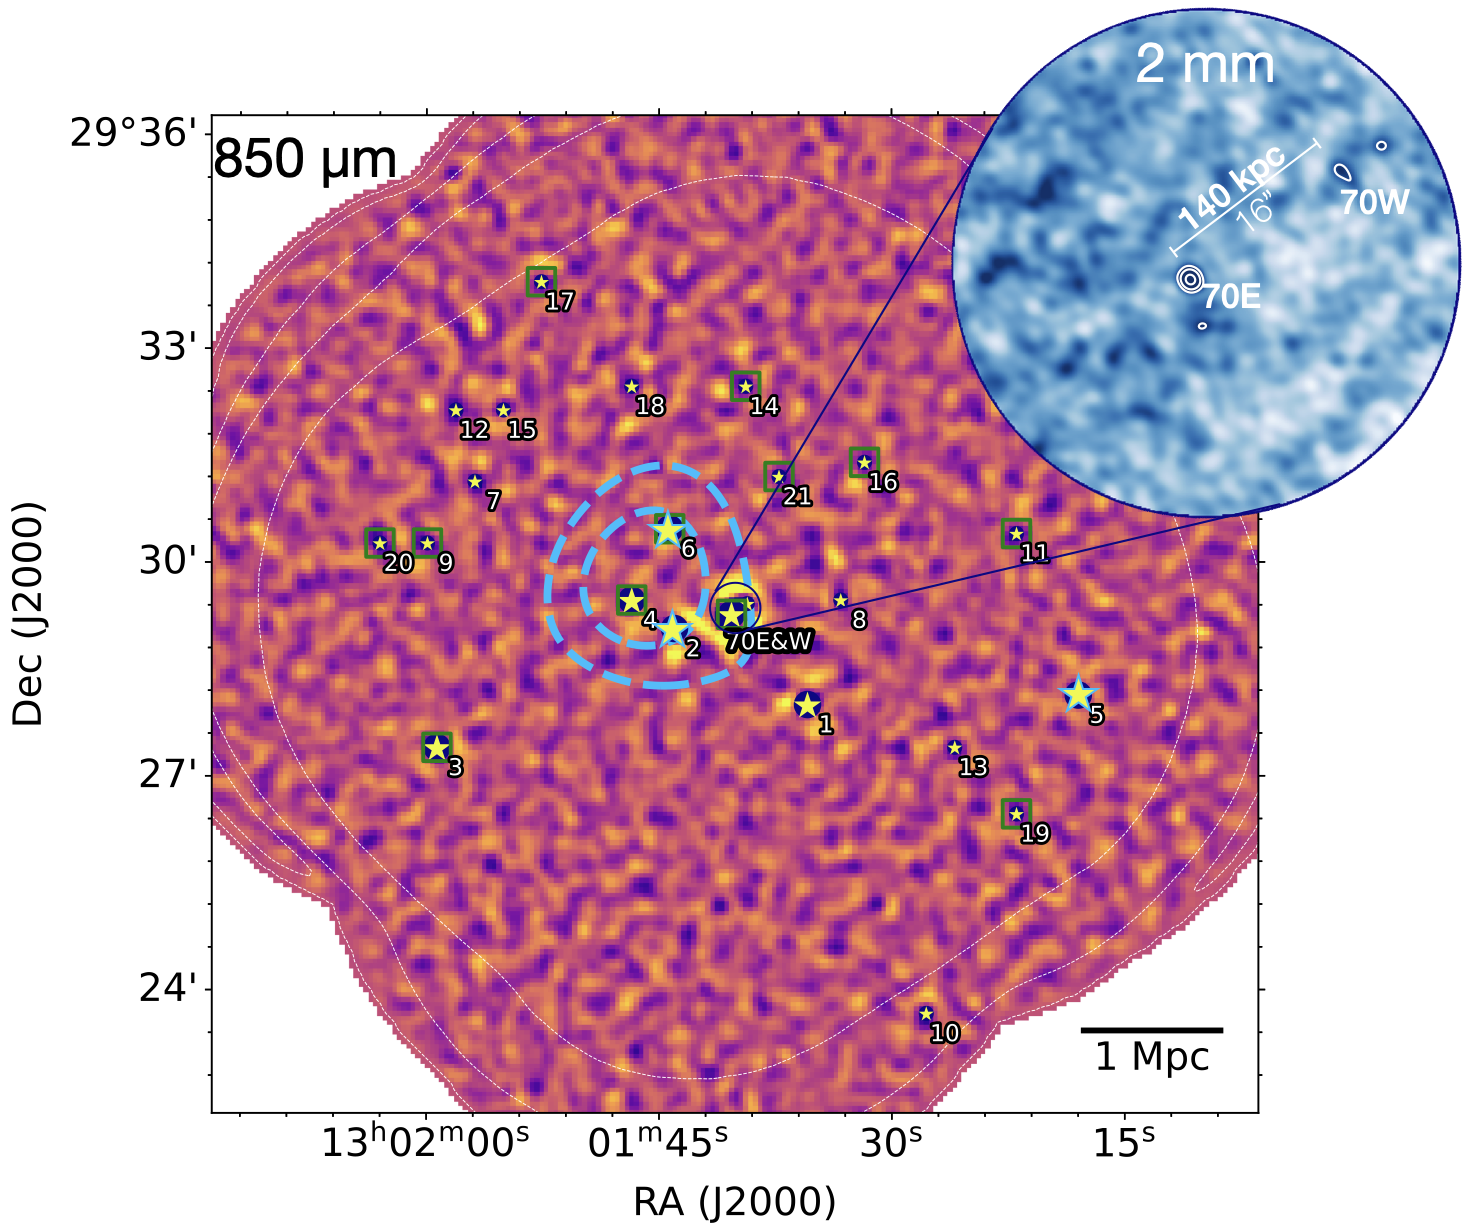
As part of a redshift campaign of bright, dusty galaxies identified by Herschel-ATLAS (Eales et al., 2010; Bakx et al., 2018, 2020b), NOEMA observations of HerBS-70 revealed a non-lensed binary system at (Neri et al., 2020; Cox et al., 2023). Table LABEL:tab:herbs70 summarizes the sub-mm properties of the HerBS-70 system. The two galaxies of the HerBS-70 system, HerBS-70W and HerBS-70E, are separated by a projected distance of (140 kpc at ), and the spectroscopic redshift difference between the galaxies is relatively small, corresponding to a velocity shift of km/s ( and 2.3155 for HerBS-70E and -70W, respectively; Neri et al. 2020). The source HerBS-70E displays strong double-peaked emission lines of CO (3–2) and (4–3) with widths of km/s. In contrast, HerBS-70W has significantly narrower ( km/s) single-peaked emission lines. Subsequent observations using the VLA measured the CO(1–0) emission line of the HerBS-70 binary system and revealed a bright radio continuum at 30 GHz in HerBS-70E indicating the presence of a radio luminous AGN in this source (Stanley et al., 2023). Based on these results, the following properties were derived for HerBS-70E and W. The 8-1000 microns infrared luminosities are and L⊙ for HerBS-70 E and W, respectively, yielding star formation rates of 2000 and 470 M⊙/yr, assuming a Chabrier (2003) initial mass function (Berta et al., 2023), and dust masses of 4 and M⊙ (Draine & Li, 2007; Neri et al., 2020). The molecular gas masses of HerBS-70E and W are and M⊙, with estimated depletion time scales of 170 and 660 Myr, respectively, although these values vary strongly between different gas-mass and star-formation estimates (Berta et al., 2023; Stanley et al., 2023).
HerBS-70E poses an interesting case of feedback through multiple mechanisms. Firstly, the detection of a buried AGN in HerBS-70E suggests ongoing quenching through negative feedback (Stanley et al., 2023). Secondly, star-formation feedback is likely present, given the excessive M⊙/yr star-formation rate of HerBS-70E (Rowan-Robinson et al., 2016). Finally, the depletion timescale (i.e., the star-forming gas mass divided by the star-formation rate) is on the order of 170 Myr (Swinbank et al., 2014; Bakx et al., 2020c; Stanley et al., 2023; Berta et al., 2023), which places a strong limit on the quenching timescale in the case of no inflowing gas.
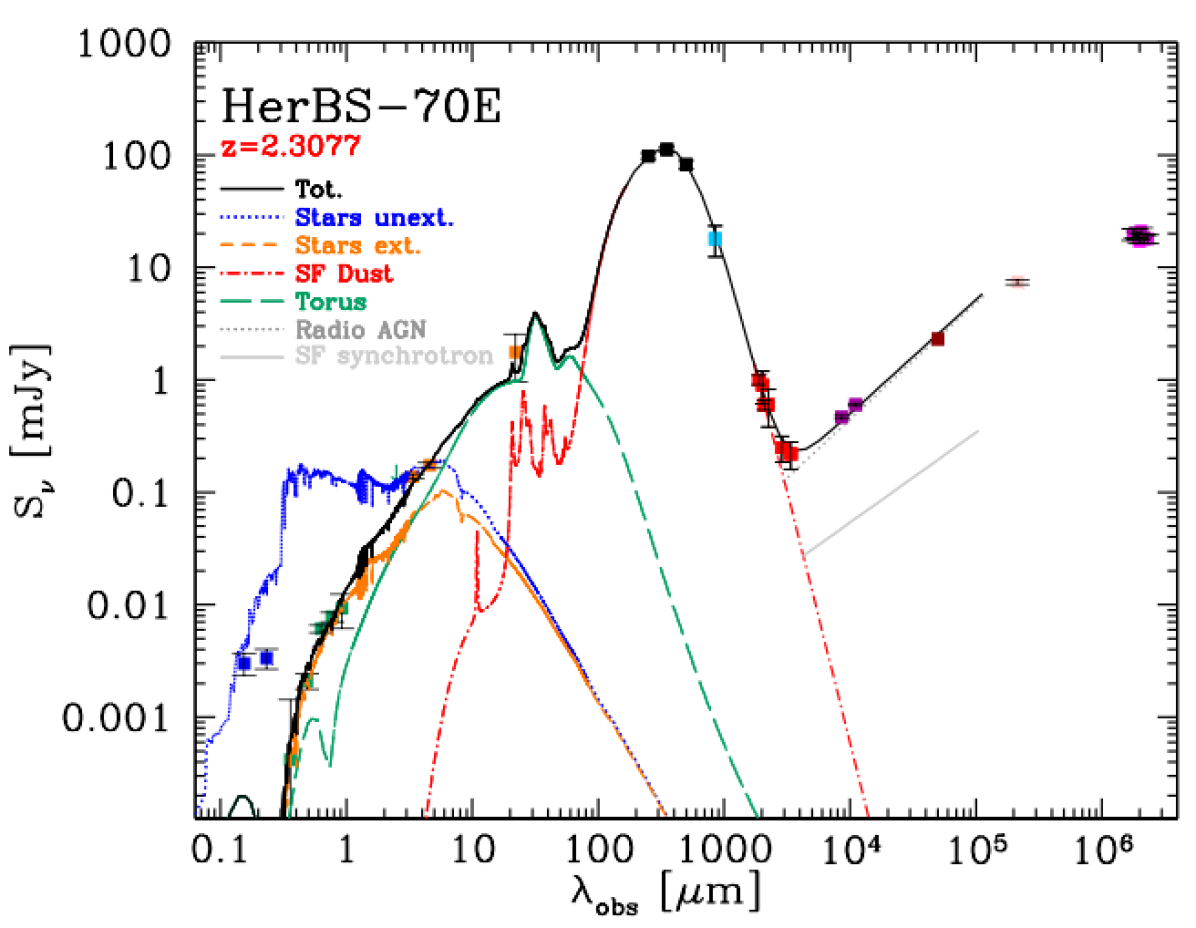
In order to better understand HerBS-70E and its potential for being a central source in an overdense region, we reproduced the UV-to-radio spectral energy distribution (SED) with a composite model that includes the emission of stars, of dust heated by stellar light and by an AGN dusty torus (see Fig. 1). We adopted the SED3FIT code (Berta et al., 2013), which combines Bruzual & Charlot (2003) stellar models, dust emission powered by star formation (see also da Cunha et al., 2008), and an AGN torus component (Feltre et al., 2013, 2012; Fritz et al., 2006), fitted simultaneously to the observed SED.
The radio continuum is not directly fitted by the code, but it is instead computed from the model IR luminosity adopting the radio-FIR correlation at the redshift of HerBS-70E (Delhaize et al., 2017, see also Magnelli et al. 2015). The expected radio emission due to star formation (grey solid line of Figure 1) is much weaker than the observed radio continuum fluxes. This excess confirms the presence of an AGN in the central regions of HerBS-70E (see also Stanley et al. 2023). The WISE data reveal a mid-IR excess in the broad-band SED, that is fitted with an AGN torus (see green long-dashed line in Fig. 1).
An additional radio power law (dotted grey line in Fig. 1) is added a posteriori to reproduce the radio emission of the HerBS-70E central AGN. At the lowest frequencies, the LOFAR data suggest a change of slope of the radio emission. This change of slope is mainly due to synchrotron self absorption (SSA), but note that the low-frequency spectral index is shallower than that of pure SSA, thus indicating that also other physical processes influence it.
The total of the source is between 1.6 and 2.9 L⊙, with the contribution of star formation amounting between 1.4 and L⊙. The latter corresponds to a SFR in the range M⊙/yr, adopting the Kennicutt (1998) conversion after correcting it to the Chabrier (2003) IMF.
The inclusion of the AGN component is important to estimate the stellar mass, because the near-infrared emission of HerBS-70E turns out to be dominated by the dusty torus (% between 1.0 and 2.5 m and up to % between 2.5 and 5.0 m). The resulting best-fit stellar mass is 2.0 M⊙. This suggests a low specific star-formation rate (SFR per unit stellar mass or a stellar-mass doubling timescale) of Myr-1. Combined with the available molecular gas from CO emission, this implies a gas fraction on the order of per cent (see also Ismail et al., 2023; Stanley et al., 2023; Neri et al., 2020), in line with soon-to-be quenched galaxies (Gobat et al., 2018, 2020) at both low and high redshifts.
Although no conclusive evidence yet exists, there are several indications that point to the presence of a cosmic overdensity (Overzier, 2016): i. HerBS-70E is forming stars at a high rate ( M⊙/yr), while having an additional galaxy in its vicinity that could indicate an overdensity of objects within its environment (HerBS-70W). ii. Meanwhile, HerBS-70E has already built up a significant stellar mass at less than three billion years after the Big Bang, which would mean an average star-formation rate of at least M⊙/yr. These star-formation rates in the early Universe are primarily seen in overdense regions in the early Universe (Chiang et al., 2017). iii. The stellar assembly further required a large amount of gas and/or efficient feeding of galaxy to reach M⊙, and HerBS-70E is currently rapidly processing all remaining gas within its system ( Myr). Although the presence of an AGN can drive quenching – and is predicted to amply exist in protoclusters (Shimakawa et al., 2018) – it is also possible that galaxies in its environment are removing gas flows needed for future star formation. Since many of these indications are found together in the HerBS-70 system, a characterization of its environment can teach us both about the evolution of massive galaxies and about large-scale structures in the Universe.
3 Observations and results
In order to find evidence that the binary system HerBS-70 is part of a protocluster, we first carried out deep 850 µm continuum observations using the SCUBA-2 sub-millimetre camera to search for dusty star-forming galaxies in the Mpc-scale environment around HerBS-70. These observations were followed-up by targeted spectroscopic measurements with NOEMA of selected sources identified in the 850 µm continuum map in order to derive their spectroscopic redshifts and verify that the values are around , comparable to HerBS-70. In this Section, we discuss the SCUBA-2 and NOEMA observations and results, including data reduction, flux extraction steps, as well as produce estimates of the completeness and flux boosting.
3.1 Continuum map with SCUBA-2
The mapping speed of sub-mm spectroscopic instruments is relatively low, which favours a two-step process in identifying overdense regions. First, a fast continuum mapping observation characterizes dusty galaxies, and these sources can then be observed through targeted spectroscopic follow-up. Here, we use SCUBA-2 on JCMT to look for dusty galaxies in the vicinity of the HerBS-70 system.
3.1.1 SCUBA-2 850 micron observations
HerBS-70 was observed using the SCUBA-2 bolometer instrument mounted on the JCMT. The instrument is able to observe both 450 and 850 m emission simultaneously through a dichroic mirror (Holland et al., 2013). Through a DAISY pattern scanning observations, HerBS-70 was observed following a continuous petal-like track, providing a central 3 arcminute region of uniform exposure time, and keeping one part of the array on-source at all times (Chapin et al., 2013). The observations were conducted under project code M20BP049 (PI: T. Bakx) in excellent weather conditions () on the 29th of January, the 1st and 3rd of February 2021 for a total of 4.9 hours of on-source time.
3.1.2 Data reduction
We followed the zero masking data reduction prescription described in Holland et al. (2017), which performs the standard deep observation pipeline using the starlink’s SMURF and KAPPA packages. This observation pipeline is supplemented with the addition of masking out the central bright source that was previously detected with Herschel and NOEMA. The data is reduced iteratively using the mapmaker algorithm, which removes noise in order to produce a final astronomical estimate in the image plane. This assumed astronomical signal is then removed from the time-series data, and the noise estimations are done again until a threshold noise level is reached.
The resulting astronomical map is then matched filtered to the point spread function (PSF) of the JCMT, assumed to be 13 arcseconds. The assumed flux-conversion-factor is taken to be 537 Jy/pW/beam (Smith et al., 2019a; Mairs et al., 2021). The signal-to-noise ratio (SNR) map is produced using the kappa recipe makesnr. At the centre of the map, the noise level is mJy/beam, which approaches the background-confusion limit due to the far-infrared background caused by unresolved sub-mm emitters within the beam of the JCMT.
Fluxes are extracted using the matched-filtered signal-to-noise map using the peak emission value. Sources are differentiated by emission peaks separated by more than one beam (13 arcseconds), and each source should have at least . None of the sources are extended beyond the JCMT beam. Noise estimates are made directly from the noise map, which is also produced by the makemap algorithm.
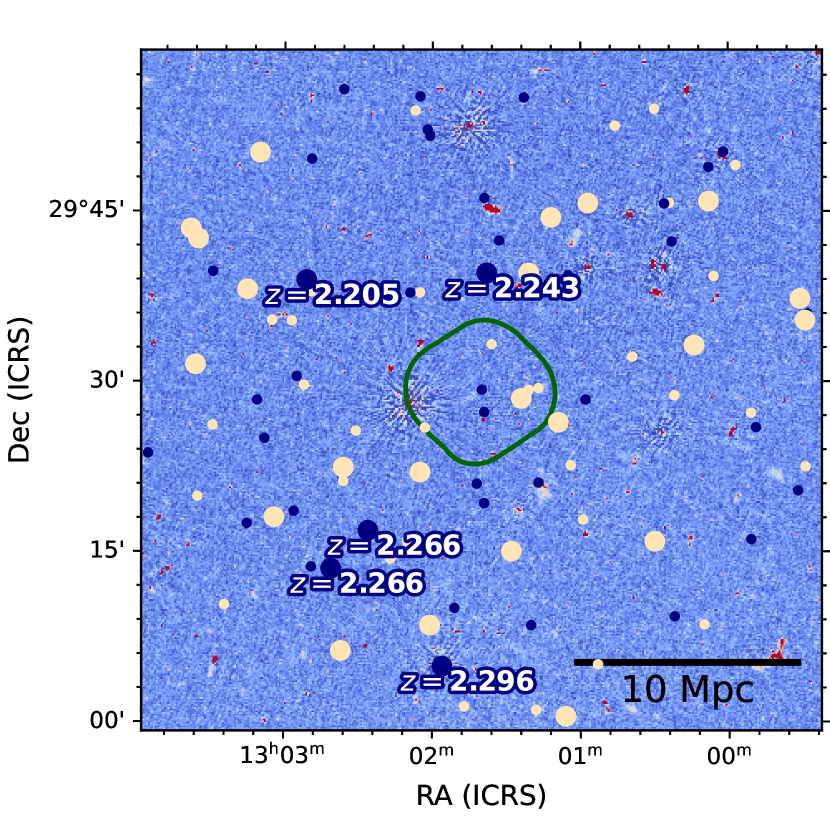
Figure 2 shows the resulting map of around 14 by 14 arcminutes, with all sources above marked as stars, with sources displayed with larger stars. Thin dashed lines indicate the regions where the background noise is below 2, 5 and 10 mJy. In total, 21 SCUBA-2 sources are identified at in addition to HerBS-70 (the E and W components are not resolved in the SCUBA-2 image), and are labeled according to decreasing SNR ratio (Table 2). An inset of the NOEMA 2-mm continuum map is shown in the top-right corner (from Neri et al. 2020), where HerBS-70E and 70W are seen as resolved sources. Green squares show the sources with nearby Herschel galaxies identified through the HELP catalogue222http://herschel.sussex.ac.uk (Shirley et al., 2021). The light-blue contours show the regions where the field is denser than thrice the expected number of background sources (see Section 4.2.3).
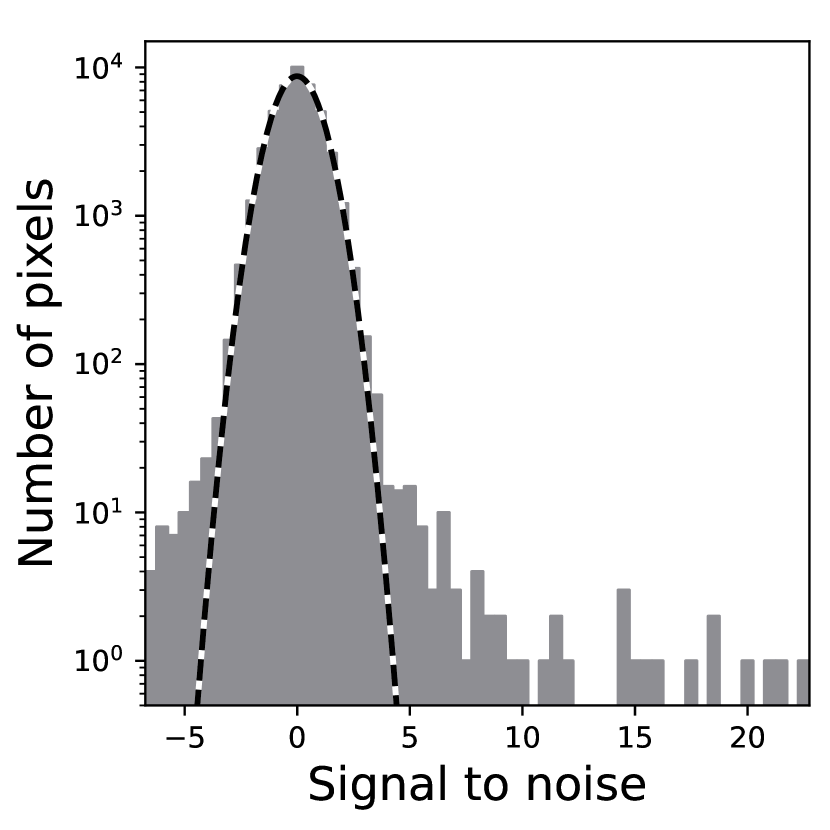
Figure 3 shows the distribution of SNR values of each pixel in the map. Broadly, the bulk of the pixels follow the behaviour expected from white noise, i.e., a Gaussian fit with fits the bulk of the data well. Several peaks at the low- and high-end of the SNR distribution indicate the existence of sources. The negative pixels are caused by the PSF of the JCMT beam, which has negative rings around the peak of per cent of the peak flux. Excess noise pixels around are thus expected given the peak SNR of around 20.
3.1.3 Completeness and Flux Boosting
In order to maximise the scientific gain of the SCUBA-2 image, we assessed the contamination (i.e., false-positives) and completeness (i.e., false-negatives) of our SCUBA-2 observations, and corrected for the Eddington bias in the flux boosting. The Eddington bias accounts for the observed upward boost of fluxes, since there are more faint galaxies that scatter upwards than there are rarer bright galaxies that scatter towards fainter fluxes. Here, we broadly follow the procedure documented in Eales et al. (2000); Cowie et al. (2002); Scott et al. (2002); Borys et al. (2003); Coppin et al. (2006); Lewis et al. (2018), and in line with recent deep SCUBA-2 observations such as the SCUBA-2 Cosmological Legacy Survey (Geach et al., 2017) and the SCUBA-2 survey of COSMOS (Casey et al., 2013; Simpson et al., 2019).
We use the negative map of the SCUBA-2 image as a reference image without source emission. We first process this map by removing any spurious identifications above 2.5 and below -2.5, and proceed to add fake sources based on the source count distribution from Weiß et al. (2009), assuming the typical FWHM of the beam (13 arcseconds). We execute this process 5000 times and extract our galaxies through their peak point-source flux, which we then compare it against the original injected flux. We then use the noise maps to translate the injected fluxes into SNR estimates.
Figure 4 compares the injected sources within each SNR bin to the fraction of sources that were actually extracted, as shown in the blue points completeness graph, i.e., the false-negatives. Even down to 3, we are able to extract 75 per cent of the sources. The orange contamination graph indicates the fraction of spurious sources that are extracted, i.e, the false-positives. The errors on both estimates are proportional to the square root of the number of simulated sources in each signal-to-noise ratio bin. The number of contaminants increases rapidly below , even suggesting that up to 75 per cent of sources are spurious. As a balance between contamination and completion, we take a cut as an extraction threshold.
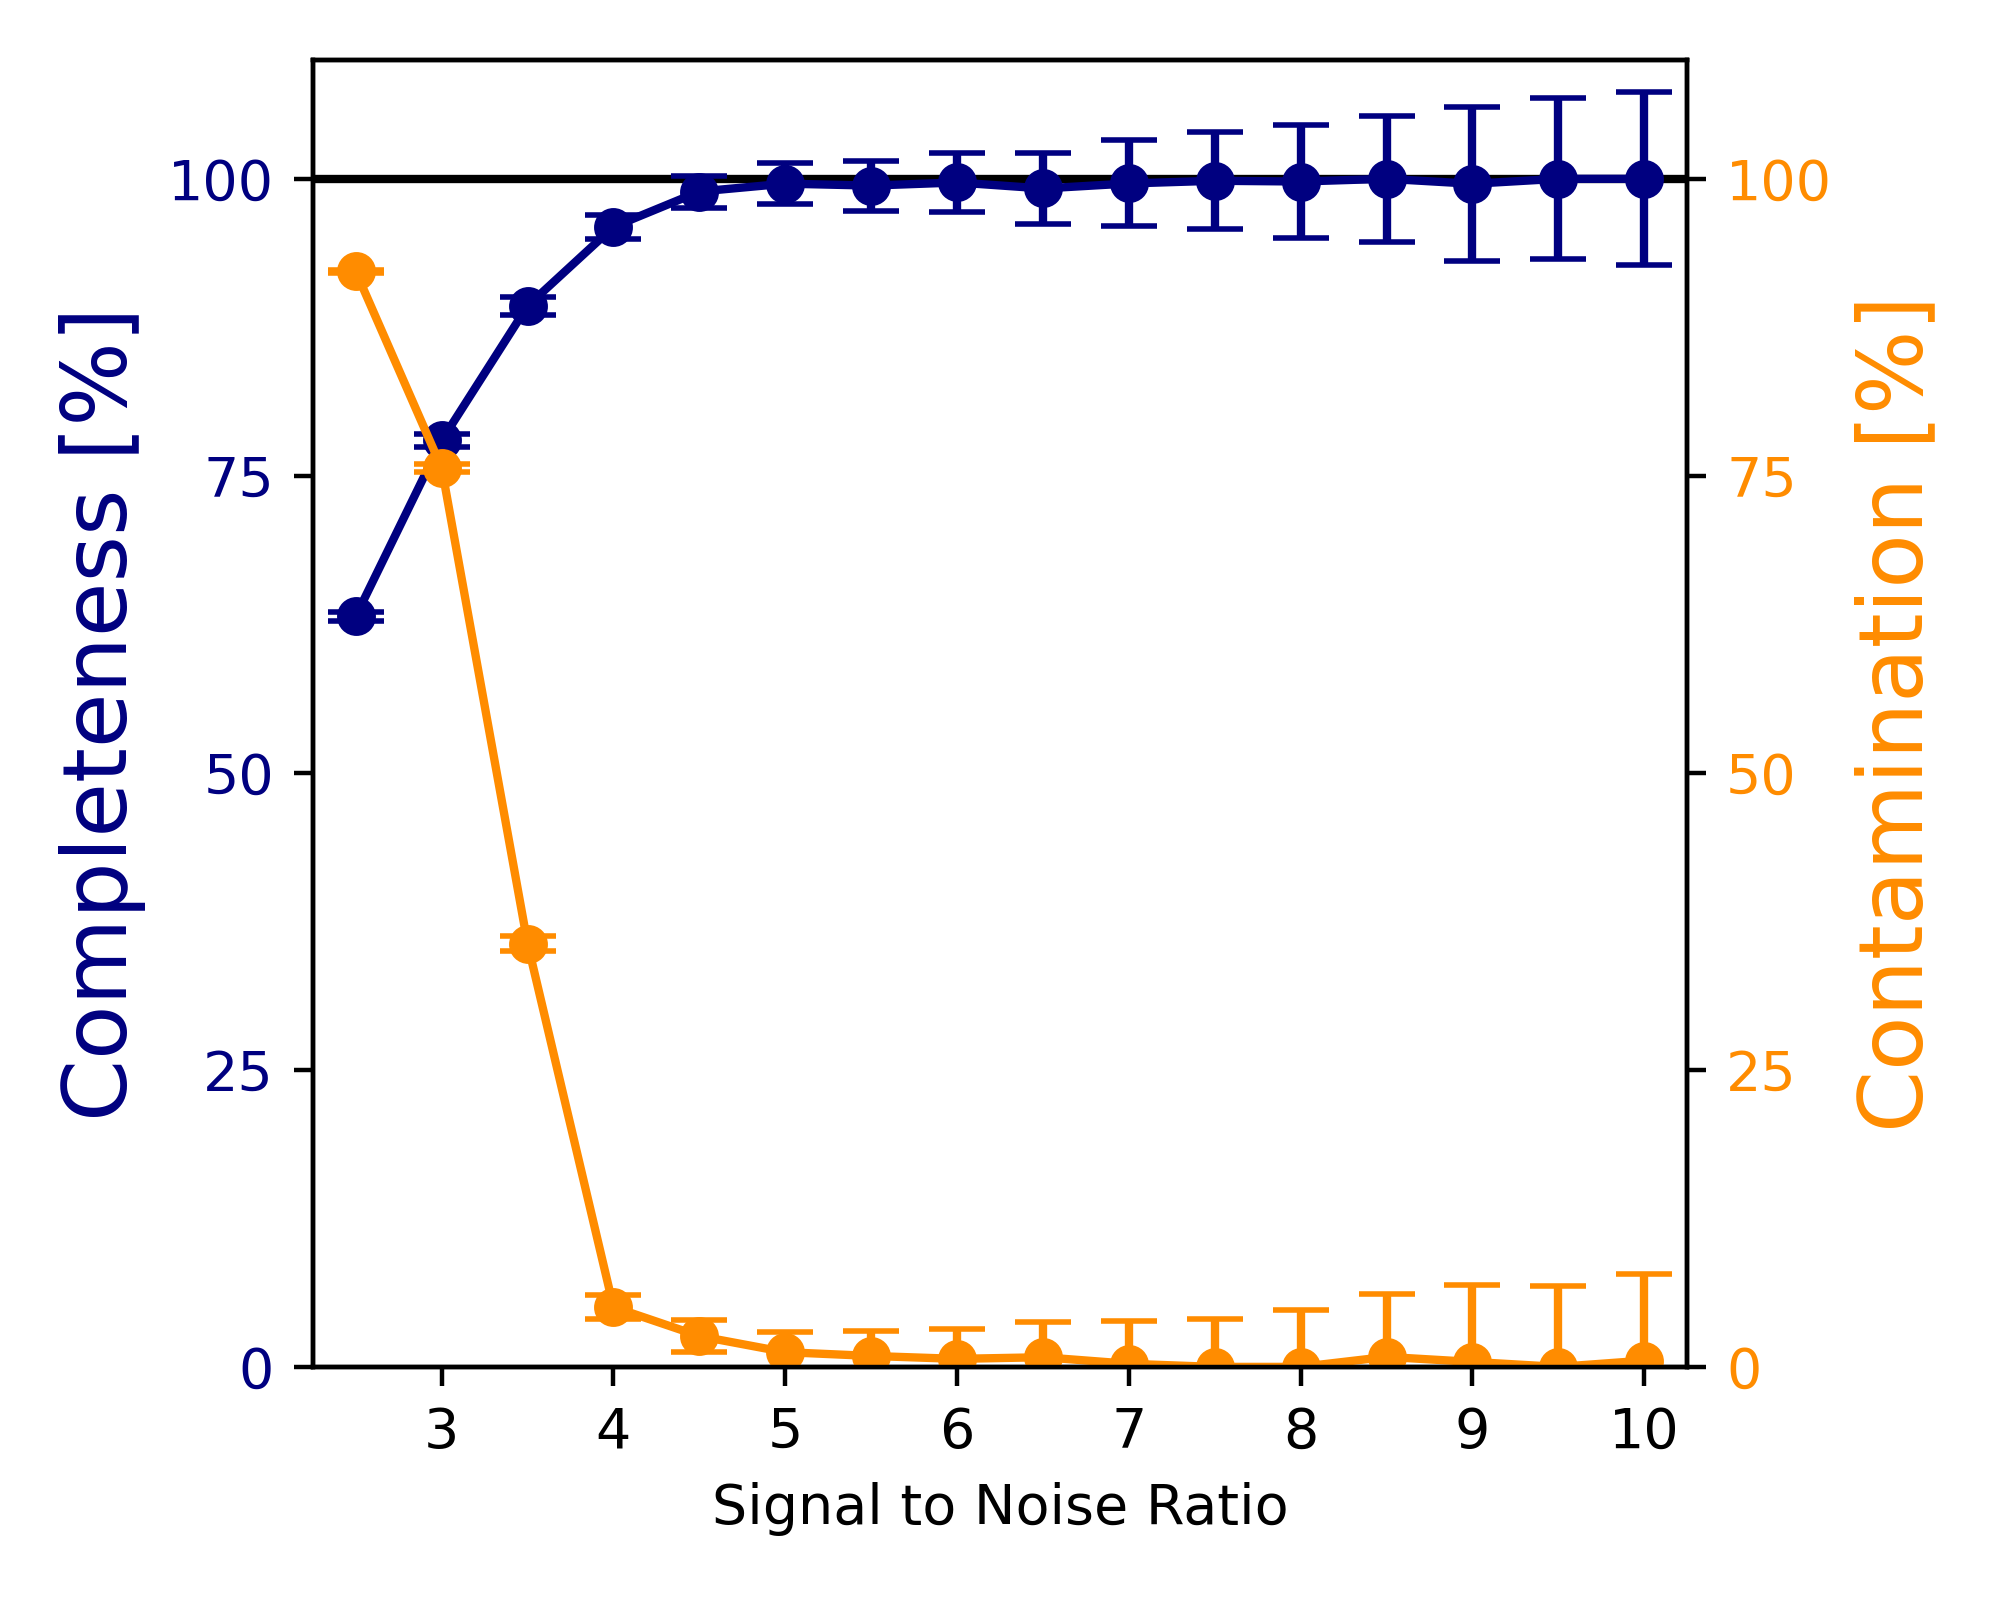
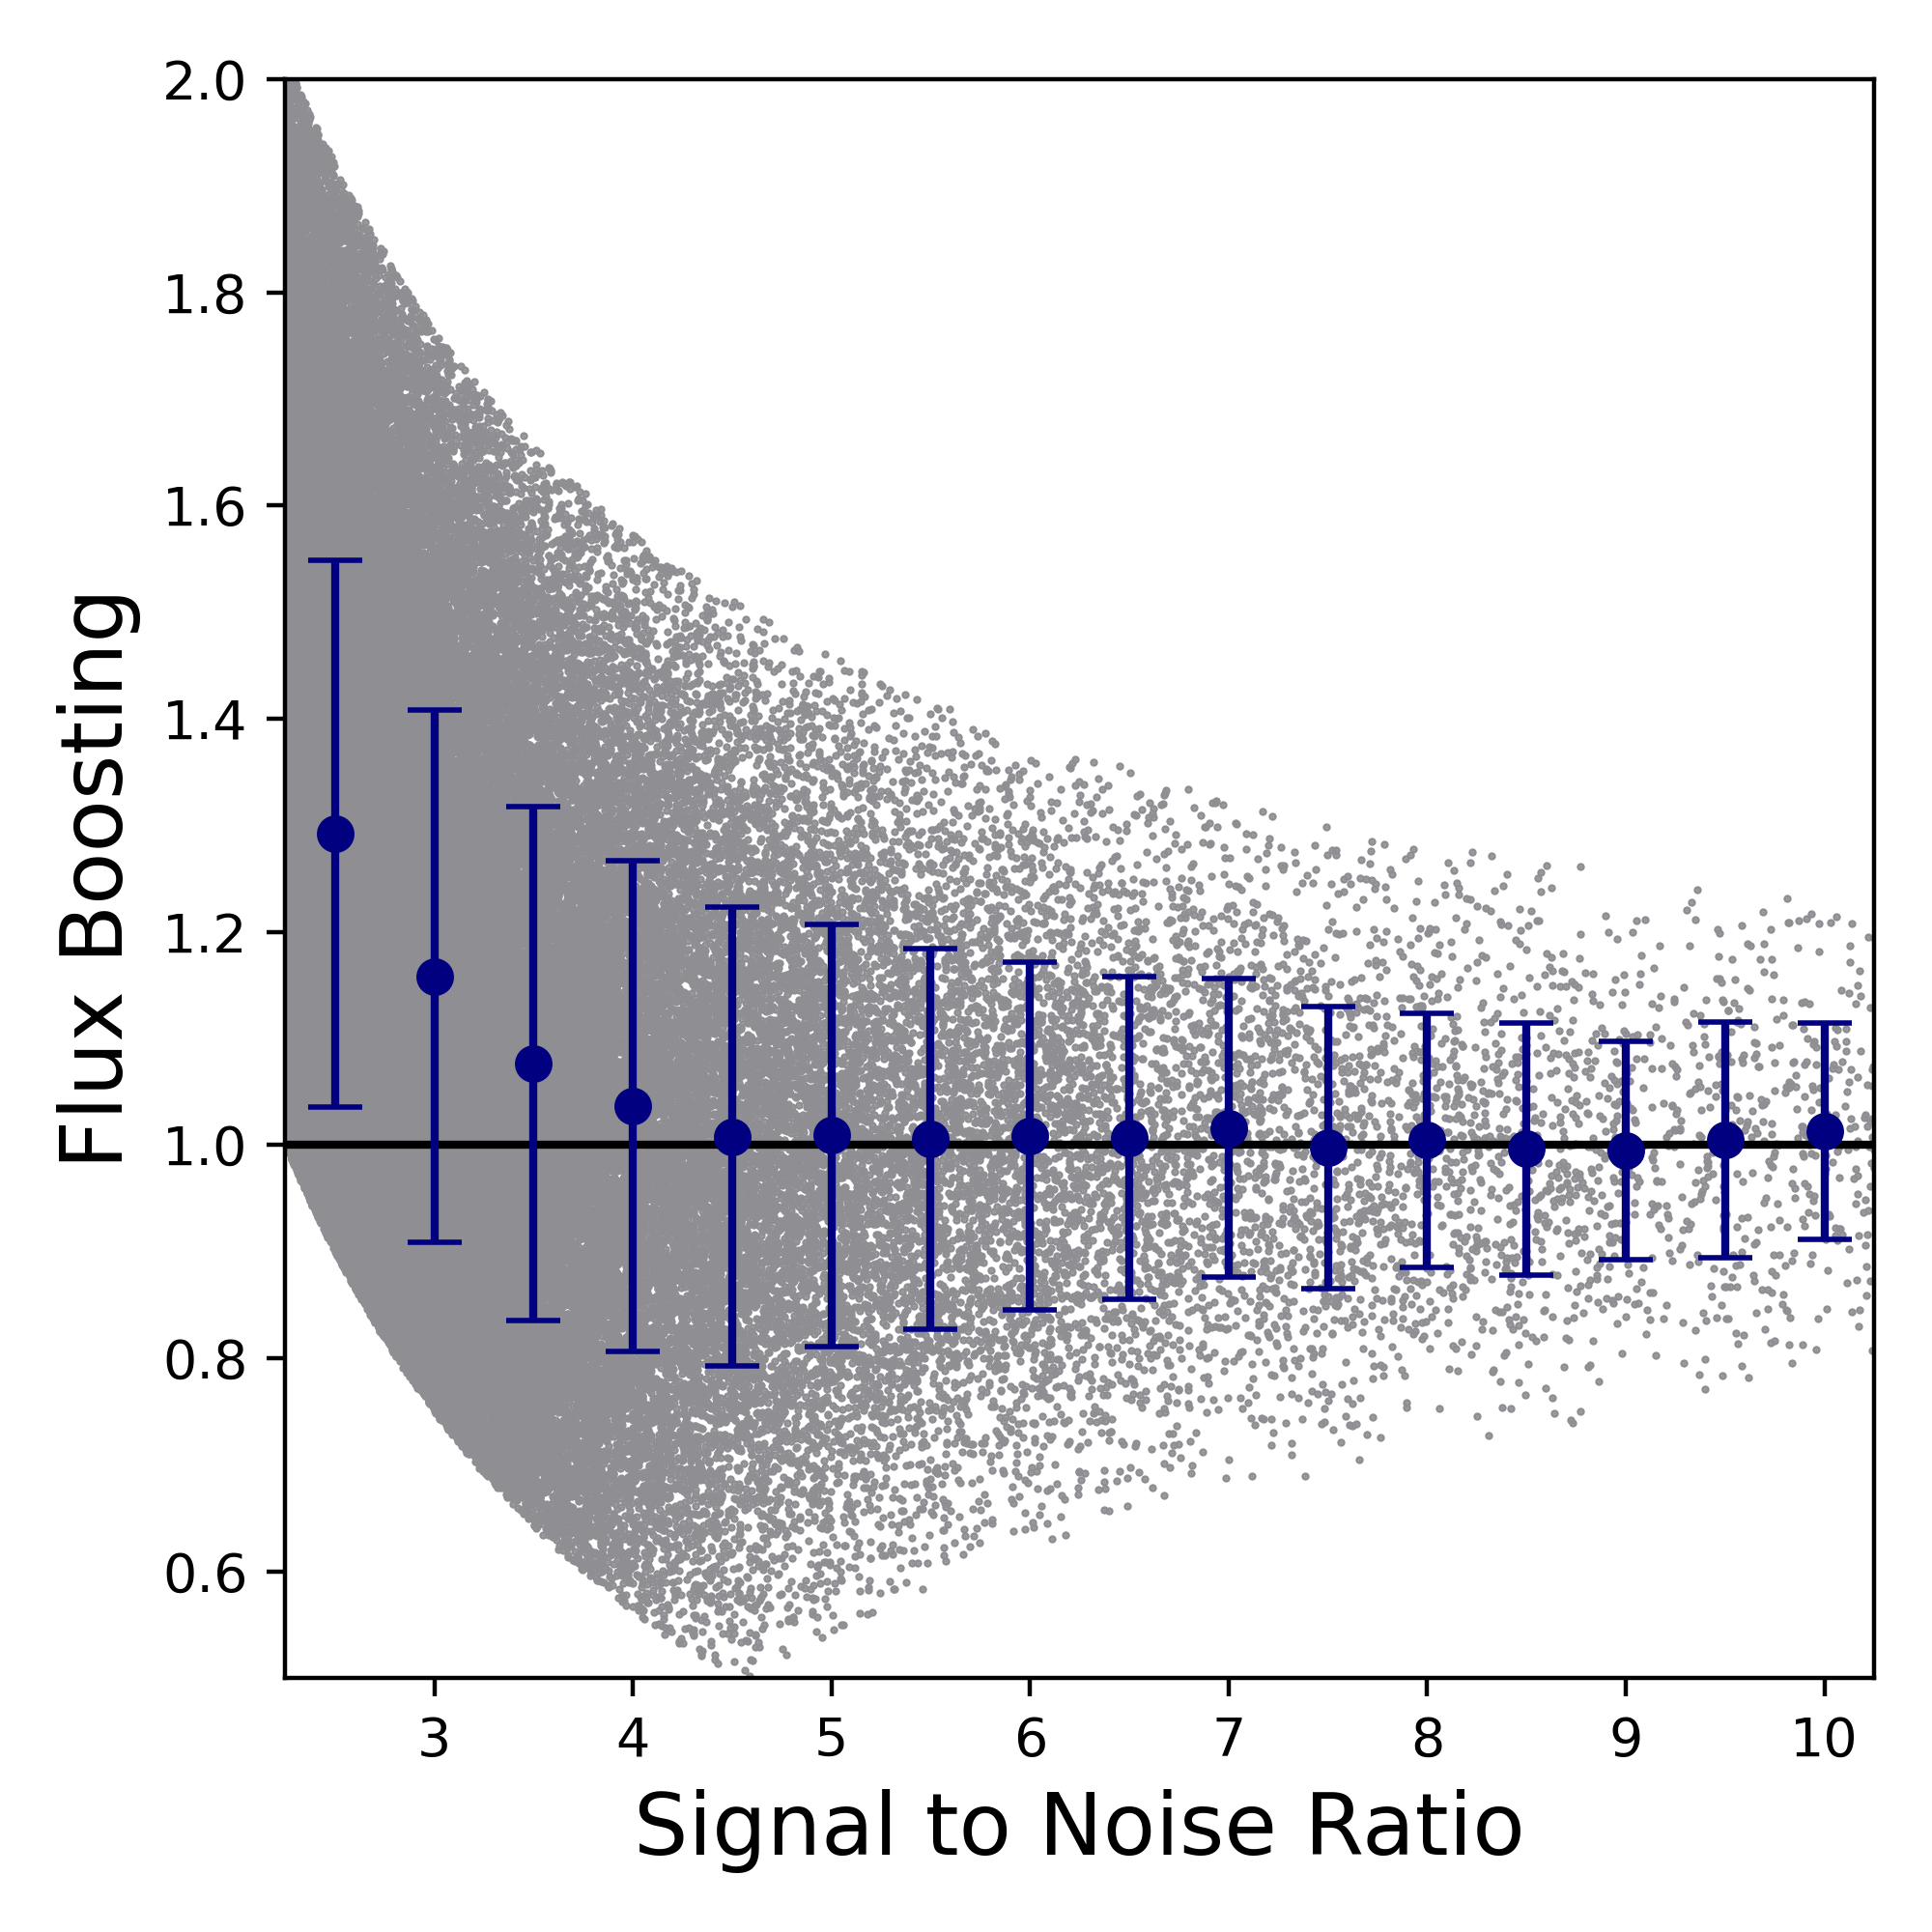
Figure 5 shows the Eddington boosting depending on the SNR of a source. The Eddington boosting is calculated as the ratio between the measured and the injected flux. Galaxies detected at lower signal-to-noise are more likely to be boosted in flux due to the exponential nature of the source count distribution, with the faintest sources typically appearing per cent brighter than their true flux. We therefore appropriately adjust for the flux boosting for the 850 µm fluxes in Table 2, and include the additional uncertainty to the instrumental uncertainty in quadrature.
| # | RA | DEC | SNR | SFR850 | ’ | Bias | |||||||
|---|---|---|---|---|---|---|---|---|---|---|---|---|---|
| [hms] | [dms] | [M⊙/yr] | [] | [] | [mJy] | [mJy] | [mJy] | [mJy] | |||||
| 70EW | 13:01:40.3 | +29:29:16 | 22.6 | 1.8 0.4 | 1800 | 10.2 | 5.3 | 122.3 6.1 | 139.3 5.6 | 106.4 6.0 | 16.9 1.9 | 1.00 | 0.0 |
| 70.S1 | 13:01:35.4 | +29:28:00 | 8.9 | 3.4 0.6 | 780 | 4.6 | 2.4 | 11.9 6.1† | 12.6 5.6† | 15.7 6.0† | 7.5 1.2 | 1.00 | 0.0 |
| 70.S2 | 13:01:44.0 | +29:29:04 | 6.8 | 2.0 0.4 | 550 | 3.2 | 1.7 | 23.3 6.1† | 32.4 5.6† | 28.7 6.0† | 5.3 1.1 | 1.01 | 0.0 |
| 70.S3 | 13:02:00.3 | +29:27:24 | 6.6 | 1.7 0.4 | 750 | 4.4 | 2.3 | 54.0 6.0 | 57.5 5.5 | 40.3 6.3 | 7.2 1.5 | 1.01 | 0.0 |
| 70.S4 | 13:01:46.7 | +29:29:28 | 6.5 | 1.7 0.4 | 580 | 3.4 | 1.8 | 34.2 6.1 | 37.4 5.6 | 20.6 6.1 | 5.6 1.2 | 1.01 | 0.0 |
| 70.S5 | 13:01:18.0 | +29:28:08 | 5.1 | 2.6 0.5 | 670 | 3.9 | 2.0 | 16.3 6.1† | 19.5 5.6† | 12.8 6.0† | 6.5 1.8 | 1.01 | 0.0 |
| 70.S6 | 13:01:44.3 | +29:30:28 | 5.0 | 2.0 0.4 | 430 | 2.5 | 1.3 | 17.9 6.0 | 19.8 5.3 | 6.5 6.3 | 4.2 1.2 | 1.01 | 0.0 |
| 70.S7 | 13:01:56.9 | +29:31:08 | 4.7 | 3.5 0.6 | 540 | 3.1 | 1.6 | 6.2 6.1† | 9.5 5.6† | 12.5 6.0† | 5.2 1.6 | 1.01 | 0.0 |
| 70.S8 | 13:01:33.3 | +29:29:28 | 4.3 | 2.8 0.5 | 400 | 2.3 | 1.2 | 6.1 6.1† | 13.2 5.6† | 6.1 6.0† | 3.9 1.2 | 1.02 | 0.0 |
| 70.S9 | 13:02:00.0 | +29:30:16 | 4.3 | 1.3 0.3 | 520 | 3.0 | 1.6 | 58.4 5.9 | 46.2 5.9 | 25.8 6.5 | 5.0 1.6 | 1.02 | 0.0 |
| 70.S10 | 13:01:27.8 | +29:23:40 | 4.2 | 3.6 0.6 | 1100 | 6.6 | 3.4 | 13.1 6.1† | 19.0 5.6† | 16.7 6.0† | 10.9 3.5 | 1.02 | 0.0 |
| 70.S11 | 13:01:22.0 | +29:30:24 | 4.1 | 0.7 0.2 | 460 | 2.7 | 1.4 | 102.5 6.0 | 57.1 5.2 | 29.5 6.2 | 4.4 1.5 | 1.03 | 0.0 |
| 70.S12 | 13:01:58.1 | +29:32:08 | 3.9 | 3.4 0.6 | 480 | 2.8 | 1.5 | 5.9 6.1† | 8.2 5.6† | 12.3 6.0† | 4.7 1.6 | 1.05 | 0.1 |
| 70.S13 | 13:01:25.9 | +29:27:24 | 3.8 | 2.6 0.5 | 430 | 2.5 | 1.3 | 8.4 6.1† | 17.6 5.6† | 29.3 6.0† | 4.2 1.5 | 1.05 | 0.2 |
| 70.S14 | 13:01:39.4 | +29:32:28 | 3.7 | 0.7 0.2 | 510 | 3.0 | 1.6 | 128.5 6.2 | 76.3 5.4 | 35.9 5.7 | 5.0 1.8 | 1.06 | 0.2 |
| 70.S15 | 13:01:55.0 | +29:32:08 | 3.7 | 2.4 0.4 | 420 | 2.5 | 1.3 | 12.0 6.1† | 16.7 5.6† | 22.0 6.0† | 4.1 1.5 | 1.06 | 0.2 |
| 70.S16 | 13:01:31.7 | +29:31:24 | 3.7 | 2.3 0.4 | 370 | 2.2 | 1.1 | 16.5 5.8 | 5.7 5.8 | 3.6 6.4 | 3.6 1.3 | 1.06 | 0.2 |
| 70.S17 | 13:01:52.6 | +29:33:56 | 3.7 | 2.1 0.4 | 630 | 3.7 | 1.9 | 21.2 5.8 | 18.2 5.7 | 8.8 6.0 | 6.1 2.2 | 1.06 | 0.3 |
| 70.S18 | 13:01:46.8 | +29:32:28 | 3.7 | 1.7 0.4 | 400 | 2.3 | 1.2 | 23.4 6.1† | 17.2 5.6† | 10.1 6.0† | 3.9 1.4 | 1.06 | 0.3 |
| 70.S19 | 13:01:22.0 | +29:26:28 | 3.6 | 1.5 0.3 | 480 | 2.8 | 1.4 | 30.3 6.0 | 20.4 5.5 | 9.9 6.0 | 4.6 1.7 | 1.07 | 0.3 |
| 70.S20 | 13:02:03.0 | +29:30:16 | 3.5 | 1.6 0.3 | 410 | 2.4 | 1.2 | 38.0 5.8 | 31.3 5.6 | 27.3 5.7 | 4.0 1.5 | 1.08 | 0.4 |
| 70.S21 | 13:01:37.3 | +29:31:12 | 3.5 | 1.9 0.4 | 310 | 1.8 | 0.9 | 13.6 5.6 | 16.5 5.7 | 3.7 5.9 | 3.0 1.1 | 1.08 | 0.4 |
Notes: Col. 1: The source identification of the sources shown in Figure 2. Col. 2 & 3: The right ascension and declination of the sources. Col. 4: The signal-to-noise ratio of the sources from the map, extracted from the peak pixel using the raw signal and noise of the sources, i.e., uncorrected for Eddington bias that is included in column 12. Col. 5: Photometric redshift derived using the two-temperature modified black-body from Pearson et al. (2013). Col. 6: The bolometric infrared luminosity (µm), derived from the deboosted 850m flux density assuming . We assume a single-temperature modified black-body at 30 K. Col. 7: The star-formation rate derived from the FIR luminosity-to-SFR conversion factor, , is valid for a Salpeter IMF (Kennicutt, 1998). Note that these SFR estimates are based on a single-temperature estimate, and thus the HerBS-70E&W SFR estimate deviates from the full fit provided in Bakx et al. (2018, 2020b). Col. 8: The dust mass estimate assuming a single-temperature modified black-body at 30 K at , assuming cm2/g at 1900 GHz, and scaling according to with following Draine (2003). Col. 9, 10 & 11: The Herschel photometry derived from the HELP catalogue. When unavailable (indicated by a †), we extract the fluxes directly from the Herschel maps (www.h-atlas.org) and use the errors documented in Valiante et al. (2016). Col. 12: The 850 µm fluxes and errors, corrected for flux boosting, with the errors including both the instrumental and observational biases. Col. 13: The flux boosting bias. Col. 14: The false-positive probability, as a probability between 0 and 1.
3.2 Spectroscopic characterization with NOEMA
The continuum sub-mm camera observations have revealed a tentative overdensity in the central region surrounding HerBS-70 (see Section 4.2). Subsequent spectroscopic confirmation requires targeted deep observations to reveal potential spectroscopic lines. Here, we use NOEMA at 2mm to target the CO(4–3) and [C i] emission lines simultaneously to identify companion sources at a similar redshift to the HerBS-70 system, and for those companions, measure their molecular gas masses.
3.2.1 NOEMA observations of CO(4–3) and atomic carbon
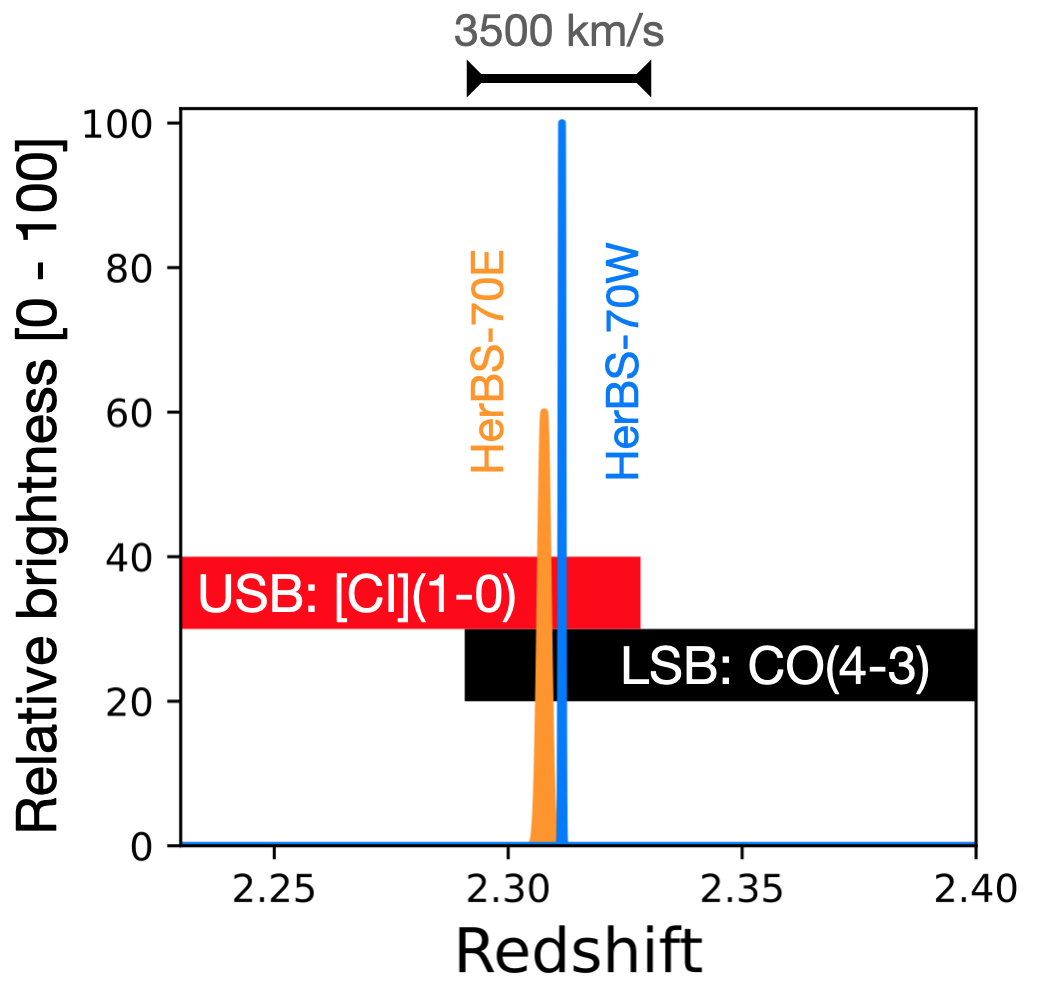
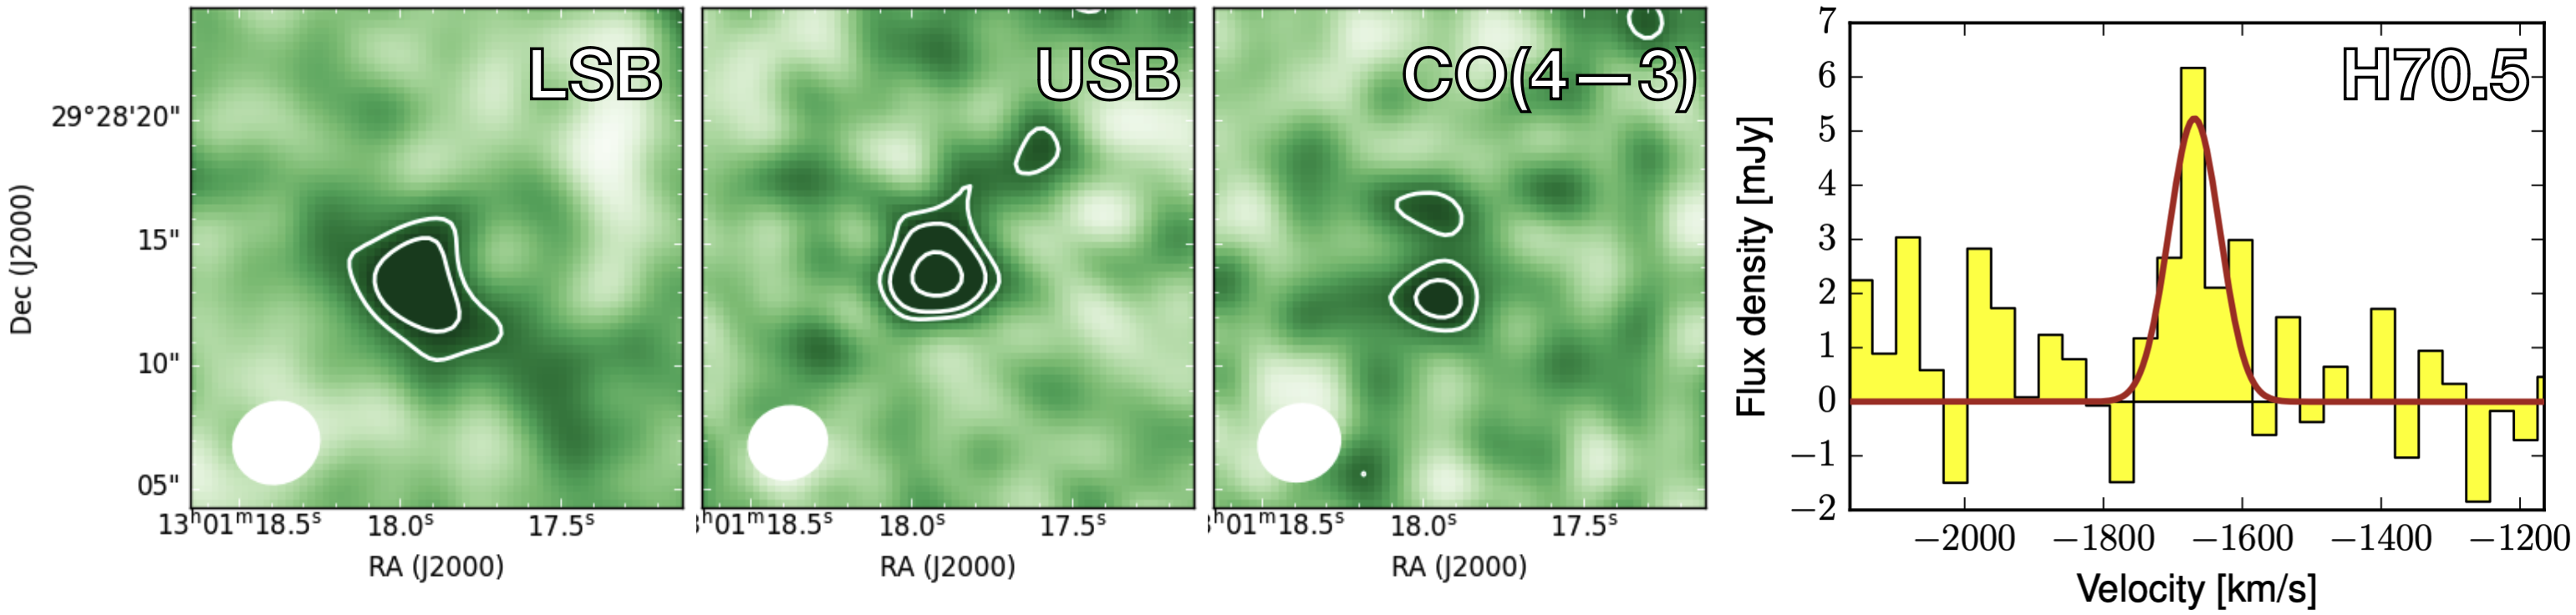
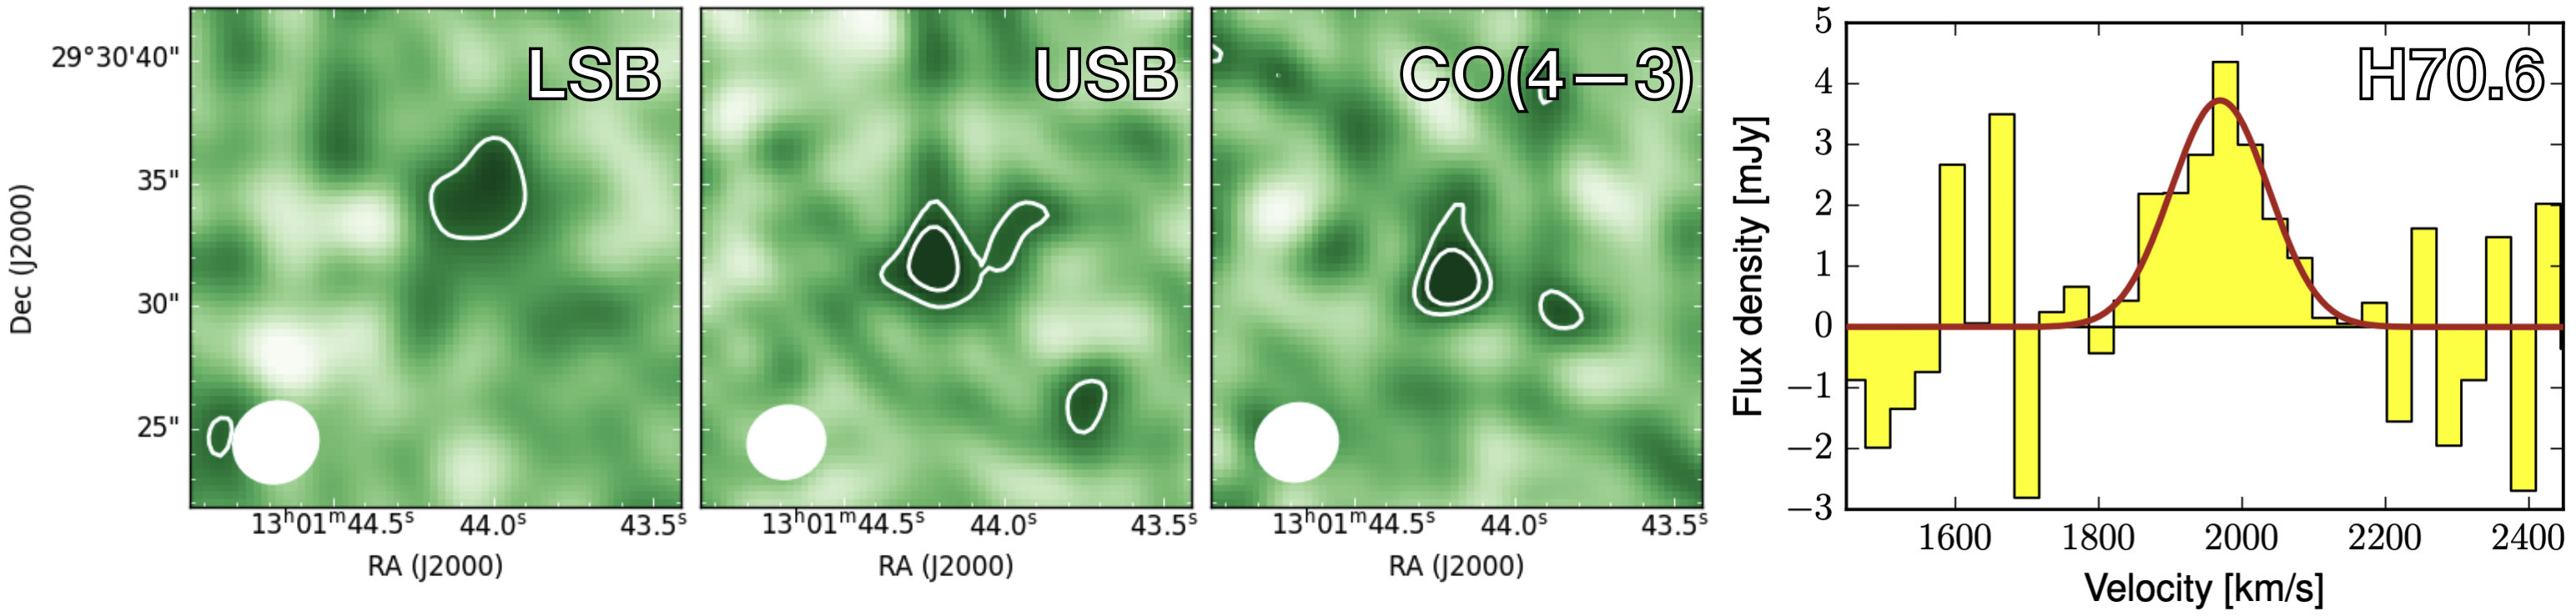
During the summer of 2023, the NOEMA interferometer observed nine of the brightest protocluster member candidates in track-sharing mode (S23CI001; PI: Bakx). The source H70.9 was excluded, as it lies close to a known quasar and because of its low photometric redshift (; Table 2). The PolyFix receivers are set up to cover 132.925 to 140.625 GHz (LSB) and 148.404 to 156.104 GHz (USB), with the expected frequency for CO(4–3) is at 139.43 GHz and for [C i] is at 148.71 GHz. Figure 6 depicts the chosen set-up to include both CO(4–3) and [C i] emission at the expected frequency of HerBS-70, and includes roughly km/s around this system, wide enough to include most of the protocluster members (Kurk et al., 2000; Koyama et al., 2013, 2021). The 2 mm band is sensitive to a brighter part of the continuum emission of protocluster members surrounding HerBS-70 and facilitate the identification of the expected position of the line emission, instead of an alternative strategy that would target CO(3–2) in the 3 mm band where the dust continuum of nearby galaxies is likely too faint to be detected.
3.2.2 Data reduction and flux extraction
Phase and amplitude calibrators were chosen in close proximity to the track-shared sources in order to reduce uncertainties in astrometric and relative amplitude calibration. MWC349 and 3C273 were used as absolute flux calibrators. The absolute flux calibration was estimated to be accurate to within 10%. The data were calibrated, averaged in polarisation, imaged, and analysed in the GILDAS software package333http://www.iram.fr/IRAMFR/GILDAS/. The -tables were produced from calibrated visibilities in the standard way and cleaned using natural weighting and support masks defined on each of the detected sources. Continuum maps were produced for each sideband, excluding the spectral ranges that include emission lines. Continuum extraction was performed on cleaned continuum maps, after correcting for primary beam attenuation. The resulting beam size is 3.6 by 3.4 arcseconds, and the continuum depth is between 60 and 90 Jy/beam per side-band, while the spectral sensitivity is between 1.3 to 1.8 mJy/beam in a 35 km/s bin. The spectra of each source were extracted from cleaned cubes within polygonal apertures defined by hand on the emission line channels to enhance the signal-to-noise of the spectral detection.
| Source | RA | Dec | CO(4–3) | [C i] | |||||
|---|---|---|---|---|---|---|---|---|---|
| [hms] | [dms] | [mJy] | [mJy] | [km/s] | [km/s] | [Jy km / s] | [Jy km / s] | ||
| H70.S1 | 13:01:35.29 | 29:28:03.2 | 0.43 0.08 | 0.71 0.12 | |||||
| H70.S2 | 13:01:44:19 | 29:29:03.4 | 0.29 0.07 | 0.40 0.09 | 2.3100 | 980 160 | -205 | 2.35 0.39 | |
| H70.S3 | |||||||||
| H70.S4 | |||||||||
| H70.S5 | 13:01:18.08 | 29:28:14.0 | 2.2895 | ||||||
| H70.S6 | 13:01:44:43 | 29:30:32.0 | 2.3294 | 1947 | - | ||||
| H70.S7 | |||||||||
| H70.S8 | |||||||||
| H70.S10 |
Notes: Col. 1: Source name. Col. 2 & 3: The right ascension and declination of the sources based on NOEMA data. Col. 4 & 5: The Lower and Upper Side-Band continuum fluxes or upper limits. Col. 6: The spectroscopic redshift associated with the line identification. Col. 7: The full-width at half-maximum of the line. Col. 8: The velocity-separation between the source and HerBS-70. Col. 9 & 10: The line fluxes and upper limits.
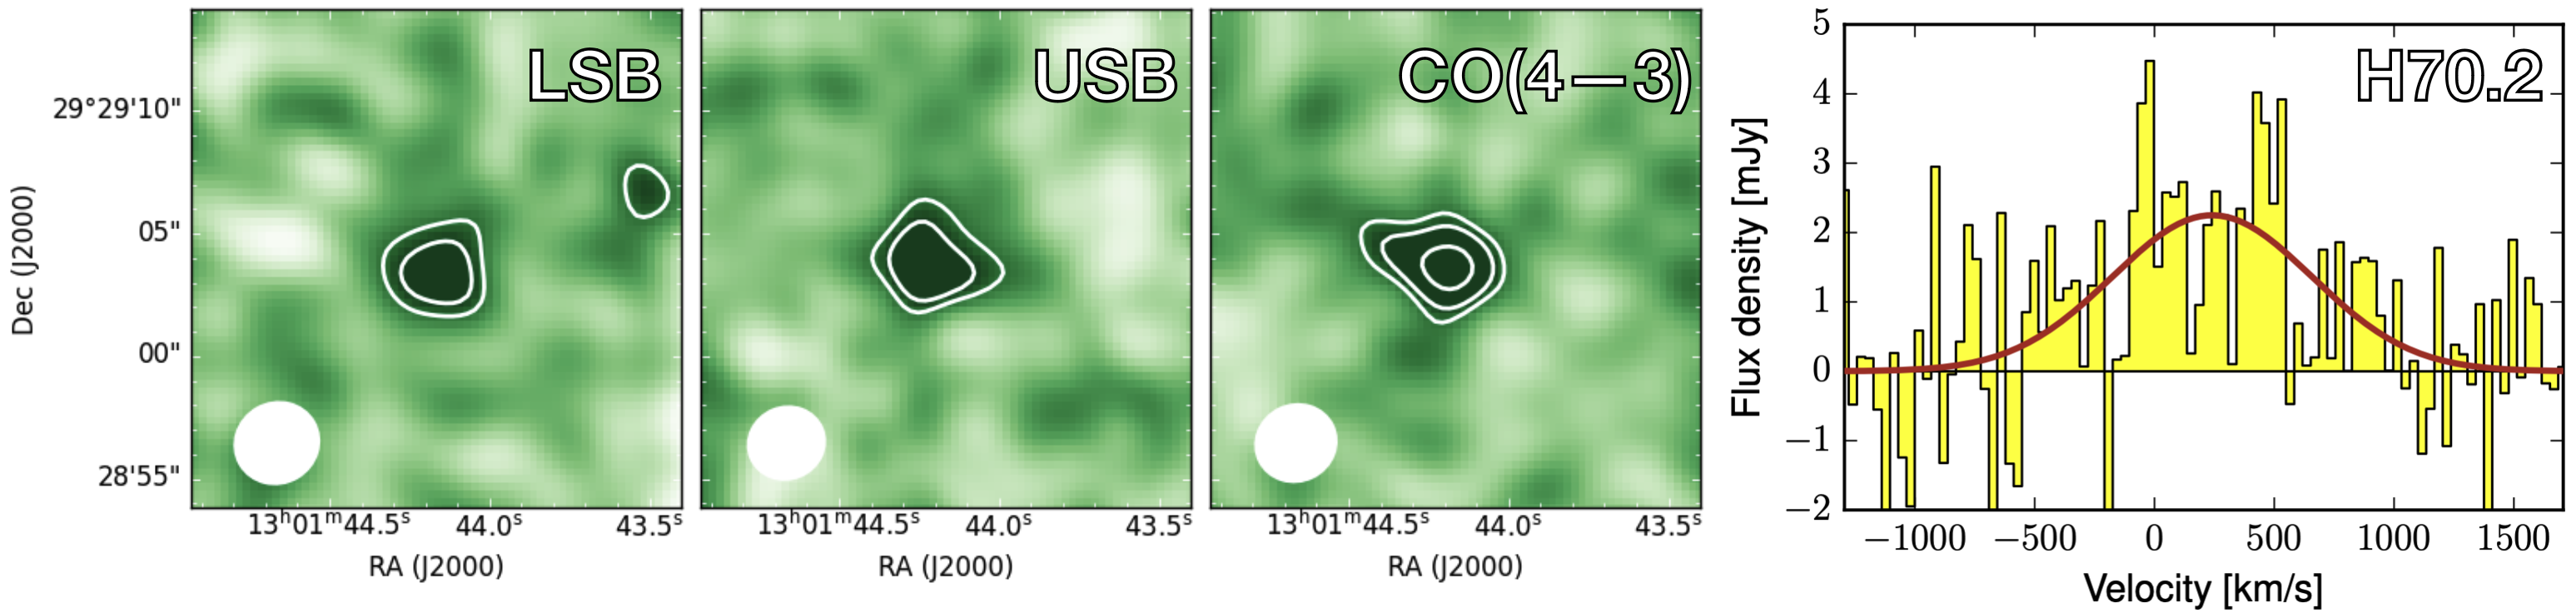
Table 3 shows the resulting continuum and fluxes for the nine NOEMA-observed targets. In total, four sources are detected in their dust continuum, and deep upper limits are provided for the other five sources. For three of the sources with continuum detections, emission lines are identified in the spectroscopic NOEMA observations, which are shown in Figure 7. H70.2 has a very wide emission line ( km/s), while the H70.5 and .6 have much more narrow emission lines. None of the sources have accompanying [C i] line emission, suggesting the observations are not deep enough to detect the atomic carbon emission. The observed-frame wavelength of the [C i] emission of H70.6 lies outside of the observed bandwidth.
4 Discussion
In the next sections, we present a detailed analysis of the spectroscopic observations and examine the overdensity hypothesis in light of these observations (Sect. 4.1). In Sect. 4.2, we evaluate the wider environment of HerBS-70 using the continuum observations, which was part of our motivation towards the spectroscopic observations. Sect. 4.3 provides a cosmological picture of the evolution of the HerBS-70 environment towards , and we conclude with a perspective on future protocluster studies among DSFG sources (Sect. 4.4).
4.1 A gas-poor protocluster core at
As will be shown in the subsequent sub-section, the continuum SCUBA-2 observations provide modest estimates of the overdensity bias of HerBS-70 () through a two-dimensional perspective of the environment. The continuum observations provide only a low-significance statistic on the overdensity, exacerbated by the negative-K correction that probes infrared luminosities regardless of the source redshift (Blain, 1999) which dilutes the true protocluster members with line-of-sight galaxies. Instead, the NOEMA observations are able to confirm that three additional sources are part of the HerBS-70 system, corresponding to a total additional star-formation rate of 1650 M⊙/yr (i.e., the sum of the star-formation rates of H70.2, .5 and .6 from Table 2). In total, the identified system contains five dusty galaxies, and we have excluded an additional six dusty SCUBA-2 identified galaxies from the system. Finally, 10 sources remain without spectroscopic follow-up and their protocluster membership is still not known. Of the three additional sources contributing to the overdensity bias in Figure 2, two turned out to be real protocluster members. This suggests that the continuum bias estimate () is well recovered by the NOEMA observations, a surface-density bias of .
The cosmic star-formation rate density at is roughly 0.063 M⊙/yr/Mpc3 (Madau & Dickinson, 2014; Algera et al., 2023). Our observations probe a 14 by 14 arcminute region within ( km/s) relative to the central HerBS-70 frequency. Here, the distance probed by a is equal to the difference in co-moving distances at and divided by . The resulting volume of 735 Mpc3 (i.e., 7 by 7 by 15 Mpc) is thus expected to contain star-formation of 46 M⊙/yr. Excluding the central sources, the resulting spectroscopic overdensity is thus 36 larger than the field environment, a ten-fold increase of the overdensity estimate compared to continuum observations. If we just interpret the central region, i.e., the protocluster core identified by the SCUBA-2 observations, the star-formation in this small 1 by 1 by 15 Mpc region is 980 M⊙/yr (i.e., H70.2 and .6). This is roughly a thousand times higher than expected from cosmic star-formation rate density arguments.
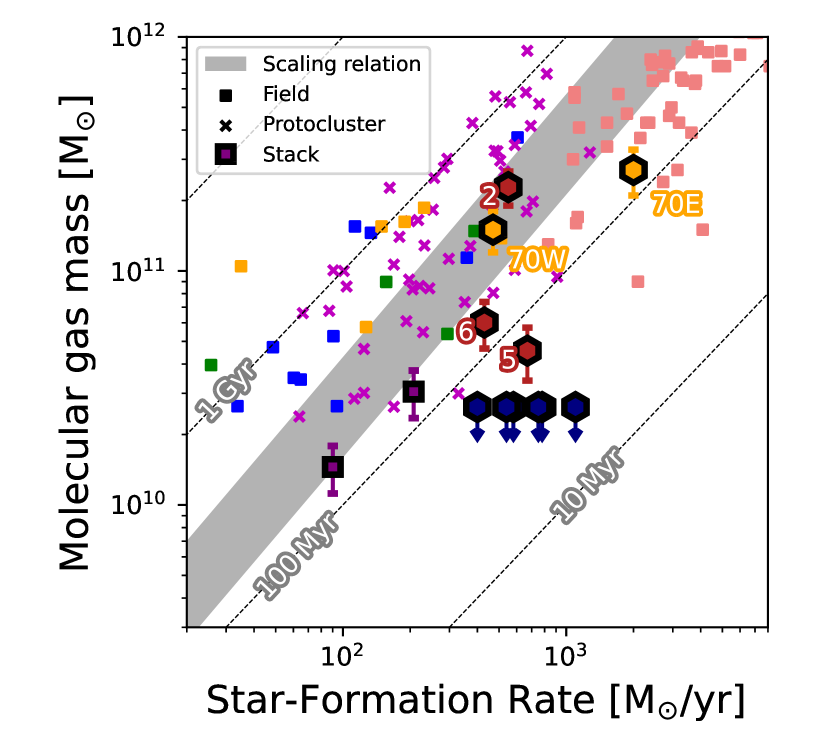
Figure 8 shows the molecular gas mass estimates for the NOEMA-observed sources as a function of their star-formation rate. These are compared to known field galaxies (Scoville et al., 2016), dusty star-forming galaxies (Bendo et al., 2023; Hagimoto et al., 2023), known protoclusters (Zavala et al., 2019; Pérez-Martínez et al., 2023) and stacking experiments from Planck-identified regions (Alberts et al., 2021). The HerBS-70E and -70W molecular gas masses are based on the direct CO(1–0) observations reported in Stanley et al. (2023). The molecular gas masses are derived from the CO(4–3) transition, which has intrinsic uncertainty in the conversion between CO(4–3) and the ground transition CO(1–0). We use the typical equations from Solomon & Vanden Bout (2005) to convert the CO(4–3) to the line luminosity, and use the CO(4–3) to CO(1–0) conversion ratio of from Harrington et al. (2021). In this paper, we assume the CO luminosity to molecular gas conversion factor of based on Dunne et al. (2021, 2022). For fair comparison, we correct all studies that use different (typically set to 0.8 ) to the value assumed in this study.
The scaling relation derived from the Scoville et al. (2016) sources, as well as the gas depletion timescales of distant galaxies (i.e., the available molecular gas divided by the star-formation rate) indicate that most of the sub-mm identified sources in the HerBS-70 system fall on the low end of the scaling relation with depletion times between 80 and 500 Myr. These observations seem to suggest that the protocluster system is rapidly processing its available gas, and could move towards a quenched cluster system in the Universe (Shimakawa et al., 2018).
This low depletion timescale is also reflected in a comparison to the cosmic molecular gas density. The combined gas mass in H70.2, .5 and .6 equals a total of 33 6 M⊙. Meanwhile, the cosmic molecular gas density estimate in Decarli et al. (2019) predicts M⊙/Mpc3. The gas density across the 735 Mpc3 volume surrounding the HerBS-70 environment probed by these observations is roughly only nine times higher than the average gas density in the Universe. Although CO(4–3) might not represent the total gas mass in the HerBS-70 system, this could point to a rapidly-quenching system at , in line with the evolutionary picture reported in Shimakawa et al. (2018), where clusters move from star-forming to quenched in the Universe as their gas reservoirs deplete.
4.2 Continuum overdensity estimates
The SCUBA-2 observations revealed twenty-one dusty sources in the vicinity of HerBS-70 (excluding the central source). Here, we analyse the continuum properties of the SCUBA-2 identified sources, and evaluate the overdensity hypothesis based on these continuum images and multi-wavelength continuum data. Although the spectroscopic observations are able to better verify the nature of these continuum sources, a thorough investigation of the continuum observations can provide context for subsequent sub-mm camera observations that have not yet had the luxury of spectroscopic follow-up.
4.2.1 Infrared photometric redshifts
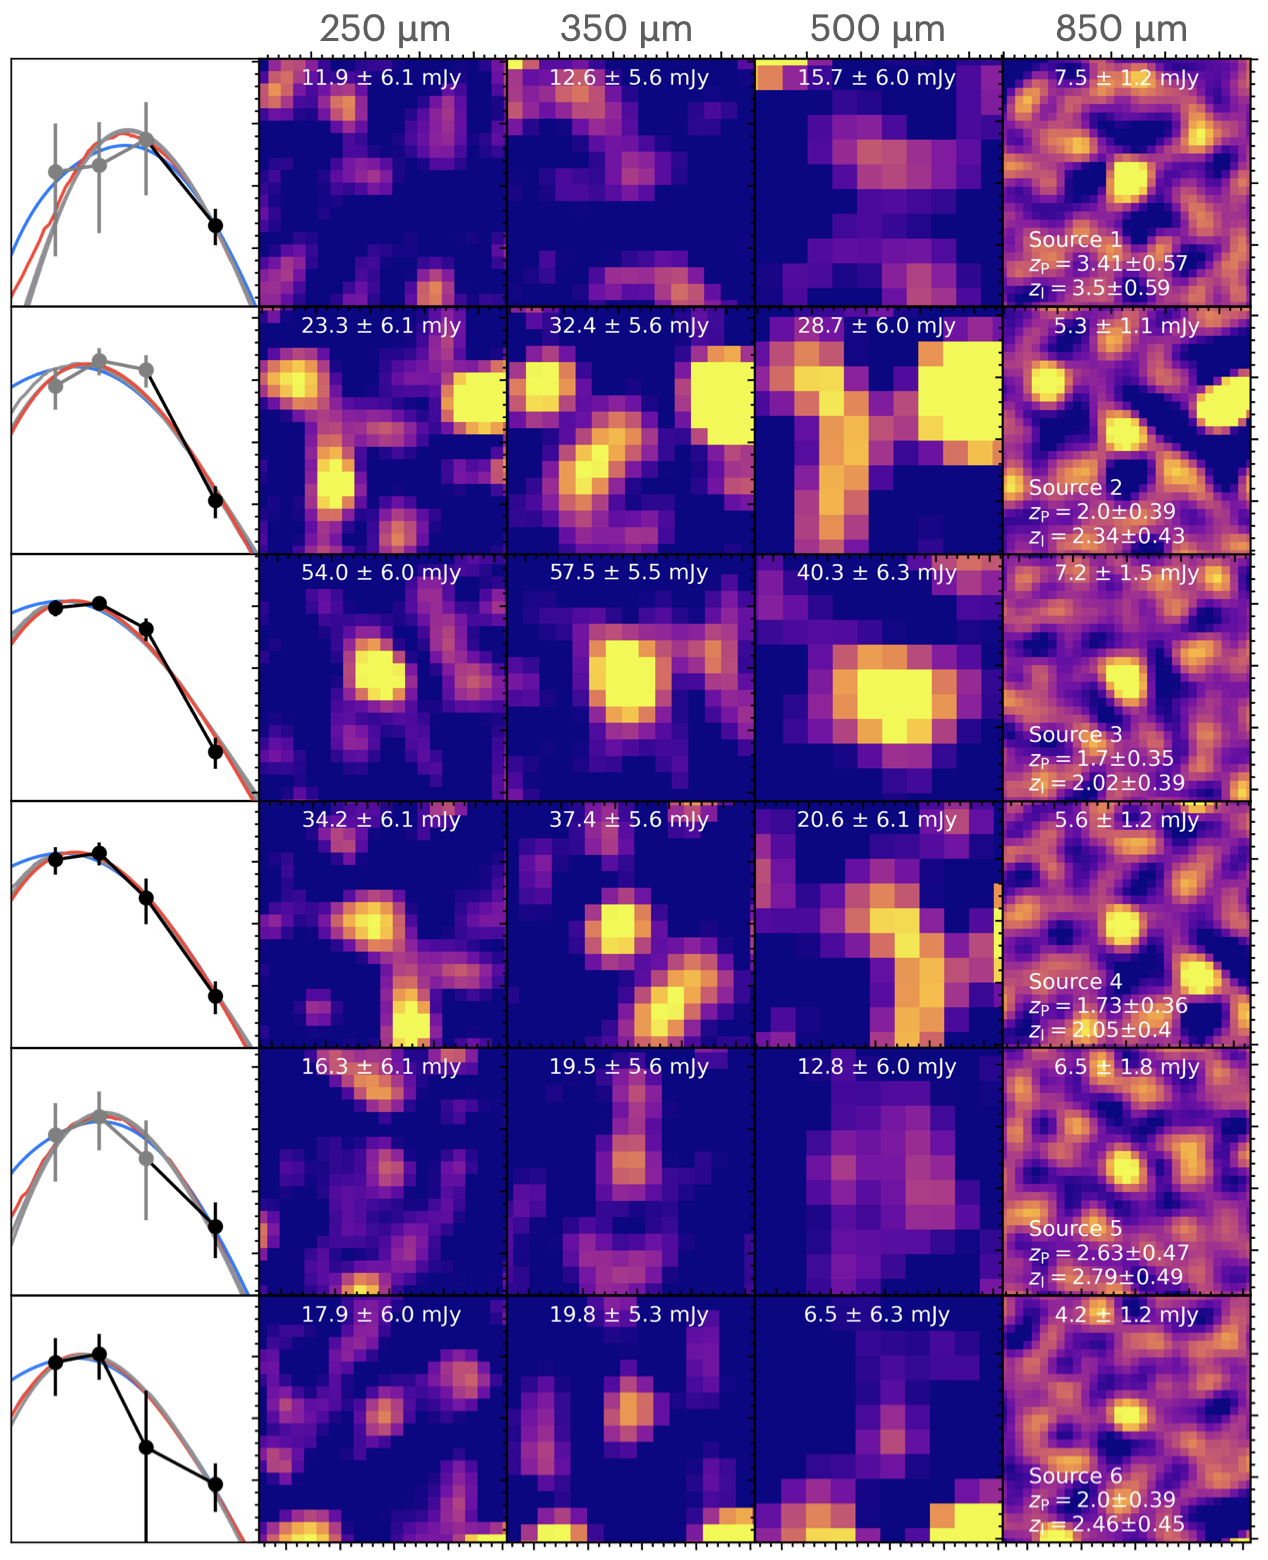
Eleven sources identified by SCUBA-2 (excluding HerBS-70E&W) have nearby Herschel galaxies within one JCMT beam identified through the HELP catalogue (Shirley et al., 2021). This Herschel catalogue is produced using source extraction from the 250, 350 and 500 µm maps, and thus includes sources that would have otherwise been too faint to be detected at 250 µm alone, which is standard for the other H-ATLAS catalogues (i.e., Valiante et al., 2016; Furlanetto et al., 2018). Interestingly, in addition to HerBS-70, only three of the six sources detected at at 850 µm have Herschel counterparts (with 5 Herschel detections at 250 µm for the 11 SCUBA-2 sources detected at ). As shown in Appendix A (Fig. 13), the reason for the lack of Herschel photometry is either due to nearby bright galaxies that affect the source extraction or because the relatively faint 250 µm flux densities at which the sources are extracted (Valiante et al., 2016), which can be expected for sources.
For those SCUBA-2 sources without any Herschel counterparts, we extract the SPIRE fluxes from the calibrated, background-subtracted images from the second data release of H-ATLAS (Smith et al., 2017)444https://www.h-atlas.org/public-data/download. We use the peak SCUBA-2 position, and extract the fluxes at 250, 350 and 500 µm directly from these maps. We use the map-based average noise estimates of 6.1, 5.6 and 6.0 mJy for 250, 350 and 500 µm, respectively. We note the possibility of a boosted 500 µm flux due to the bright [C ii] emission line at an observed wavelength of µm (Smail et al., 2011; Seymour et al., 2012; Dannerbauer et al., 2014). This effect would boost the photometric redshift estimates of the sources, although the expected deviation would depend on the inter-stellar medium properties of each galaxy, and are hard to quantify without dedicated observations (Burgarella et al., 2022).
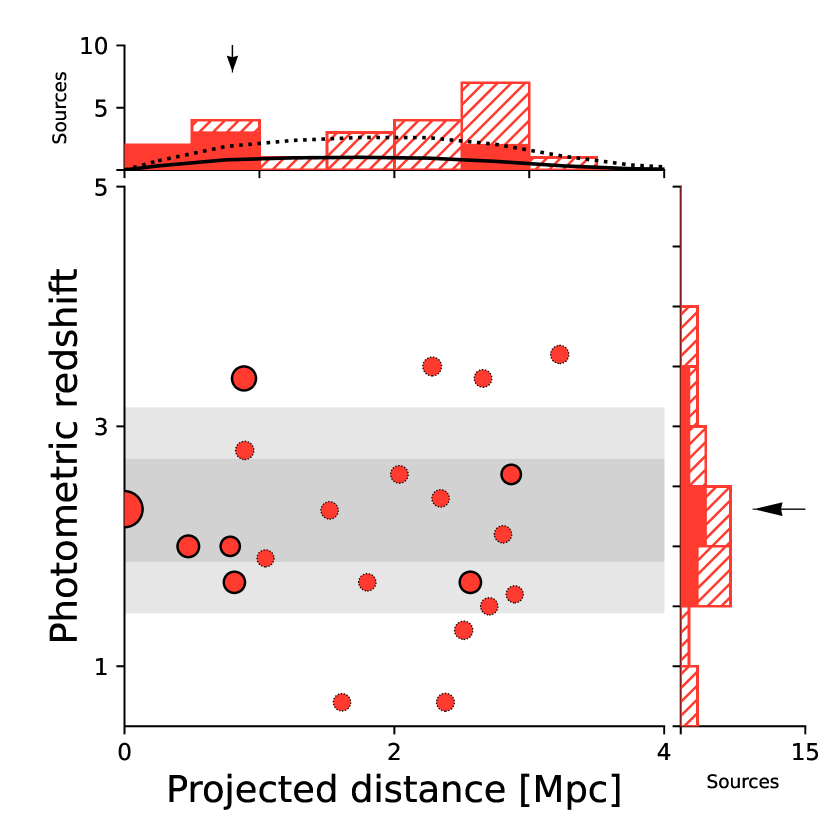
We fit the far-infrared fluxes from both the Herschel and SCUBA-2 photometry, using a two-temperature modified black-body from Pearson et al. (2013). This template is suitable, since it was derived from Herschel photometry for 40 galaxies at low- and high-redshift. Figure 9 shows the resulting redshift distribution for all 22 sources (incl. HerBS-70EW) identified by SCUBA-2 as a function of their projected distance to the central HerBS-70 position. The distribution of photometric redshift estimates lie around , which encompasses the spectroscopic redshift of HerBS-70 (, horizontal arrow). We note that this is not necessarily an indication of an overdensity, as the typical redshift distribution for Herschel- and SCUBA-2 extracted sources is around (Birkin et al., 2021). Previous studies have shown that the average uncertainty in a photometric redshift estimate is roughly (Pearson et al., 2013; Ivison et al., 2016; Bakx et al., 2018). As an extra check, we also compute the photometric redshifts using the method described in Ivison et al. (2016), and find broad agreement between the photometric redshift estimates. We show the fitted spectra and poststamps of the six sources in Appendix Figure 13.
While the photometric redshift distribution of SCUBA-2 sources is unable to identify an overdensity of sources, the projected distance between each SCUBA-2 source and HerBS-70 suggests a marginal overdensity. The top histogram in Figure 9 shows the distance distribution of sources, where the observed number of sources (filled and hatched for 5 and sources, resp.) lie substantially above the predicted number of sources (solid and dashed lines for 5 and sources, respectively). The predicted number of sources are calculated based on the number counts from Simpson et al. (2019). For each pixel in the noise map, we calculate the expected number of sources above and as a function of the radial distance. We indicate the expected size of the protocluster core ( Mpc; Chiang et al. 2017) with a vertical arrow. At the shorter distances, the number of sources is in noticeably above the expected number of sources. At longer distances, the number of sources appears to exceed the expected number of sources, although this could be inflated by the number of false positives.
4.2.2 Source counts
We calculate the number counts, , by counting the number of sources above a certain deboosted flux across the area, , in which they would be detected. We account for the non-flat noise profile, and calculate the area where we would be able to detect sources at a given flux above 3. We account for the false-positive (; contamination) and false-negative (; completeness) rates using
| (1) |
The noise estimates on the source counts are proportional to the square root of the number of sources contributing to the source count estimate, where the fluxes are accounted for Eddington boosting.
Figure 10 shows the source counts of the HerBS-70 SCUBA-2 observations against field surveys (Weiß et al., 2009; Casey et al., 2013; Geach et al., 2017; Simpson et al., 2019) and known protocluster systems (Dannerbauer et al., 2014; Lewis et al., 2018). The central source is masked similar to other studies (e.g., Lewis et al. 2018) and, thus the the deep observations provide secure estimates of the source counts from roughly 10 mJy down to mJy.
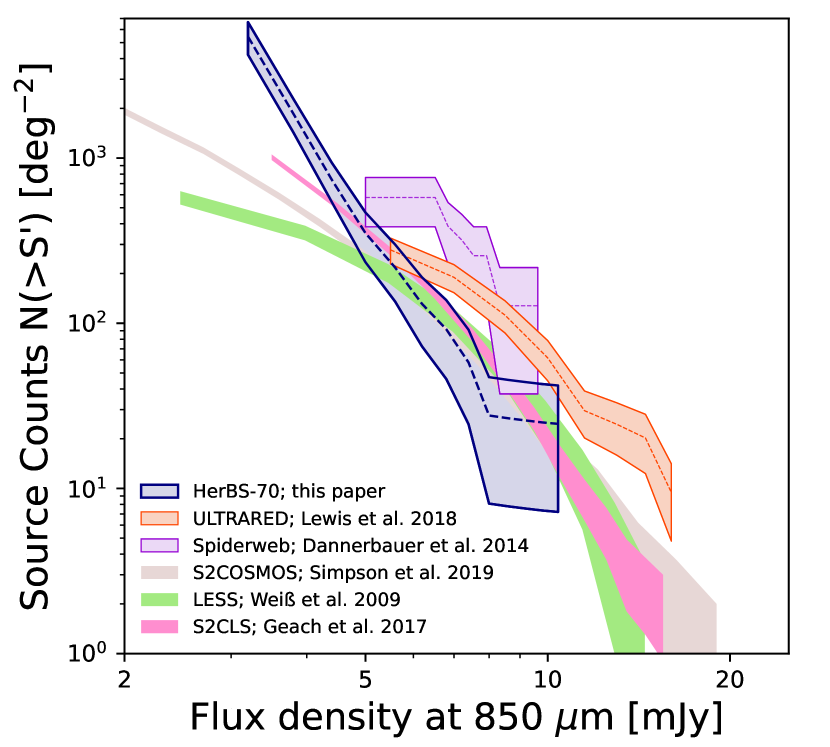
The source counts for the region around HerBS-70 are comparable with field galaxies over the majority of the flux density regime. The faint end of the source counts appears to diverge from all models, due to the deep observations and the shrinking area where our observations probe below 3 mJy. The bright end of the source counts is in line with the behaviour seen for moderately-overdense regions such as the ones seen in Lewis et al. (2018) and Lacaille et al. (2019), who also struggle to find evidence for overdensities in the source counts alone. While our analysis on particular regions in the SCUBA-2 map indicated strong overdensities (e.g., a factor of 2.9 seen in the centre of Figure 2; see Section 4.2.3), such details appear to be averaged out across the wider map as suggested by the source counts (c.f., Zhang et al., 2022).
4.2.3 An overdensity of continuum sources
As shown in the previous sub-sections, the photometric redshifts and source counts derived from the 850 µm continuum map together with additional continuum data do not indicate clear evidence for an overdensity in the wide Mpc-scale environment around HerBS-70. However, as shown in Figure 9, there is an indication of a source overdensity in the centre of the HerBS-70 field. We estimate the overdensity of sources close to HerBS-70 based on a direct comparison to the source counts from Geach et al. (2017), and we visualize that using blue contours in Figure 2. We generate these contours for galaxies detected above using a method that compares the expected number of sources against the actually-observed distribution of sources, smoothed by a kernel on the size of the typical protocluster core (Chiang et al., 2017).
We calculate the expected number of sources using the following method. We use the noise map to calculate the flux limit for each individual pixel, and use the source count model from Geach et al. (2017) to calculate the per-pixel expected number of sources (a value much smaller than 1). These are the ‘expected background’ against which we observe the true detected sources. Since these are the ‘expected’ number of sources, we reflect them as negative values, and for each source identified above , we replace the index by a value with a 1 (since one source was actually observed at this single pixel). Note that we exclude the central source HerBS-70EW from this calculation. We then smooth the resulting image down to the scale of a typical overdensity (here we take a Gaussian kernel with a characteristic width, , of 1 arcminute (500 kpc), or a full-width at half-maximum of 1.2 Mpc, roughly matching the expected size of a protocluster core at (Chiang et al., 2013). As seen in Figure 2, the central region appears to be overdense by a factor of .
This region features three sources on top of the HerBS-70 system, and as shown in previous research (Lacaille et al., 2019), these low-number statistics result in a high uncertainty on the bias. We estimate the uncertainty in the bias by repeatedly re-drawing from our sample, and calculating the bias value within 1 Mpc of HerBS-70. The resulting bias is . We compare this estimate against known bright sources from fields without obvious sub-mm overdensities. This is important, since sub-mm galaxies are known to cluster together, even if they are not associated to a protocluster system. In this case, we use the UDS field from the COSMOS Legacy Survey (Geach et al., 2017) as a comparison field, similar to previous protocluster studies (Lacaille et al., 2019). We examine the spatial distribution of sources () in the 50 arcminute diameter UDS field by redrawing this selection, and calculate the observed bias in the environment around a randomly-chosen source. This central source is subsequently masked – same as with our HerBS-70EW analysis – and the peak bias within 1 Mpc is then evaluated. The average bias is . As a sanity check, we find that the average bias across the entire 50 arcminute diameter UDS field is . The mean of zero is reasonable555Note that the uncertainty is not the uncertainty on the mean, but instead the field-to-field variation., since we derived the expected number of sources from the Geach et al. (2017) source counts. Similarly, the fact that the typical bias is around 1 is in line with two-point correlation studies for sub-mm sources, which find a typical spatial association of (Amvrosiadis et al., 2019). If we directly compare a random draw of the UDS against a resampled HerBS-70 field, we find a higher bias in HerBS-70 for 90 per cent of all draws. Similar to the relatively poor statistics of previous continuum camera studies (e.g., Lewis et al. 2018), we find a tentative indication for a HerBS-70 overdensity, however note that a selection effect (i.e., spatial clustering of bright sub-mm sources) cannot be ruled out on continuum data alone (e.g., Chen et al. 2023).
Evaluating the bias of HerBS-70, particularly the inner 1 Mpc shows a strong overdensity relative to the field (Simpson et al., 2019), as seen in Figures 2 and 9. This suggests that at some of the detected galaxies could be true protocluster core members. The overdensity bias changes with the size of the smoothing kernel, with tests at smaller and larger kernels resulting in smaller biases. This agrees with the distribution of the projected distances, which also suggests that the potential HerBS-70 system would be Mpc in size, and lines up with models and past observations. For example, Chiang et al. (2017) show that while protoclusters collapse to form dense environments with cosmic time, the cores of protoclusters grow in size. Studies at higher redshift (e.g., Oteo et al. 2018; Long et al. 2020; Remus et al. 2022 at ) that find smaller protocluster cores on the order of kpc, while environments at the peak of cosmic star-formation (Madau & Dickinson, 2014) extend over larger areas, similar to the Mpc size suggested by our experiment, and the 0.8 Mpc size predicted by Chiang et al. (2017) at .
4.2.4 The large-scale environment around HerBS-70
In an effort to explore the larger-area surroundings of HerBS-70 where most of the protocluster environment should be located (Chiang et al., 2017), we compare against the catalogue of WISE sources666https://wise2.ipac.caltech.edu/docs/release/allsky/expsup/sec1_4b.html from the WISE All-Sky catalogue (Wright et al., 2010; Cutri & et al., 2012) with 30 arcmin around HerBS-70, and compare the positions against data from the recent LOFAR release (van Haarlem et al., 2013; Shimwell et al., 2022). The WISE sources will likely be sensitive to ordinary, massive galaxies at lower redshifts, while the 150 MHz LOFAR data is sensitive to radio-bright galaxies and quasars.777The LOFAR maps are produced following the method described in Sweijen et al. (2022), using the image archive at https://lofar-surveys.org/dr1_release.html. The LOFAR sensitivity is better than 0.1 mJy/beam at arcsec resolution. The blue points in Figure 11 mark galaxies and quasars within for photometric redshifts (small points) and 0.05 for spectroscopic redshifts (large points, equivalent to km/s). A bright source to the east of HerBS-70 has been masked out, although some radially-extending artefacts still remain in the image that could affect sources in the eastern side of the SCUBA-2 map. Sources outside of these redshift windows are shown in light orange. Five quasars with known spectroscopic redshifts (Berger & Fringant, 1977; Richards et al., 2009, 2015; Pâris et al., 2018) are seen out to projected distances of Mpc from HerBS-70, which is around the expected size of an overdensity based on both -body simulations and semi-analytical models at , as discussed in Chiang et al. (2017). Currently, not enough information is available on these quasars to identify an overdensity, however follow-up of these sources might help identify the large-scale environment around the HerBS-70 system. These bright sources at larger separation could further help identify additional evolutionary pathways of quenching of star-formation, as a widespread triggering of AGN is not uncommon for protocluster environments (e.g., Casey, 2016).
4.3 Cosmological evolution of the HerBS-70 halo
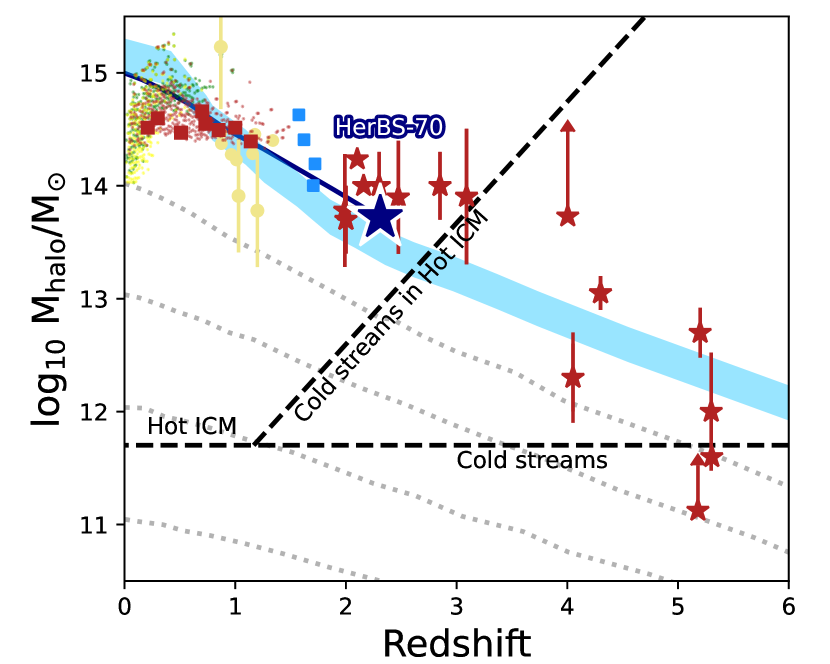
Figure 12 shows the evolutionary pathway of the HerBS-70 system compared to known clusters and protoclusters and evolutionary models. High redshift cluster mass estimates offer a cursory glimpse at the potential evolutionary track of systems in the early Universe, although they are dependent on multiple assumptions and scaling relations, which results in near-order of magnitude uncertainties in the halo mass estimates. In this case, we use the conservative limits of the scaling relations, in order to not over-estimate the cluster mass, although future observations should focus on improving the robustness of these estimates through spectroscopic confirmation of the members of the HerBS-70 system.
We derive the halo mass of HerBS-70 from the dust mass estimates for sources in the protocluster core (i.e., HerBS-70E & W, and sources H70.2 and H70.6), since the SCUBA-2 observations are sensitive to the most dusty, star-forming galaxies. We focus on just the central core, since our SCUBA-2 observations have provided the best constraints on the protocluster core, and the statistics of the overdensity are averaged out towards larger scales. The combined dust masses of all sources identified in Table 2 add to M⊙. We then assume a gas-to-dust ratio of 100 to acquire a total gas mass estimate (Hagimoto et al., 2023).888This approach is in line with the sum of the gas mass found in Section 4.1, and should better account for the total gas mass instead of just the molecular gas mass. Particularly, this value has a moderate evolution with redshift (see Péroux & Howk 2020 for a discussion) and represents solar metallicity systems (Pantoni et al., 2019; De Looze et al., 2020; Graziani et al., 2020; Millard et al., 2020), which could be a relatively good tracer of even the high-redshift Universe (Vijayan et al., 2019; Litke et al., 2022; Popping & Péroux, 2022). Cluster evolution models (Chiang et al., 2013) suggest that 30 per cent of the mass of the cluster is contained within the inner 0.8 Mpc, and we assume a fixed baryonic-to-dark matter fraction of 5 per cent (Behroozi & Silk, 2018). Based on these assumptions, the estimated total cluster mass is M⊙.
The evolution models from McBride et al. (2009) and Fakhouri & Ma (2010) predict a future halo mass in excess of 1015 M⊙. Although the models are derived for different halo masses, the evolution between them is only minor, and we thus feel comfortable to scale the most massive model to the estimated halo mass of M⊙ at . The halo mass is on par with massive local passive galaxy clusters such as the 1015 M⊙ Virgo cluster (Fouqué et al., 2001), and the HerBS-70 system might thus represent the central quenching phase in one of the most massive galaxy clusters in the Universe. Here we do well to stress that direct extrapolations of the cluster masses from dust and gas-mass estimates is prone to large errors in the final mass estimate, as well as depends on ad-hoc assumptions on the content of dusty galaxies in protoclusters. Future work could better estimate the halo mass using complementary methods, such as the abundance matching technique discussed in Long et al. (2020); Calvi et al. (2021) that requires deep optical imaging, as well as better comparison to models of cosmological overdensities (e.g., Chiang et al., 2017).
This short expected lifetime ( Myr) is consistent with the hierarchical picture of massive galaxy formation (Hopkins et al., 2008), which might be further exacerbated by the internal AGN (e.g., Ito et al. 2022; Mountrichas et al. 2022). The sudden lack of gas feeding from the environment (e.g., Shimakawa et al. 2018 for an evolutionary picture) suggests the future evolution of the central HerBS-70 source is likely to lead to a massive red-and-dead giant elliptical galaxy by (Toft et al., 2014; Ikarashi et al., 2015; Simpson et al., 2017; Stach et al., 2017). The findings reported in this paper add to the growing evidence towards this hierarchical pathway of DSFGs to quenched elliptical galaxies given the high stellar masses (Hainline et al., 2011; Aravena et al., 2016b), high specific star-formation rates (Straatman et al., 2014; Spilker et al., 2016; Glazebrook et al., 2017; Schreiber et al., 2018; Merlin et al., 2019) and location in an overdense region (Blain et al., 2004; Weiß et al., 2009; Hickox et al., 2012).
4.4 Finding protoclusters among multiple-DSFG systems
Large area surveys such as the ones done with the Atacama Cosmology Telescope, Herschel, Planck, and the South Pole Telescope are able to select the apparently-brightest DSFGs in the sky. Because the bright end of the luminosity function is steep, instead of finding the intrinsically-brightest galaxies, these surveys have found large numbers of gravitationally-lensed (Treu, 2010), less luminous galaxies (Negrello et al., 2010, 2017; Bussmann et al., 2013, 2015; Vieira et al., 2013; Spilker et al., 2016).
As surveys move towards lower-brightness sources, the fraction of unlensed sources increases (Cai et al., 2013; Bussmann et al., 2015; Bakx et al., 2020a, 2024). Follow-up observations with mm/submm interferometers (NOEMA and ALMA) have resolved these DSFGs revealing, in a few cases, multiple sources at the same redshift (Hodge et al., 2013; Karim et al., 2013; Zavala et al., 2015; Scudder et al., 2016; Oteo et al., 2018; Neri et al., 2020). However, such systems remain rare with, for instance, two binary systems found in 13 sources studied in Neri et al. (2020) – including HerBS-70 – and 8 out of 62 in the spectroscopic survey by Urquhart et al. (2022), i.e., 15 and 13 per cent, respectively (see also Gómez-Guijarro et al. 2019). Multiple systems at high-redshift are prime targets to identify dusty protoclusters and recent surveys such as -GAL (Cox et al., 2023) have doubled the numbers of high- sources displaying genuine multiplicity, beyond what is expected from field galaxies (Bakx et al. in prep.). Here we note that identifying and studying groups of sources at is of crucial importance to test the Lambda-CDM paradigm (Harrison & Hotchkiss, 2013).
As shown in this study, the case of HerBS-70 at presents a clear case of multiplicity with an overdensity of submm sources. This indicates that this binary system, identified with NOEMA, lies at the core of a massive protocluster. The likely quenching ongoing in the central source HerBS-70E could further be studied by, for example, absorption line studies, that are able to probe the gas cycle (Spilker et al., 2018, 2020a, 2020b; Berta et al., 2021; Butler et al., 2021), and differentiate between the effect of the AGN and star-formation feedback. Finally, at , this source is an excellent target for narrow-band observations that aim for H emission using near-infrared facilities (e.g., Subaru, VLT, Keck and Gemini; Kurk et al. 2000; Koyama et al. 2013, 2021). These could also measure independently the redshifts of the bright sub-mm sources, and provide several tens of fainter protocluster components that are missed in current submm imaging surveys.
5 Conclusions
We have presented i. the 850 µm SCUBA-2 imaging of the field around HerBS-70, a binary system of bright dusty star-forming galaxies at , and ii. subsequent NOEMA observations of the nine brightest SCUBA-2 targets surrounding HerBS-70 aimed to test the protocluster hypothesis. Three of these nine targeted SCUBA-2 sources were found to be at the same redshift as HerBS-70, and the remaining six are excluded from the protocluster environment. These observations, and existing multi-wavelength data, allow us to conclude the following:
-
HerBS-70 is located at the centre of a candidate protocluster core ( Mpc) with a volume density times higher than field galaxies, based on NOEMA spectroscopic observations. These observations targeted the brightest nine continuum galaxies in the HerBS-70 environment with a surface density estimates higher than field galaxies based on the SCUBA-2 sub-mm continuum map.
-
Meanwhile, the continuum overdensity estimates based on number counts and across the wider continuum map do not provide evidence towards the overdensity hypothesis, indicating the limits of continuum observations in identifying overdensities.
-
The depletion timescales of HerBS-70E, 70W, H70.2, H70.5 and H70.6 are around 500 to 100 Myr, indicating there is rapid gas depletion, which will likely result in the rapid quenching of the environment.
-
Forward-modeling of the dust-based halo mass estimate ( M⊙) suggests a present-day halo mass of M⊙, in excess of the local, massive Virgo cluster, although we note that this method is prone to biases and large errors.
The SCUBA-2 map and subsequent NOEMA follow-up have revealed and verified an overdensity of dusty sources around HerBS-70. The redshift of this source makes it an excellent candidate for H narrow-band follow-up (e.g., Koyama et al., 2021), in order to reveal the more numerous, but less dusty components of the HerBS-70 system. Increasing the number of protocluster components can then provide insights into the structure and properties of more normal galaxies within the HerBS-70 system.
The advent of large spectroscopic samples of DSFGs (including sizeable numbers of multiple sources) further entice similar submm camera studies, particularly in light of the production of improved mm/submm cameras, such as NIKA2 (Catalano et al., 2018), TolTEC (Wilson et al., 2020), and SCUBA-3999https://www.eaobservatory.org//jcmt/wp-content/uploads/sites/2/2019/10/Guide-to-the-new-850um-MKID-camera-performance.pdf. Such observational studies will enable to better constrain and understand the properties and evolution of protoclusters and in the early Universe, in particular at the peak of cosmic evolution.
Acknowledgements
The authors kindly thank the anonymous referee for their comprehensive comments that significantly improved the scientific scope of this manuscript. TB, MH and YT acknowledge funding from NAOJ ALMA Scientific Research Grant Numbers 2018-09B and JSPS KAKENHI No. 17H06130, 22H04939, and 22J21948. The James Clerk Maxwell Telescope is operated by the East Asian Observatory on behalf of The National Astronomical Observatory of Japan; Academia Sinica Institute of Astronomy and Astrophysics; the Korea Astronomy and Space Science Institute; the National Astronomical Research Institute of Thailand; Center for Astronomical Mega-Science (as well as the National Key R&D Program of China with No. 2017YFA0402700). Additional funding support is provided by the Science and Technology Facilities Council of the United Kingdom and participating universities and organizations in the United Kingdom and Canada. Additional funds for the construction of SCUBA-2 were provided by the Canada Foundation for Innovation. SS was partly supported by the ESCAPE project; ESCAPE – The European Science Cluster of Astronomy and Particle Physics ESFRI Research Infrastructures has received funding from the European Union’s Horizon 2020 research and innovation programme under Grant Agreement No. 824064. SS also thanks the Science and Technology Facilities Council for financial support under grant ST/P000584/1. SU would like to thank the Open University School of Physical Sciences for supporting this work. HD acknowledges financial support from the Agencia Estatal de Investigación del Ministerio de Ciencia e Innovación (AEI-MCINN) under grant (La evolución de los cíumulos de galaxias desde el amanecer hasta el mediodía cósmico) with reference (PID2019-105776GB-I00/DOI:10.13039/501100011033) and acknowledge support from the ACIISI, Consejería de Economía, Conocimiento y Empleo del Gobierno de Canarias and the European Regional Development Fund (ERDF) under grant with reference PROID2020010107. This work benefited from the support of the project Z-GAL ANR-AAPG2019 of the French National Research Agency (ANR). LOFAR data products were provided by the LOFAR Surveys Key Science project (LSKSP; https://lofar-surveys.org/) and were derived from observations with the International LOFAR Telescope (ILT). LOFAR (van Haarlem et al., 2013) is the Low Frequency Array designed and constructed by ASTRON. It has observing, data processing, and data storage facilities in several countries, which are owned by various parties (each with their own funding sources), and which are collectively operated by the ILT foundation under a joint scientific policy. The efforts of the LSKSP have benefited from funding from the European Research Council, NOVA, NWO, CNRS-INSU, the SURF Co-operative, the UK Science and Technology Funding Council and the Jülich Supercomputing Centre. A.N. acknowledges support from the Narodowe Centrum Nauki (NCN), Poland, through the SONATA BIS grant UMO- 2020/38/E/ST9/00077.
Data Availability
The data underlying this article will be shared on reasonable request to the corresponding author.
References
- Alberts et al. (2021) Alberts S., et al., 2021, MNRAS, 501, 1970
- Algera et al. (2023) Algera H. S. B., et al., 2023, MNRAS, 518, 6142
- Amvrosiadis et al. (2019) Amvrosiadis A., et al., 2019, MNRAS, 483, 4649
- Aravena et al. (2010) Aravena M., Younger J. D., Fazio G. G., Gurwell M., Espada D., Bertoldi F., Capak P., Wilner D., 2010, ApJ, 719, L15
- Aravena et al. (2016a) Aravena M., et al., 2016a, MNRAS, 457, 4406
- Aravena et al. (2016b) Aravena M., et al., 2016b, ApJ, 833, 68
- Bañados et al. (2013) Bañados E., Venemans B., Walter F., Kurk J., Overzier R., Ouchi M., 2013, ApJ, 773, 178
- Bakx et al. (2018) Bakx T. J. L. C., et al., 2018, MNRAS, 473, 1751
- Bakx et al. (2020a) Bakx T. J. L. C., Eales S., Amvrosiadis A., 2020a, MNRAS, 493, 4276
- Bakx et al. (2020b) Bakx T. J. L. C., et al., 2020b, MNRAS, 494, 10
- Bakx et al. (2020c) Bakx T. J. L. C., et al., 2020c, MNRAS, 496, 2372
- Bakx et al. (2024) Bakx T. J. L. C., Gray B. S., González-Nuevo J., Bonavera L., Amvrosiadis A., Eales S., Hagimoto M., Serjeant S., 2024, MNRAS, 527, 8865
- Banerji et al. (2011) Banerji M., Chapman S. C., Smail I., Alaghband-Zadeh S., Swinbank A. M., Dunlop J. S., Ivison R. J., Blain A. W., 2011, MNRAS, 418, 1071
- Behroozi & Silk (2018) Behroozi P., Silk J., 2018, MNRAS, 477, 5382
- Bendo et al. (2023) Bendo G. J., et al., 2023, MNRAS, 522, 2995
- Berger & Fringant (1977) Berger J., Fringant A. M., 1977, A&AS, 28, 123
- Berta et al. (2013) Berta S., et al., 2013, A&A, 551, A100
- Berta et al. (2021) Berta S., et al., 2021, A&A, 646, A122
- Berta et al. (2023) Berta S., et al., 2023, A&A, 678, A28
- Biffi et al. (2018) Biffi V., Planelles S., Borgani S., Rasia E., Murante G., Fabjan D., Gaspari M., 2018, MNRAS, 476, 2689
- Birkin et al. (2021) Birkin J. E., et al., 2021, MNRAS, 501, 3926
- Blain (1999) Blain A. W., 1999, MNRAS, 309, 955
- Blain et al. (2002) Blain A. W., Smail I., Ivison R. J., Kneib J. P., Frayer D. T., 2002, Phys. Rep., 369, 111
- Blain et al. (2004) Blain A. W., Chapman S. C., Smail I., Ivison R., 2004, ApJ, 611, 725
- Bleem et al. (2015) Bleem L. E., et al., 2015, ApJS, 216, 27
- Borys et al. (2003) Borys C., Chapman S., Halpern M., Scott D., 2003, MNRAS, 344, 385
- Bruzual & Charlot (2003) Bruzual G., Charlot S., 2003, MNRAS, 344, 1000
- Burgarella et al. (2022) Burgarella D., et al., 2022, arXiv e-prints, p. arXiv:2211.05744
- Bussmann et al. (2013) Bussmann R. S., et al., 2013, ApJ, 779, 25
- Bussmann et al. (2015) Bussmann R. S., et al., 2015, ApJ, 812, 43
- Butler et al. (2021) Butler K. M., et al., 2021, ApJ, 919, 5
- Cañameras et al. (2018) Cañameras R., et al., 2018, A&A, 620, A61
- Cai et al. (2013) Cai Z.-Y., et al., 2013, ApJ, 768, 21
- Calvi et al. (2021) Calvi R., Dannerbauer H., Arrabal Haro P., Rodríguez Espinosa J. M., Muñoz-Tuñón C., Pérez González P. G., Geier S., 2021, MNRAS, 502, 4558
- Capak et al. (2011) Capak P. L., et al., 2011, Nature, 470, 233
- Casey (2016) Casey C. M., 2016, ApJ, 824, 36
- Casey et al. (2013) Casey C. M., et al., 2013, MNRAS, 436, 1919
- Casey et al. (2014) Casey C. M., Narayanan D., Cooray A., 2014, Phys. Rep., 541, 45
- Casey et al. (2015) Casey C. M., et al., 2015, ApJ, 808, L33
- Castignani et al. (2020) Castignani G., et al., 2020, A&A, 640, A64
- Catalano et al. (2018) Catalano A., et al., 2018, Journal of Low Temperature Physics, 193, 916
- Chabrier (2003) Chabrier G., 2003, PASP, 115, 763
- Champagne et al. (2018) Champagne J. B., et al., 2018, ApJ, 867, 153
- Chapin et al. (2013) Chapin E. L., Berry D. S., Gibb A. G., Jenness T., Scott D., Tilanus R. P. J., Economou F., Holland W. S., 2013, MNRAS, 430, 2545
- Chapman et al. (2009) Chapman S. C., Blain A., Ibata R., Ivison R. J., Smail I., Morrison G., 2009, ApJ, 691, 560
- Chen et al. (2023) Chen J., et al., 2023, A&A, 675, L10
- Chiang et al. (2013) Chiang Y.-K., Overzier R., Gebhardt K., 2013, ApJ, 779, 127
- Chiang et al. (2015) Chiang Y.-K., et al., 2015, ApJ, 808, 37
- Chiang et al. (2017) Chiang Y.-K., Overzier R. A., Gebhardt K., Henriques B., 2017, ApJ, 844, L23
- Contini et al. (2016) Contini E., De Lucia G., Hatch N., Borgani S., Kang X., 2016, MNRAS, 456, 1924
- Coppin et al. (2006) Coppin K., et al., 2006, MNRAS, 372, 1621
- Cowie et al. (2002) Cowie L. L., Barger A. J., Kneib J. P., 2002, AJ, 123, 2197
- Cox et al. (2023) Cox P., et al., 2023, A&A, 678, A26
- Cutri & et al. (2012) Cutri R. M., et al. 2012, VizieR Online Data Catalog, p. II/311
- Daddi et al. (2009) Daddi E., et al., 2009, ApJ, 694, 1517
- Dannerbauer et al. (2014) Dannerbauer H., et al., 2014, A&A, 570, A55
- De Breuck et al. (2004) De Breuck C., et al., 2004, A&A, 424, 1
- De Looze et al. (2020) De Looze I., et al., 2020, MNRAS, 496, 3668
- Decarli et al. (2019) Decarli R., et al., 2019, ApJ, 882, 138
- Dekel & Birnboim (2006) Dekel A., Birnboim Y., 2006, MNRAS, 368, 2
- Delhaize et al. (2017) Delhaize J., et al., 2017, A&A, 602, A4
- Dempsey et al. (2013) Dempsey J. T., et al., 2013, MNRAS, 430, 2534
- Di Mascolo et al. (2021) Di Mascolo L., et al., 2021, A&A, 650, A153
- Diener et al. (2015) Diener C., et al., 2015, ApJ, 802, 31
- Draine (2003) Draine B. T., 2003, ARA&A, 41, 241
- Draine & Li (2007) Draine B. T., Li A., 2007, ApJ, 657, 810
- Dressler (1980) Dressler A., 1980, ApJ, 236, 351
- Dunne et al. (2021) Dunne L., Maddox S. J., Vlahakis C., Gomez H. L., 2021, MNRAS, 501, 2573
- Dunne et al. (2022) Dunne L., Maddox S. J., Papadopoulos P. P., Ivison R. J., Gomez H. L., 2022, MNRAS, 517, 962
- Eales et al. (2000) Eales S., Lilly S., Webb T., Dunne L., Gear W., Clements D., Yun M., 2000, AJ, 120, 2244
- Eales et al. (2010) Eales S., et al., 2010, PASP, 122, 499
- Emonts et al. (2016) Emonts B. H. C., et al., 2016, Science, 354, 1128
- Emonts et al. (2018) Emonts B. H. C., et al., 2018, MNRAS, 477, L60
- Fakhouri & Ma (2010) Fakhouri O., Ma C.-P., 2010, MNRAS, 401, 2245
- Feltre et al. (2012) Feltre A., Hatziminaoglou E., Fritz J., Franceschini A., 2012, MNRAS, 426, 120
- Feltre et al. (2013) Feltre A., et al., 2013, MNRAS, 434, 2426
- Finner et al. (2020) Finner K., James Jee M., Webb T., Wilson G., Perlmutter S., Muzzin A., Hlavacek-Larrondo J., 2020, ApJ, 893, 10
- Fouqué et al. (2001) Fouqué P., Solanes J. M., Sanchis T., Balkowski C., 2001, A&A, 375, 770
- Fritz et al. (2006) Fritz J., Franceschini A., Hatziminaoglou E., 2006, MNRAS, 366, 767
- Furlanetto et al. (2018) Furlanetto C., et al., 2018, MNRAS, 476, 961
- Galametz et al. (2013) Galametz A., et al., 2013, A&A, 559, A2
- García-Vergara et al. (2022) García-Vergara C., et al., 2022, ApJ, 927, 65
- Geach et al. (2017) Geach J. E., et al., 2017, MNRAS, 465, 1789
- Glazebrook et al. (2017) Glazebrook K., et al., 2017, Nature, 544, 71
- Gobat et al. (2018) Gobat R., et al., 2018, Nature Astronomy, 2, 239
- Gobat et al. (2020) Gobat R., Magdis G., D’Eugenio C., Valentino F., 2020, A&A, 644, L7
- Gómez-Guijarro et al. (2019) Gómez-Guijarro C., et al., 2019, ApJ, 872, 117
- Goto et al. (2017) Goto T., Utsumi Y., Kikuta S., Miyazaki S., Shiki K., Hashimoto T., 2017, MNRAS, 470, L117
- Graziani et al. (2020) Graziani L., Schneider R., Ginolfi M., Hunt L. K., Maio U., Glatzle M., Ciardi B., 2020, MNRAS, 494, 1071
- Guaita et al. (2022) Guaita L., et al., 2022, arXiv e-prints, p. arXiv:2202.03883
- Hagimoto et al. (2023) Hagimoto M., et al., 2023, MNRAS, 521, 5508
- Hainline et al. (2011) Hainline L. J., Blain A. W., Smail I., Alexander D. M., Armus L., Chapman S. C., Ivison R. J., 2011, ApJ, 740, 96
- Harrington et al. (2021) Harrington K. C., et al., 2021, ApJ, 908, 95
- Harrison & Hotchkiss (2013) Harrison I., Hotchkiss S., 2013, Journal of Cosmology and Astroparticle Physics, 2013, 022
- Hatch et al. (2011) Hatch N. A., Kurk J. D., Pentericci L., Venemans B. P., Kuiper E., Miley G. K., Röttgering H. J. A., 2011, MNRAS, 415, 2993
- Hickox et al. (2012) Hickox R. C., et al., 2012, MNRAS, 421, 284
- Hill et al. (2020) Hill R., et al., 2020, MNRAS, 495, 3124
- Hlavacek-Larrondo et al. (2020) Hlavacek-Larrondo J., et al., 2020, ApJ, 898, L50
- Hodge & da Cunha (2020) Hodge J. A., da Cunha E., 2020, Royal Society Open Science, 7, 200556
- Hodge et al. (2013) Hodge J. A., Carilli C. L., Walter F., Daddi E., Riechers D., 2013, ApJ, 776, 22
- Holland et al. (2013) Holland W. S., et al., 2013, MNRAS, 430, 2513
- Holland et al. (2017) Holland W. S., et al., 2017, MNRAS, 470, 3606
- Hopkins et al. (2008) Hopkins P. F., Hernquist L., Cox T. J., Kereš D., 2008, ApJS, 175, 356
- Ikarashi et al. (2015) Ikarashi S., et al., 2015, ApJ, 810, 133
- Ismail et al. (2023) Ismail D., et al., 2023, A&A, 678, A27
- Ito et al. (2022) Ito K., et al., 2022, ApJ, 929, 53
- Ivison et al. (2000) Ivison R. J., Dunlop J. S., Smail I., Dey A., Liu M. C., Graham J. R., 2000, ApJ, 542, 27
- Ivison et al. (2016) Ivison R. J., et al., 2016, ApJ, 832, 78
- Karim et al. (2013) Karim A., et al., 2013, MNRAS, 432, 2
- Kennicutt (1998) Kennicutt Robert C. J., 1998, ARA&A, 36, 189
- Kikuta et al. (2017) Kikuta S., Imanishi M., Matsuoka Y., Matsuda Y., Shimasaku K., Nakata F., 2017, ApJ, 841, 128
- Kikuta et al. (2019) Kikuta S., et al., 2019, PASJ, 71, L2
- Kim et al. (2009) Kim S., et al., 2009, ApJ, 695, 809
- Koyama et al. (2013) Koyama Y., Kodama T., Tadaki K.-i., Hayashi M., Tanaka M., Smail I., Tanaka I., Kurk J., 2013, MNRAS, 428, 1551
- Koyama et al. (2021) Koyama Y., et al., 2021, MNRAS, 503, L1
- Kubo et al. (2019) Kubo M., et al., 2019, ApJ, 887, 214
- Kuiper et al. (2011) Kuiper E., et al., 2011, MNRAS, 415, 2245
- Kurk et al. (2000) Kurk J. D., et al., 2000, A&A, 358, L1
- Lacaille et al. (2019) Lacaille K. M., et al., 2019, MNRAS, 488, 1790
- Lee et al. (2021) Lee M. M., Tanaka I., Iono D., Kawabe R., Kodama T., Kohno K., Saito T., Tamura Y., 2021, ApJ, 909, 181
- Lehmer et al. (2009) Lehmer B. D., et al., 2009, MNRAS, 400, 299
- Lewis et al. (2018) Lewis A. J. R., et al., 2018, ApJ, 862, 96
- Litke et al. (2022) Litke K. C., et al., 2022, arXiv e-prints, p. arXiv:2202.12470
- Long et al. (2020) Long A. S., et al., 2020, ApJ, 898, 133
- Looser et al. (2023) Looser T. J., et al., 2023, arXiv e-prints, p. arXiv:2302.14155
- Madau & Dickinson (2014) Madau P., Dickinson M., 2014, ARA&A, 52, 415
- Magnelli et al. (2015) Magnelli B., et al., 2015, A&A, 573, A45
- Mairs et al. (2021) Mairs S., et al., 2021, AJ, 162, 191
- Man & Belli (2018) Man A., Belli S., 2018, Nature Astronomy, 2, 695
- Mantz et al. (2014) Mantz A. B., et al., 2014, ApJ, 794, 157
- Mazzucchelli et al. (2017) Mazzucchelli C., Bañados E., Decarli R., Farina E. P., Venemans B. P., Walter F., Overzier R., 2017, ApJ, 834, 83
- McBride et al. (2009) McBride J., Fakhouri O., Ma C.-P., 2009, MNRAS, 398, 1858
- Meinke et al. (2021) Meinke J., Böckmann K., Cohen S., Mauskopf P., Scannapieco E., Sarmento R., Lunde E., Cottle J., 2021, ApJ, 913, 88
- Merlin et al. (2019) Merlin E., et al., 2019, MNRAS, 490, 3309
- Millard et al. (2020) Millard J. S., et al., 2020, MNRAS, 494, 293
- Miller et al. (2018) Miller T. B., et al., 2018, Nature, 556, 469
- Morselli et al. (2014) Morselli L., et al., 2014, A&A, 568, A1
- Mountrichas et al. (2022) Mountrichas G., Masoura V. A., Xilouris E. M., Georgantopoulos I., Buat V., Paspaliaris E. D., 2022, arXiv e-prints, p. arXiv:2203.04949
- Muldrew et al. (2015) Muldrew S. I., Hatch N. A., Cooke E. A., 2015, MNRAS, 452, 2528
- Negrello et al. (2010) Negrello M., et al., 2010, Science, 330, 800
- Negrello et al. (2017) Negrello M., et al., 2017, MNRAS, 465, 3558
- Neri et al. (2020) Neri R., et al., 2020, A&A, 635, A7
- Newman et al. (2014) Newman A. B., Ellis R. S., Andreon S., Treu T., Raichoor A., Trinchieri G., 2014, ApJ, 788, 51
- Noble et al. (2017) Noble A. G., et al., 2017, ApJ, 842, L21
- Ota et al. (2018) Ota K., et al., 2018, ApJ, 856, 109
- Oteo et al. (2018) Oteo I., et al., 2018, ApJ, 856, 72
- Overzier (2016) Overzier R. A., 2016, A&ARv, 24, 14
- Pantoni et al. (2019) Pantoni L., Lapi A., Massardi M., Goswami S., Danese L., 2019, ApJ, 880, 129
- Pâris et al. (2018) Pâris I., et al., 2018, A&A, 613, A51
- Pearson et al. (2013) Pearson E. A., et al., 2013, MNRAS, 435, 2753
- Peng et al. (2015) Peng Y., Maiolino R., Cochrane R., 2015, Nature, 521, 192
- Pérez-Martínez et al. (2023) Pérez-Martínez J. M., et al., 2023, MNRAS, 518, 1707
- Péroux & Howk (2020) Péroux C., Howk J. C., 2020, ARA&A, 58, 363
- Planck Collaboration et al. (2020) Planck Collaboration et al., 2020, A&A, 641, A6
- Popping & Péroux (2022) Popping G., Péroux C., 2022, arXiv e-prints, p. arXiv:2203.03686
- Remus et al. (2022) Remus R.-S., Dolag K., Dannerbauer H., 2022, arXiv e-prints, p. arXiv:2208.01053
- Richards et al. (2009) Richards G. T., et al., 2009, ApJS, 180, 67
- Richards et al. (2015) Richards G. T., et al., 2015, ApJS, 219, 39
- Riechers et al. (2021) Riechers D. A., Cooray A., Pérez-Fournon I., Neri R., 2021, ApJ, 913, 141
- Rowan-Robinson et al. (2016) Rowan-Robinson M., et al., 2016, MNRAS, 461, 1100
- Schreiber et al. (2018) Schreiber C., et al., 2018, A&A, 618, A85
- Scott et al. (2002) Scott S. E., et al., 2002, MNRAS, 331, 817
- Scoville et al. (2016) Scoville N., et al., 2016, ApJ, 820, 83
- Scudder et al. (2016) Scudder J. M., Oliver S., Hurley P. D., Griffin M., Sargent M. T., Scott D., Wang L., Wardlow J. L., 2016, MNRAS, 460, 1119
- Seymour et al. (2012) Seymour N., et al., 2012, ApJ, 755, 146
- Shimakawa et al. (2015) Shimakawa R., Kodama T., Tadaki K.-i., Hayashi M., Koyama Y., Tanaka I., 2015, MNRAS, 448, 666
- Shimakawa et al. (2018) Shimakawa R., et al., 2018, MNRAS, 473, 1977
- Shimwell et al. (2022) Shimwell T. W., et al., 2022, A&A, 659, A1
- Shirley et al. (2021) Shirley R., et al., 2021, MNRAS, 507, 129
- Simpson et al. (2017) Simpson J. M., et al., 2017, ApJ, 839, 58
- Simpson et al. (2019) Simpson J. M., et al., 2019, ApJ, 880, 43
- Smail (2024) Smail I., 2024, arXiv e-prints, p. arXiv:2401.08761
- Smail et al. (2011) Smail I., Swinbank A. M., Ivison R. J., Ibar E., 2011, MNRAS, 414, L95
- Smith et al. (2017) Smith M. W. L., et al., 2017, ApJS, 233, 26
- Smith et al. (2019a) Smith M. W. L., et al., 2019a, MNRAS, 486, 4166
- Smith et al. (2019b) Smith C. M. A., Gear W. K., Smith M. W. L., Papageorgiou A., Eales S. A., 2019b, MNRAS, 486, 4304
- Solomon & Vanden Bout (2005) Solomon P. M., Vanden Bout P. A., 2005, ARA&A, 43, 677
- Spilker et al. (2016) Spilker J. S., Bezanson R., Marrone D. P., Weiner B. J., Whitaker K. E., Williams C. C., 2016, ApJ, 832, 19
- Spilker et al. (2018) Spilker J. S., et al., 2018, Science, 361, 1016
- Spilker et al. (2020a) Spilker J. S., et al., 2020a, ApJ, 905, 85
- Spilker et al. (2020b) Spilker J. S., et al., 2020b, ApJ, 905, 86
- Spitler et al. (2012) Spitler L. R., et al., 2012, ApJ, 748, L21
- Stach et al. (2017) Stach S. M., Swinbank A. M., Smail I., Hilton M., Simpson J. M., Cooke E. A., 2017, ApJ, 849, 154
- Stach et al. (2021) Stach S. M., et al., 2021, MNRAS, 504, 172
- Stanford et al. (2012) Stanford S. A., et al., 2012, ApJ, 753, 164
- Stanley et al. (2023) Stanley F., et al., 2023, ApJ, 945, 24
- Steidel et al. (1998) Steidel C. C., Adelberger K. L., Dickinson M., Giavalisco M., Pettini M., Kellogg M., 1998, ApJ, 492, 428
- Stevens et al. (2003) Stevens J. A., et al., 2003, Nature, 425, 264
- Stevens et al. (2005) Stevens J. A., Page M. J., Ivison R. J., Carrera F. J., Mittaz J. P. D., Smail I., McHardy I. M., 2005, MNRAS, 360, 610
- Stevens et al. (2010) Stevens J. A., Jarvis M. J., Coppin K. E. K., Page M. J., Greve T. R., Carrera F. J., Ivison R. J., 2010, MNRAS, 405, 2623
- Straatman et al. (2014) Straatman C. M. S., et al., 2014, ApJ, 783, L14
- Sweijen et al. (2022) Sweijen F., et al., 2022, Nature Astronomy, 6, 350
- Swinbank et al. (2014) Swinbank A. M., et al., 2014, MNRAS, 438, 1267
- Tadaki et al. (2019) Tadaki K.-i., et al., 2019, PASJ, 71, 40
- Tamura et al. (2009) Tamura Y., et al., 2009, Nature, 459, 61
- Toft et al. (2014) Toft S., et al., 2014, ApJ, 782, 68
- Toshikawa et al. (2012) Toshikawa J., et al., 2012, ApJ, 750, 137
- Tran et al. (2015) Tran K.-V. H., et al., 2015, ApJ, 811, 28
- Treu (2010) Treu T., 2010, ARA&A, 48, 87
- Trudeau et al. (2019) Trudeau A., et al., 2019, MNRAS, 487, 1210
- Umehata et al. (2015) Umehata H., et al., 2015, ApJ, 815, L8
- Urquhart et al. (2022) Urquhart S. A., et al., 2022, arXiv e-prints, p. arXiv:2201.07815
- Utsumi et al. (2010) Utsumi Y., Goto T., Kashikawa N., Miyazaki S., Komiyama Y., Furusawa H., Overzier R., 2010, ApJ, 721, 1680
- Valentino et al. (2015) Valentino F., et al., 2015, ApJ, 801, 132
- Valiante et al. (2016) Valiante E., et al., 2016, MNRAS, 462, 3146
- Vayner et al. (2021) Vayner A., Zakamska N., Wright S. A., Armus L., Murray N., Walth G., 2021, ApJ, 923, 59
- Venemans et al. (2007) Venemans B. P., et al., 2007, A&A, 461, 823
- Vieira et al. (2013) Vieira J. D., et al., 2013, Nature, 495, 344
- Vijayan et al. (2019) Vijayan A. P., Clay S. J., Thomas P. A., Yates R. M., Wilkins S. M., Henriques B. M., 2019, MNRAS, 489, 4072
- Walter et al. (2012) Walter F., et al., 2012, Nature, 486, 233
- Walter et al. (2020) Walter F., et al., 2020, ApJ, 902, 111
- Wang et al. (2021) Wang W., Wylezalek D., De Breuck C., Vernet J., Humphrey A., Villar Martín M., Lehnert M. D., Kolwa S., 2021, A&A, 654, A88
- Webb et al. (2015) Webb T. M. A., et al., 2015, ApJ, 814, 96
- Webb et al. (2017) Webb T. M. A., et al., 2017, ApJ, 844, L17
- Weiß et al. (2009) Weiß A., et al., 2009, ApJ, 707, 1201
- Wilson et al. (2020) Wilson G. W., et al., 2020, in Society of Photo-Optical Instrumentation Engineers (SPIE) Conference Series. p. 1145302, doi:10.1117/12.2562331
- Wright et al. (2010) Wright E. L., et al., 2010, AJ, 140, 1868
- Yuan et al. (2014) Yuan T., et al., 2014, ApJ, 795, L20
- Zavala et al. (2015) Zavala J. A., et al., 2015, MNRAS, 452, 1140
- Zavala et al. (2019) Zavala J. A., et al., 2019, ApJ, 887, 183
- Zeballos et al. (2018) Zeballos M., et al., 2018, MNRAS, 479, 4577
- Zeimann et al. (2012) Zeimann G. R., et al., 2012, ApJ, 756, 115
- Zhang et al. (2022) Zhang Y., et al., 2022, MNRAS, 512, 4893
- da Cunha et al. (2008) da Cunha E., Charlot S., Elbaz D., 2008, MNRAS, 388, 1595
- van Haarlem et al. (2013) van Haarlem M. P., et al., 2013, A&A, 556, A2
- van der Burg et al. (2014) van der Burg R. F. J., Muzzin A., Hoekstra H., Wilson G., Lidman C., Yee H. K. C., 2014, A&A, 561, A79
1Department of Earth and Space Sciences, Chalmers University of Technology, Onsala Observatory, 439 94 Onsala, Sweden
2Department of Physics, Graduate School of Science, Nagoya University, Nagoya, Aichi 464-8602, Japan
3National Astronomical Observatory of Japan, 2-21-1, Osawa, Mitaka, Tokyo 181-8588, Japan
4Institut de Radioastronomie Millimétrique (IRAM), 300 Rue de la Piscine, 38400 Saint-Martin-d’Hères, France
5Instituto Astrofísica de Canarias (IAC), E-38205 La Laguna, Tenerife, Spain
6Dpto. Astrofísica, Universidad de la , E-38206 La Laguna, Tenerife, Spain
7Institut d’Astrophysique de Paris, Sorbonne Université,UPMC Université Paris 6 and CNRS, UMR 7095, 98 bis boulevard Arago, F-75014 Paris, France
8Instituto Nacional de Astrofísica, Óptica y Electrónica, Tonantzintla, 72000 Puebla, México
9I. Physikalisches Institut, Universität zu Köln, Zülpicher Strasse 77, D-50937 Köln, Germany
10Leiden Observatory, Leiden University, PO Box 9513, NL-2300 RA Leiden, Netherlands
11Department of Physics and Astronomy, Rutgers, the State University of New Jersey, 136 Frelinghuysen Road, Piscataway, NJ 08854-8019, USA
12Department of Physics and Astronomy, University of the Western Cape, Robert Sobukwe Road, Bellville 7535, South Africa
13Institut d’Astrophysique Spatiale (IAS), CNRS et Université Paris Sud, Orsay, France
14UK ALMA Regional Centre Node, Jodrell Bank Centre for Astrophysics, Department of Physics and Astronomy,
University of Manchester, Oxford Road, Manchester M13 9PL, UK
15Dipartimento di Fisica e Astronomia “G. Galilei”, Universit’di Padova, Vicolo dell’Osservatorio 3, I-35122, Padova, Italy
16Aix-Mar seille Univer sitè, CNRS and CNES, Laboratoire d’Astrophysique de Marseille, 38, rue Frèdèric Joliot-Curie, F-13388 Marseille, France
17Department of Physics & Astronomy, University of California, Irvine, 4129 Reines Hall, Irvine, CA 92697, USA
18School of Physics and Astronomy, Cardiff University, The Parade, Cardiff, CF24 3AA, UK
19School of Physics & Astronomy, University of Nottingham, University Park, Nottingham NG7 2RD, UK
20Institute of Astronomy, University of Cambridge, Madingley Road, Cambridge CB30HA, UK
21Department of Astronomy, University of Maryland, College Park, MD 20742, USA
22European Southern Observatory, Karl Schwarzschild Strasse 2, D-85748 Garching, Germany
23Jodrell Bank Centre for Astrophysics, School of Natural Sciences, The University of Manchester, Manchester M13 9PL, UK
24Centre de Recherche Astrophysique de Lyon, ENS de Lyon, Université Lyon 1, CNRS, UMR5574, 69230 Saint-Genis-Laval, France
25Department of Astronomy, University of Cape Town, Private Bag X3, Rondebosch 7701, Cape Town, South Africa
26INAF, Instituto di Radioastronomia-Italian ARC, Via Piero Gobetti 101, I-40129 Bologna, Italy
27European Southern Observatory, Alonso de Córdova 3107, Vitacura, Casilla 19001, Santiago de Chile, Chile
28Joint ALMA Observatory, Alonso de Córdova 3107, Vitacura 763-0355, Santiago de Chile, Chile
29Ikerbasque Foundation, University of the Basque Country, DIPC Donostia, Spain
30National Centre for Nuclear Research, ul. Pasteura 7, 02-093 Warszawa, Poland
31 INAF - Osservatorio astronomico d’Abruzzo, Via Maggini SNC, 64100, Teramo, Italy
32The Observatories of the Carnegie Institution for Science, 813 Santa Barbara St., Pasadena, CA 91101, USA
33Department of Physics and Astronomy, University of California, Riverside, 900 University Ave, Riverside, CA 92521, USA
34School of Physical Sciences, The Open University, Milton Keynes, MK7 6AA, UK
35National Radio Astronomy Observatory, 520 Edgemont Road, Charlottesville, VA 22903, USA
36Max-Planck-Institut für Radioastronomie, Auf dem Hügel 69, 53121 Bonn, Germany
Appendix A Spectral fitting using Herschel and SCUBA-2 fluxes
Appendix Figure 13 shows the fits of the six sources detected at (with solid black borders in Figure 9). While multiple sources are not detected in the Herschel catalogues, these observations provide strict upper limits (particularly at the wavelength of 250 µm) that restrict the potential photometric redshifts of these sources. The red line shows the fitted spectrum according to the two-temperature modified black-body of Pearson et al. (2013), while the blue and grey lines indicate the best-fit spectrum according to the method presented in Ivison et al. (2016). Both methods appear to fit the data well.