Multi-modal Perception Dataset of In-water Objects
for Autonomous Surface Vehicles
Abstract
This paper introduces the first publicly accessible multi-modal perception dataset for autonomous maritime navigation, focusing on in-water obstacles within the aquatic environment to enhance situational awareness for Autonomous Surface Vehicles (ASVs). This dataset, consisting of diverse objects encountered under varying environmental conditions, aims to bridge the research gap in marine robotics by providing a multi-modal, annotated, and ego-centric perception dataset, for object detection and classification. We also show the applicability of the proposed dataset’s framework using deep learning-based open-source perception algorithms that have shown success. We expect that our dataset will contribute to development of the marine autonomy pipeline and marine (field) robotics. Please note this is a work-in-progress paper about our on-going research that we plan to release in full via future publication.
I INTRODUCTION
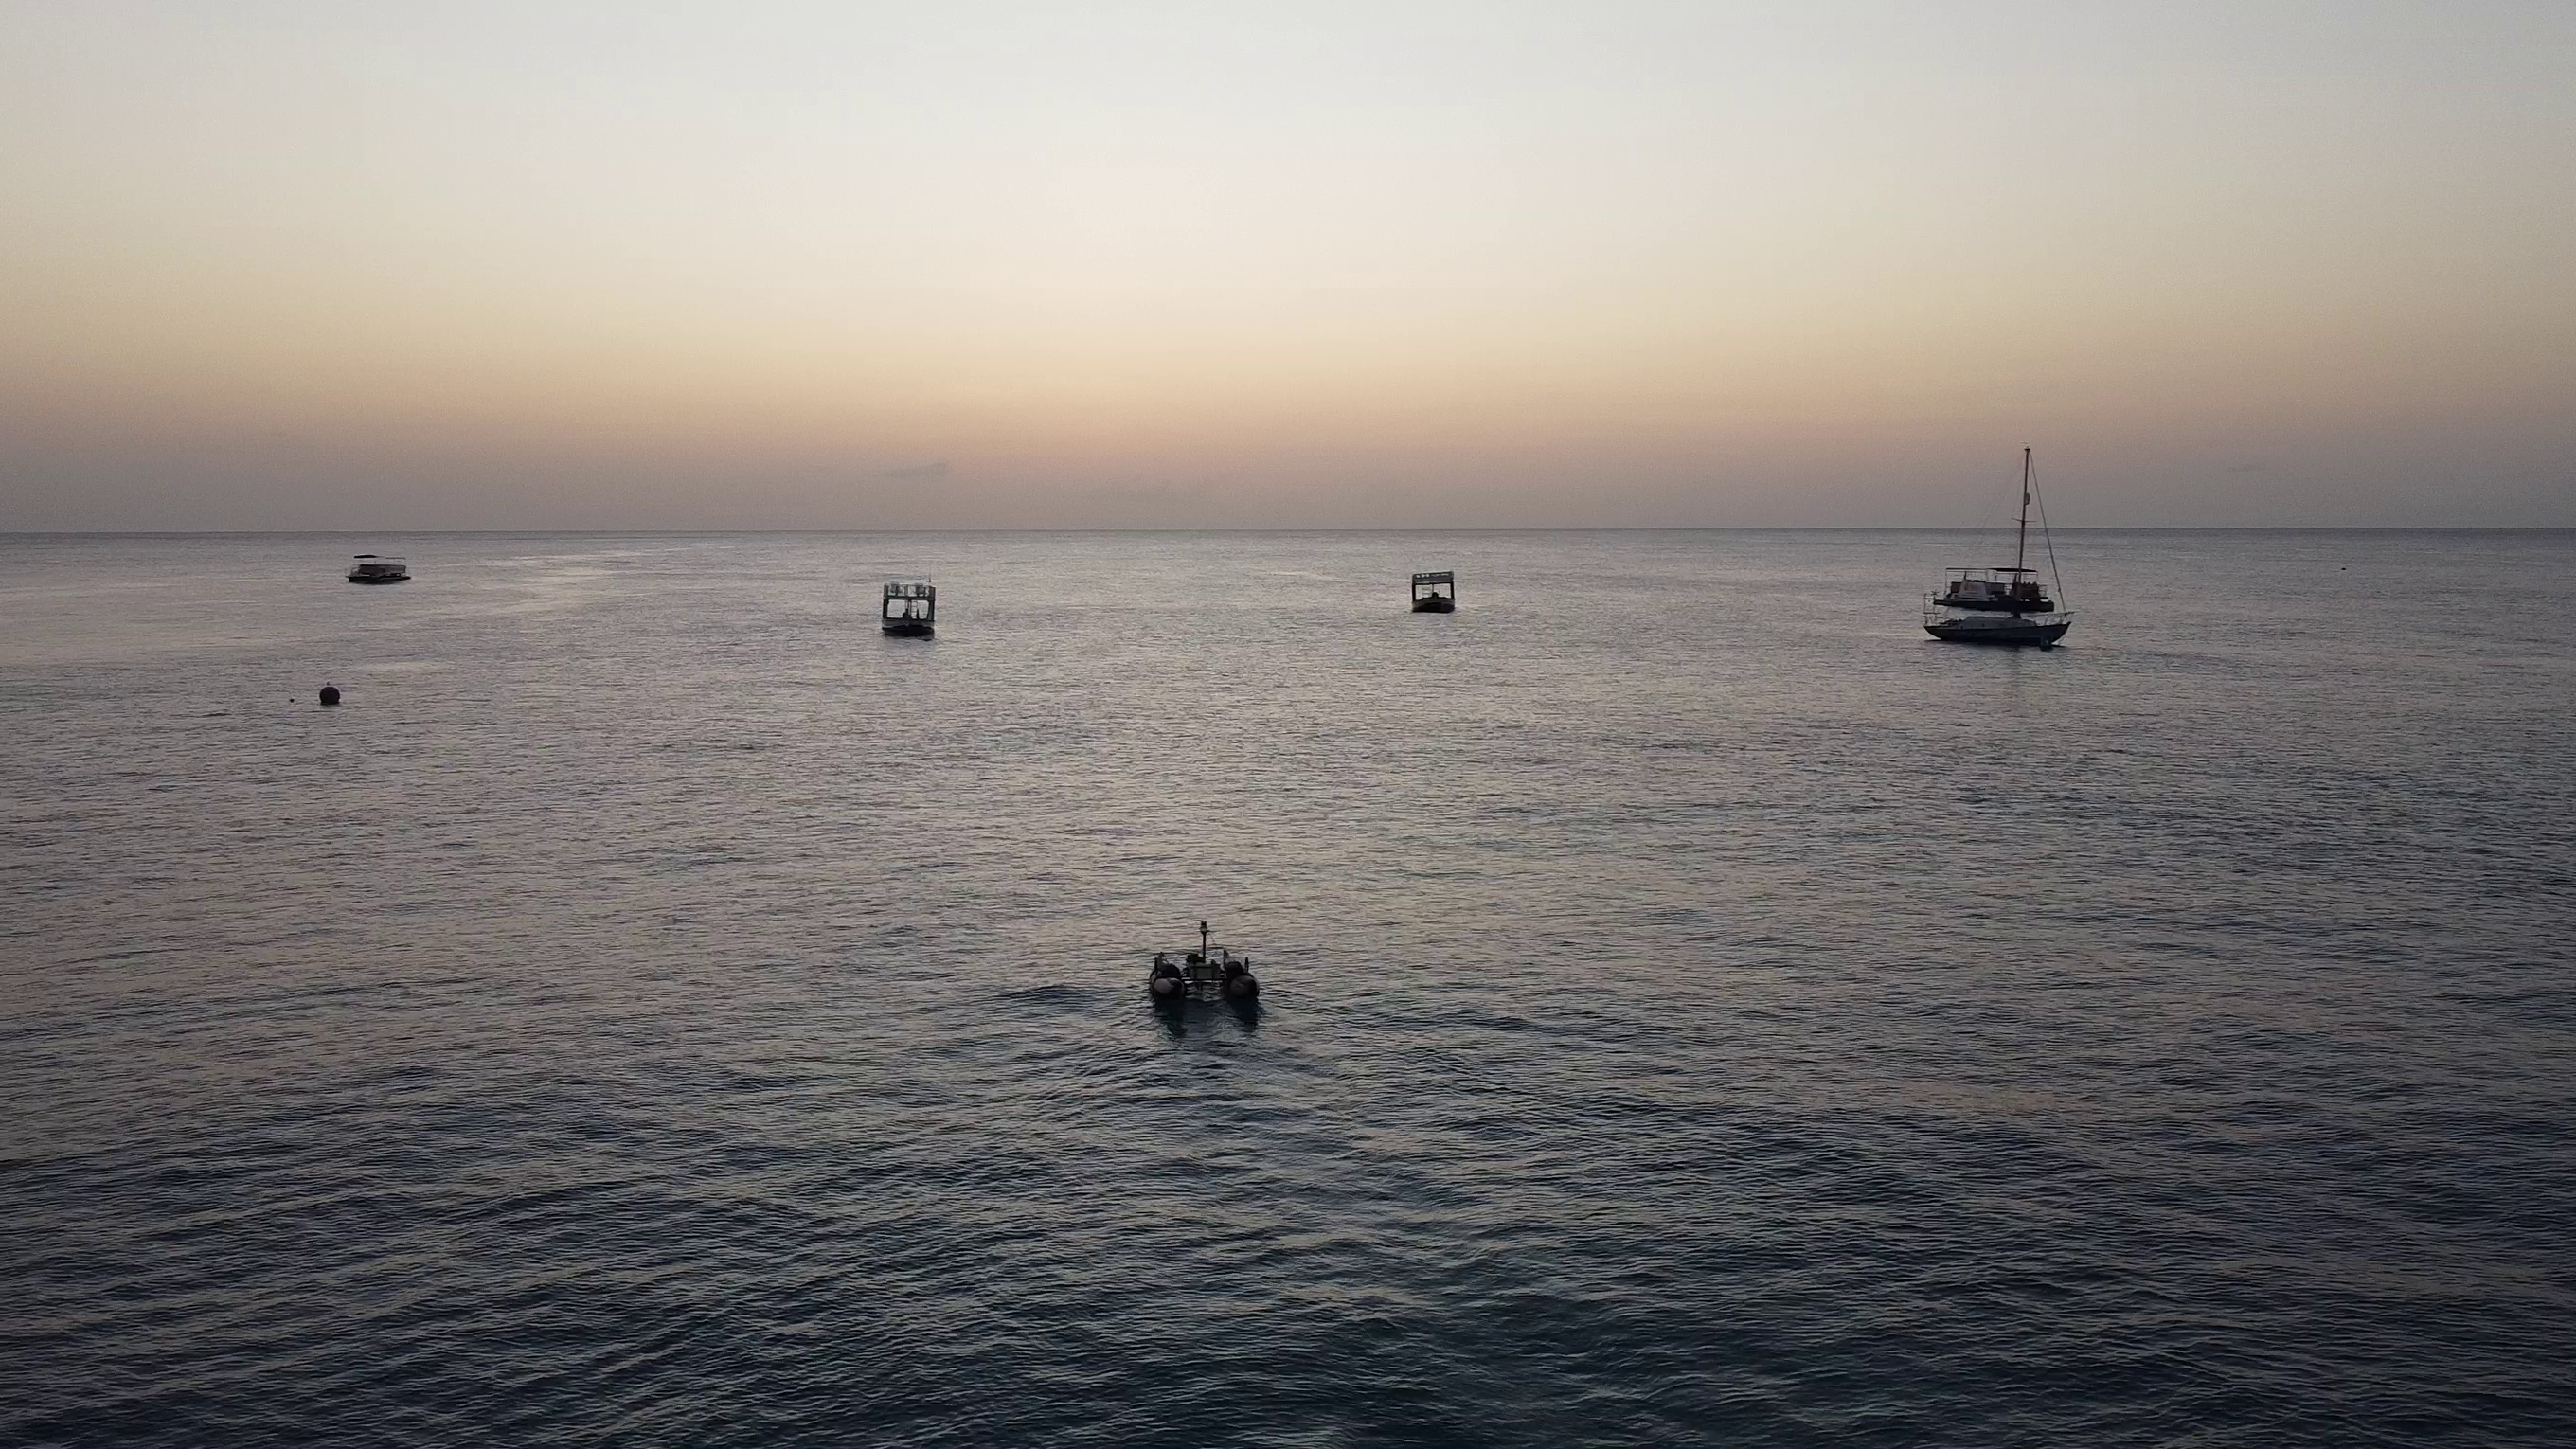
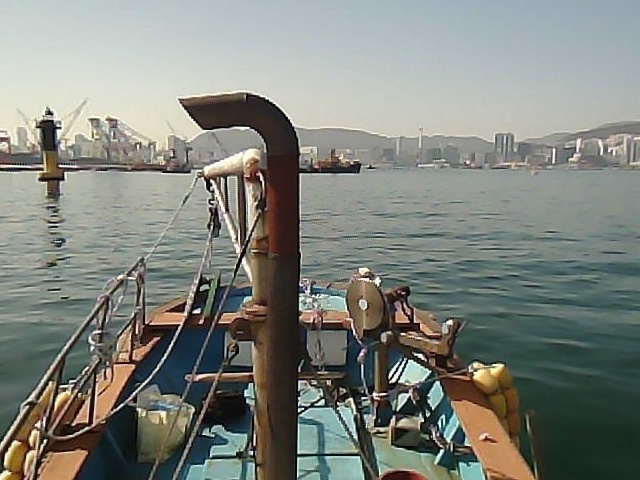
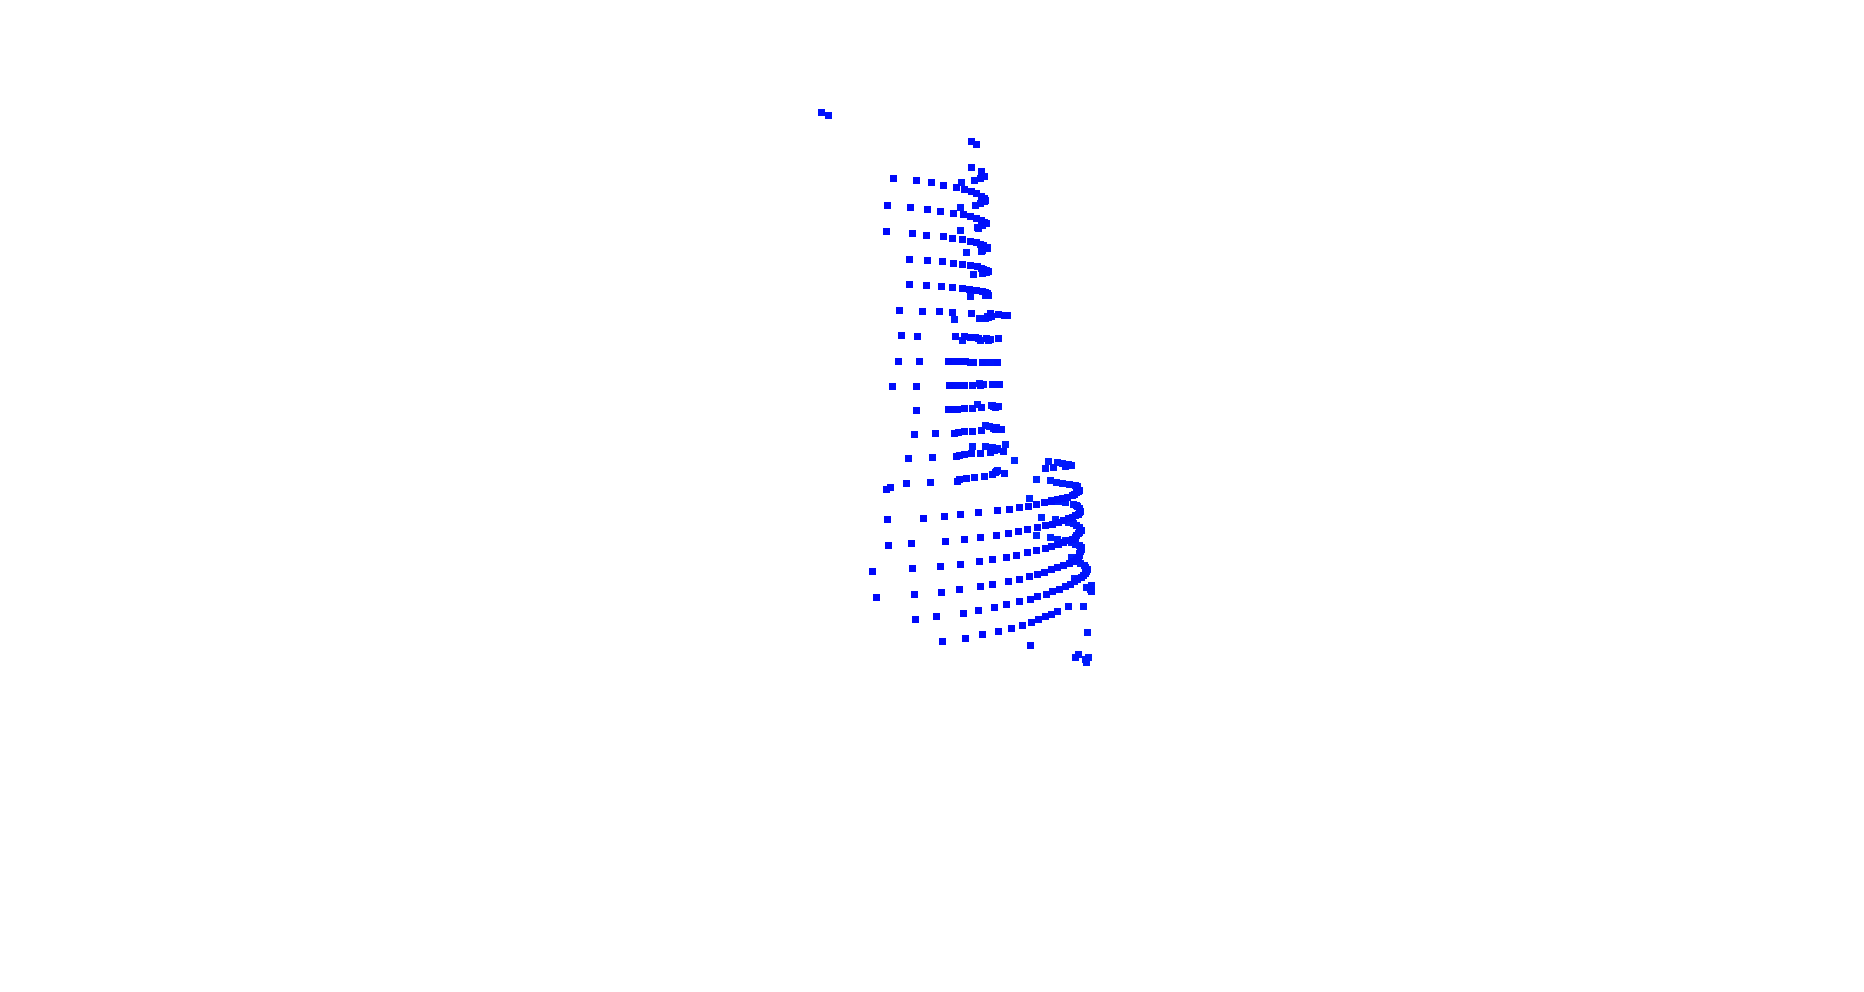
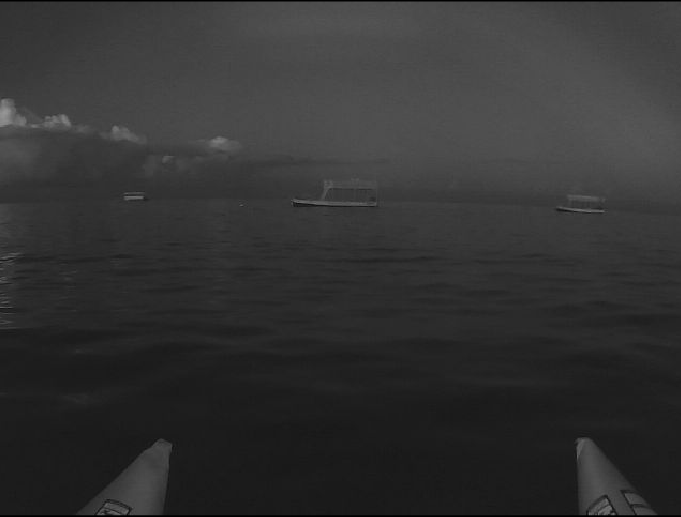
A significant limitation in the research on autonomous maritime navigation is the lack of relevant multi-modal perception data. Thus, the goal of this paper is to describe the first multi-modal perception dataset set for public release in short order (Fig. 1). This dataset, consisting of in-water obstacles in the aquatic domain, aims to enhance situational awareness for ASVs. Situational awareness is a foundational task that undergirds autonomy, which is increasing in importance given the focus on ASVs for tasks such as environmental monitoring and automated transportation. This importance will only grow as marine trade increases to of the share of world trade [1] and the expected size of the ASV market will grow to USD by [2].
Understanding the locations of static and dynamic objects in the aquatic domain (object detection) and determining the types of these objects (object classification) are crucial tasks for navigational decision-making. Such processes are further useful for data association, to understand the speed and heading of approaching and risky objects. However, aquatic domain’s challenges including (1) unstructured navigational environments and (2) limited maneuverability of marine vehicles raise the importance of early and accurate state estimation of in-water obstacles for safe and efficient navigation. Consequently, marine vehicles, even human-driven vessels, naturally rely on multi-modal data for situational awareness, which aligns with the regulations (e.g., rule 5 look-out) explicitly covered by maritime Rules of the Road [3]. Effective cross-correlation of multi-modal data will be essential for robust maritime autonomy and will require high-quality, labeled, multi-modal datasets to enable capability creation as well as to validate performance.
Compared to the plethora of existing labeled multi-modal terrestrial datasets for self-driving cars [4, 5, 6], there is a surprising lack of equivalent aquatic datasets for ASVs. This scarcity is due to the high operational costs and the extensive effort required for labeling in the case of ASVs [7]. Among the few existing datasets in the aquatic domain, the open-source ones primarily consist of either (1) single-modality data that is typically image-based [8, 9, 10, 11, 12, 13, 14, 15], or (2) lack object labels across the multiple modalities, which are essential for ground-truth evaluation [16]. This absence of multi-modal and ground-truth annotations significantly hinders the development of crucial ASV capabilities as noted in [16, 15], such as perception and collision avoidance, which rely on supervised deep learning, and by extension labeled data-driven, approaches proven successful in other domains [17, 18, 19, 20].
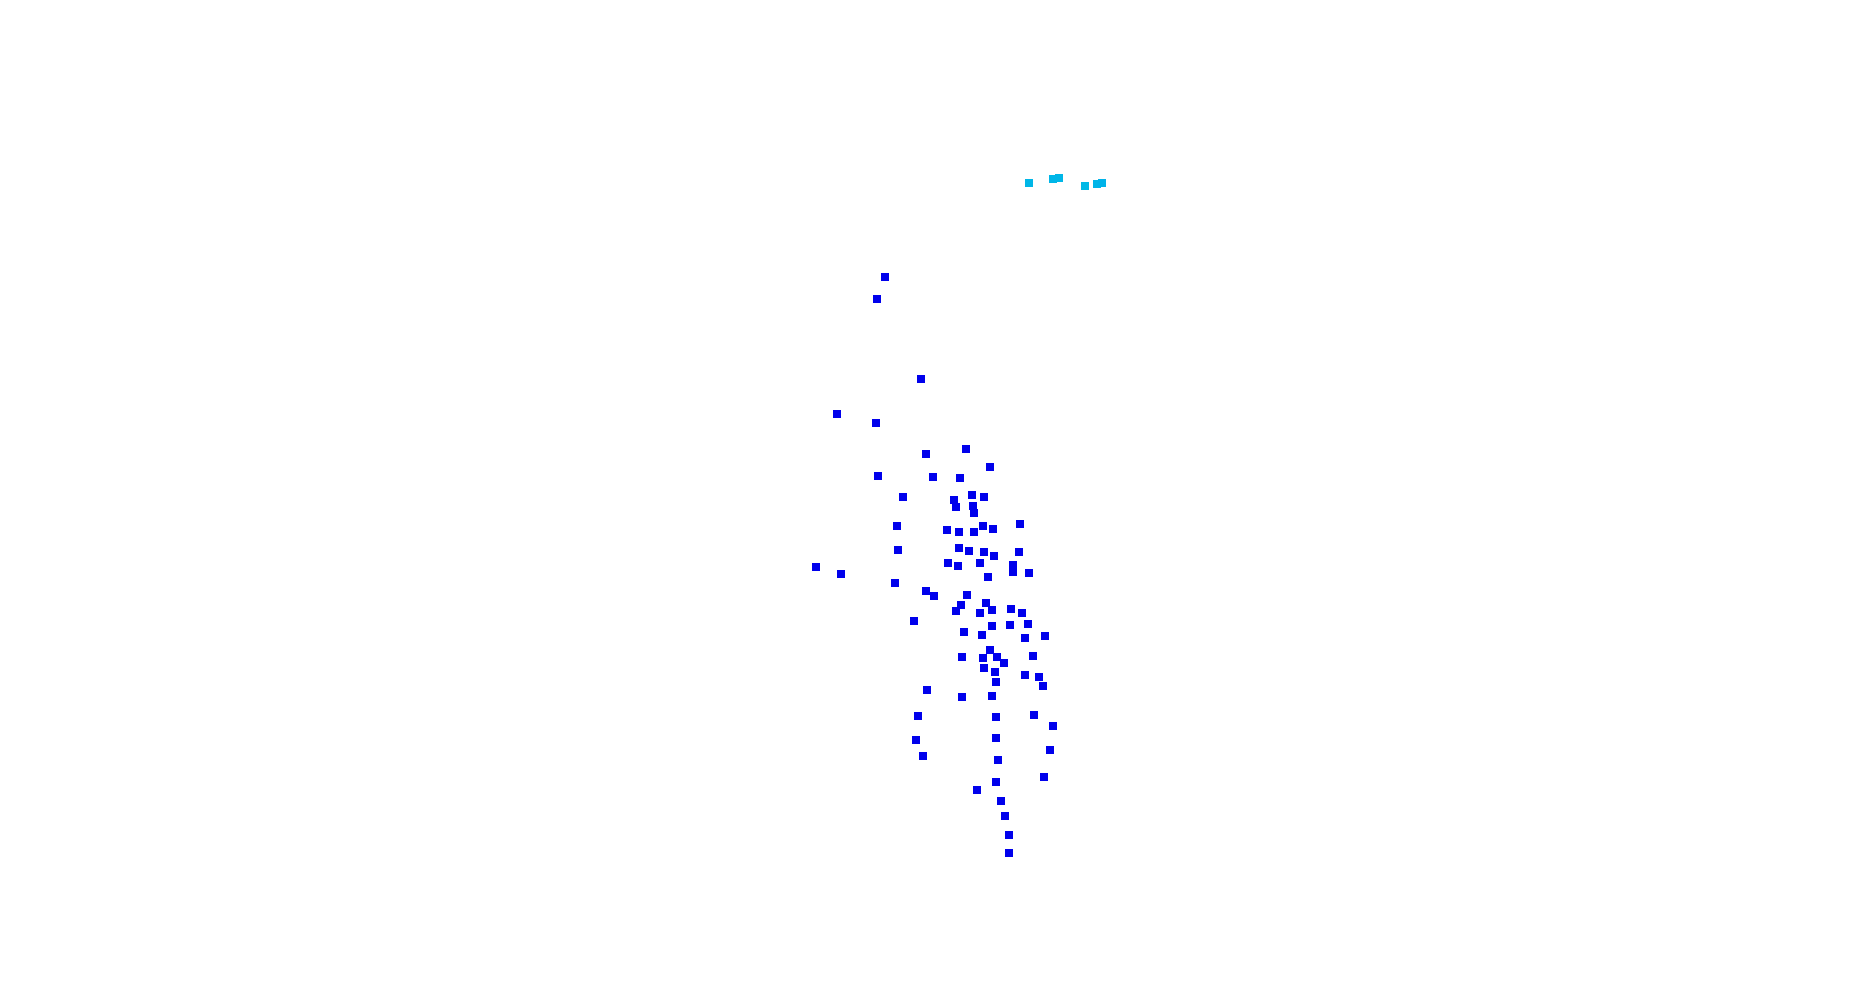
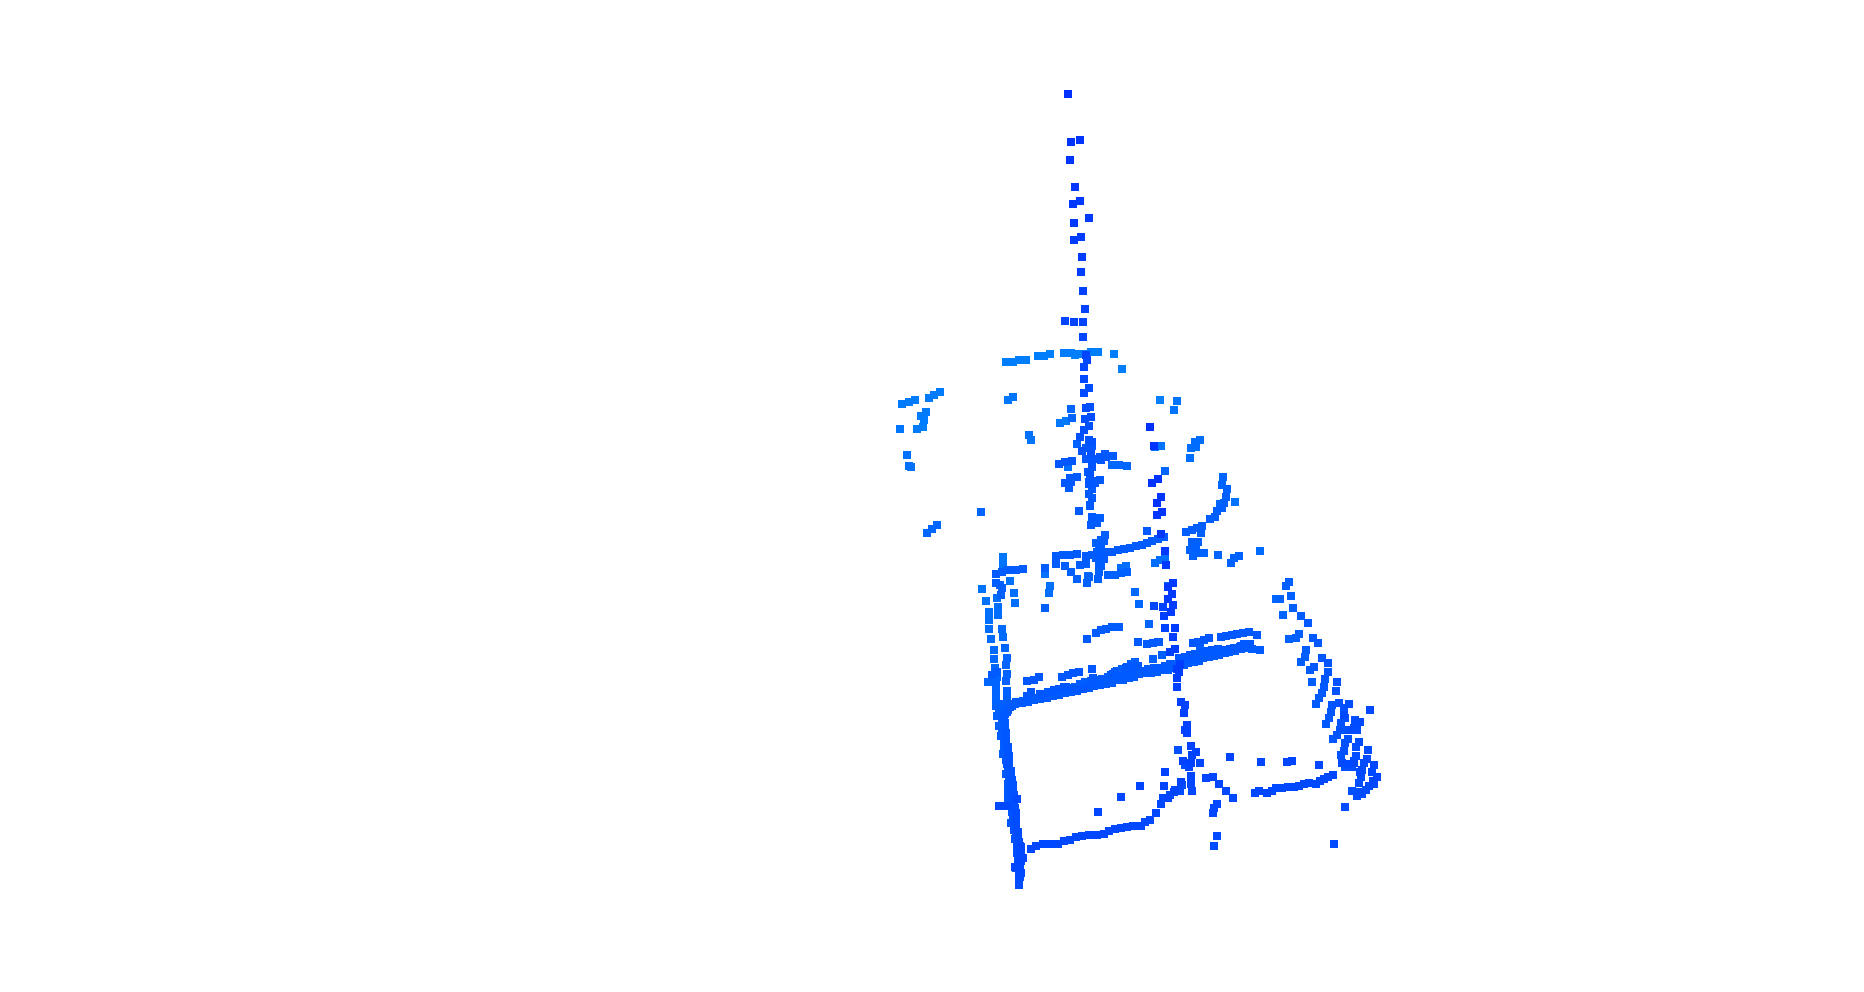
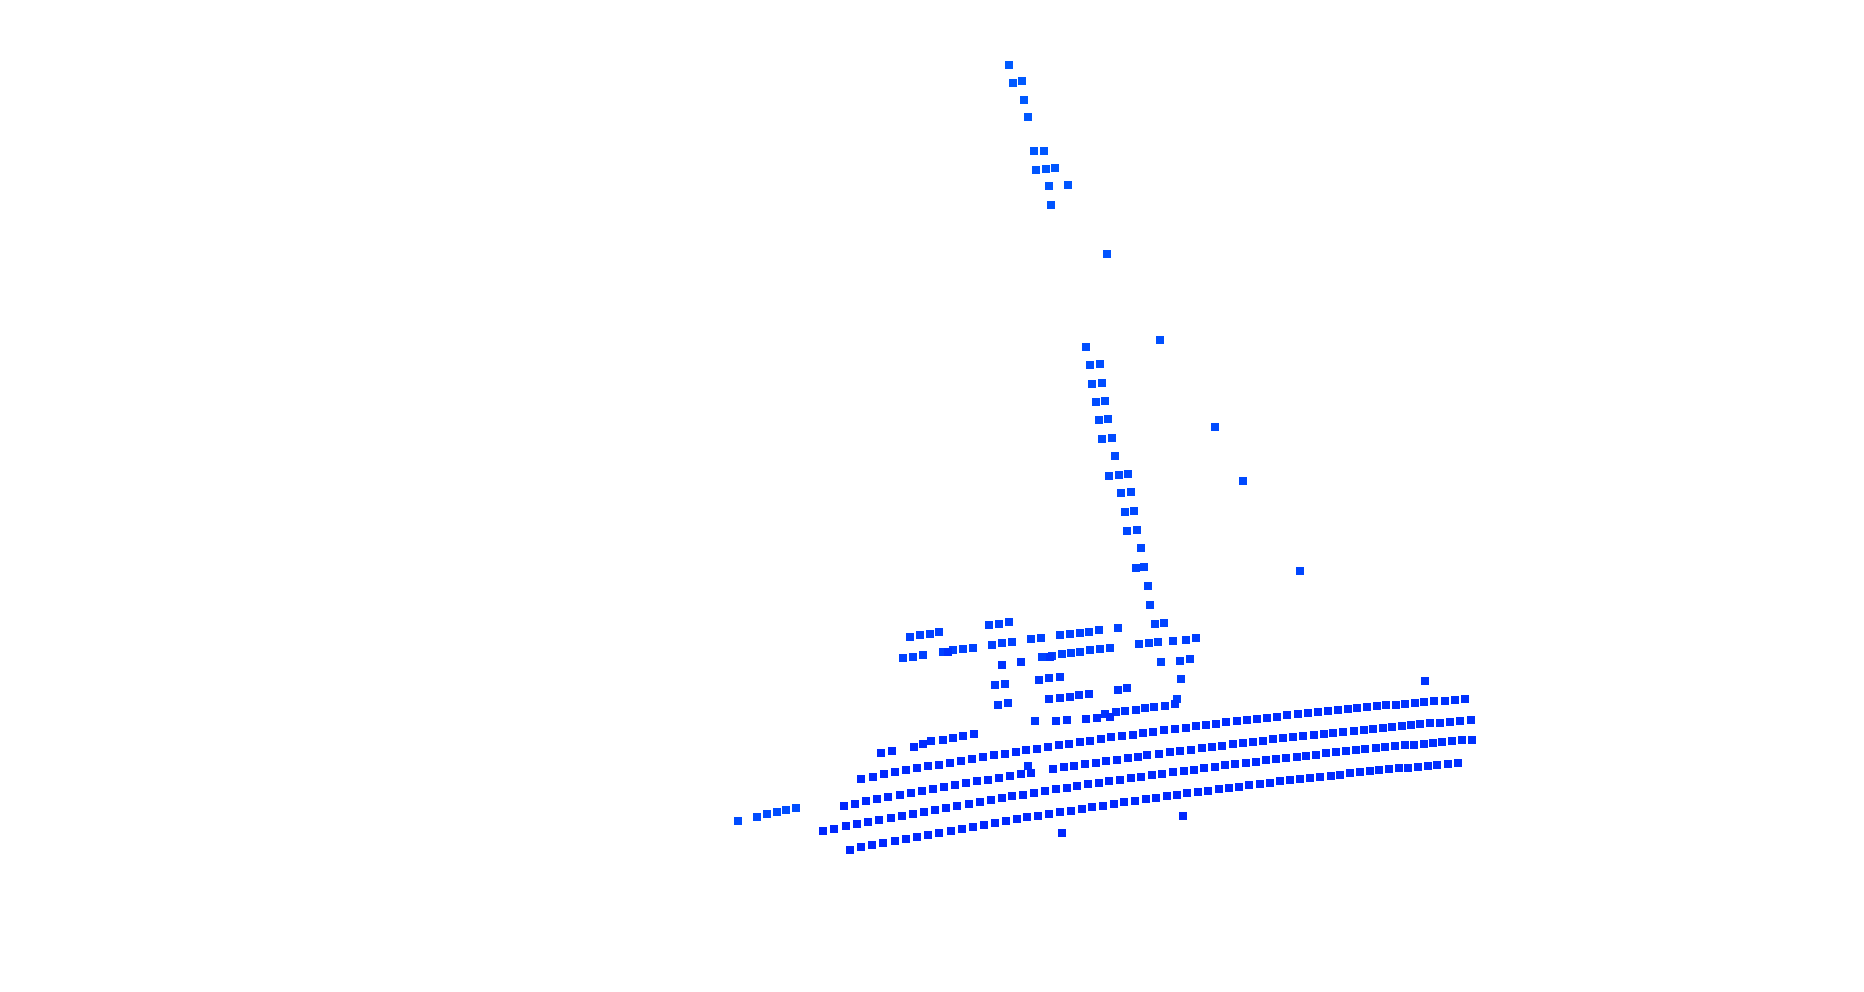
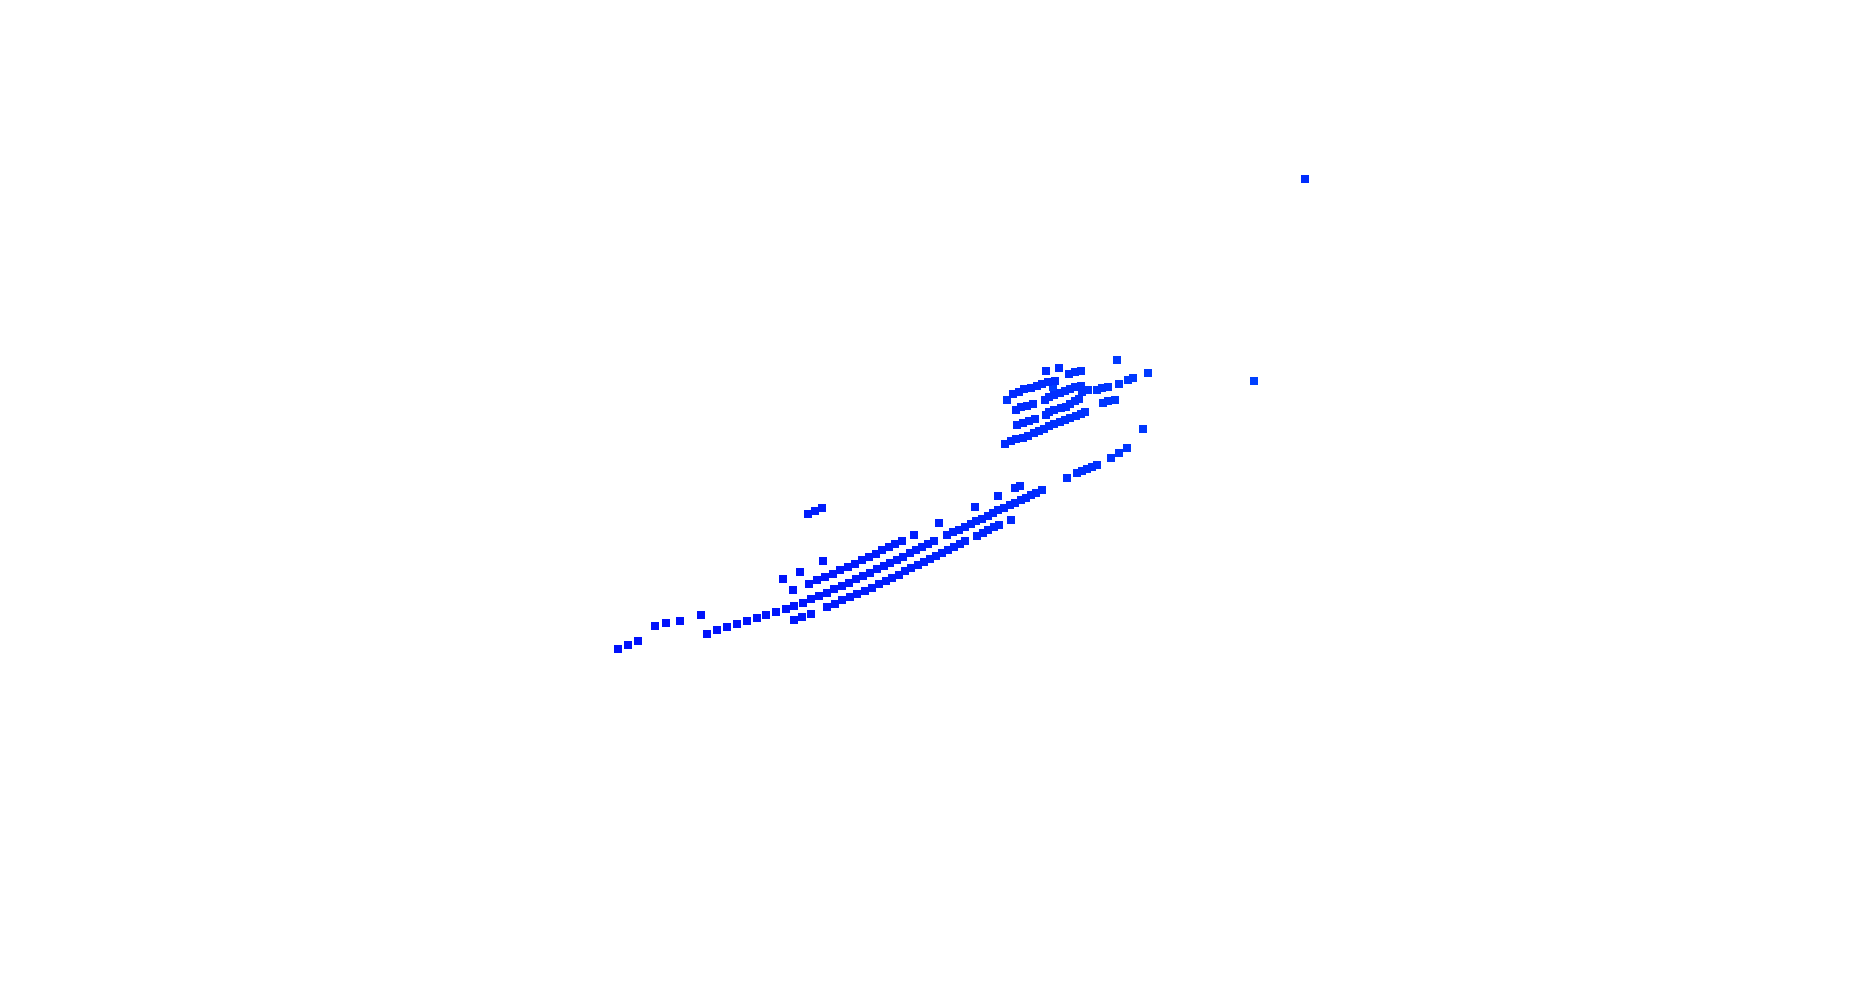
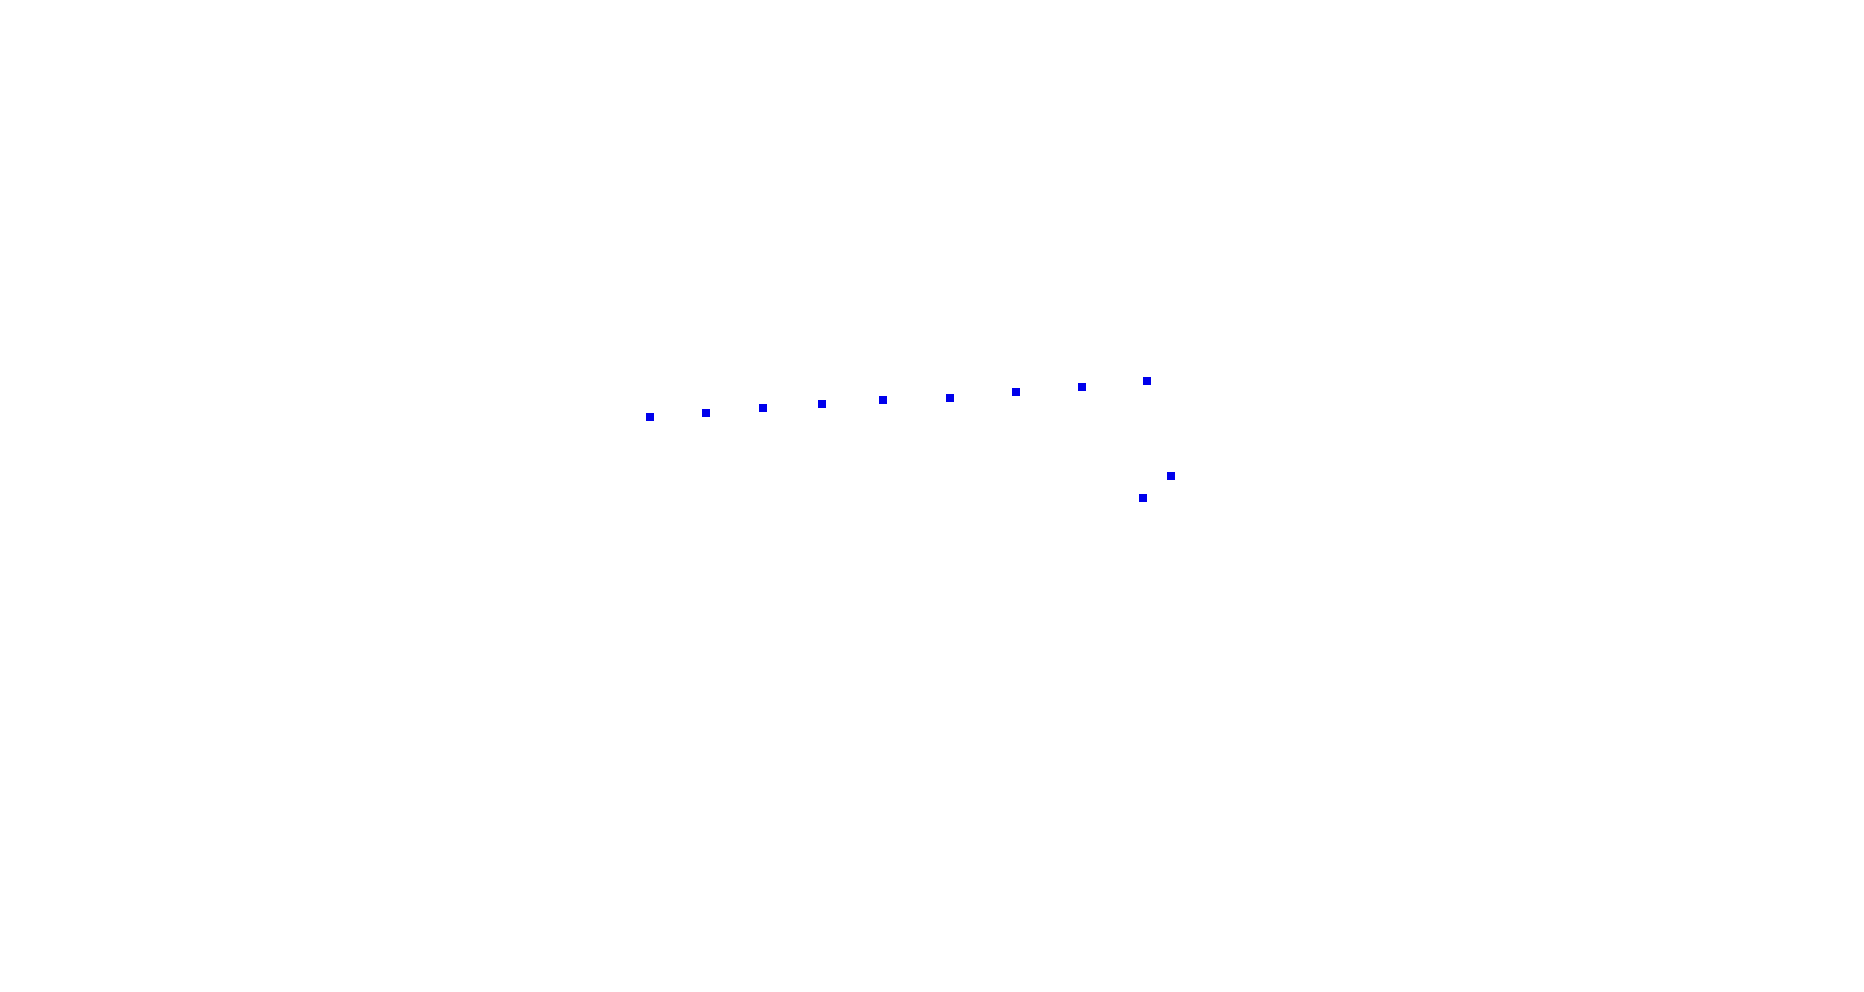
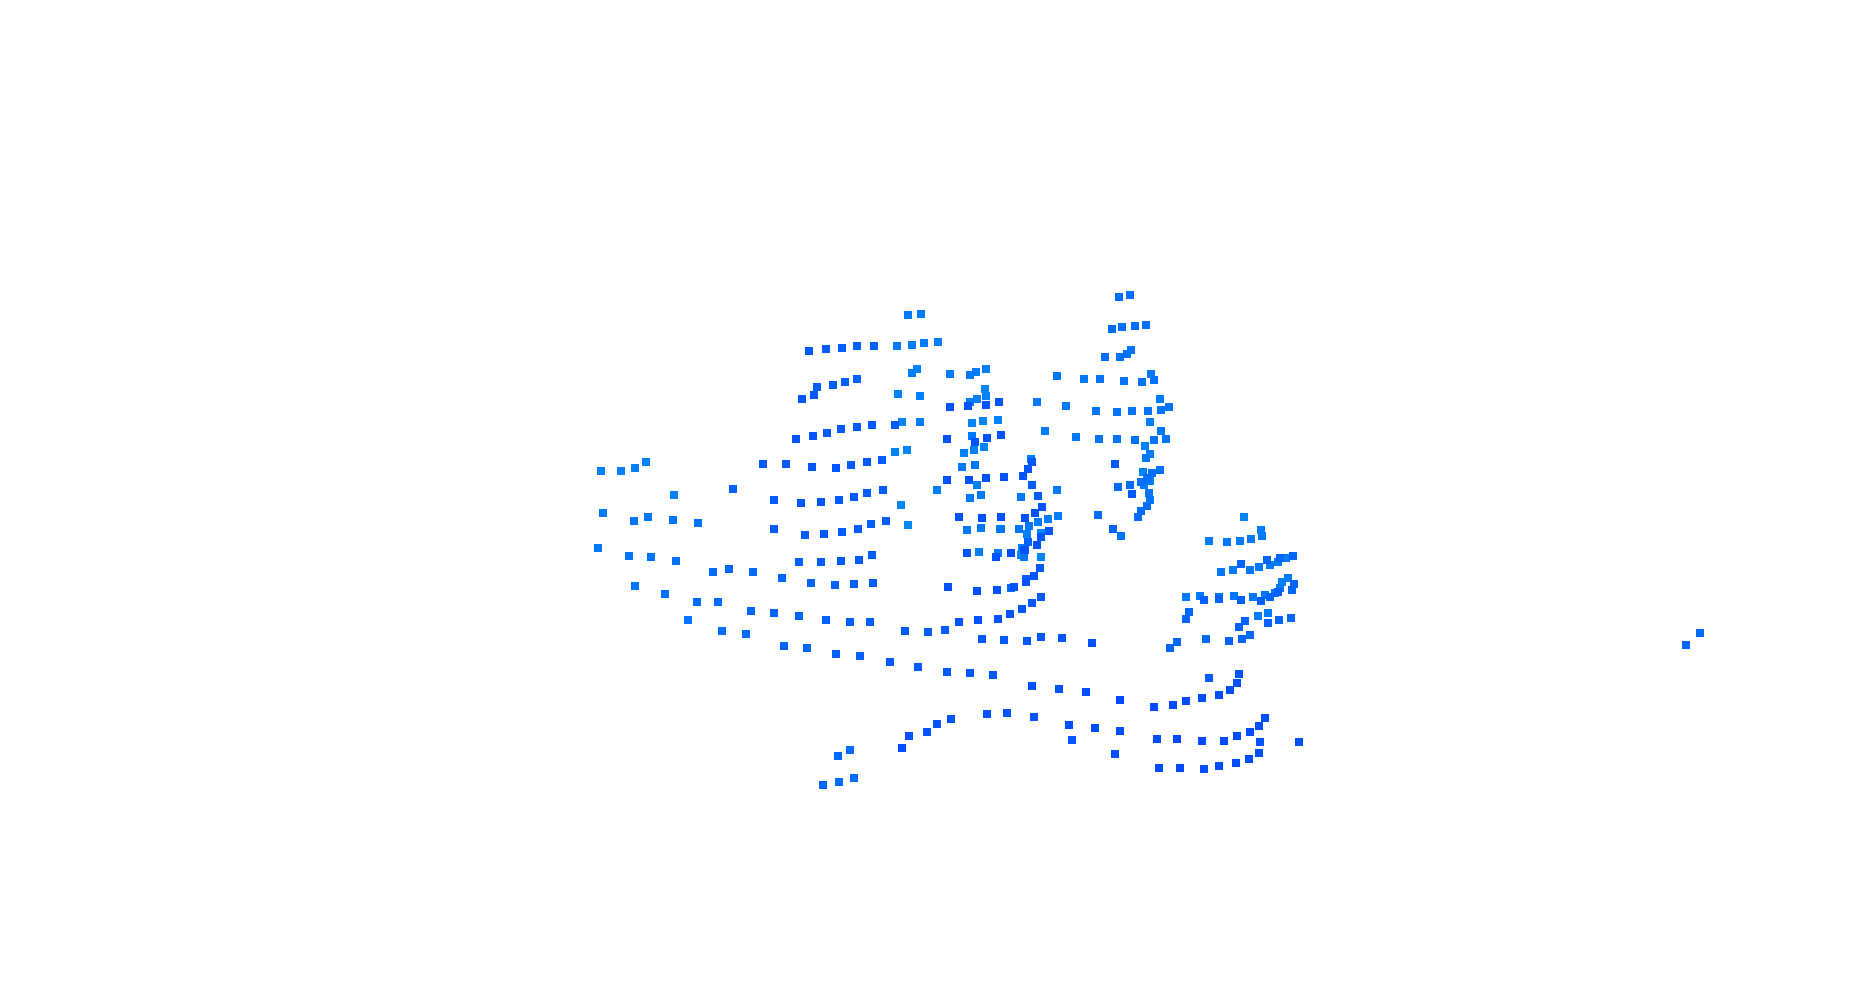
To address limitations (1) and (2), we will release the first multi-modal labeled maritime dataset. Our dataset includes expeditions from 2021 to 2024 using our ASV platform Catabot and a human-driven vessel in different locations (United States, Barbados, and South Korea) covering various environments (both sea and fresh water), conditions (e.g., dusk, daylight), and encounters (e.g., head-on, crossing) with various objects. Such heterogeneous data collections are essential to create representative feature sets and, by extension, generalizable algorithms. The proposed dataset includes three classes (ship, buoy, and other) of labeled objects for detection and classification. We selected these labels according to the international traffic rule [3] and buoyage system [21]. In sum, the dataset is composed of frames of time-synchronized LiDAR point clouds and RGB images. We also demonstrate the utility of the proposed dataset’s framework using deep learning-based open-source perception algorithms that have shown success in the terrestrial domain. We plan to release our dataset publicly for the community and expect it will contribute to development of state-of-the-art marine autonomy pipelines and accelerate the future of marine (field) robotics.
II Related Work
Self-driving car datasets focused on 3D perception, including [4, 5, 6], have been crucial for progress in terrestrial robotic perception, especially for tasks like object detection, classification, segmentation, and tracking. These collections frequently feature a range of sensors, employing either individual or combined data from cameras, LiDAR, and RADAR. Given the importance of these datasets, there is a push to develop specialized datasets for the marine domain to support the advancement of marine autonomy.
Maritime object detection and classification datasets mainly consist of a single sensor modality, i.e., camera sensors, used for different purposes. Key datasets include the first visible and infrared ship image dataset for autonomous navigation compliance [8], a large-scale maritime dataset with over 2 million images detailing vessel information from a community site [9], and a dataset of common ship types from coastal surveillance [10]. [11] introduced more variety with different water surface objects. However, most datasets were from stationary platforms, not from an ego-centric perspective. A significant onboard camera dataset exists [12] but is not public. Public datasets [13, 14, 15] from an autonomous surface vehicle focus on segmenting sea, sky, and environment without distinguishing specific marine objects.
Several multi-modal datasets [22, 23, 24] are available, targeting different aspects of marine perception but not directly focusing on object detection and classification. [22] covers inland waterway scenes using LiDAR, stereo cameras, RADAR, GPS, and IMUs, for water segmentation, SLAM, and stereo matching. [24] combines data from 10 cameras, RADAR, and LiDAR for object tracking. [23] collects data from a diverse set of sensors over a route, aiming at SLAM and docking. This lack of datasets in the marine domain, specifically missing the key situational awareness tasks previously described, hampers progress in marine autonomy.
III Dataset Generation
III-A Sensor Configurations
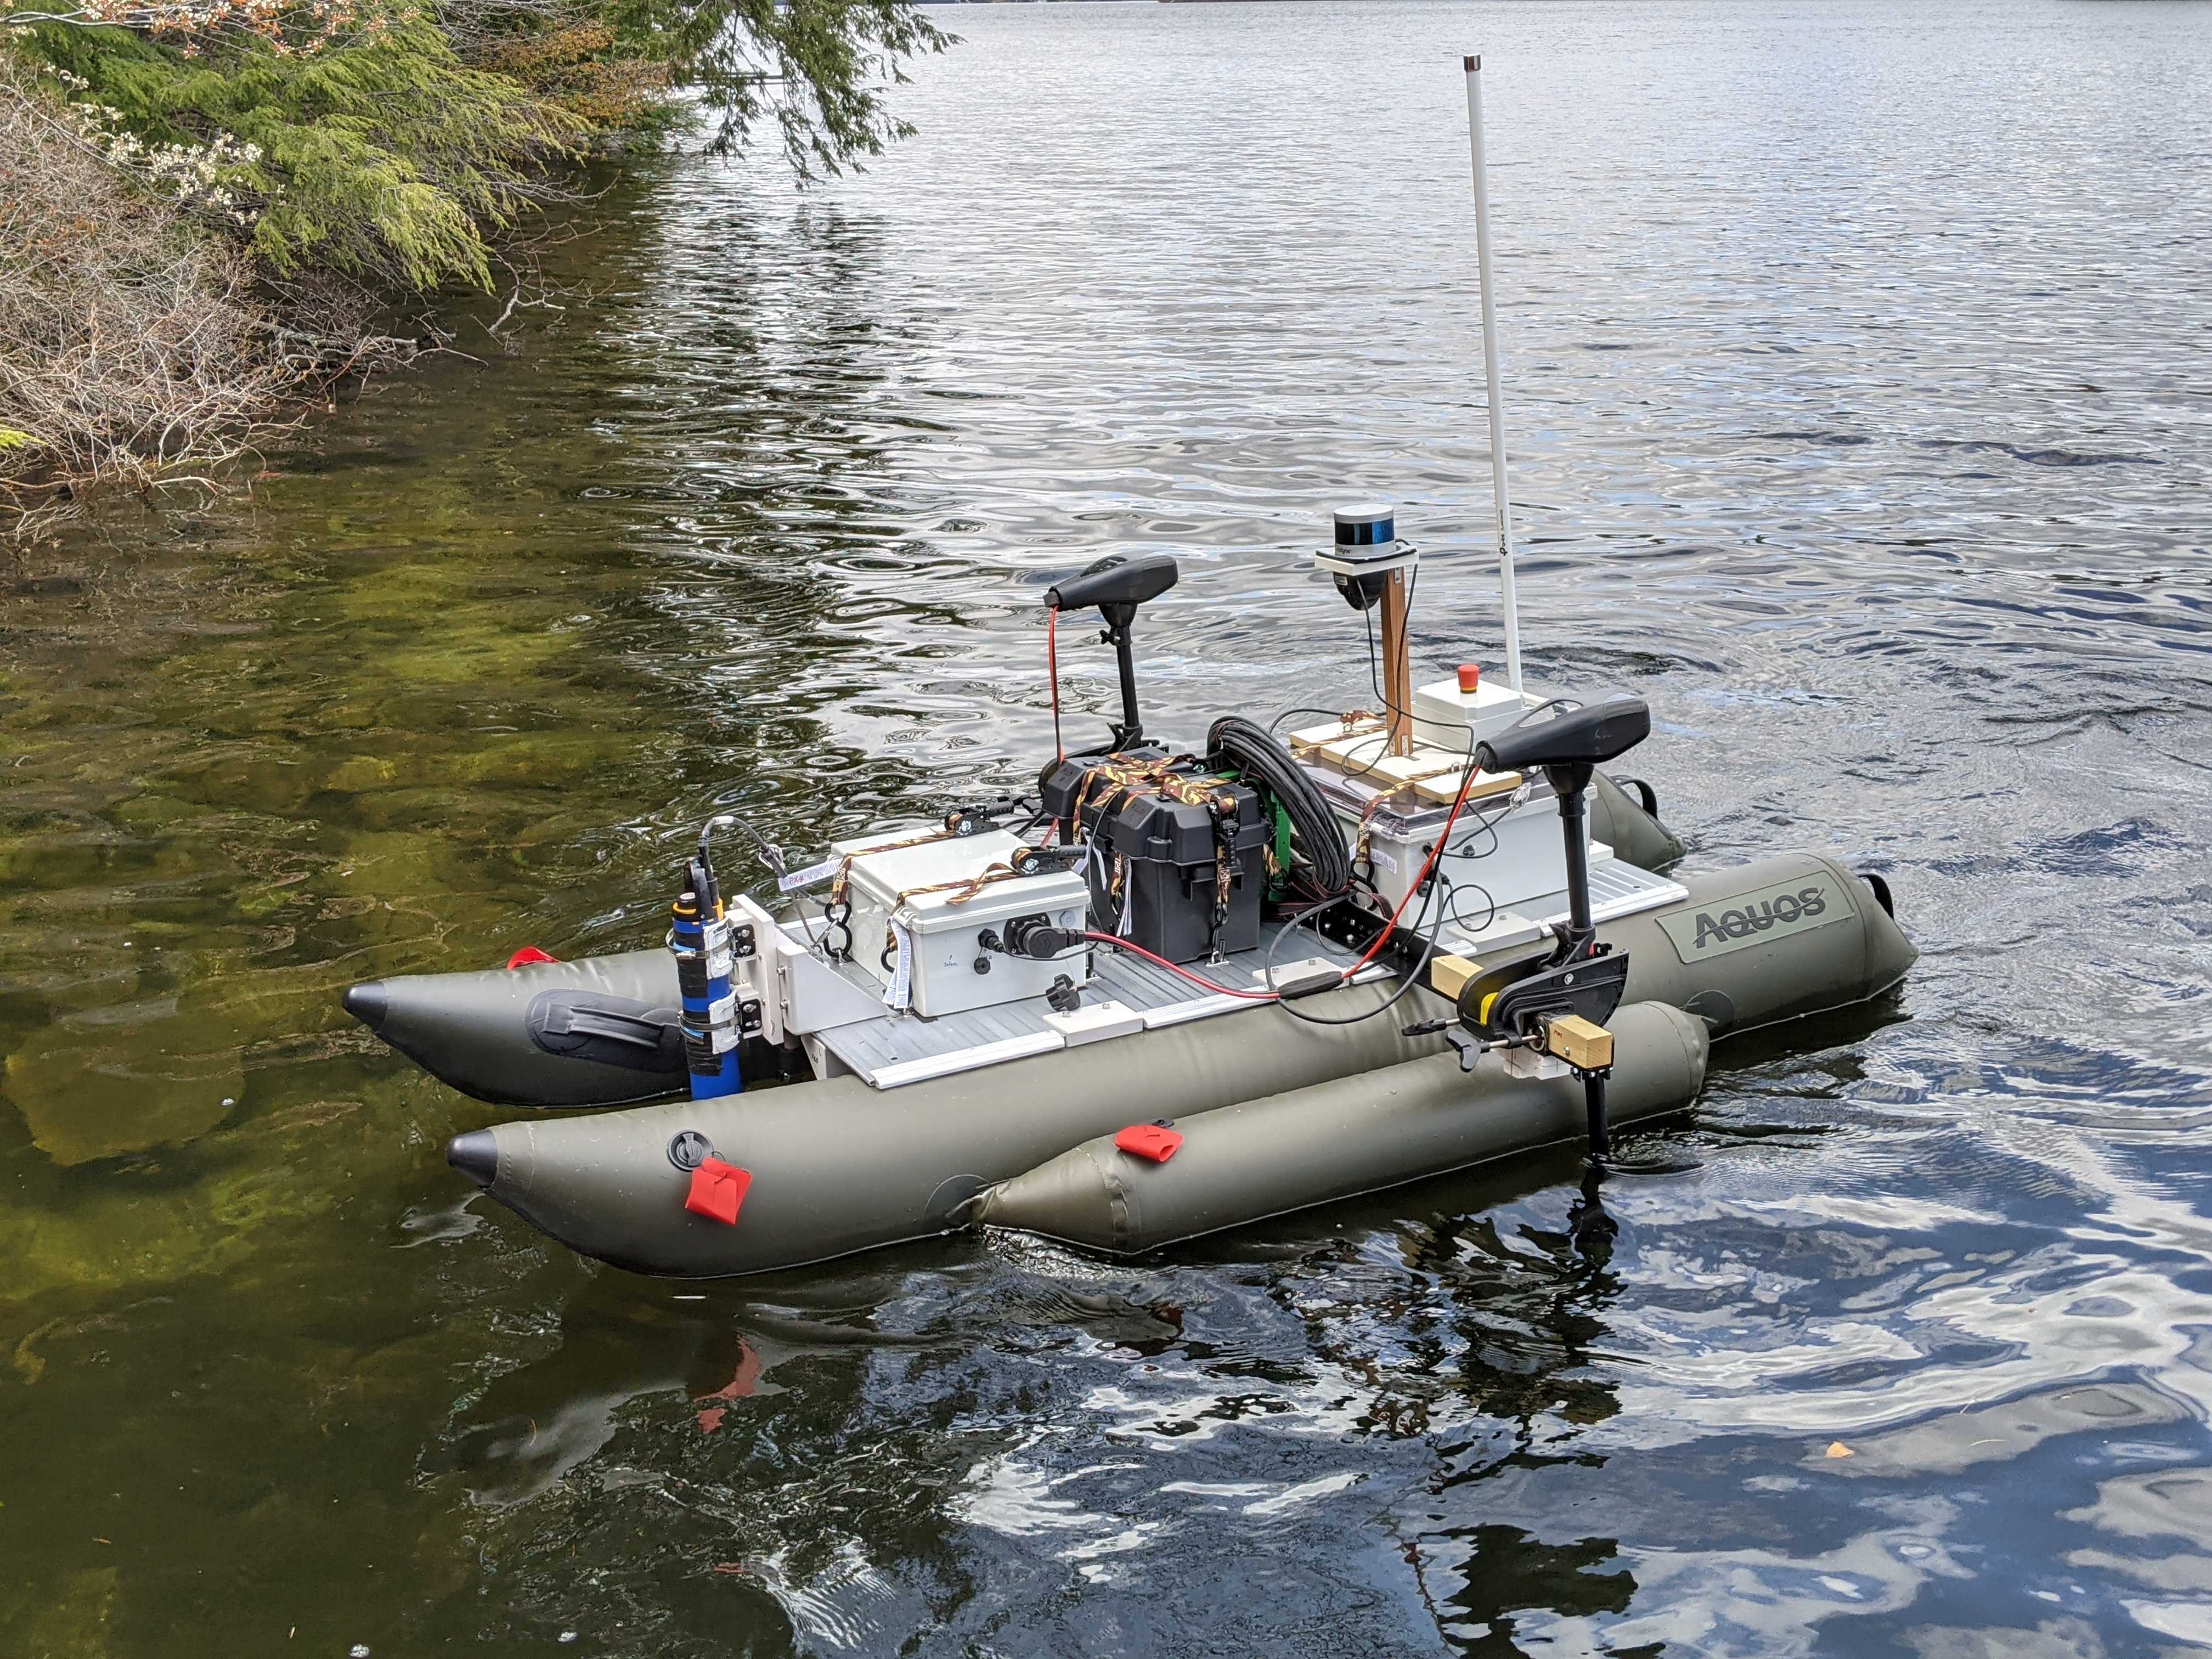
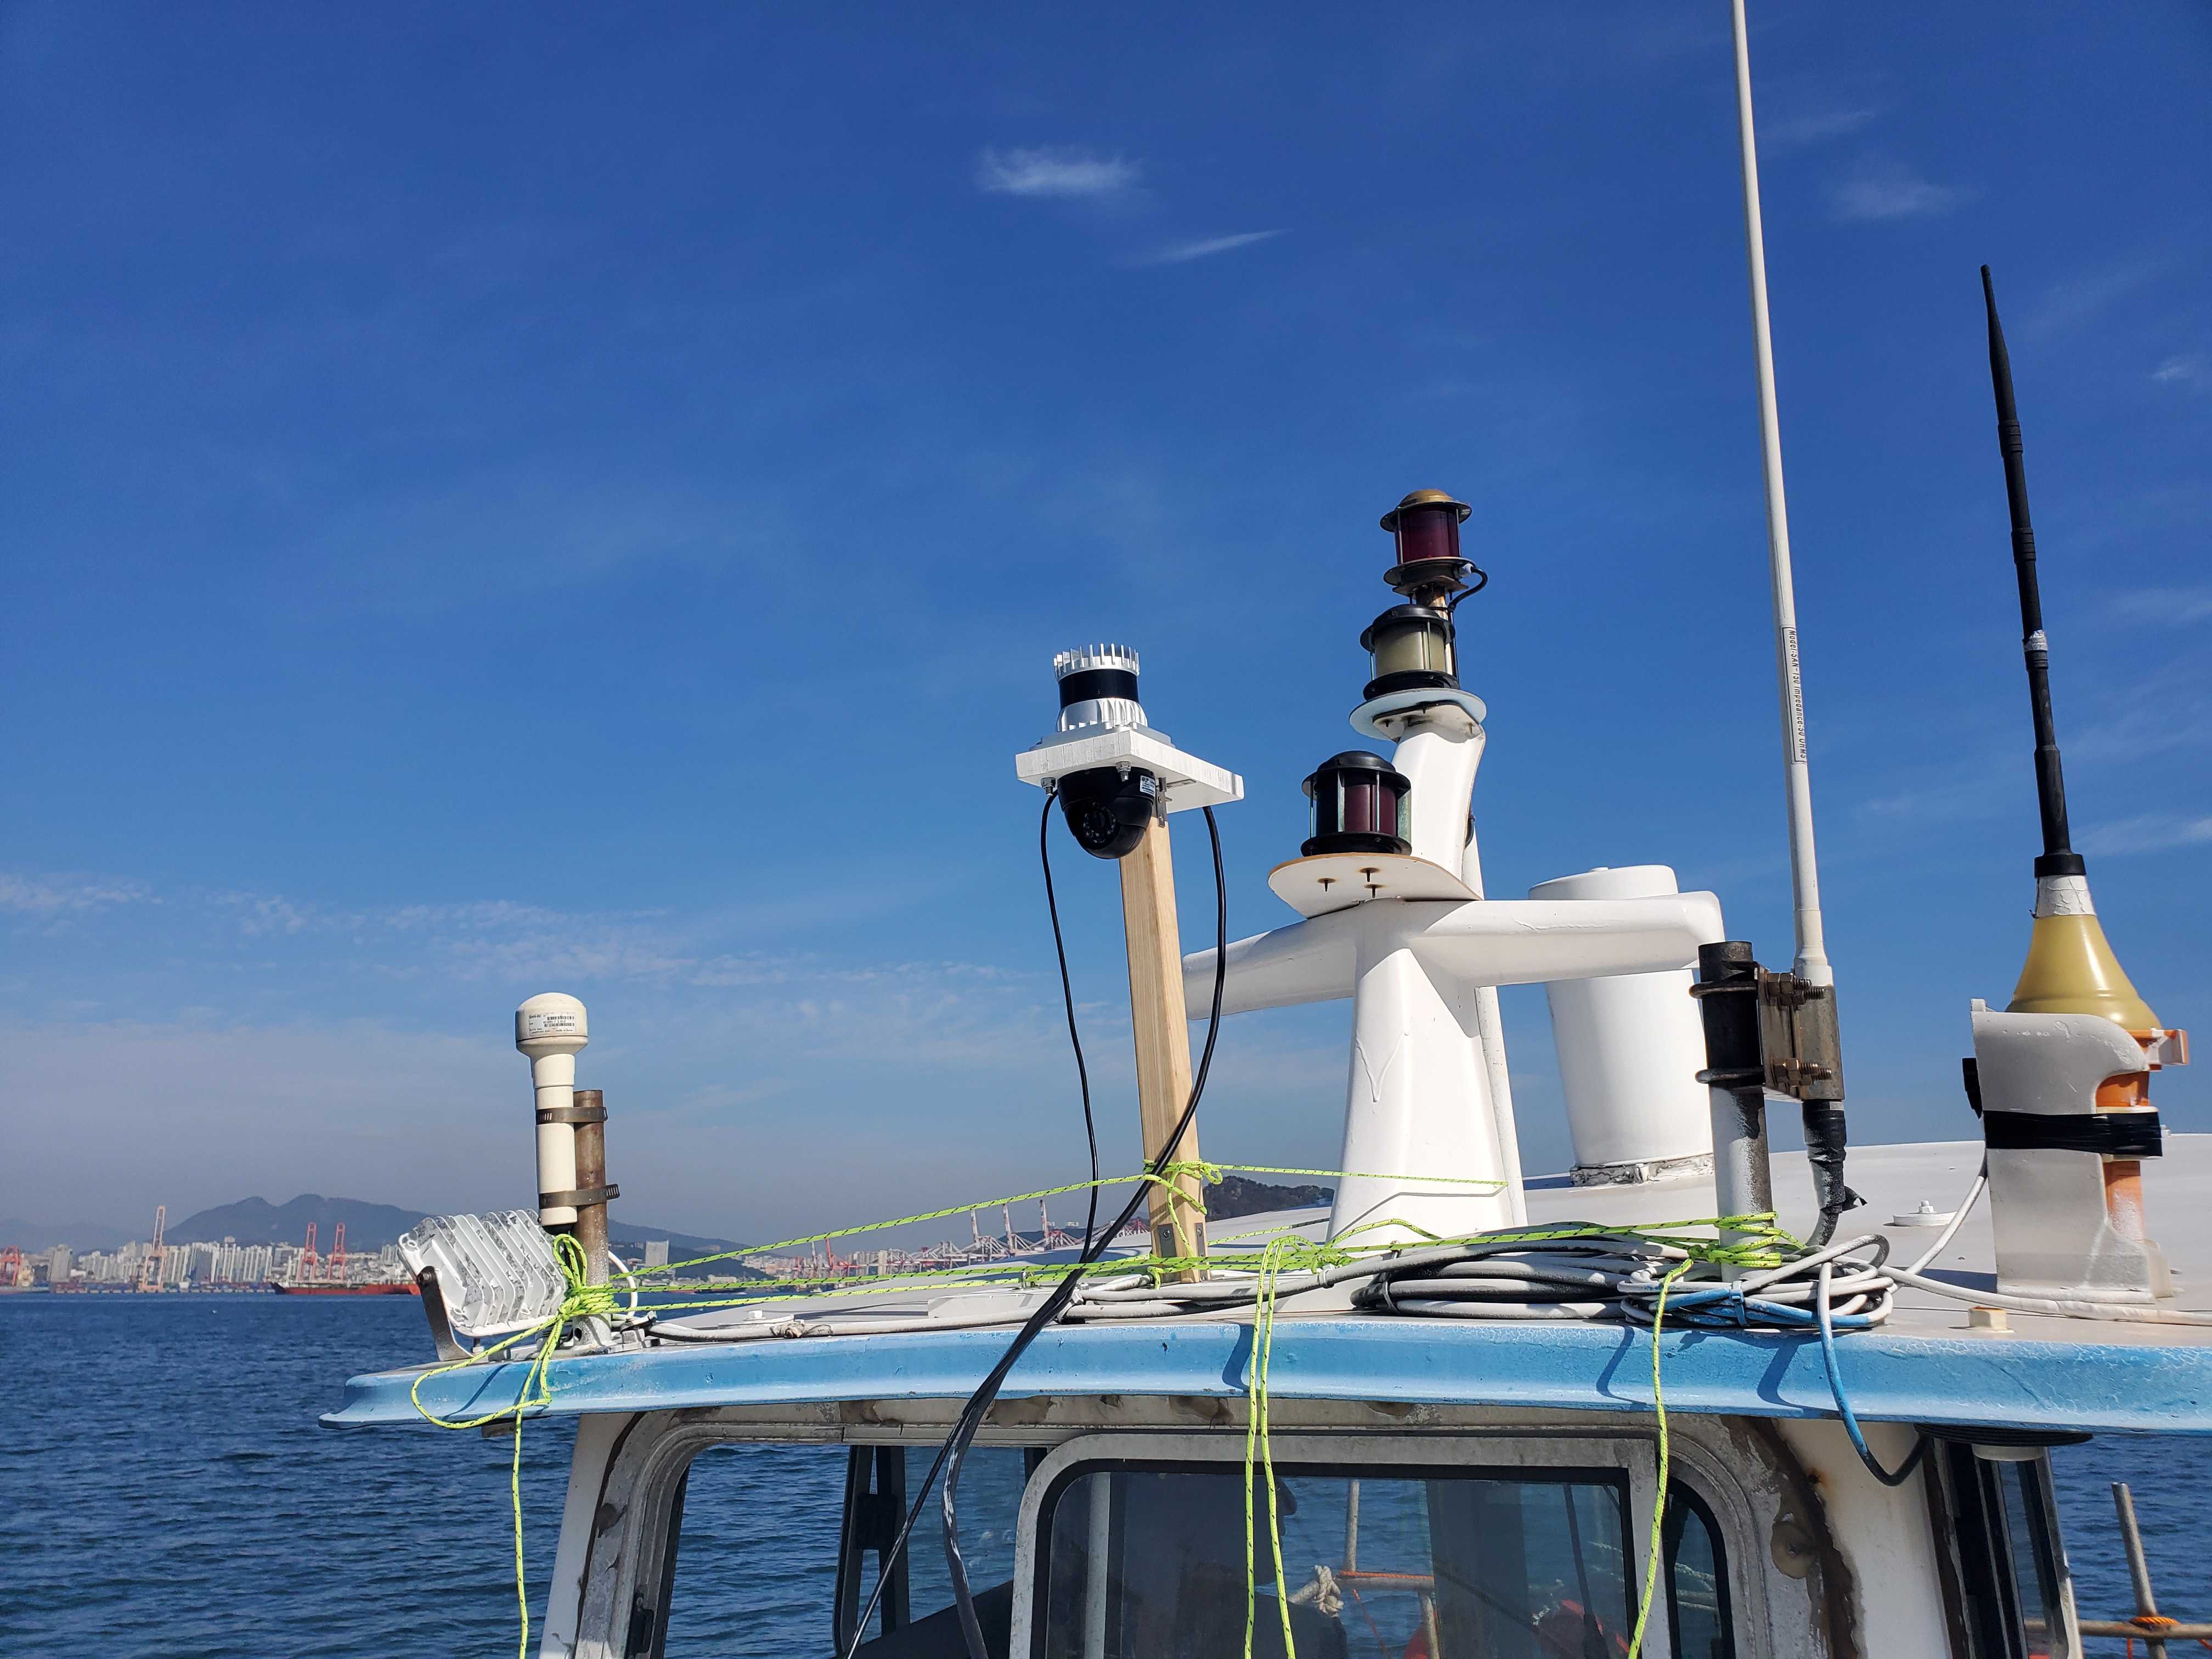
As shown in Fig. 2, we used our custom ASV Catabot and a human-driven boat installed with a sensor platform. Catabot is long, wide. The human-driven boat is long, wide. Both include a Global Positioning System (GPS) / Compass and Inertial Measurement Unit (IMU) with a flight controller unit, installed at the center line of the vehicle, to record proprioceptive data. We used a low-cost u-blox M8N GPSCompass module. The flight controller hardware we used was a Pixhawk 4 coupled with a 32-Bit Arm Cortex-M7 microcontroller with a clock speed and of flash memory and of RAM.
For exteroceptive data, we installed a RGB camera (Full-HD 1080P with CMOS OV2710 image sensor that can support Infrared (IR) during the nighttime) and a channel LiDAR (Ouster OS1-64 gen2). The two exteroceptive sensors were located at the center line of the vehicles to ensure a sufficient horizontal field of view (Camera – ; LiDAR – except for the blind sector due to occlusion caused by the vehicle structure) and vertical field of view (Camera – ; LiDAR – ). The LiDAR has a range of with a horizontal resolution of and vertical resolution of , while the camera sensor has a pixel resolution. We performed intrinsic calibration of each sensor and an extrinsic calibration between LiDAR and the camera based on [25, 26].
III-B Data Collection
We used a companion computer system (Intel NUC) and recorded proprioceptive (GPS, Compass, IMU) and exteroceptive (RGB camera, LiDAR) data via the Robot Operating System (ROS). Our Intel NUC computer with Ubuntu 18.04 installed has an Intel Core i7-8559U Processor (8M Cache, up to ) with of storage. The heterogeneous sensors operate at different time frequencies: we used a camera with a frequency of and LiDAR with a frequency of . We post-process the camera and LiDAR data by extracting raw images and point clouds under time synchronization using the MessageFilter package [27].
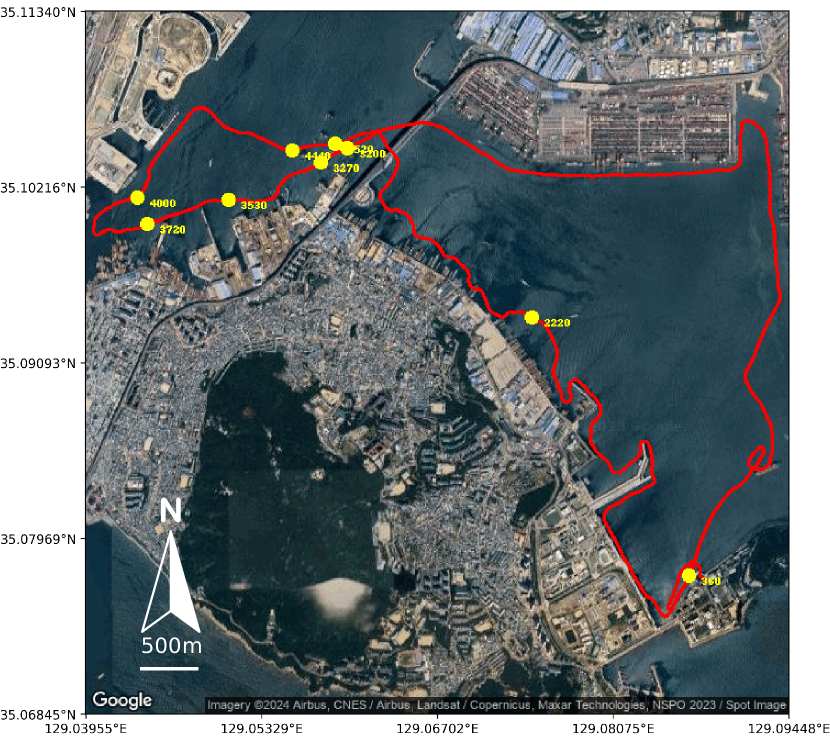
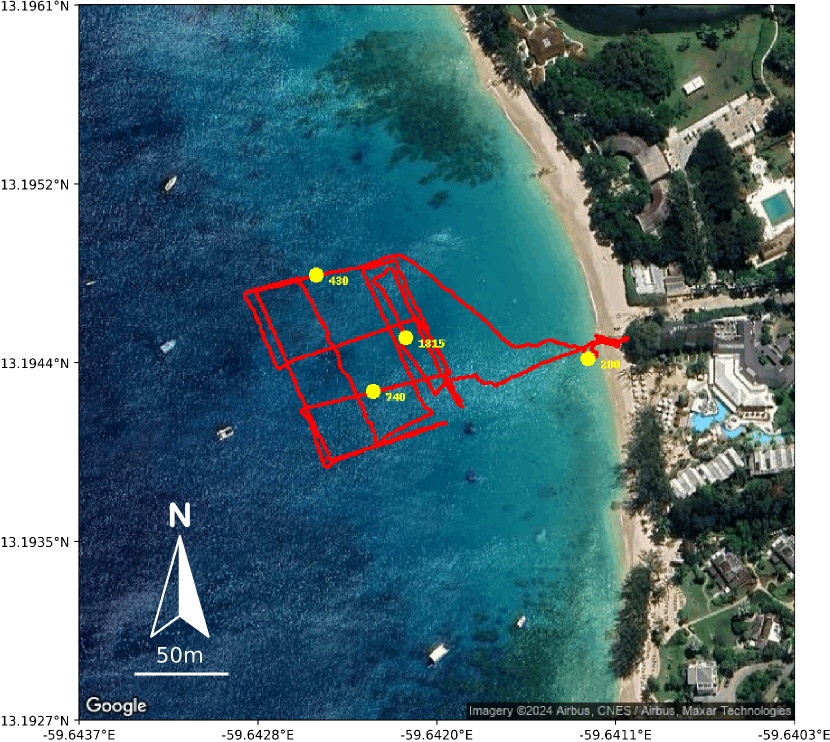
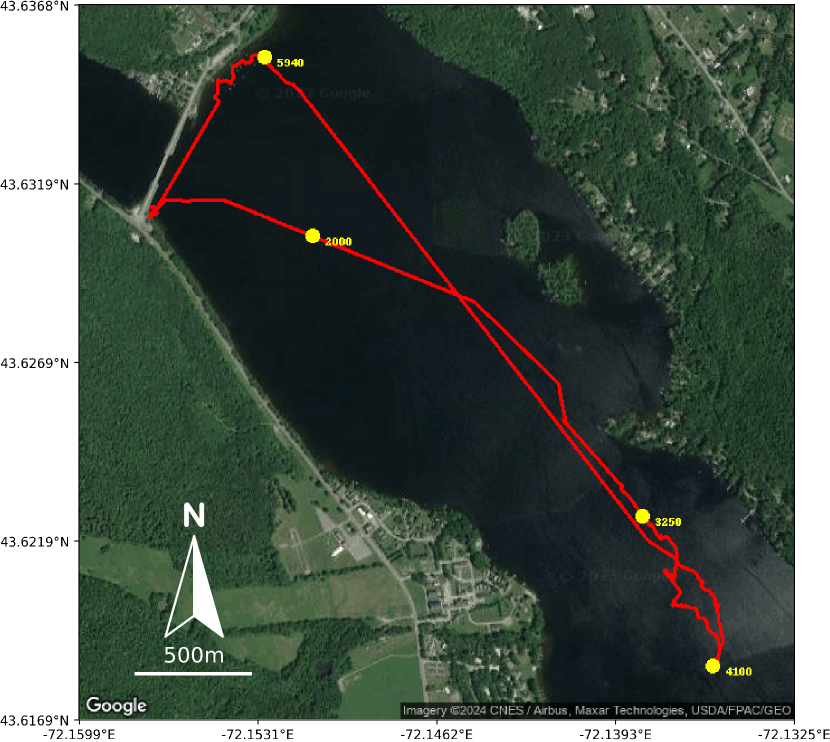
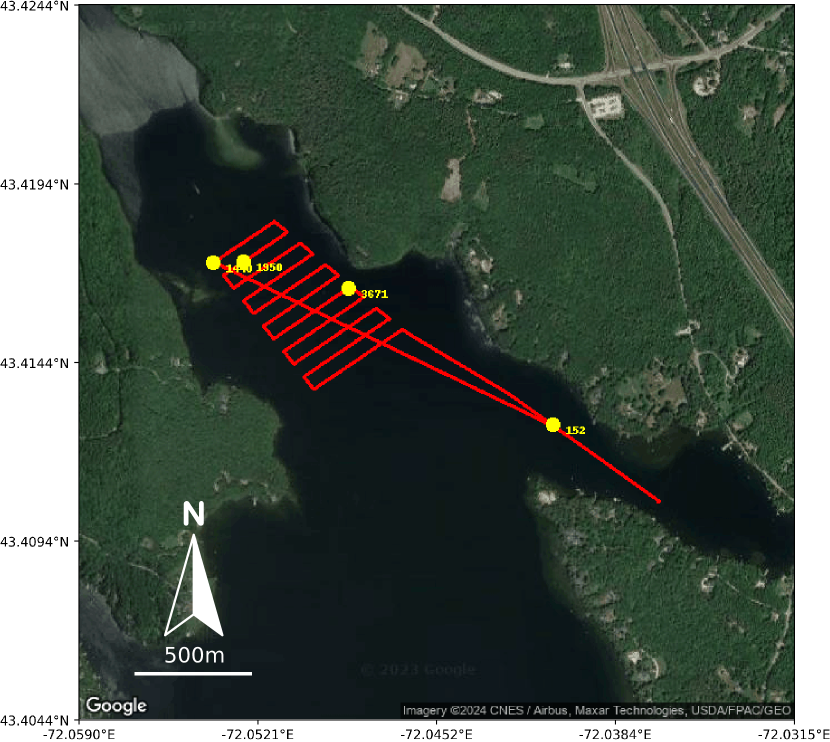
We collected relevant data in waters with varying environmental conditions . We controlled the ASV via either (1) autonomous waypoint following or (2) manual driving, while we manually navigated the human-driven boat. Fig. 3 shows the trajectories during data collection. Our dataset covers collections conducted between to in different geographic locations: Lake Sunapee, NH, USA; Lake Mascoma, NH, USA; Busan Port, South Korea; Holetown, Barbados.
III-C Annotation Process
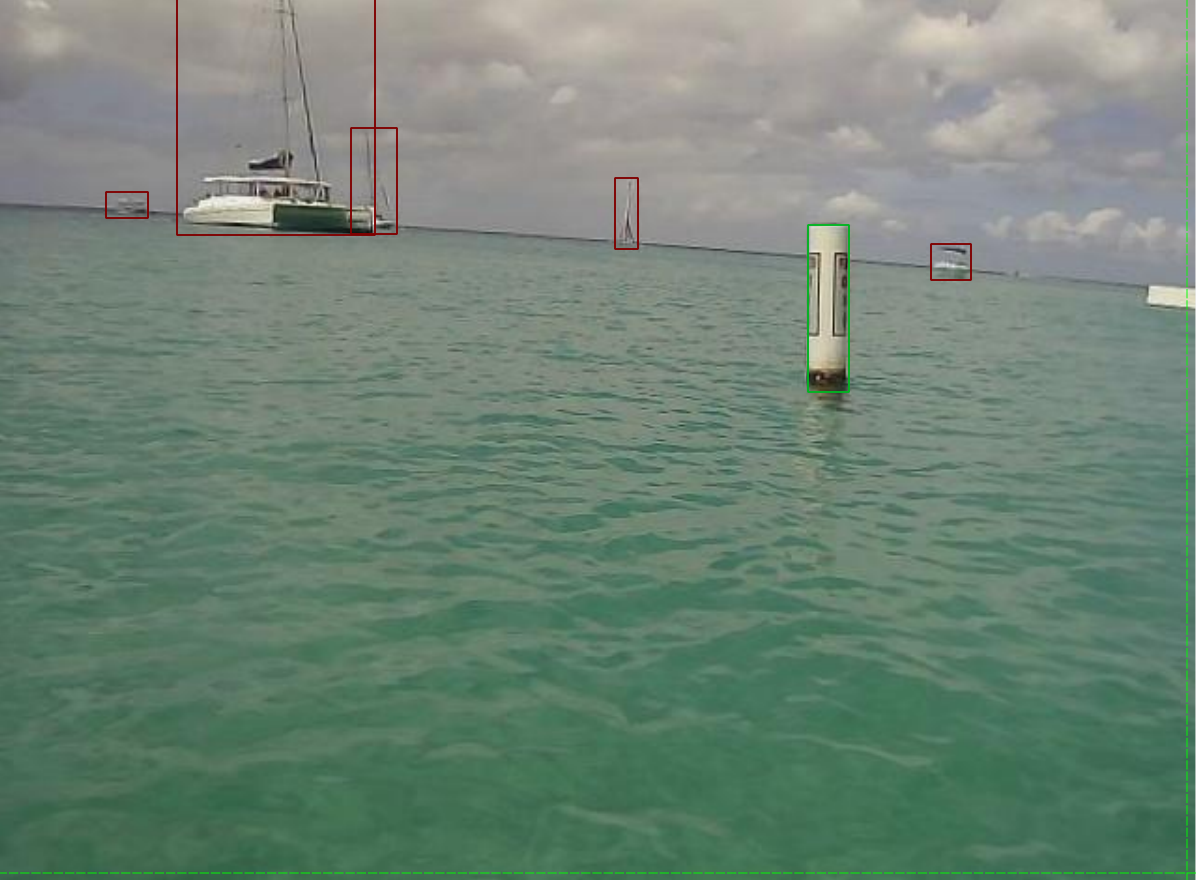
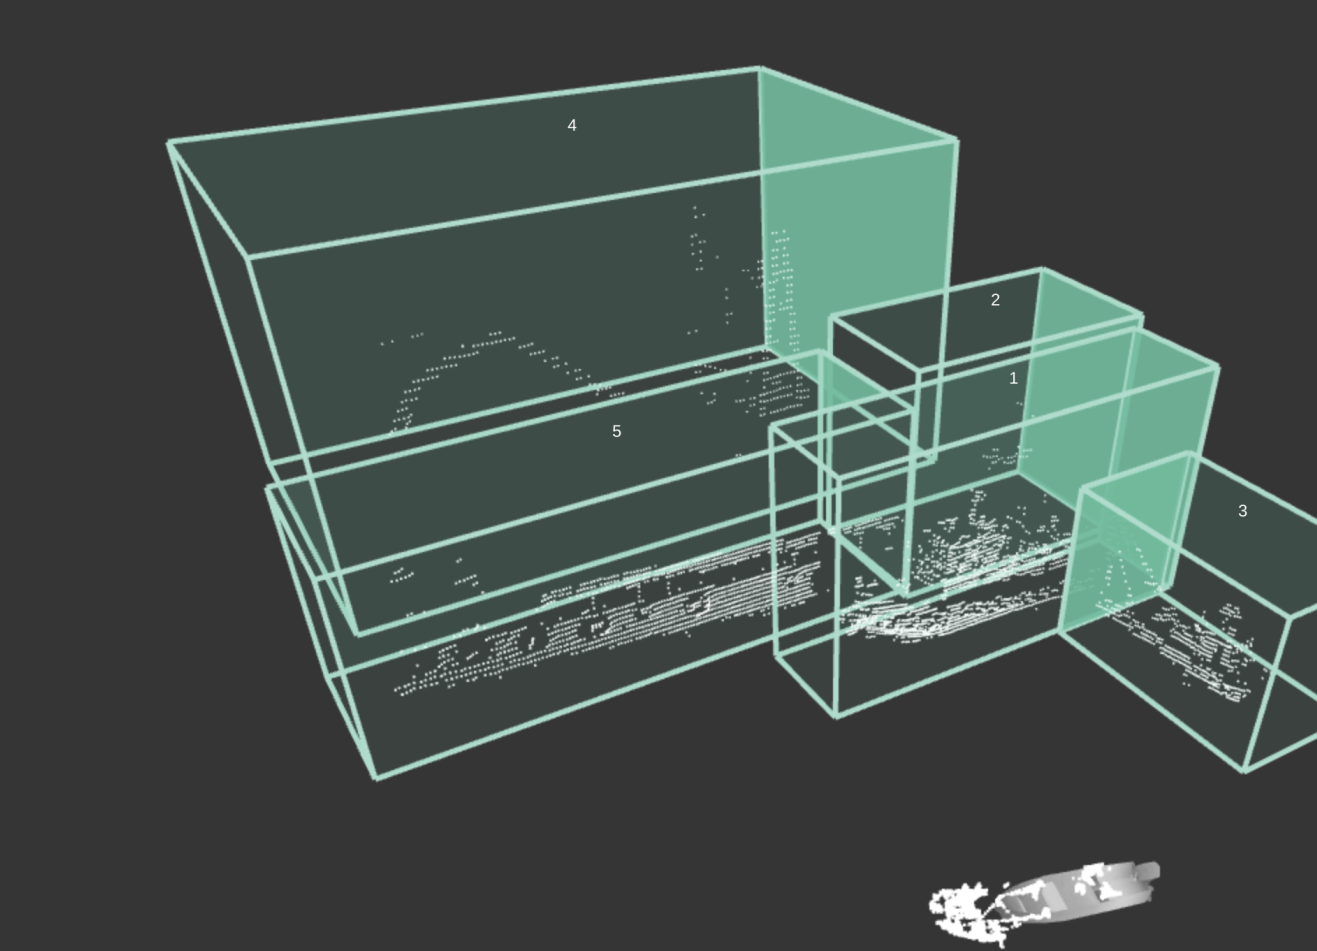
We provide annotations of three in-water object classes based on domain knowledge (example shown in Fig. 4): ship, buoy, and other, in both the camera imagery and LiDAR point clouds. More specifically, (1) the ship class represents all marine vehicles defined according to the international traffic rule [3]; (2) the buoy class represents artificial floating objects as defined by the International Maritime Buoyage System [21]; and (3) the other class represents any in-water objects that can be risky to maritime navigation, e.g., dock. We provide ontology documentation for labeling annotation consistency and dataset usage. For the LiDAR point clouds, we used an open-source labeling tool [28] with 3 rounds of annotation review by the team members. For the images, we used the 3rd party Amazon AWS Mechanical Turk annotation service in addition to the annotation by team members using the open-source Anylabeling [29] tool and model-assisted labeling using Meta Research’s Segment Anything Model (SAM) [30] with the same principle of review processes.
III-D Dataset Characteristic
As described in detail below, we propose novel metrics (e.g., BEVE-P, BEVE-V, DVE) in addition to existing metrics (e.g., image entropy, occlusion percentage) in the literature that quantitatively evaluate the dataset’s characteristics with respect to the maritime domain to help analyze future benchmark algorithms.
Dataset Difficulty Metrics: To evaluate the difficulty characteristic of the dataset, inspired by [4], we propose and measure the following metrics tailored to the marine domain.
-
•
Average Brightness: Measures the overall light level in images, affecting object visibility.
-
•
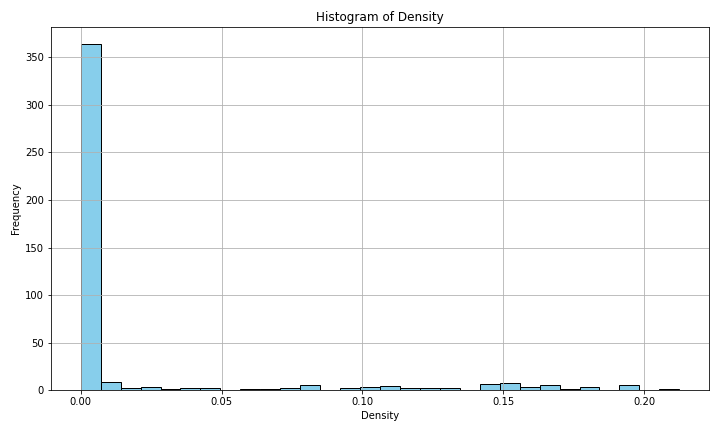
Density: The ratio of the area covered by objects to the total image area, indicating how crowded an image is.
-
•
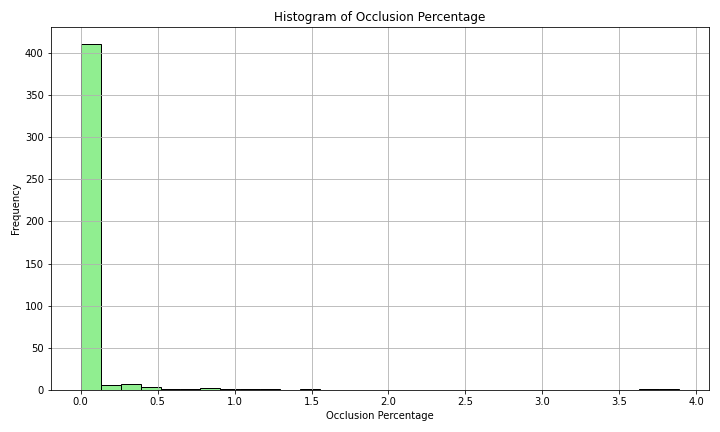
Occlusion Percentage: The proportion of object areas that overlap, showing how much objects hide each other.
-
•
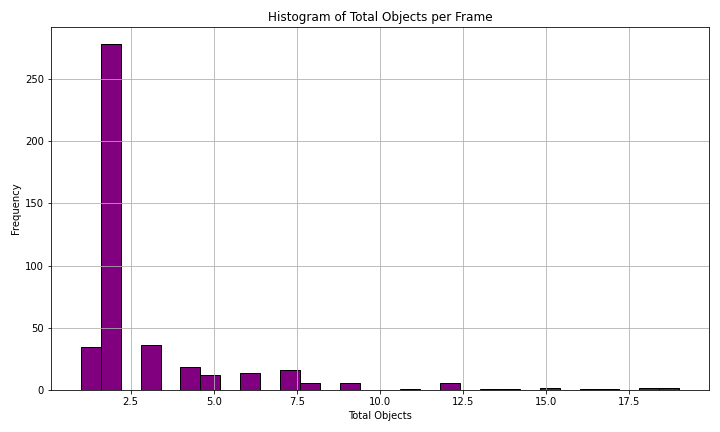
Total Objects: The count of objects in an image, indicating the potential complexity of the scene.
-
•
Minimum Area: The size of the smallest object in the dataset, highlighting challenges in detecting small objects.
-
•
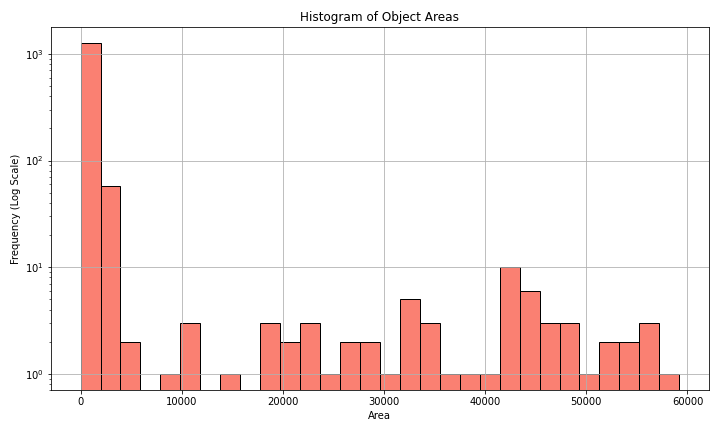
Objects Label and Area: A list of objects and their sizes, providing insight into the variety and scale of objects present.
Dataset Complexity Metrics: To evaluate the complexity and variability of the dataset, we propose and measure the following metrics.
-
•
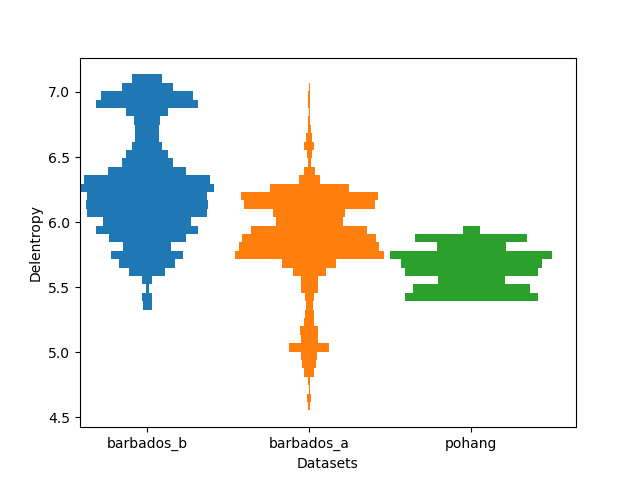
Image Complexity: Measures the image entropy by first applying the convolutional Sobel operator to approximate the gradient at each image pixel and then calculating the Shannon entropy. Note, instead of the Sobel-based gradient, any other edge detection algorithm, such as Canny Edge detector, can work. Overall, image entropy describes the complexity of the dataset; a low value corresponds to images with less edges and possibly fewer interesting features, while a high value corresponds to images with significant amount of texture or information, each with their own challenges. This evaluation criterion is similar to the work done by [31] to evaluate the variation in the underwater dataset.
-
•
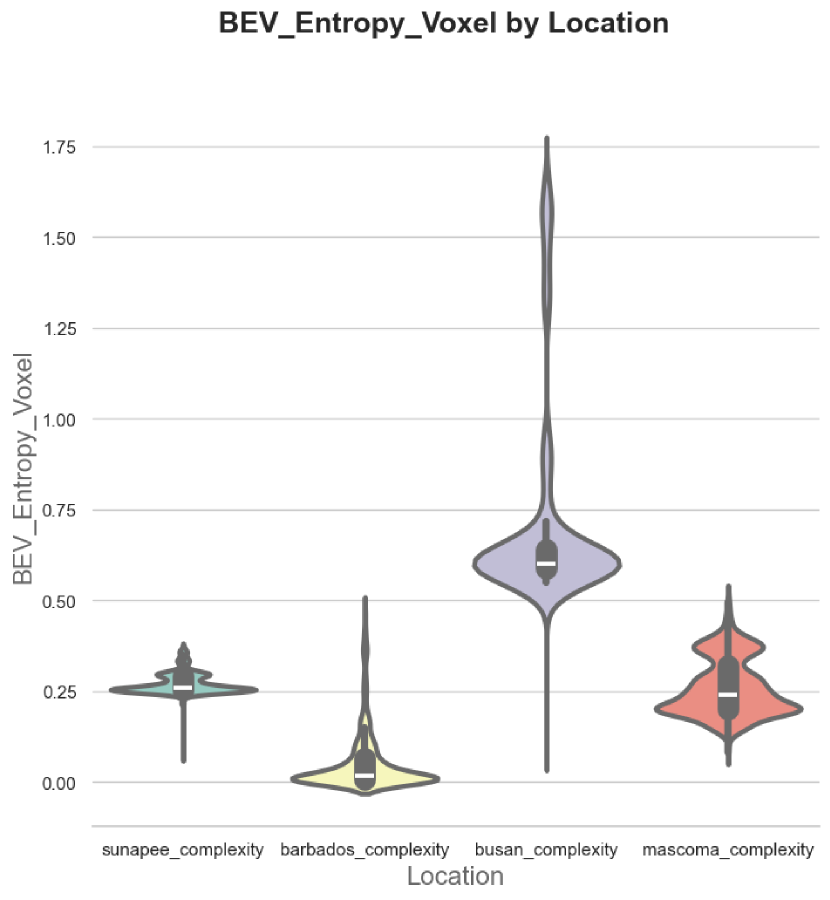
Birds-Eye-View Entropy with Pillar/Voxel (BEVE-P, BEVE-V): Measures the point cloud complexity with respect to point pillar/volxel bin based on where stands for each pillar or voxel, total number of points in that specific frame, and the number of point clouds per each pillar or voxel.
-
•
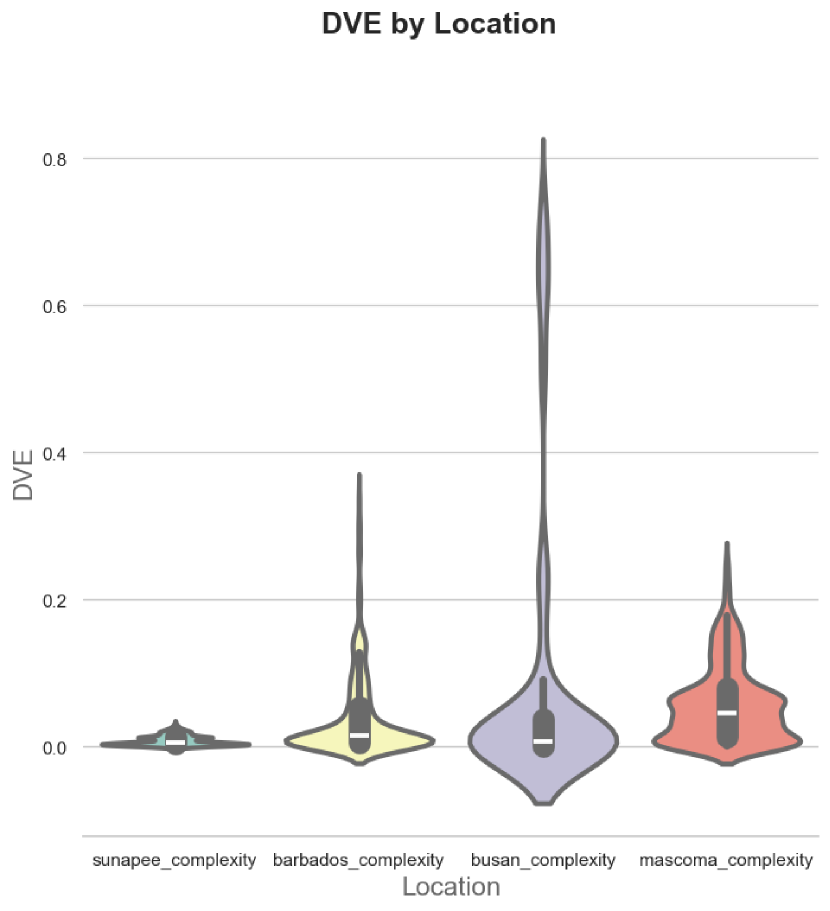
Distance Variability Entropy (DVE): Measures the point cloud complexity with respect to point pillar/voxel bin based on where represents the i-th predefined distance interval, total number of points in that specific frame, and is the number of point clouds in the respective distance bucket ring.
IV Dataset Evaluation
IV-A Collected Data
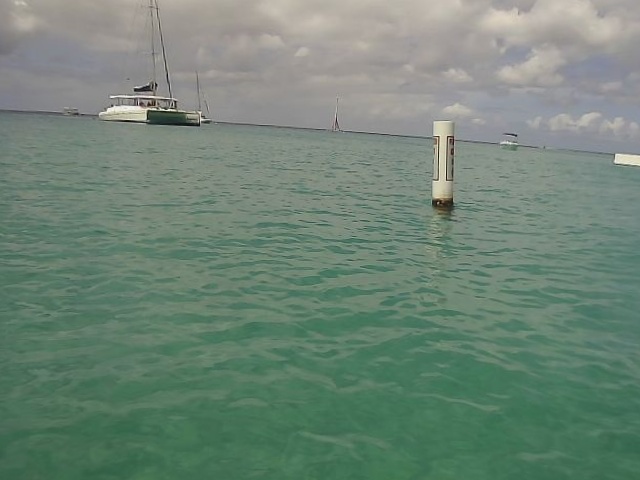
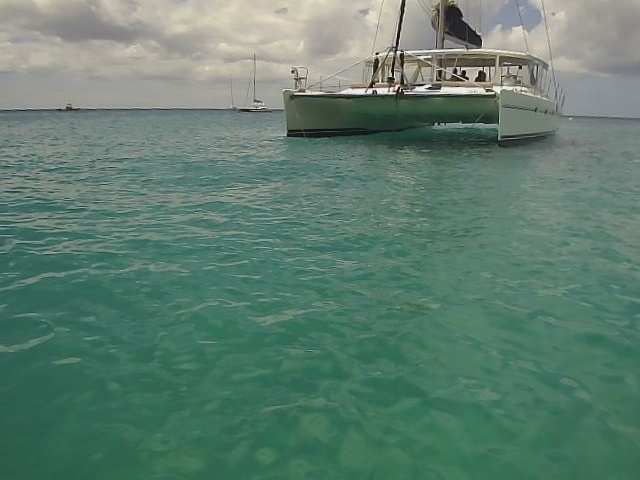
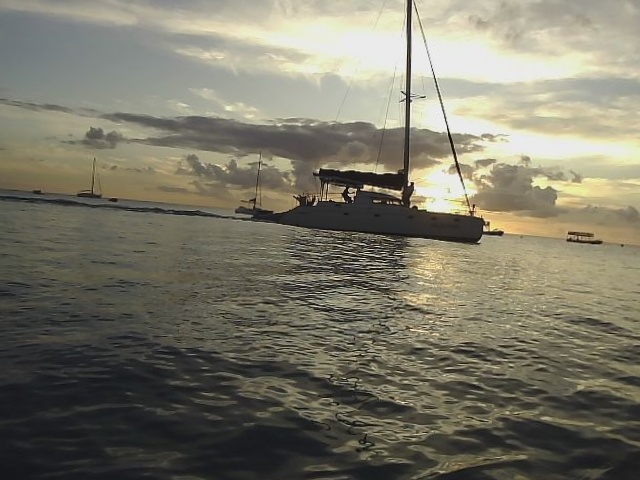
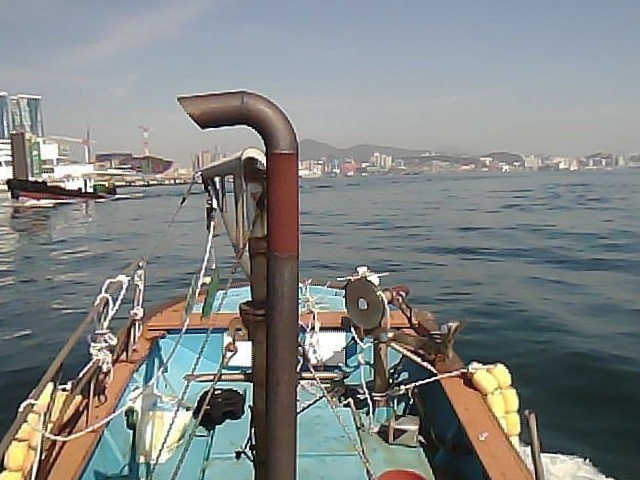
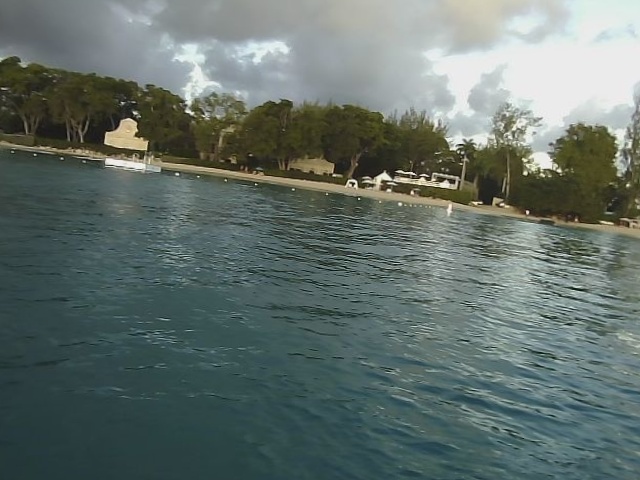
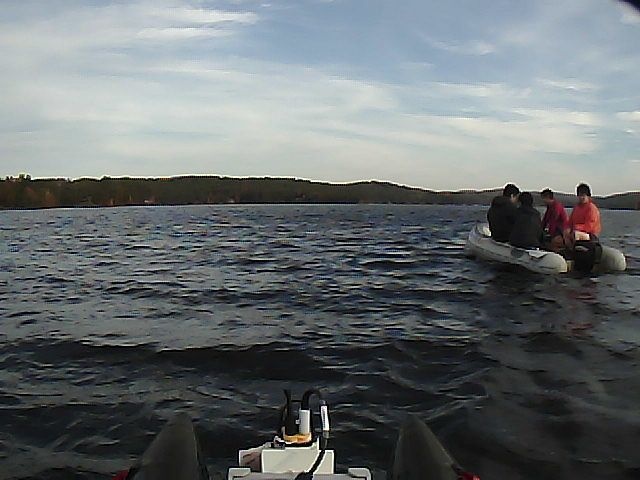
As shown in Fig. 5, our maritime perception dataset consists of various objects in water under varying conditions collected by the sensor platforms onboard ASVs or the human-driven ship. This annotated and ego-perspective dataset is first in the maritime domain, to the best of our knowledge with sufficiently large number of annotated frames (). We believe it will be useful for training, validating, and benchmarking maritime perception.
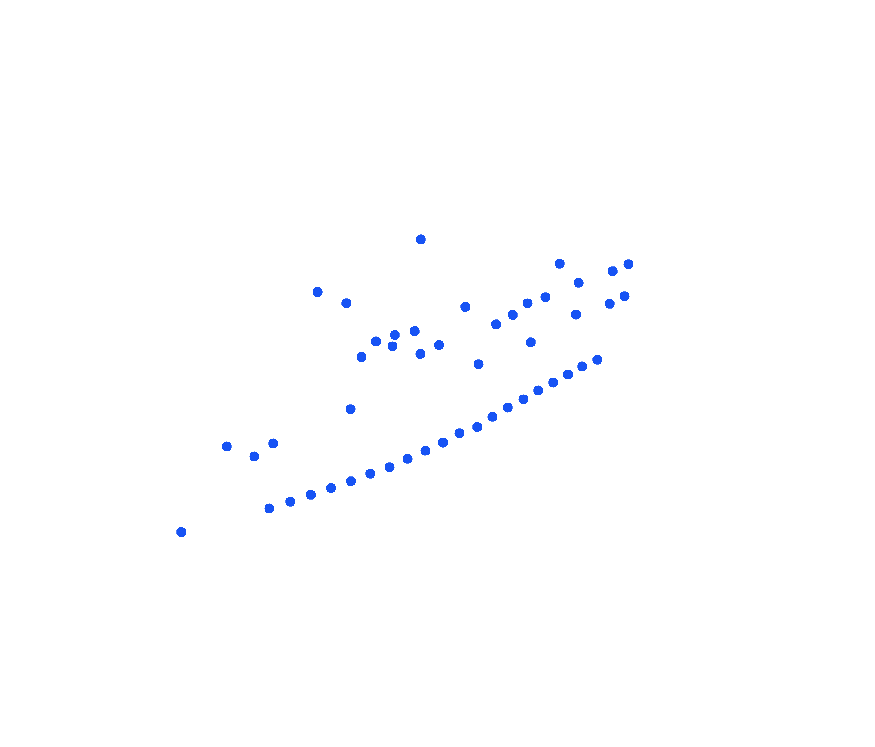
Based on the proposed metric framework in Section III-D, we evaluate the characteristics within our dataset. (1) Fig. 6 shows ‘Density’, ‘Occlusion Percentage’, ‘Object Areas’, and ‘Total Objects’ across frames over time in an example sequence. This approach enables a clear visualization of trends and variations in the dataset, providing insights into its complexity and the challenges it presents at different points in time. (2) Fig. 7 shows the complexity of the dataset within the images collected. Compared to the [23] multi-modal dataset, our dataset includes much more diverse scenes that can be useful for field testing of autonomy. Lastly, (3) Fig. 8 shows the proposed complexity metrics of the dataset within the collected point clouds, indicating that we have varying spatial distributions of in-water objects.
IV-B Perception Benchmark Running
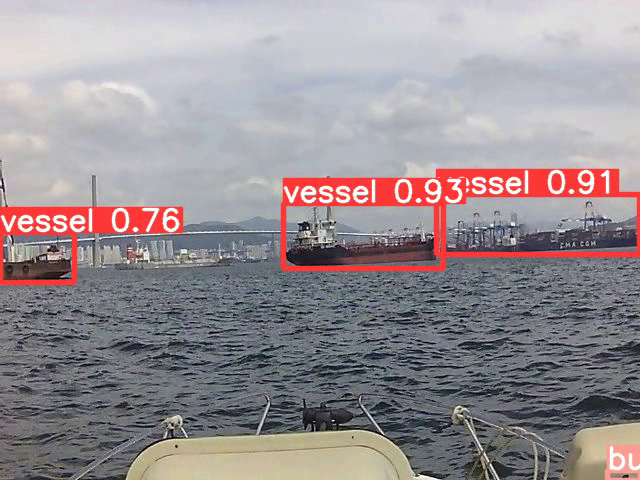
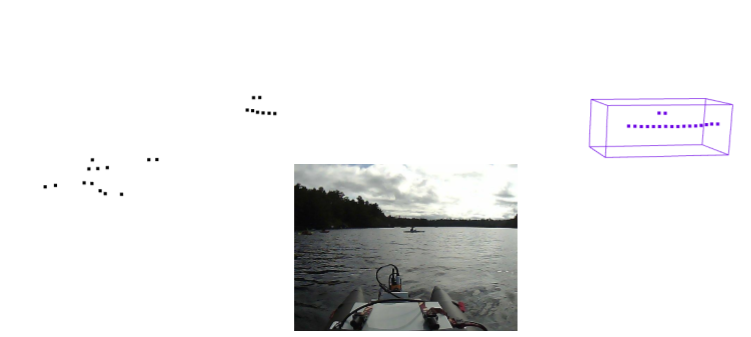
We built a framework with our proposed dataset to run the perception benchmark for tasks such as object detection and object classification. We applied one of the most popular state-of-the-art benchmarks for images and point clouds, respectively, YOLOv5 [18] and PointPillar [17] as shown in Fig. 9. We applied a transfer learning approach and fine-tuned the pre-trained, open-sourced models in each case. Based on the ground truth labels generated in Section III-C, we will release a complete analytical toolset to run training tailored to the maritime domain and evaluations on different benchmarks, such as image-based, point cloud-based, and fusion-based algorithms.
V Discussion and Future Steps
This paper introduces the first soon-to-be publicly accessible multi-modal perception dataset for autonomous maritime navigation, focusing on in-water obstacles within the aquatic environment to enhance situational awareness for ASVs. Our dataset, comprising diverse in-water objects encountered under varying environmental conditions, aims to bridge the research gap in marine robotics by providing a multi-modal, annotated, and ego-centric perception dataset for object detection and classification.
Based on our dataset, we plan to rigorously evaluate benchmark algorithms, offering insights into the applicability and adaptability of these benchmarks which have not yet been explored in the maritime domain. Our future work will include integrating additional sensor configurations under varying weather conditions (e.g., rain, snow), such as marine RADAR and wide-field-of-view cameras, to enhance robustness.
ACKNOWLEDGMENT
We would like to thank Kizito Masaba, Julien Blanchet, Haesang Jeong, and Capt. Jinmyeong Lee for help with field experiments, and Korea Maritime and Ocean University, McGill Bellairs Research Institute, and the Eliassen family for our access to the experimental sites. This work is supported in part by the Burke Research Initiation Award, NSF CNS-1919647, 2144624, OIA1923004, and NH Sea Grant.
References
- [1] United Nations “Review of Maritime Transport 2021.” United Nations Conference on TradeDevelopment, 2022
- [2] “Unmanned Surface Vehicle Market Size, Share, Competitive Landscape and Trend Analysis Report by Size, by Application, by Mode of Operation: Global Opportunity Analysis and Industry Forecast, 2023-2032” Allied Market Research, 2023
- [3] International Maritime Organization “Convention on the International Regulations for Preventing Collisions at Sea, 1972 (COLREGs)”, 1972
- [4] Andreas Geiger, Philip Lenz, Christoph Stiller and Raquel Urtasun “Vision meets Robotics: The KITTI Dataset” In International Journal of Robotics Research (IJRR), 2013
- [5] Holger Caesar, Varun Bankiti, Alex H. Lang, Sourabh Vora, Venice Erin Liong, Qiang Xu, Anush Krishnan, Yu Pan, Giancarlo Baldan and Oscar Beijbom “nuScenes: A multimodal dataset for autonomous driving” In IEEE/CVF Conference on Computer Vision and Pattern Recognition (CVPR), 2019
- [6] Pei Sun, Henrik Kretzschmar, Xerxes Dotiwalla, Aurelien Chouard, Vijaysai Patnaik, Paul Tsui, James Guo, Yin Zhou, Yuning Chai, Benjamin Caine, Vijay Vasudevan, Wei Han, Jiquan Ngiam, Hang Zhao, Aleksei Timofeev, Scott Ettinger, Maxim Krivokon, Amy Gao, Aditya Joshi, Yu Zhang, Jonathon Shlens, Zhifeng Chen and Dragomir Anguelov “Scalability in Perception for Autonomous Driving: Waymo Open Dataset” In IEEE/CVF Conference on Computer Vision and Pattern Recognition (CVPR), 2020
- [7] Shailesh Nirgudkar, Michael DeFilippo, Michael Sacarny, Michael Benjamin and Paul Robinette “MassMIND: Massachusetts Maritime INfrared Dataset” In The International Journal of Robotics Research 42.1–2, 2023, pp. 21–32
- [8] Mabel M. Zhang, Jean Choi, Kostas Daniilidis, Michael T. Wolf and Christopher Kanan “VAIS: A dataset for recognizing maritime imagery in the visible and infrared spectrums” In IEEE Conference on Computer Vision and Pattern Recognition Workshops (CVPRW), 2015, pp. 10–16
- [9] Erhan Gundogdu, Berkan Solmaz, Veysel Yücesoy and Aykut Koç “MARVEL: A Large-Scale Image Dataset for Maritime Vessels” In Asian Conference on Computer Vision, 2016
- [10] Zhenfeng Shao, Wenjing Wu, Zhongyuan Wang, Wan Du and Chengyuan Li “SeaShips: A Large-Scale Precisely Annotated Dataset for Ship Detection” In IEEE Transactions on Multimedia 20.10, 2018, pp. 2593–2604
- [11] Zhiguo Zhou, Jiaen Sun, Jiabao Yu, Kaiyuan Liu, Junwei Duan, Long Chen and C.. Chen “An Image-Based Benchmark Dataset and a Novel Object Detector for Water Surface Object Detection” In Frontiers in Neurorobotics 15, 2021
- [12] Parneet Kaur, Arslan Aziz, Darshan Jain, Harshil Patel, Jonathan Hirokawa, Lachlan Townsend, Christoph Reimers and Fiona Hua “Sea Situational Awareness (SeaSAw) Dataset” In IEEE/CVF Conference on Computer Vision and Pattern Recognition Workshops (CVPRW), 2022, pp. 2578–2586
- [13] Matej Kristan, Vildana Sulic Kenk, Stanislav Kovacic and Janez Pers “Fast Image-Based Obstacle Detection From Unmanned Surface Vehicles” In IEEE Transactions on Cybernetics 46, 2015, pp. 641–654
- [14] Borja Bovcon, Rok Mandeljc, Janez Perš and Matej Kristan “Stereo obstacle detection for unmanned surface vehicles by IMU-assisted semantic segmentation” In Robotics and Autonomous Systems, 2018
- [15] Borja Bovcon, Jon Muhovic, Dusko Vranac, Dean Mozetic, Janez Pers and Matej Kristan “MODS—A USV-Oriented Object Detection and Obstacle Segmentation Benchmark” In IEEE Transactions on Intelligent Transportation Systems 23.8, 2022, pp. 13403–13418
- [16] Thomas Clunie, Michael DeFilippo, Michael Sacarny and Paul Robinette “Development of a Perception System for an Autonomous Surface Vehicle using Monocular Camera, LIDAR, and Marine RADAR” In IEEE International Conference on Robotics and Automation (ICRA), 2021, pp. 14112–14119
- [17] Alex H. Lang, Sourabh Vora, Holger Caesar, Lubing Zhou, Jiong Yang and Oscar Beijbom “PointPillars: Fast Encoders for Object Detection From Point Clouds” In IEEE/CVF Conference on Computer Vision and Pattern Recognition (CVPR), 2018, pp. 12689–12697
- [18] Ultralytics “ultralytics/yolov5: v7.0 - YOLOv5 SOTA Realtime Instance Segmentation” Accessed: 7th May, 2023, https://github.com/ultralytics/yolov5.com, 2022 DOI: 10.5281/zenodo.7347926
- [19] Waleed Abdulla “Mask R-CNN for object detection and instance segmentation on Keras and TensorFlow” In GitHub repository Github, https://github.com/matterport/Mask_RCNN, 2017
- [20] Tianwei Yin, Xingyi Zhou and Philipp Krahenbuhl “Center-based 3D Object Detection and Tracking” In IEEE/CVF Conference on Computer Vision and Pattern Recognition (CVPR) IEEE, 2021, pp. 11779–11788
- [21] Great Britain Admiralty “IALA Maritime Buoyage System.”, Admiralty Charts and Publications UK Hydrographic Office, 2018
- [22] Yuwei Cheng, Mengxin Jiang, Jiannan Zhu and Yimin Liu “Are We Ready for Unmanned Surface Vehicles in Inland Waterways? The USVInland Multisensor Dataset and Benchmark” In IEEE Robotics and Automation Letters 6, 2021, pp. 3964–3970
- [23] Dongha Chung, Jonghwi Kim, Changyu Lee and Jinwhan Kim “Pohang canal dataset: A multimodal maritime dataset for autonomous navigation in restricted waters” In The International Journal of Robotics Research 42.12, 2023, pp. 1104–1114
- [24] Øystein Kaarstad Helgesen, Kjetil Vasstein, Edmund Førland Brekke and Annette Stahl “Heterogeneous multi-sensor tracking for an autonomous surface vehicle in a littoral environment” In Ocean Engineering 252, 2022
- [25] Jorge Beltrán, Carlos Guindel, Arturo Escalera and Fernando García “Automatic Extrinsic Calibration Method for LiDAR and Camera Sensor Setups” In IEEE Transactions on Intelligent Transportation Systems, 2022
- [26] Gaurav Pandey, James McBride, Silvio Savarese and Ryan Eustice “Automatic Targetless Extrinsic Calibration of a 3D Lidar and Camera by Maximizing Mutual Information” In AAAI Conference on Artificial Intelligence 26.1, 2021, pp. 2053–2059
- [27] “ROS message filter” Accessed: 2023-09-30, https://wiki.ros.org/message_filters
- [28] Walter Zimmer, Akshay Rangesh and Mohan M. Trivedi “3D BAT: A Semi-Automatic, Web-based 3D Annotation Toolbox for Full-Surround, Multi-Modal Data Streams” In IEEE Intelligent Vehicles Symposium (IV), 2019, pp. 1–8 IEEE
- [29] Viet Anh Nguyen “AnyLabeling - Effortless data labeling with AI support”, https://github.com/vietanhdev/anylabeling, 2023
- [30] Alexander Kirillov, Eric Mintun, Nikhila Ravi, Hanzi Mao, Chloe Rolland, Laura Gustafson, Tete Xiao, Spencer Whitehead, Alexander C Berg and Wan-Yen Lo “Segment anything” In IEEE/CVF International Conference on Computer Vision (ICCV), 2023, pp. 4015–4026
- [31] Olaya Álvarez-Tuñón, Hemanth Kanner, Luiza Ribeiro Marnet, Huy Xuan Pham, Jonas Fevre Sejersen, Yury Brodskiy and Erdal Kayacan “Mimir-uw: A multipurpose synthetic dataset for underwater navigation and inspection” In IEEE/RSJ International Conference on Intelligent Robots and Systems (IROS), 2023, pp. 6141–6148 IEEE