Unpaired Multi-view Clustering via Reliable View Guidance
Abstract
This paper focuses on unpaired multi-view clustering (UMC), a challenging problem where paired observed samples are unavailable across multiple views. The goal is to perform effective joint clustering using the unpaired observed samples in all views. In incomplete multi-view clustering, existing methods typically rely on sample pairing between views to capture their complementary. However, that is not applicable in the case of UMC. Hence, we aim to extract the consistent cluster structure across views. In UMC, two challenging issues arise: uncertain cluster structure due to lack of label and uncertain pairing relationship due to absence of paired samples. We assume that the view with a good cluster structure is the reliable view, which acts as a supervisor to guide the clustering of the other views. With the guidance of reliable views, a more certain cluster structure of these views is obtained while achieving alignment between reliable views and other views. Then we propose Reliable view Guidance with one reliable view (RG-UMC) and multiple reliable views (RGs-UMC) for UMC. Specifically, we design alignment modules with one reliable view and multiple reliable views, respectively, to adaptively guide the optimization process. Also, we utilize the compactness module to enhance the relationship of samples within the same cluster. Meanwhile, an orthogonal constraint is applied to latent representation to obtain discriminate features. Extensive experiments show that both RG-UMC and RGs-UMC outperform the best state-of-the-art method by an average of 24.14% and 29.42% in NMI, respectively.
Index Terms:
Unpaired multi-view clustering, Reliable view guidance, Silhouette coefficient, Consistent cluster structure.I Introduction
In real-world scenarios, data frequently exhibit diverse characteristics, originating from various sensors or acquired through different feature extractors, resulting in multi-view data [1, 2, 3, 4], e.g., multimedia data including text, image, and audio, multi-modal neuroimaging data involving magnetic resonance imaging (MRI) and computed tomography (CT), and multilingual news stories, etc. [2]. However, various factors like noise, privacy constraints, or equipment malfunctions [1, 2] may lead to missing samples across different views, resulting in incomplete multi-view data [5]. Unfortunately, there exists an extreme yet realistic scenario where observed samples do not match between views [1], termed as unpaired multi-view data [1, 2]. For example, in a multi-camera surveillance system, individual cameras may operate intermittently due to factors like energy conservation or maintenance, leading to unpaired multi-view data. Similarly, web data from routers in different countries often lacks correspondence relationships [6]. The frequent occurrence of sensor damage and replacements in multi-sensor detection systems also leads to unpaired multi-view data.
Clustering, a powerful learning method for revealing data cluster structure [7], partitions samples into different clusters without supervision. In both complete multi-view data and incomplete multi-view data mentioned above, two downstream clustering tasks multi-view clustering and incomplete multi-view clustering [2, 1], arise. These tasks have been extensively studied [8, 6, 7, 9, 10].
Similarly, a downstream clustering task on unpaired multi-view data, referred to as unpaired multi-view clustering (UMC) [1], is more efficient when performing joint clustering across all views rather than conducting individual clustering within each view [2]. However, UMC is a more challenging task than multi-view clustering and incomplete multi-view clustering for the absence of paired samples [2], which makes it a relatively understudied problem. Another issue, which may appear similar but distinct from UMC, arises when the paired relationships of inter-view samples are unknown [11, 12, 13, 14, 15]. In this case, different views establish paired relationships through recoupled self-representation matrices [15]. However, in UMC, there are no paired samples between views. As a result, paired relationships cannot be constructed between views, making it impossible to address the UMC issue in our work.
In multi-view clustering, different views exhibit consistent cluster structures. Even though UMC lacks paired samples, the cluster structures across different views remain consistent. Therefore, we aim to investigate the consistency in cluster structures, as it is advantageous for both view matching and clustering. However, UMC encounters two significant challenges. Firstly, uncertain cluster structure: There is no label information on each view. Samples are assigned to clusters based on their distances from various cluster centroids. Consequently, clustering assignments can be easily altered without the guidance of supervised information. Secondly, uncertain matching relationship: Clusters across different views do not explicitly correspond to specific categories, making it challenging to establish matching relationships between them.
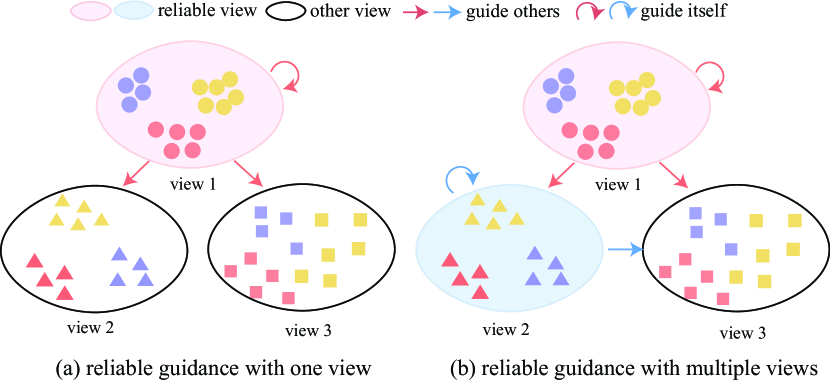
We strive to improve the reliability of the learned cluster structure and ensure its consistency across different views. Meanwhile, we found the cluster performance on each view is different. Some views perform well in cluster structure, while others exhibit poor. Naturally, we want to explore an interesting question: whether the view with a good cluster structure assists in the learning of the view with a worse cluster structure? In identification system [16], fingerprints are considered a ‘strong’ view as they provide more reliable information for recognizing the ID, while features like face descriptors and gaits are considered ‘weak’ views for less accurate identification. Inspired by this, we define a reliable view as a supervisor in cluster structure compared to other views. Furthermore, we assume the cluster structure of the reliable view acts as a supervisor to guide the clustering of the other views, then cluster structure and pairing relationships are determined by reliable views. Note that the effect of our reliable view is different from existing works of ‘reliable view clustering’, e.g., [17] and [18]. They are used to improve the performance reliability, while we aim to find a view with good cluster structure.
For the utilization of a reliable view, a similar work was proposed [15], which aligns other views with a fixed single view. However, the method has the following limitations: i) The appointed reliable view remains constant, overlooking the possibility of other reliable views emerging during the iterations; ii) The single reliable view neglects the guiding potential of other sub-optimal views. Considering these limitations, we design two strategies of reliable view guidance in the unsupervised setting: one reliable view (for the fixed view) and multiple reliable views (for one reliable view) in each iteration, as illustrated in Fig 1. During the iterations, the designation of reliable views can adaptively change based on the reliability of these views. Furthermore, these strategies fully utilize all reliable views and effectively align cluster structures across views under the guidance of reliable views, thereby an improvement in clustering performance.
Therefore, to solve the aforementioned issues (uncertain cluster structure and uncertain matching relationships), we designate the reliable view as a supervisor to guide the learning of cluster structures in other views. Meanwhile, the other views are matched with the reliable view, resulting in increased certainty of both cluster structure and pairing relationships. Specifically, we design alignment modules for reliable view guidance with one and multiple views, respectively. Both modules adaptively select reliable views during optimization. Besides, we employ a compactness module to strengthen the relationships among samples within the same cluster. An orthogonal constraint is also applied to the latent representation to extract discriminative features. These modules collectively enhance the clustering performance. Therefore, two novel methods called Reliable view Guided Unpaired Multi-view Clustering with one view (RG-UMC) and multiple views (RGs-UMC) are proposed. The primary contributions can be outlined as follows:
-
•
We address the challenging and relatively unexplored problem of UMC, which arises when no paired samples are available between any two views. To establish relationships between views and achieve alignment, we explore guidance from reliable views based on consistent cluster structures.
-
•
By utilizing the guidance of reliable views, we propose two novel methods to learn the effective cluster structure for UMC with one reliable view guidance (RG-UMC) and multiple reliable views guidance (RGs-UMC), both of which adaptively specify the reliable views.
-
•
Experiments on five datasets validate superior performance compared to sixteen methods. Specifically, RG-UMC outperforms the best comparison method with average improvements of 24.14% (NMI), 37.49% (ACC), and 33.05% (F-score). Similarly, RGs-UMC achieves higher performance with average improvements of 29.42% (NMI), 41.36% (ACC), and 35.47% (F-score).
II Related Work
II-A Incomplete Multi-view Clustering
In real-world scenarios, missing samples in one or more views can lead to incomplete observations, posing a challenge for clustering tasks. For incomplete multi-view clustering, some researchers have explored various methods, primarily including spectral approaches and subspace learning methods [1, 2]. In spectral approaches, Rai et al . [19] presented a kernel CCA-based method for multi-view clustering, which completes the kernel matrix using Laplacian and kernel matrices from complete views. However, this method assumes the availability of at least one complete view. Wen et al . [20] leverage a locality-preserving term to infer missing views for natural alignment across all views. Besides, Wen et al . [21] proposed a tensor spectral clustering method to recover missing views and utilize both the hidden information of these missing views and the intra-view information of data, which is often overlooked in current approaches. For the incomplete multi-view data, recovering the original high-dimensional data is time-consuming and noise-sensitive, and separating the cluster indicator learning into a separate step may lead to sub-optimal results. Therefore, Zhang et al . [22] proposed a method that integrates spectral embedding completion and discrete cluster indicator learning into a unified framework to address these issues.
For subspace learning approaches, Yin et al . [23] devised a method for incomplete multi-view subspace learning, which enhances performance by simultaneously addressing feature selection and similarity preservation within and across views. To fully leverage observed samples, Yang et al . [24] utilizes a combined sparse and low-rank matrix to model the correlation among samples within each view to impute missing samples. Moreover, it enforces similar subspace representations to explore the relationships between samples across different views, facilitating downstream clustering tasks. Thanks to the coefficient matrix, the self-representation method reflects the precise relationships among samples. Therefore, Liu et al . [25] introduced a self-representation subspace clustering algorithm tailored for incomplete multi-view scenarios, which elegantly integrates completion of missing samples and self-representation learning into a cyclical process. With a unified sparse subspace learning framework, Li et al . [26] proposed a method to learn inter-view anchor-to-anchor and intra-view anchor-to-incomplete affinities. Then these components are integrated to generate a unified clustering outcome through a consensus sparse anchor graph. However, obtaining matched samples across all views, as required by these methods, can be challenging in real-world scenarios.
II-B Unpaired Multi-view Clustering
Unpaired multi-view clustering (UMC) is an extreme scenario of incomplete multi-view clustering (IMC), where samples are observed in just one view, making it more challenging than IMC [1, 2]. Several researchers have utilized weak supervision information to establish correlations between views. For instance, both Qian et al . [6] and Houthuys et al . [27] incorporated must-link and cannot-link constraints to construct correlations across views in their respective works. Nonetheless, these methods may not be effective in the absence of paired samples or supervised information.
For UMC with no supervision, Yang et al . [1] proposed IUMC aimed at learning consistent subspace representations for clustering. Based on the baseline, two unpaired multi-view clustering methods were developed. Specifically, IUMC-CA aligns covariance matrices to enhance subspace consistency before clustering, whereas IUMC-CY directly clusters using assignments, offering efficiency for large datasets. Besides, Xin et al . [2] proposed a method for UMC (scl-UMC), which leverages inner-view and inter-view selective contrastive learning modules to enhance the certainty of cluster structures. However, scl-UMC emphasizes the consistency between views, overlooking the potential complementary that exists among them.
Additionally, we are also concerned about the related issue of unknown mapping relationships between inter-view samples [12, 11, 13, 14]. For example, through non-negative matrix factorization, Yu et al . [11] utilized graph structure consistency to construct the mapping matrix between cross-view samples. Yang et al . [13] tackled the issue using robust contrastive learning. Moreover, in their subsequent work a more robust multi-view clustering SURE [14] was introduced, which directly re-aligns and recovers samples from other views. These methods attempt to establish sample-matching relationships across views. However, in UMC, such relationships are often lacking. Therefore, our aim is to explore consistency in clustering.
II-C Multi-view learning via view guidance
In supervised and semi-supervised scenarios, Muslea et al . [28] introduced co-testing, an extension of the multi-view learning framework that leverages both strong and weak views in multi-view learning. Previous co-training methods assumed that each view can independently provide accurate predictions [29], while the assumption is unrealistic due to potential feature corruption or noise. For the importance of different modalities varies in real tasks, Yang et al . [16] proposed the auxiliary information regularized machine (ARM) model, which leveraged auxiliary information from a strong modality to guide feature extraction on the weak modality. Furthermore, considering the cost of strong modal feature extraction, Yang et al . [30] proposed the active querying strong modalities (ACQUEST) training strategy, which actively queried the strong modal feature values of ‘selected’ instances instead of relying on their corresponding ground truths. Additionally, in semi-supervised scenarios, Yang et al . [31] investigated the utilization of instance-level auto-encoder for individual modalities and a modification of bag-level optimal transport to improve consistency across modalities. Besides, in the specific application of Corporate Relative Valuation, Yang et al . [32] solved by a heterogeneous multi-modal graph neural network. Although these methods have achieved good performance, they need some supervision information to assist.
In unsupervised learning, Cui et al . [33] proposed a self-supervised model that performs simultaneous subspace clustering, consensus construction, and self-guided learning. To enhance clustering friendliness, they introduced spectral supervisors through self-guided pseudo-labeling. Given the heterogeneity between modalities, Yang et al . [34] bridged the gap by aligning both raw images and corresponding generated sentences into a shared semantic space. They assessed the generated sentences based on prediction consistency and relational consistency. Multi-view subspace clustering methods present challenges in real-world large-scale data applications due to the high time costs and complexity. Therefore, Mi et al . [35] and Wang et al . [36] employed anchors guidance to select crucial landmarks, effectively reducing time consumption. Considering the incomplete multi-view data is not missing in any view, Chen et al . [37] designed a knowledge distillation framework and proposed an incomplete multi-view clustering with complete view guidance. Lin et al . [15] introduced T-UMC for addressing incomplete coupling among different views in multi-view data by identifying the most reliable view for alignment. However, T-UMC used a fixed single view as the reliable view, which limits the guidance from potentially better views during optimization and overlooks the guidance from other suboptimal views. Additionally, it did not consider the clustering task with missing samples, particularly in the extreme case of UMC with no paired samples.
III Methodology
III-A Notations and Architecture
Notations. Unpaired multi-view data stem from views, where within . In the -th view, the observed sample matrix consists of samples , with each sample possessing -dimensional features in the -th view. The total number of observed samples in unpaired multi-view data is denoted as , where due to the absence of paired samples between views. At the beginning of training, the observed samples in the -th view are inputted into their corresponding autoencoder, which consists of an encoder and a decoder respectively. Subsequently, the latent subspace representation obtained by . The clustering performance of a view can be regarded as the reliability of that view in a clustering task. Here, we use the silhouette coefficient to compute the reliability of a view. Specifically, represents the silhouette coefficient of sample , and denotes the silhouette coefficient of the -th view. In alignment modules with reliable views, we set as the index for one reliable view, and apply matrix to denote the weight of multiple reliable views, respectively. For clarity, the primary symbols are detailed in the supplementary material.
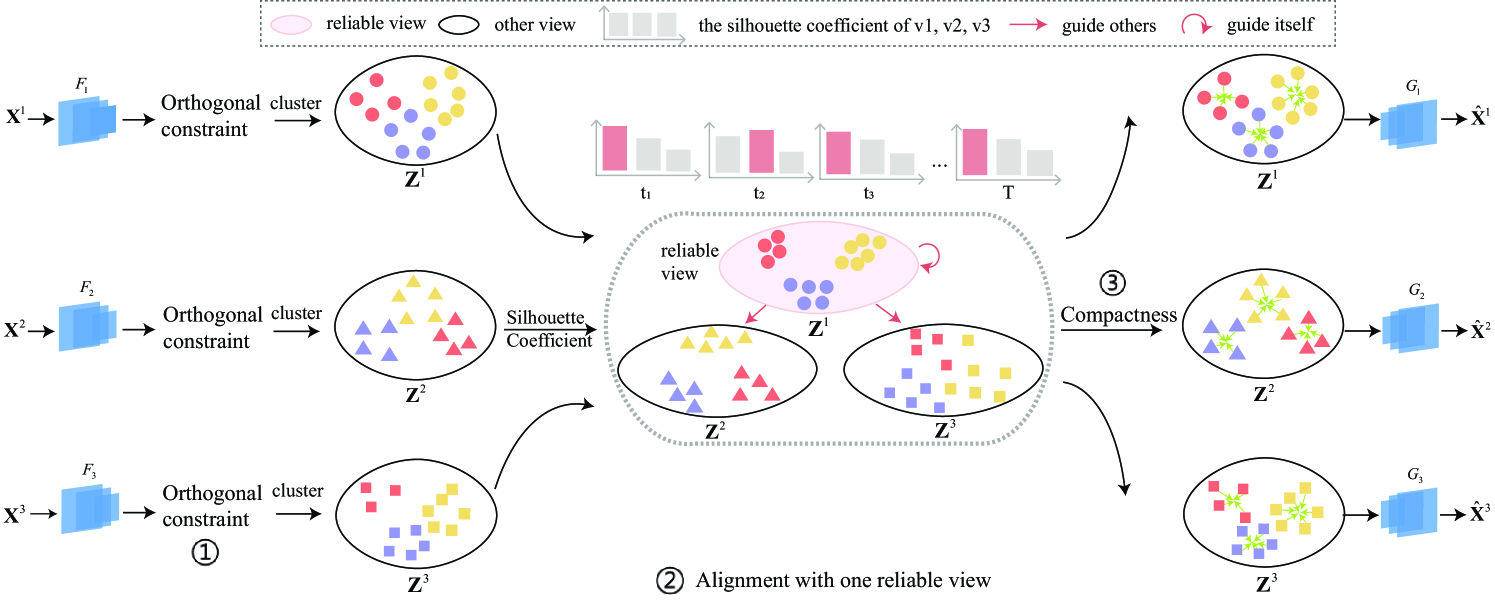
The architecture of RG-UMC. As depicted in Fig. 2, we employ autoencoder networks in each view to extract view-specific latent representations, which are utilized for clustering subsequently [2]. To enhance the performance, we introduce a learning process for the latent representations involving orthogonality constrain, an alignment module, and a compactness module.
We illustrate the process with three views. As depicted in Fig. 2, a batch of samples from three views () fed into their corresponding encoders () to generate three subspace representations (). Subsequently, these subspace representations are processed by three modules in the subspace to learn consistent representations across views. Once convergence, the subspace representations () are employed to reconstruct raw feature representations () via their respective decoders (). Subsequently, these subspace representations from different views are combined into a unified matrix , facilitating the final clustering assignments [2]. Specifically, before feeding data into the alignment module with one reliable view, we need to calculate the index for the reliable view using the silhouette coefficient. As shown in Fig. 2, only the view with the highest silhouette coefficient guides the learning of other views in the alignment module.
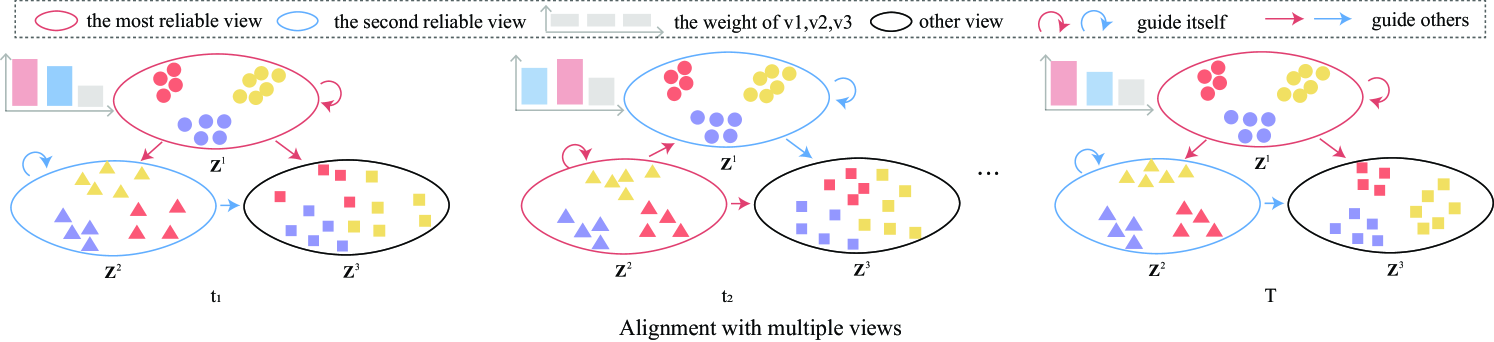
The architecture of RGs-UMC. The only difference between RG-UMC and RGs-UMC is the number of reliable views in the alignment module. Consequently, we depict the alignment module of RGs-UMC in Fig. 3. Similar to RG-UMC, we calculate the weight matrix for the reliable view using the silhouette coefficient before feeding the data into the alignment module. Throughout the iterative optimizations, the reliable view and its corresponding weight adaptively change based on the silhouette coefficient. As depicted in Fig. 3, most views can act as supervisors guiding the learning of other views.
Multi-view Autoencoders with regularizer. The autoencoder is a common unsupervised model in multi-view learning, aiming to capture view-specific information by projecting raw features into a low-dimension space [38, 2]. Commonly, an autoencoder comprises an encoder and a decoder. Therefore, we utilize an autoencoder to learn the latent representation of the features in the -th view, minimizing the reconstruction loss [2]. Furthermore, applying an orthogonal constraint to the latent representation prevents it from expanding arbitrarily within the integral space [39] and enforces a more discriminative representation [40]. Subsequently, to learn the latent representation , we utilize an autoencoder with a regularizer [2] to process by minimize the following loss:
| (1) |
where and are the encoder and decoder of the v-th autoencoder. Specifically, we define as the latent representation of , i.e., . is the hyperparameter to balance reconstruction loss and regularizer loss.
III-B RG-UMC: UMC via One Reliable View Guidance
The silhouette coefficient in multiple views. As in [15], we leverage the silhouette coefficient to select reliable views. The silhouette coefficient [41, 15] is utilized to evaluate the clustering performance of each view. This metric assesses the distance between samples belonging to the same cluster and those in different clusters [15]. Therefore, we firstly obtain the cluster assignment on each view with a cluster method, e.g., -means. Then, based on these cluster assignments, we calculate the two values and for the sample in latent space. Certainly, represents the average distance between and other samples within the same cluster, while is the minimum average distance between and samples from different clusters. Specifically, the formulation is as follows:
| (2) | |||
| (3) |
where represents the sample set in the -th cluster of the -th view, while calculates the Euclidean distance between samples and , where belongs to . The number of samples in clusters and in the -th view are denoted as and , respectively. Then, the silhouette coefficient for sample is defined as:
| (4) |
As shown in Eq. (4), the average silhouette coefficient varies from -1 to 1. A higher value of suggests that samples exhibit greater similarity to each other within the same cluster while dissimilar from samples in different clusters.
Multi-view clustering aims to leverage observed samples in each view for effective joint clustering. However, choosing the most suitable view for the clustering task presents a challenging issue [15]. The clustering performance of a view can be considered as its reliability in a clustering task. Therefore, the reliability of the -th view calculated by the silhouette coefficient as follows:
| (5) |
exactly, the value range of is the same as that of , which is [-1, 1]. A higher silhouette coefficient value for -th view indicates that the view exhibits better cluster structure.
The silhouette coefficient serves as a measure to evaluate the clustering quality of the data. For selecting the reliable view, we suppose the view with the highest silhouette coefficient is the reliable view [15]. Then, we get the index of the most reliable view as follows:
| (6) |
where denotes the silhouette coefficient of -th view in Eq. (5), which can be easily computed according to [41].
Alignment with one reliable view. In UMC, establishing relationships between views is challenging for the absence of paired samples. Fortunately, the consistent cluster structure across views allows us to construct relationships between views. As the reliability of different views varies in multi-view learning, we leverage the view with a reliable cluster structure to guide other views with a relatively unreliable cluster structure, thereby improving the performance of all views.
For align the cluster structure, there are many methods to achieve it, e.g., contrastive learning [42], mutual information maximization [43], KL divergence [44], etc. We choose one of them KL divergence for distribution alignment. Subsequently, we design the alignment module with reliable views by KL divergence to achieve alignment between reliable views and the remaining views, thereby mitigating the uncertain cluster structure and uncertain matching relationship in UMC.
Specifically, the alignment module with one reliable view assigns the reliable view firstly, then aligns other views with reliable view by KL divergence. Therefore, we define the alignment module with one reliable view by KL divergence as follows:
| (7) |
where is the index of the reliable view. and represent the probability distributions corresponding to the -th view and the -th reliable view, respectively. These distributions are approximated by the softmax layer applied to and [45, 46, 47]. serves as the ‘director’ (reliable view) to guide the cluster structure learning of . Therefore, we achieve alignment between views through KL divergence, resulting in a consistent cluster structure across views.
Compactness. Compactness is a common evaluation used to assess the quality of clusters based on the similarity of samples within each cluster [48]. A good cluster structure exhibits lower compactness within each cluster. Therefore, to enhance the relationship of sample with same clustering, we define the compactness module in multi-view as:
| (8) |
where
| (9) |
and are the -th sample and the -th cluster centriod in -th view, is the sample number in the -th cluster of the -th view.
In sum, addressing the challenges of uncertain cluster structure and uncertain matching relationships, the model RG-UMC, aligned by one reliable view in the UMC, is written by:
| (10) |
where , , and are three terms of autoencoder network with orthogonal constraint, alignment module with one reliable view and compactness module, respectively. Besides, and are the hyperparameters to balance these modules.
III-C RGs-UMC: UMC via Multiple Reliable Views Guidance
For the RG-UMC, the reliable view may change during iteration. Furthermore, we believe that the views with suboptimal silhouette coefficients may also have a positive effect on forming a consistent cluster structure and alignment. Therefore, we define the views with silhouette coefficient higher than current view as the reliable views and design the alignment module with multiple reliable views.
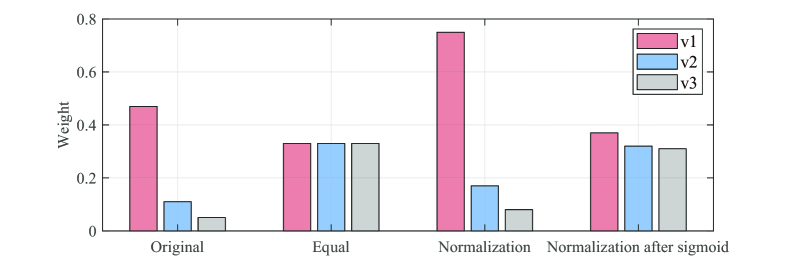
Additionally, as shown in Fig. 4, we observe that i) treating all views equally would reduce the effectiveness of views with higher silhouette coefficients (compare the columns ‘Original’ and ‘Equal’). ii) Directly normalizing the silhouette coefficients across views would weaken the guidance from views with lower silhouette coefficients (compare the columns ‘Normalization’ and ‘Normalization after sigmoid’). To address these issues, we employ sigmoid function to reprocess the silhouette coefficients on each view. Then the weight matrix of multiple reliable views formulate as follows:
| (11) |
where is the silhouette coefficient of the -th view defined in Eq. (5). is the view index with a higher silhouette coefficient than the -th view. and are the set and number of these views indexes with higher silhouette coefficient. Besides, the sigmoid function rapidly increases initially and then gradually slows down. This property implies that even a minor silhouette coefficient can result in a relatively high weight, effectively smoothing the weights assigned to different views [49]. Therefore, based on the Eq. (11), we define the alignment module with multiple reliable views by KL divergence as follows:
| (12) |
where is the number of indexes corresponding to views with a higher silhouette coefficient compared to . Similar to Eq. (7), and are the approximate probability distribution corresponding to the -th view and the -th view.
Moreover, instead of aligning with one reliable view, we leverage multiple views to align and further propose the RGs-UMC model as follows:
| (13) |
where denotes the alignment module with multiple reliable views. The hyperparameters and are utilized to balance these modules. The key difference between RG-UMC and RGs-UMC lies in the number of reliable views integrated into the alignment module.
Implementation Details. The structure of the autoencoder used in this work is similar to that in [43, 2]. Additionally, during training, we employ mini-batch gradient descent to train both the RG-UMC and RGs-UMC models. The unpaired data is used to train the whole network for 50 epochs. Once the network converges, we use the saved autoencoder parameters to generate the latent representations for all views. Then, same to [2], we conduct -means clustering on the concatenated representations to obtain the clustering assignments.
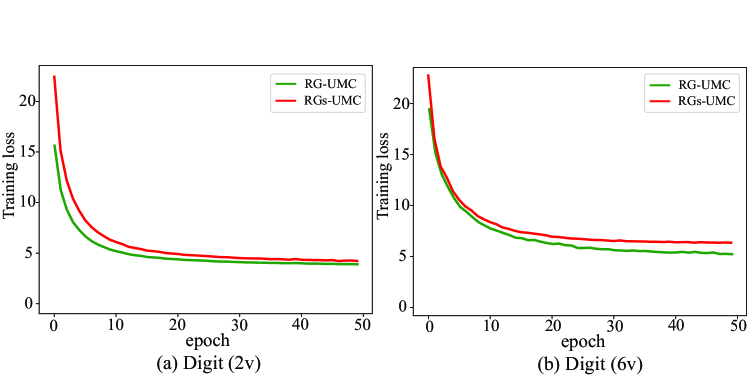
Convergence analysis. The complete algorithms for RG-UMC and RGs-UMC are outlined in Algorithm 1. The distinctions between them can be observed in rows 6-7 and rows 9-10. Besides, we demonstrate the convergence of RG-UMC and RGs-UMC. Fig. 5 (a) and (b) depict the training loss of the two models on the Digit dataset with two views and six views, respectively. It can be observed that the loss of both RG-UMC and RGs-UMC converges rapidly and steadily after 50 iterations.
Input: unpaired multi-view data , the cluster number , , , hyper-parameters .
Output: clustering assignment.
IV Experiments
In this section, we evaluate the performance of our models, RG-UMC and RGs-UMC, against sixteen comparison methods. Additionally, we conduct ablation studies, visualization, and other experiments to confirm the effectiveness of our reliable view guidance strategies.
For convenience, some information including experimental setting, network architectures, 5 benchmark multi-view datasets (Digit111http://archive.ics.uci.edu/dataset/72/multiple+features, Scene-15222https://github.com/XLearning-SCU/2021-CVPR-Completer/tree/main/data, Caltech101-20222https://github.com/XLearning-SCU/2021-CVPR-Completer/tree/main/data, Flower17333http://www.robots.ox.ac.uk/vgg/data/flowers/17/index.html and Reuters444http://archive.ics.uci.edu/ml/datasets/Reuters+RCV1+RCV2+Multilingual
%2C+Multiview+Text+Categorization+Test+collection), 16 state-of-art compared methods, and parameter analysis are provided in the supplementary.
Specifically, 16 state-of-art methods include five complete multi-view clustering methods (OPMC [50], OP-LFMVC [51], DUA-Nets [52], RMVC[18], and DSMVC [17]), eight incomplete multi-view clustering methods (DAIMC [8], UEAF [20], IMSC-AGL [53], OMVC [54], OPIMC [55], MvCLN [13], Completer [43], and T-UMC[15]), and three unpaired multi-view clustering methods (IUMC-CA [1], IUMC-CY [1] and scl-UMC [2]).
IV-A Performance Comparison and Analysis
(1) Evaluating clustering performance with two views. TABLE I presents the clustering results across five datasets. The top two results in each column are emphasized by being highlighted in bold and underlined, respectively. Specifically, the Digit, Flower17, and Reuters datasets utilize the first two views as the two-view dataset. As for the remaining two datasets, the two views are selected according to Completer [43] and DCP [56]. From TABLE I, we draw the conclusions:
1) Compared with the first thirteen clustering methods (complete and incomplete multi-view clustering methods), RG-UMC and RGs-UMC significantly outperform most of the compared methods. In UMC, where paired samples between views are absent, existing methods often struggle to capture cross-view relationships and may deteriorate into models for single-view. Fortunately, our methods leverage reliable view guidance to construct the relationship and achieve a consistent cluster structure between views, resulting in superior results. 2) Compared with the three UMC methods, our models exhibit significant improvements across nearly all evaluation metrics, indicating that the guidance of reliable views has positive effects on other views. Specifically, RG-UMC shows an average improvement of 23.46%, 32.86%, and 27.88% in NMI, ACC, and F-score, respectively, compared to these methods. Similarly, RGs-UMC exhibits a higher average improvement of 23.78%, 33.69%, and 30.18% in NMI, ACC, and F-score, respectively. 3) Compare RG-UMC with RGs-UMC, the performance is comparable on the two views dataset. The reason may be that these two methods are nearly equivalent when only one reliable view is selected.
| Methods | Digit | Scene-15 | Caltech101-20 | Flower17 | Reuters | ||||||||||
| NMI | ACC | F1 | NMI | ACC | F1 | NMI | ACC | F1 | NMI | ACC | F1 | NMI | ACC | F1 | |
| OPMC [50] | 44.12 | 51.75 | 32.02 | 30.43 | 27.29 | 19.76 | 27.59 | 28.12 | 24.71 | 26.19 | 24.56 | 14.91 | 20.17 | 40.32 | 36.73 |
| OP-LFMVC [51] | 39.04 | 46.40 | 35.10 | 15.60 | 20.45 | 13.28 | 21.61 | 22.09 | 17.46 | 20.81 | 23.31 | 13.09 | - | - | - |
| DUA-Nets[52] | 42.08 | 38.07 | 33.98 | 30.12 | 27.80 | 21.23 | 32.40 | 29.26 | 25.42 | 28.34 | 24.44 | 18.61 | 4.28 | 26.23 | 24.17 |
| RMVC [18] | 46.75 | 44.05 | 36.56 | 36.34 | 30.52 | 21.92 | 34.37 | 24.43 | 22.11 | 33.70 | 28.24 | 18.83 | - | - | - |
| DSMVC [17] | 49.84 | 41.90 | 8.39 | 27.00 | 25.22 | 6.03 | 32.14 | 22.34 | 5.29 | 26.69 | 23.46 | 4.14 | 10.86 | 30.39 | 14.40 |
| DAIMC [8] | 39.37 | 38.50 | 30.88 | 19.46 | 22.79 | 16.20 | 20.16 | 24.81 | 22.88 | 21.87 | 21.03 | 15.12 | - | - | - |
| UEAF [20] | 30.90 | 26.77 | 19.32 | 22.16 | 20.14 | 13.19 | 25.44 | 22.19 | 32.54 | 12.72 | 9.25 | 6.37 | - | - | - |
| IMSC-AGL [53] | 48.99 | 45.40 | 37.09 | 27.61 | 27.98 | 18.33 | 30.04 | 24.06 | 20.38 | 26.99 | 24.71 | 15.31 | - | - | - |
| OMVC [54] | 31.69 | 34.87 | 20.64 | 0.68 | 9.16 | 12.94 | 26.11 | 26.78 | 22.62 | 26.08 | 24.52 | 14.47 | - | - | - |
| OPIMC [55] | 41.49 | 44.60 | 37.01 | 20.32 | 23.52 | 15.30 | 22.38 | 24.48 | 21.97 | 19.90 | 21.84 | 12.22 | 8.99 | 27.53 | 24.36 |
| MvCLN [13] | 41.96 | 45.10 | 52.41 | 21.50 | 21.43 | 22.47 | 31.21 | 28.04 | 17.64 | 19.57 | 17.65 | 18.43 | 20.18 | 18.97 | 19.72 |
| Completer[43] | 41.35 | 39.66 | 40.24 | 23.24 | 21.86 | 19.59 | 34.29 | 26.37 | 22.61 | 22.65 | 20.73 | 19.83 | 1.28 | 23.84 | 19.67 |
| T-UMC[15] | 46.15 | 49.85 | 49.26 | 40.75 | 39.20 | 30.10 | 38.84 | 35.88 | 23.54 | 22.44 | 22.65 | 16.51 | - | - | - |
| IUMC-CA[1] | 46.20 | 27.75 | 29.82 | 40.50 | 30.08 | 27.39 | 35.91 | 26.40 | 19.24 | 43.31 | 31.84 | 25.64 | - | - | - |
| IUMC-CY[1] | 49.17 | 45.55 | 37.72 | 39.67 | 18.68 | 23.87 | 32.22 | 28.08 | 35.06 | 39.52 | 18.82 | 21.01 | 11.34 | 27.50 | 27.36 |
| scl-UMC[2] | 57.00 | 60.85 | 61.35 | 45.26 | 36.59 | 35.35 | 38.60 | 41.52 | 36.84 | 39.98 | 32.21 | 35.06 | 39.50 | 49.86 | 41.12 |
| RG-UMC | 92.38 | 96.40 | 96.42 | 46.79 | 49.53 | 47.40 | 78.64 | 73.89 | 55.46 | 42.01 | 43.75 | 42.80 | 53.56 | 60.53 | 39.13 |
| RGs-UMC | 93.93 | 97.20 | 97.21 | 48.57 | 52.19 | 50.70 | 76.37 | 71.17 | 54.50 | 41.35 | 41.62 | 42.30 | 55.82 | 71.96 | 56.18 |
(2) Evaluating clustering performance with multiple views. We compare our models with other comparison methods on multi-view datasets containing all views. In UMC, each sample is observed in only one view, resulting in an observation ratio of for each view. The number of observed samples per view decreases as the number of views increases, posing a challenge to effectively address UMC. For this experiment, we omit Completer and MvCLN, which are tailored for two-view clustering [2], and evaluate our methods against fourteen other approaches. The clustering performance across five datasets is presented in TABLE II. From the results, we observed:
1) Compared with both complete and incomplete multi-view clustering methods, our models, RG-UMC and RGs-UMC, outperform most comparison methods, demonstrating their effectiveness in multi-view clustering with multiple views. 2) Compared with three unpaired multi-view clustering methods, our models have better performance on most evaluation metrics, indicating that the guidance of reliable views has positive effects on other views. In particular, RG-UMC exhibits an average increase of 1.85% in NMI, 18.85% in ACC, and 10.03% in F-score compared to them. Similarly, RGs-UMC demonstrates an even greater average improvement of 5.17%, 22.62%, and 12.80% in NMI, ACC, and F-score, respectively. Although IUMC-CY achieves better results in NMI than our methods on the Scene-15 (3 views) dataset, its accuracy and F-score are lower by 22.92% and 12.76%, respectively. Additionally, we introduce another indicator, precision, which is 23.79% for IUMC-CY and 47.84% for RGs-UMC. With the additional indicator, our method performs relatively well across all four indicators. 3) Compared with TABLE I, the clustering performances of the comparison methods are generally better in two views rather than multiple views. The reason is that the distribution difference between observed samples increases with the number of views increases. This leads to greater difficulty in aligning without pairing, resulting in decreased performance for the comparison methods. However, our RG-UMC and RGs-UMC exhibit a relatively small decrease in performance, indicating the effectiveness of reliable view guidance.
| Methods | Digit (6views) | Scene-15 (3views) | Caltech101-20 (6views) | Flower17 (7views) | Reuters (5views) | ||||||||||
| NMI | ACC | F1 | NMI | ACC | F1 | NMI | ACC | F1 | NMI | ACC | F1 | NMI | ACC | F1 | |
| OPMC[50] | 12.31 | 18.33 | 17.42 | 17.23 | 18.94 | 14.01 | 12.42 | 14.30 | 14.69 | 13.52 | 13.38 | 10.14 | 11.11 | 19.48 | 20.41 |
| OP-LFMVC[51] | 22.54 | 11.57 | 19.90 | 9.73 | 17.02 | 11.02 | 13.38 | 17.34 | 13.56 | 9.71 | 14.88 | 8.02 | - | - | - |
| DAU-Nets[52] | 17.10 | 19.40 | 16.82 | 22.62 | 21.52 | 16.30 | 24.50 | 15.34 | 17.90 | 14.84 | 13.81 | 10.77 | 2.20 | 25.06 | 22.98 |
| RMVC[18] | 22.31 | 26.25 | 17.88 | 28.84 | 24.68 | 18.03 | 21.72 | 18.90 | 17.34 | 19.08 | 17.28 | 11.24 | - | - | - |
| DSMVC[17] | 13.95 | 16.50 | 7.80 | 19.86 | 19.38 | 10.09 | 19.44 | 14.71 | 2.60 | 13.55 | 12.50 | 4.57 | 1.53 | 19.06 | 15.12 |
| DAIMC [8] | 18.17 | 25.68 | 17.96 | 12.49 | 19.46 | 18.68 | 12.49 | 19.46 | 18.68 | 8.56 | 12.75 | 9.83 | - | - | - |
| UEAF[20] | 10.32 | 19.25 | 16.63 | 11.59 | 15.65 | 12.56 | 9.28 | 27.03 | 24.26 | 3.91 | 7.54 | 10.74 | - | - | - |
| IMSC-AGL[53] | 24.01 | 17.61 | 17.38 | 16.45 | 20.88 | 12.99 | 17.30 | 15.81 | 12.97 | 12.66 | 14.93 | 8.69 | - | - | - |
| OMVC[54] | 12.02 | 20.03 | 16.70 | 11.53 | 16.09 | 11.74 | 18.29 | 19.26 | 17.31 | 12.68 | 14.68 | 9.13 | - | - | - |
| OPIMC [55] | 20.13 | 27.74 | 19.66 | 15.48 | 20.33 | 13.35 | 17.10 | 20.18 | 16.71 | 11.76 | 16.39 | 8.87 | 10.92 | 27.46 | 26.13 |
| T-UMC[15] | 9.09 | 17.70 | 15.06 | 26.51 | 27.65 | 22.91 | 11.95 | 14.08 | 9.01 | 11.66 | 15.74 | 13.57 | - | - | - |
| IUMC-CA[1] | 75.16 | 54.53 | 60.82 | 50.25 | 34.98 | 34.47 | 58.31 | 33.42 | 33.24 | 66.13 | 48.52 | 44.19 | - | - | - |
| IUMC-CY[1] | 74.64 | 60.72 | 61.17 | 56.75 | 30.58 | 35.34 | 61.48 | 46.63 | 45.06 | 63.23 | 49.21 | 40.19 | 10.07 | 22.99 | 21.48 |
| scl-UMC[2] | 72.75 | 60.00 | 50.97 | 49.62 | 39.15 | 33.51 | 59.63 | 57.94 | 60.93 | 65.65 | 49.93 | 47.80 | 30.73 | 52.83 | 31.32 |
| RG-UMC | 77.37 | 84.85 | 84.65 | 49.23 | 53.82 | 49.82 | 65.81 | 67.05 | 38.92 | 58.57 | 50.04 | 47.81 | 30.93 | 59.78 | 34.54 |
| RGs-UMC | 86.19 | 92.83 | 92.77 | 47.40 | 53.50 | 48.11 | 70.88 | 75.28 | 41.50 | 60.64 | 52.02 | 51.68 | 32.26 | 57.24 | 33.35 |
IV-B Ablation Study and Parameter Analysis
Ablation study of different losses on RG-UMC and RGs-UMC models. To further analyze the modules in RG-UMC and RGs-UMC, we conducted ablation studies on Digit dataset with two views. We evaluated different combinations of the orthogonal constraint (), the compactness learning module (), and the alignment module ( for RG-UMC and for RGs-UMC). The results are presented in TABLE III.
| Line | Orth | KL | KLs | NMI | ACC | F1 | |
| 1 | 41.77 | 42.25 | 45.88 | ||||
| 2 | ✓ | 41.72 | 44.35 | 48.48 | |||
| 3 | ✓ | 44.45 | 44.20 | 46.34 | |||
| 4 | ✓ | ✓ | 46.28 | 46.65 | 48.86 | ||
| 5 | ✓ | - | 82.83 | 91.40 | 91.43 | ||
| 6 | ✓ | ✓ | - | 91.80 | 95.85 | 95.88 | |
| 7 | ✓ | ✓ | - | 91.97 | 96.25 | 96.27 | |
| 8 | ✓ | ✓ | ✓ | - | 92.38 | 96.40 | 96.42 |
| 9 | - | ✓ | 92.93 | 96.60 | 96.62 | ||
| 10 | ✓ | - | ✓ | 93.67 | 97.05 | 97.07 | |
| 11 | ✓ | - | ✓ | 92.65 | 96.45 | 96.47 | |
| 12 | ✓ | ✓ | - | ✓ | 93.93 | 97.20 | 97.21 |
As observed, the combination of all modules performs the best (Line 8 and Line 12), which is our method RG-UMC and RGs-UMC. Lines 1-8 are the ablation study of RG-UMC, while Lines 1-4 and Lines 9-12 are the ablation study of RGs-UMC. Comparing Lines 2-4 with Line 1, the and modules have positive effects on clustering. Specifically, comparing Lines 2,3,5,9 with Line 1, adding the and modules significantly improves performance by guiding the learning of subspace representations, while the impact of the and modules is minor. That further validates the main task in UMC is to learn the consistency and alignment among views. Lines 5-8 outperformed Lines 1-4, demonstrating the effectiveness of the module. Similarly, comparing Lines 9-12 with Lines 1-4, with the help of the module, the clustering performance improved further. Finally, comparing Lines 5-8 and Lines 9-12, RGs-UMC shows slightly better performance than RG-UMC on all evaluation metrics.
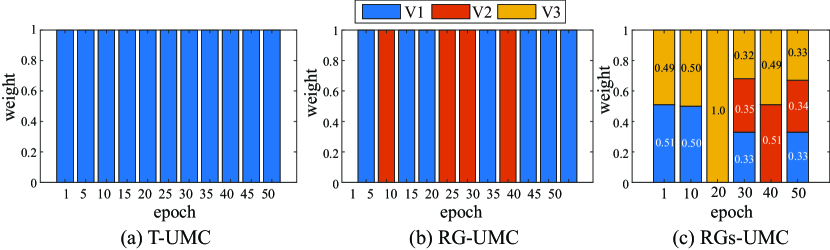
Effect of reliable view selection adaptively in RG-UMC and RGs-UMC models. For the limitations of a fixed and single reliable view in T-UMC, we investigate an adaptive selection of reliable views in RG-UMC and RGs-UMC by the Scene-15 dataset with 3 views. As shown in Fig. 6, the weights of these reliable views sum up to 1. We show the weight on each view every five (in RG-UMC) or ten (in RGs-UMC) epochs. In T-UMC, only view 1 is consistently chosen as the reliable view. In contrast, RG-UMC dynamically alternates between view 1 and view 2 as the reliable view. RGs-UMC takes it a step further by designating view 3 as a reliable view during the optimization process. The number of reliable views increased enhancing the complementary between views.
Influence of reliable strategy in RG-UMC model. To evaluate the reliable view guidance in RG-UMC, we employed three alternative strategies: ‘appoint’, ‘random’, and ‘reliable ()’. ‘Appoint’ entails selecting a specific view (e.g., view 1) as a reliable view throughout training, ‘random’ denotes choosing a view randomly at each iteration, and ‘reliable ()’ means aligning the most reliable view with other views, excluding itself. By comparing clustering performance under these strategies, we validate reliable view guidance effectiveness in RG-UMC. The experiment is conducted on the five data sets with all views in Table IV. Specifically, the ‘all-view’ and other lines (e.g., ‘v1’, ‘v2’, …, ‘v7’) are the clustering results on the dataset with all views and single views, respectively. Additionally, the ‘Original’ column is the clustering result with -means on the Original data. The ‘appoint’, ‘random’, and ‘reliable ()’ columns are the strategies mentioned above and the last column is our model RG-UMC.
From TABLE IV, several conclusions can be drawn. The ‘all-view’ line shows that the reliable strategy yields the best performance, while the performance of the ‘appoint’ and ‘random’ strategies is unstable, which is related to the randomness of reliable view selection. Additionally, the reliable strategy with all views performs slightly better than the strategy with ‘reliable ()’ views, indicating the benefit of aligning the reliable view with itself. Furthermore, comparing the single view performance on original data sets and latent representation with four strategies, we observed that the single view performance has improved through all variants of the reliable alignment module via KL divergence.
| dataset | strategy | Original | Appoint | Random | Reliable(V-1) | Reliable(V) | ||||||||||
| view | NMI | ACC | F1 | NMI | ACC | F1 | NMI | ACC | F1 | NMI | ACC | F1 | NMI | ACC | F1 | |
| Digit (6views) | v1 | 44.18 | 47.27 | 46.41 | 85.49 | 85.76 | 86.18 | 69.60 | 72.12 | 70.55 | 69.77 | 70.00 | 68.49 | 66.59 | 66.36 | 65.11 |
| v2 | 64.49 | 53.64 | 51.68 | 84.33 | 83.94 | 83.46 | 89.73 | 83.94 | 82.36 | 82.82 | 87.58 | 87.71 | 84.04 | 79.70 | 77.58 | |
| v3 | 42.35 | 48.79 | 49.19 | 62.77 | 69.70 | 70.75 | 73.10 | 82.42 | 82.13 | 87.38 | 91.21 | 90.56 | 75.89 | 84.55 | 83.99 | |
| v4 | 61.98 | 71.21 | 71.61 | 81.73 | 80.61 | 78.27 | 87.69 | 83.03 | 81.52 | 81.05 | 76.97 | 76.09 | 85.30 | 83.33 | 80.52 | |
| v5 | 47.87 | 47.88 | 46.00 | 67.16 | 70.00 | 68.87 | 73.83 | 76.06 | 74.87 | 72.59 | 72.73 | 70.37 | 73.00 | 72.73 | 71.53 | |
| v6 | 67.37 | 65.45 | 61.75 | 70.29 | 70.00 | 64.75 | 69.48 | 67.58 | 63.19 | 75.54 | 75.76 | 70.54 | 70.85 | 71.21 | 66.24 | |
| all-view | 8.57 | 15.30 | 15.46 | 72.24 | 71.11 | 66.18 | 77.93 | 80.15 | 82.57 | 76.26 | 84.24 | 83.96 | 77.37 | 84.85 | 84.65 | |
| Scene15 (3views) | v1 | 39.98 | 36.27 | 32.79 | 46.23 | 42.91 | 41.52 | 43.04 | 37.41 | 31.82 | 46.93 | 45.80 | 42.26 | 46.67 | 43.12 | 39.20 |
| v2 | 38.20 | 34.12 | 31.92 | 53.73 | 48.82 | 47.32 | 50.65 | 48.56 | 47.34 | 53.59 | 49.50 | 47.13 | 53.98 | 45.80 | 42.73 | |
| v3 | 19.87 | 22.57 | 20.21 | 38.41 | 37.74 | 32.85 | 32.48 | 31.03 | 28.50 | 38.47 | 36.40 | 31.34 | 38.13 | 35.59 | 32.21 | |
| all-view | 20.74 | 19.21 | 18.57 | 48.15 | 53.28 | 48.85 | 42.81 | 44.86 | 42.12 | 47.82 | 51.20 | 47.15 | 49.23 | 53.82 | 49.82 | |
| Caltech101-20 (6views) | v1 | 42.81 | 33.68 | 27.41 | 57.38 | 59.90 | 33.31 | 57.15 | 44.47 | 31.82 | 57.68 | 58.35 | 37.40 | 53.86 | 53.73 | 31.51 |
| v2 | 45.15 | 33.42 | 27.46 | 49.05 | 43.44 | 27.89 | 57.75 | 53.73 | 35.41 | 53.69 | 46.53 | 34.18 | 54.96 | 44.47 | 32.31 | |
| v3 | 45.03 | 36.76 | 32.52 | 48.86 | 39.59 | 27.69 | 54.20 | 44.47 | 27.02 | 56.04 | 53.21 | 30.07 | 54.20 | 42.67 | 30.19 | |
| v4 | 59.86 | 42.16 | 31.22 | 59.27 | 46.53 | 34.01 | 66.00 | 54.50 | 36.82 | 70.74 | 49.10 | 38.77 | 67.99 | 50.90 | 36.77 | |
| v5 | 52.58 | 38.82 | 32.52 | 56.68 | 48.59 | 33.04 | 60.15 | 46.79 | 30.95 | 64.07 | 50.39 | 32.04 | 65.13 | 47.56 | 36.71 | |
| v6 | 59.56 | 45.50 | 31.07 | 60.62 | 53.21 | 37.31 | 65.12 | 54.24 | 41.25 | 62.94 | 46.53 | 36.52 | 62.62 | 55.78 | 34.33 | |
| all-view | 19.72 | 15.21 | 11.08 | 59.37 | 64.27 | 32.59 | 62.91 | 61.74 | 37.39 | 64.49 | 63.62 | 37.24 | 65.81 | 67.05 | 38.92 | |
| Flower17 (7views) | v1 | 50.59 | 38.50 | 38.06 | 59.73 | 52.94 | 52.25 | 59.80 | 50.27 | 47.52 | 66.16 | 56.15 | 54.55 | 59.61 | 50.80 | 49.16 |
| v2 | 37.73 | 26.20 | 25.59 | 40.72 | 32.62 | 29.92 | 40.18 | 32.62 | 30.00 | 39.37 | 31.55 | 30.59 | 41.34 | 32.62 | 30.52 | |
| v3 | 48.75 | 37.97 | 38.36 | 55.63 | 44.39 | 42.41 | 48.80 | 41.18 | 39.49 | 53.80 | 43.32 | 37.20 | 55.60 | 43.32 | 40.71 | |
| v4 | 44.37 | 32.09 | 30.88 | 45.08 | 37.43 | 37.21 | 44.11 | 35.83 | 35.17 | 49.19 | 37.43 | 34.71 | 50.08 | 36.90 | 33.40 | |
| v5 | 45.63 | 34.76 | 34.67 | 42.49 | 34.22 | 28.95 | 45.01 | 39.57 | 38.96 | 50.00 | 36.90 | 34.06 | 45.19 | 36.90 | 37.12 | |
| v6 | 39.81 | 33.16 | 31.34 | 50.65 | 37.97 | 34.56 | 55.48 | 44.39 | 42.05 | 51.16 | 38.50 | 34.63 | 45.47 | 35.83 | 32.54 | |
| v7 | 45.3 | 34.76 | 35.90 | 45.97 | 36.90 | 35.30 | 52.36 | 42.78 | 41.64 | 48.78 | 44.39 | 45.20 | 47.18 | 37.43 | 36.12 | |
| all-view | 11.70 | 12.15 | 12.51 | 53.15 | 45.07 | 40.81 | 49.67 | 48.20 | 46.27 | 56.46 | 49.89 | 46.84 | 58.57 | 50.04 | 47.81 | |
| Reuters (5views) | v1 | 14.60 | 35.61 | 27.73 | 30.50 | 46.84 | 26.93 | 35.67 | 50.57 | 36.30 | 32.17 | 51.16 | 31.62 | 27.28 | 50.28 | 22.58 |
| v2 | 15.72 | 35.02 | 28.04 | 37.60 | 49.16 | 23.69 | 38.68 | 63.32 | 36.53 | 33.16 | 53.19 | 35.95 | 36.49 | 62.47 | 35.95 | |
| v3 | 14.38 | 34.92 | 27.06 | 34.61 | 44.79 | 31.07 | 36.00 | 55.75 | 34.64 | 25.52 | 49.80 | 22.25 | 24.54 | 50.20 | 22.10 | |
| v4 | 11.86 | 33.08 | 27.23 | 34.95 | 47.80 | 31.41 | 36.30 | 54.63 | 37.01 | 27.15 | 50.57 | 22.49 | 28.58 | 50.73 | 22.80 | |
| v5 | 14.50 | 33.56 | 27.32 | 19.35 | 41.05 | 23.36 | 19.68 | 45.29 | 31.47 | 20.33 | 53.45 | 30.54 | 20.25 | 53.51 | 30.62 | |
| all-view | 3.95 | 28.30 | 13.78 | 28.63 | 46.89 | 24.55 | 30.70 | 57.44 | 34.73 | 31.01 | 59.78 | 34.52 | 30.93 | 59.78 | 34.54 | |
Influence of multiple reliable views in RGs-UMC model. In the RGs-UMC model, two variations of Eq. (11) are introduced: uniform treatment and direct normalization. (i) Uniform treatment assigns equal weights of 1 to all selected reliable views. (ii) Direct normalization involves normalizing the silhouette coefficients of different views directly, which selects reliable views based on their normalized coefficients. These variations are formulated as:
| (16) | ||||
| (19) |
where the symbol meaning in Eq. (16) and Eq. (19) is consistent with that in Eq. (11). The two approaches for assigning weights to multiple reliable views in RGs-UMC are referred to as URGs-UMC (Uniform RGs-UMC) and NRGs-UMC (Normalization RGs-UMC), respectively. The results are presented in TABLE V compared with RGs-UMC.
From TABLE V, we conclude that: 1) URGs-UMC treats each view equally, which diminishes the guiding effect of views with better cluster structures. 2) NRGs-UMC diminishes the guiding effect of views with smaller silhouette coefficients, making them almost ineffective in the clustering process. 3) It is evident that the performance of RGs-UMC is relatively stable compared to URGs-UMC and NRGs-UMC methods. In RGs-UMC, it uses a sigmoid function to balance the weights, ensuring that each view contributes meaningfully to the clustering process.
| Methods | Digit (6views) | Scene15 (3views) | Caltech101-20 (6views) | Flower17 (7views) | Reuters (5views) | ||||||||||
| NMI | ACC | F1 | NMI | ACC | F1 | NMI | ACC | F1 | NMI | ACC | F1 | NMI | ACC | F1 | |
| URGs-UMC | 84.01 | 90.96 | 90.87 | 42.01 | 48.02 | 46.04 | 65.42 | 73.35 | 41.67 | 55.02 | 49.50 | 49.35 | 22.03 | 46.16 | 31.52 |
| NRGs-UMC | 80.86 | 88.38 | 88.18 | 45.10 | 51.47 | 46.66 | 61.09 | 62.25 | 33.74 | 53.41 | 48.05 | 45.61 | 27.30 | 54.71 | 32.12 |
| RGs-UMC | 86.19 | 92.83 | 92.77 | 47.40 | 53.50 | 48.11 | 70.88 | 75.28 | 41.50 | 60.64 | 52.02 | 51.68 | 32.26 | 57.24 | 33.35 |
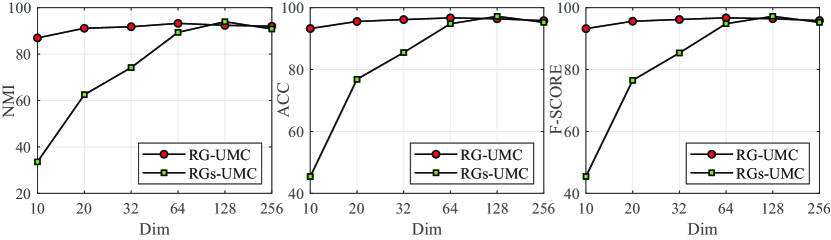
Influence of latent dimension. The last layer of the autoencoder is the softmax layer as the network architecture shows [2]. We treat each element of the representation as an over-cluster class probability like [43]. Take the two-view Digit dataset for example, we change the dimension of the latent representation in the range of , where K(10) is the class number of the Digit dataset. Fig. 7 displays the performance changes of the RG-UMC and RGs-UMC with varying dimensions. As Fig. 7 shows, both models achieve good performance when the dimension is greater than 64. Therefore we set the dimension of latent representation with 128 in RG-UMC and RGs-UMC models, which is consistent with the setting of the completer [43].
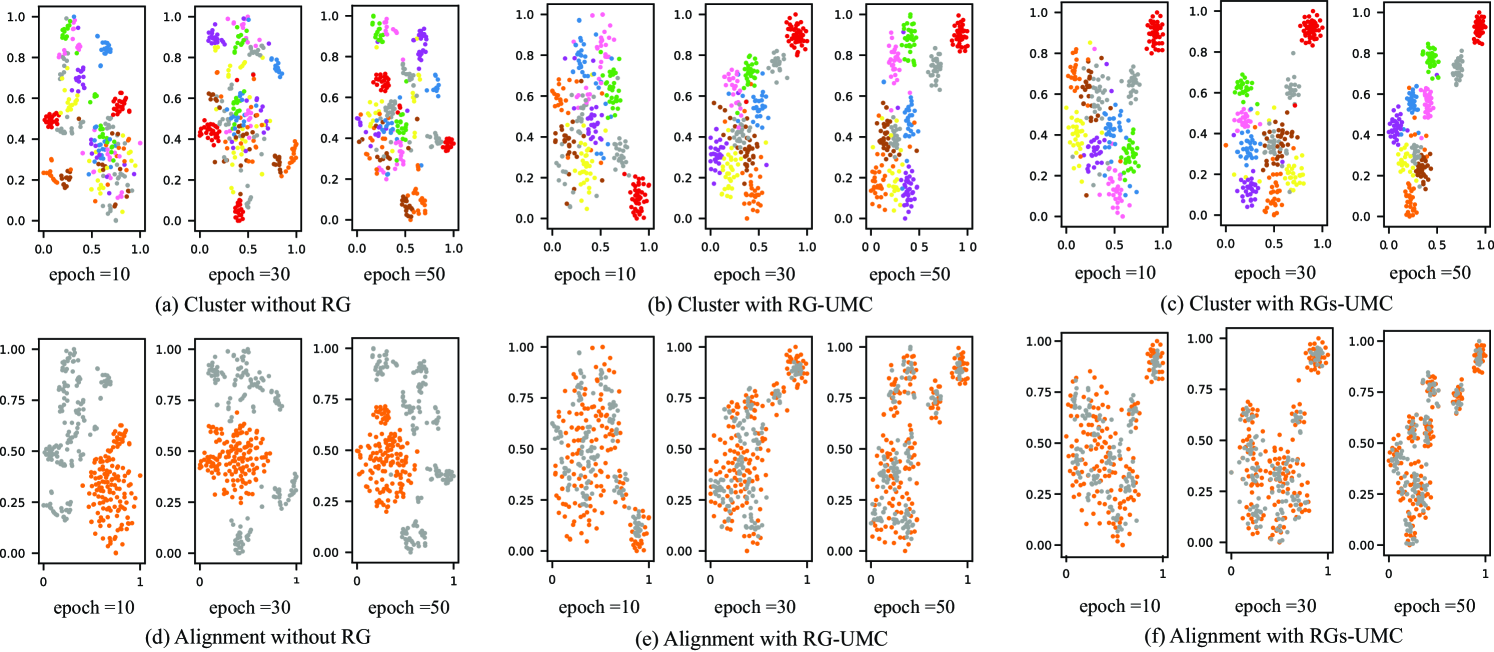
Visualization. To illustrate the effectiveness of learning a consistent cluster structure, the t-SNE visualization is utilized to observe the latent subspace evolution every twenty epochs during the training, conducted on the two-view Digit dataset. For clear illustration, we randomly sampled 300 instances of and illustrated the change evolution of them in Fig. 8. In Fig. 8 (a-c), color represents cluster assignments predicted by the -means algorithm. Besides, in Fig. 8 (d-e), color denotes different views. Fig. 8 (a) and (d) depict the model in this paper without the alignment module. From these visualizations, we conclude that:
1) The effectiveness of reliable view guidance is demonstrated by comparing Fig. 8 (a) and (d) with Fig. 8 (b-c) and (e-f). 2) Observing Fig. 8 (b-c), we note the initial mixing of features and the sparse appearance of clusters. However, with training, the cluster assignments become more rational, and features tend to gather and scatter more distinctly. This observation confirms the effect of the RG-UMC and RGs-UMC models in learning clear cluster structures. 3) Fig. 8 (e-f) shows that our methods successfully align the samples from different views during the training process. That is KL-divergence we used effectively aligns the distribution between reliable views and other views, and improves the clustering performance.
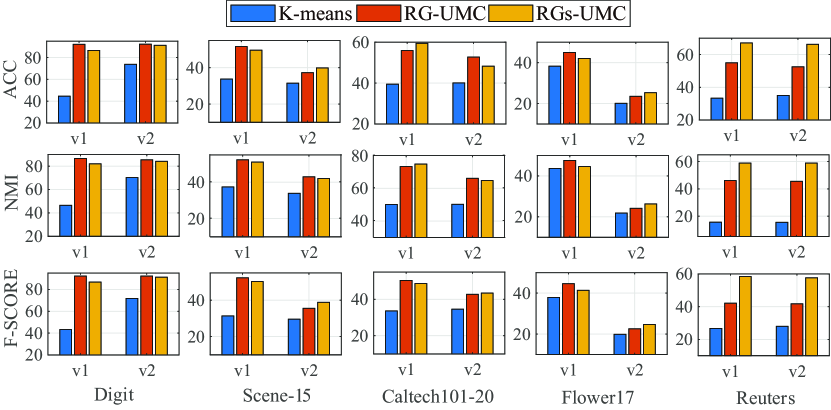
The comparison of clustering performance within individual views. In multi-view clustering, clustering can be performed independently within each view. Our method utilizes reliable views to guide the clustering of other views, enabling joint clustering across multiple views. Therefore, it is necessary to explore the changes in single-view clustering performance. Then we evaluated the performance of the RG-UMC and RGs-UMC models on each view across five two-view datasets with -means. As depicted in Fig. 9, our methods significantly improve the clustering performance within each individual view. The improvement can be attributed to the reliable information conveyed by other views through the reliable alignment module via KL divergence.
V Conclusion and Future Work
UMC is a challenging task as it lacks supervision information and matching samples between views. To establish relationships between different views, we utilize reliable view guidance to explore the consistent and complementary information of cluster structure between views. Then, two novel models, RG-UMC and RGs-UMC, both of which dynamically leverage the reliable view to guide the learning process, are proposed. Our models effectively address the challenges posed by uncertain cluster structures and pairing relationships between views. Through comprehensive experiments, we validate the effectiveness of our methods, showing remarkable performance in UMC.
In our work, we leverage a consistent cluster structure to establish connections. In the future, we plan to explore deeper relationships between views through hierarchical pairing. Moreover, the reliability and security of UMC are important. Therefore, it is crucial to explore algorithms within a stable and secure framework. Additionally, we need to thoroughly investigate algorithms tailored to the specific applicability of UMC.
References
- [1] W. Yang, L. Xin, L. Wang, M. Yang, W. Yan, and Y. Gao, “Iterative multiview subspace learning for unpaired multiview clustering,” IEEE Transactions on Neural Networks and Learning Systems, pp. 1–15, 2023.
- [2] L. Xin, W. Yang, L. Wang, and M. Yang, “Selective contrastive learning for unpaired multi-view clustering,” IEEE Transactions on Neural Networks and Learning Systems, pp. 1–15, 2023.
- [3] C. Xu, D. Tao, and C. Xu, “A survey on multi-view learning,” arXiv preprint arXiv:1304.5634, 2013.
- [4] W. Yang, Y. Gao, Y. Shi, and L. Cao, “Mrm-lasso: A sparse multiview feature selection method via low-rank analysis,” IEEE transactions on neural networks and learning systems, vol. 26, no. 11, pp. 2801–2815, 2015.
- [5] C. Xu, D. Tao, and C. Xu, “Multi-view learning with incomplete views,” IEEE Transactions on Image Processing, vol. 24, no. 12, pp. 5812–5825, 2015.
- [6] Q. Qian, S. Chen, and X. Zhou, “Multi-view classification with cross-view must-link and cannot-link side information,” Knowledge-Based Systems, vol. 54, pp. 137–146, 2013.
- [7] Y. Yang and H. Wang, “Multi-view clustering: A survey,” Big Data Mining and Analytics, vol. 1, no. 2, pp. 83–107, 2018.
- [8] M. Hu and S. Chen, “Doubly aligned incomplete multi-view clustering,” in Twenty-Seventh International Joint Conference on Artificial Intelligence IJCAI-18, 2018.
- [9] J. Wang, C. Tang, Z. Wan, W. Zhang, K. Sun, and A. Y. Zomaya, “Efficient and effective one-step multiview clustering,” IEEE Transactions on Neural Networks and Learning Systems, 2023.
- [10] Z. Li, C. Tang, X. Liu, X. Zheng, W. Zhang, and E. Zhu, “Consensus graph learning for multi-view clustering,” IEEE Transactions on Multimedia, vol. 24, pp. 2461–2472, 2021.
- [11] H. Yu, J. Tang, G. Wang, and X. Gao, “A novel multi-view clustering method for unknown mapping relationships between cross-view samples,” in Proceedings of the 27th ACM SIGKDD Conference on Knowledge Discovery & Data Mining, 2021, pp. 2075–2083.
- [12] Z. Huang, P. Hu, J. T. Zhou, J. Lv, and X. Peng, “Partially view-aligned clustering,” Advances in Neural Information Processing Systems, vol. 33, pp. 2892–2902, 2020.
- [13] M. Yang, Y. Li, Z. Huang, Z. Liu, P. Hu, and X. Peng, “Partially view-aligned representation learning with noise-robust contrastive loss,” in Proceedings of the IEEE/CVF conference on computer vision and pattern recognition, 2021, pp. 1134–1143.
- [14] M. Yang, Y. Li, P. Hu, J. Bai, J. C. Lv, and X. Peng, “Robust multi-view clustering with incomplete information,” IEEE Transactions on Pattern Analysis and Machine Intelligence, 2022.
- [15] J. Lin, M. Chen, C. Wang, and H. Zhang, “A tensor approach for uncoupled multiview clustering,” IEEE Transactions on Cybernetics, 2022.
- [16] Y. Yang, H.-J. Ye, D.-C. Zhan, and Y. Jiang, “Auxiliary information regularized machine for multiple modality feature learning,” in Twenty-Fourth International Joint Conference on Artificial Intelligence, 2015.
- [17] H. Tang and Y. Liu, “Deep safe multi-view clustering: Reducing the risk of clustering performance degradation caused by view increase,” in Proceedings of the IEEE/CVF Conference on Computer Vision and Pattern Recognition, 2022, pp. 202–211.
- [18] H. Tao, C. Hou, X. Liu, T. Liu, D. Yi, and J. Zhu, “Reliable multi-view clustering,” in Proceedings of the AAAI conference on artificial intelligence, vol. 32, no. 1, 2018.
- [19] P. Rai, A. Trivedi, H. Daumé III, and S. L. DuVall, “Multiview clustering with incomplete views,” in Proceedings of the NIPS Workshop on Machine Learning for Social Computing. Citeseer, 2010.
- [20] J. Wen, Z. Zhang, Y. Xu, B. Zhang, L. Fei, and H. Liu, “Unified embedding alignment with missing views inferring for incomplete multi-view clustering,” in Proceedings of the AAAI conference on artificial intelligence, vol. 33, no. 01, 2019, pp. 5393–5400.
- [21] J. Wen, Z. Zhang, Z. Zhang, L. Zhu, L. Fei, B. Zhang, and Y. Xu, “Unified tensor framework for incomplete multi-view clustering and missing-view inferring,” in Proceedings of the AAAI conference on artificial intelligence, vol. 35, no. 11, 2021, pp. 10 273–10 281.
- [22] C. Zhang, J. Wei, B. Wang, Z. Li, C. Chen, and H. Li, “Robust spectral embedding completion based incomplete multi-view clustering,” in Proceedings of the 31st ACM International Conference on Multimedia, 2023, pp. 300–308.
- [23] Q. Yin, S. Wu, and L. Wang, “Unified subspace learning for incomplete and unlabeled multi-view data,” Pattern Recognition, vol. 67, no. 67, pp. 313–327, 2017.
- [24] W. Yang, Y. Shi, Y. Gao, L. Wang, and M. Yang, “Incomplete-data oriented multiview dimension reduction via sparse low-rank representation,” IEEE Transactions on Neural Networks and Learning Systems, pp. 1–16, 2018.
- [25] J. Liu, X. Liu, Y. Zhang, P. Zhang, W. Tu, S. Wang, S. Zhou, W. Liang, S. Wang, and Y. Yang, “Self-representation subspace clustering for incomplete multi-view data,” in Proceedings of the 29th ACM international conference on multimedia, 2021, pp. 2726–2734.
- [26] A. Li, C. Feng, Z. Wang, Y. Sun, Z. Wang, and L. Sun, “Anchor-based sparse subspace incomplete multi-view clustering,” Wireless Networks, pp. 1–12, 2023.
- [27] L. Houthuys and J. A. K. Suykens, “Unpaired multi-view kernel spectral clustering,” in 2017 IEEE Symposium Series on Computational Intelligence (SSCI), 2017.
- [28] I. Muslea, S. Minton, and C. A. Knoblock, “Active learning with multiple views,” Journal of Artificial Intelligence Research, vol. 27, pp. 203–233, 2006.
- [29] Y. Yang, D.-C. Zhan, Y. Jiang, and H. Xiong, “Reliable multi-modal learning: A survey,” Journal of Software, vol. 32, no. 4, pp. 1067–1081, 2020.
- [30] Y. Yang, D.-C. Zhan, and Y. Jiang, “Learning by actively querying strong modal features.” in IJCAI, 2016, pp. 2280–2286.
- [31] Y. Yang, D.-C. Zhan, Y.-F. Wu, Z.-B. Liu, H. Xiong, and Y. Jiang, “Semi-supervised multi-modal clustering and classification with incomplete modalities,” IEEE Transactions on Knowledge and Data Engineering, vol. 33, no. 2, pp. 682–695, 2019.
- [32] Y. Yang, J.-Q. Yang, R. Bao, D.-C. Zhan, H. Zhu, X.-R. Gao, H. Xiong, and J. Yang, “Corporate relative valuation using heterogeneous multi-modal graph neural network,” IEEE Transactions on Knowledge and Data Engineering, vol. 35, no. 1, pp. 211–224, 2021.
- [33] B. Cui, H. Yu, L. Zong, and Z. Cheng, “Self-guided deep multi-view subspace clustering network,” in 2021 IEEE International Conference on Multimedia and Expo (ICME), 2021, pp. 1–6.
- [34] Y. Yang, H. Wei, H. Zhu, D. Yu, H. Xiong, and J. Yang, “Exploiting cross-modal prediction and relation consistency for semisupervised image captioning,” IEEE Transactions on Cybernetics, 2022.
- [35] Y. Mi, H. Chen, Z. Yuan, C. Luo, S.-J. Horng, and T. Li, “Fast multi-view subspace clustering with balance anchors guidance,” Pattern Recognition, vol. 145, p. 109895, 2024.
- [36] S. Wang, X. Liu, X. Zhu, P. Zhang, Y. Zhang, F. Gao, and E. Zhu, “Fast parameter-free multi-view subspace clustering with consensus anchor guidance,” IEEE Transactions on Image Processing, vol. 31, pp. 556–568, 2021.
- [37] Z. Chen, Y. Li, K. Lou, and L. Zhao, “Incomplete multi-view clustering with complete view guidance,” IEEE Signal Processing Letters, 2023.
- [38] J. Xu, H. Tang, Y. Ren, L. Peng, X. Zhu, and L. He, “Multi-level feature learning for contrastive multi-view clustering,” in Proceedings of the IEEE/CVF Conference on Computer Vision and Pattern Recognition, 2022, pp. 16 051–16 060.
- [39] M.-S. Chen, T. Liu, C.-D. Wang, D. Huang, and J.-H. Lai, “Adaptively-weighted integral space for fast multiview clustering,” in Proceedings of the 30th ACM International Conference on Multimedia, 2022, pp. 3774–3782.
- [40] M.-S. Chen, C.-D. Wang, D. Huang, J.-H. Lai, and P. S. Yu, “Efficient orthogonal multi-view subspace clustering,” in Proceedings of the 28th ACM SIGKDD Conference on Knowledge Discovery and Data Mining, 2022, pp. 127–135.
- [41] P. J. Rousseeuw, “Silhouettes: a graphical aid to the interpretation and validation of cluster analysis,” Journal of computational and applied mathematics, vol. 20, pp. 53–65, 1987.
- [42] D. J. Trosten, S. Lokse, R. Jenssen, and M. Kampffmeyer, “Reconsidering representation alignment for multi-view clustering,” in Proceedings of the IEEE/CVF Conference on Computer Vision and Pattern Recognition, 2021, pp. 1255–1265.
- [43] Y. Lin, Y. Gou, Z. Liu, B. Li, J. Lv, and X. Peng, “Completer: Incomplete multi-view clustering via contrastive prediction,” in Proceedings of the IEEE/CVF Conference on Computer Vision and Pattern Recognition (CVPR), June 2021.
- [44] J. Buchner, “An intuition for physicists: information gain from experiments,” Research Notes of the AAS, vol. 6, no. 5, p. 89, 2022.
- [45] N. Abdollahi, S. A. M. Tonekaboni, J. Huang, B. Wang, and S. MacKinnon, “Nodecoder: a graph-based machine learning platform to predict active sites of modeled protein structures,” arXiv preprint arXiv:2302.03590, 2023.
- [46] G. Drainakis, K. V. Katsaros, P. Pantazopoulos, V. Sourlas, and A. Amditis, “Federated vs. centralized machine learning under privacy-elastic users: A comparative analysis,” in 2020 IEEE 19th International Symposium on Network Computing and Applications (NCA), 2020, pp. 1–8.
- [47] C. Niu, H. Shan, and G. Wang, “Spice: Semantic pseudo-labeling for image clustering,” IEEE Transactions on Image Processing, vol. 31, pp. 7264–7278, 2022.
- [48] A. Fahad, N. Alshatri, Z. Tari, A. Alamri, I. Khalil, A. Y. Zomaya, S. Foufou, and A. Bouras, “A survey of clustering algorithms for big data: Taxonomy and empirical analysis,” IEEE Transactions on Emerging Topics in Computing, vol. 2, no. 3, pp. 267–279, 2014.
- [49] X. Yin, J. Goudriaan, E. A. Lantinga, J. Vos, and H. J. Spiertz, “A flexible sigmoid function of determinate growth,” Annals of botany, vol. 91, no. 3, pp. 361–371, 2003.
- [50] J. Liu, X. Liu, Y. Yang, L. Liu, S. Wang, W. Liang, and J. Shi, “One-pass multi-view clustering for large-scale data,” in Proceedings of the IEEE/CVF International Conference on Computer Vision, 2021, pp. 12 344–12 353.
- [51] X. Liu, L. Liu, Q. Liao, S. Wang, Y. Zhang, W. Tu, C. Tang, J. Liu, and E. Zhu, “One pass late fusion multi-view clustering,” in International Conference on Machine Learning. PMLR, 2021, pp. 6850–6859.
- [52] Y. Geng, Z. Han, C. Zhang, and Q. Hu, “Uncertainty-aware multi-view representation learning,” in Proceedings of the AAAI Conference on Artificial Intelligence, vol. 35, no. 9, 2021, pp. 7545–7553.
- [53] J. Wen, Y. Xu, and H. Liu, “Incomplete multiview spectral clustering with adaptive graph learning,” IEEE Transactions on Cybernetics, vol. 50, no. 4, pp. 1418–1429, 2020.
- [54] W. Shao, L. He, C. T. Lu, and P. S. Yu, “Online multi-view clustering with incomplete views,” in 2016 IEEE International Conference on Big Data, 2016.
- [55] M. Hu and S. Chen, “One-pass incomplete multi-view clustering,” Proceedings of the AAAI Conference on Artificial Intelligence, vol. 33, pp. 3838–3845, 2019.
- [56] Y. Lin, Y. Gou, X. Liu, J. Bai, J. Lv, and X. Peng, “Dual contrastive prediction for incomplete multi-view representation learning,” IEEE Transactions on Pattern Analysis and Machine Intelligence, 2022.