[1, 1, 1, 1]Yang Ba, Michelle V. Mancenido, Erin K. Chiou, Rong Pan \authorsaffiliationsArizona State University
Yang Ba0000-0000-0000-0000
Correspondence concerning this article should be addressed to Yang Ba, Ira A. Fulton Schools of Engineering, School of Computing and Augmented Intelligence, Data Science, Analytics and Engineering, Arizona State University, Suite 342AE, 3rd floor 699 S. Mill Avenue Tempe, AZ 85281, E-mail: yangba@asu.edu, 623-272-3499
Data Quality in Crowdsourcing and Spamming Behavior Detection
Abstract
As crowdsourcing emerges as an efficient and cost-effective method for obtaining labels for machine learning datasets, it is important to assess the quality of crowd-provided data, so as to improve analysis performance and reduce biases in subsequent machine learning tasks. Given the lack of ground truth in most cases of crowdsourcing, we refer to data quality as annotators’ consistency and credibility. Unlike the simple scenarios where Kappa coefficient and intraclass correlation coefficient usually can apply, online crowdsourcing requires dealing with more complex situations. We introduce a systematic method for evaluating data quality and detecting spamming threats via variance decomposition, and we classify spammers into three categories based on their different behavioral patterns. A spammer index is proposed to assess entire data consistency and two metrics are developed to measure crowd worker’s credibility by utilizing the Markov chain and generalized random effects models. Furthermore, we showcase the practicality of our techniques and their advantages by applying them on a face verification task with both simulation and real-world data collected from two crowdsourcing platforms.
keywords:
crowdsourcing platform, data quality, spamming behaviors, metrics, generalized random effects models, statistical hypothesis testing1 Introduction
The emergence of crowdsourcing as an online platform for data collection has raised concerns about data integrity due to its widespread popularity and low barriers to entry. Crowdsourcing involves engaging web-based (or crowdsourcing) workers to voluntarily undertake a range of tasks, from simple surveys to complex digital experiments, leveraging collective human intelligence to test research hypotheses or to perform manual labeling (estelles2015crowdsourcing). This approach has gained considerable traction in the social and behavioral sciences as a cost-effective and expeditious method for conducting experimental research (meyer2016net). For example, a 2016 study reported a 10–30% increase in the use of Amazon’s Mechanical Turk platform among the top 3 psychology journals between 2012 to 2015 (zhou2016pitfall). Recently, niche platforms such as Prolific.co have risen in popularity among academic researchers in data-intensive domains, advertising tailored services for filtering the participant pool to increase the chances of credible and reliable responses (peer2022data).
However, crowdsourced data, when compared to data collected from domain experts and proctored experiments, often display significant variability in quality (hsueh2009data). This problem is well-documented in the computer sciences, where crowdsourcing is typically used to obtain annotations or labels, such as images and text, to facilitate the creation of machine learning (ML) datasets. Responses from multiple crowd workers are usually distilled into a ground truth using aggregation methods such as majority voting (tao2018domain). These labeled datasets are then fed into ML algorithms, enabling them to discern patterns and make predictions. For instance, state-of-the-art models are able to identify a pedestrian in an image cluttered with vehicles and buildings (gm2021urban), or subjectively classify sentences with racial biases (waseem2016you). Data variability can lead to a decline in the performance of ML models trained on such data (sheng2019machine; li2016noise). For online experiments, the potential variability in data quality can obscure, amplify, or confound the true effects of the factors under investigation, potentially threatening the validity and generalizability of scientific results (steger2018meta).
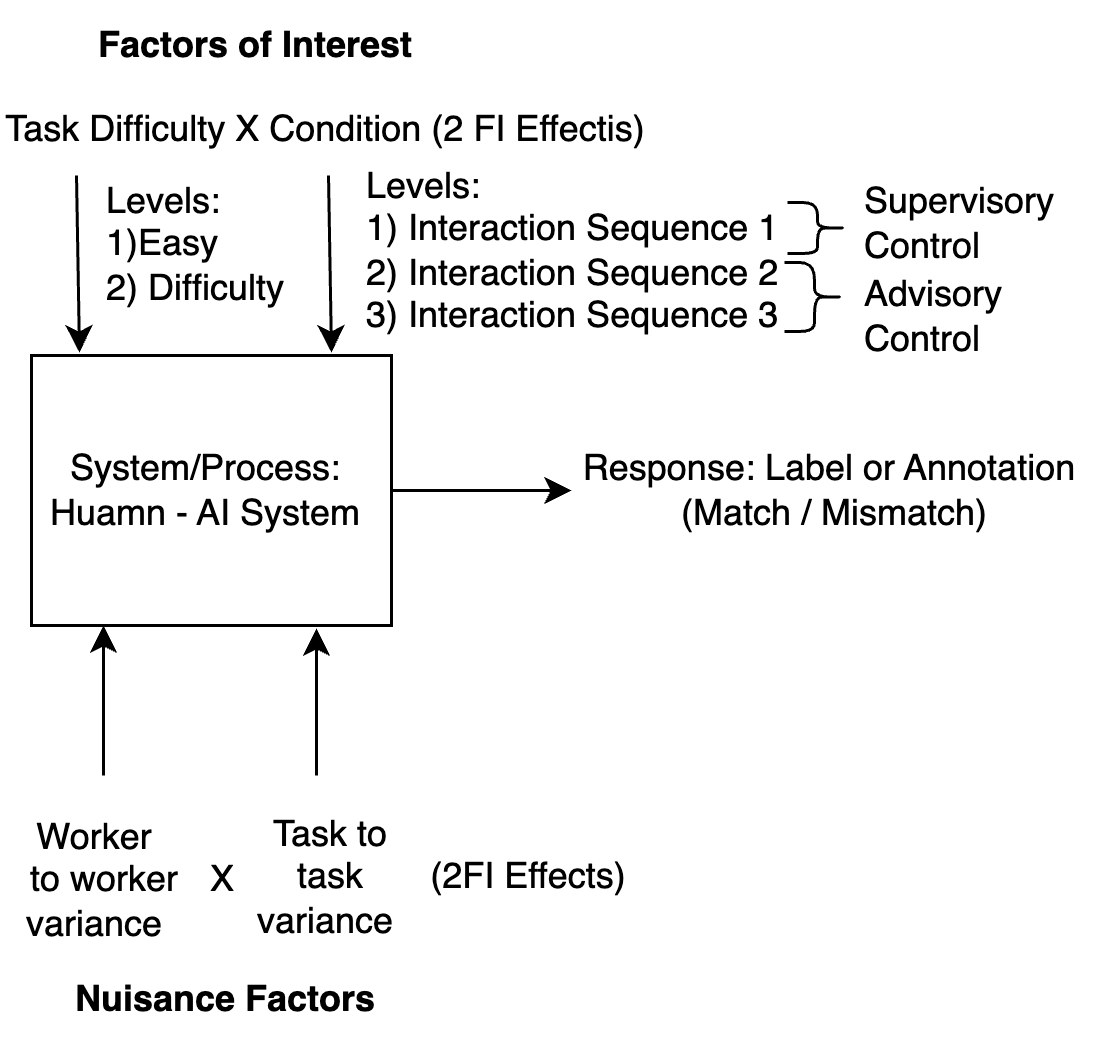
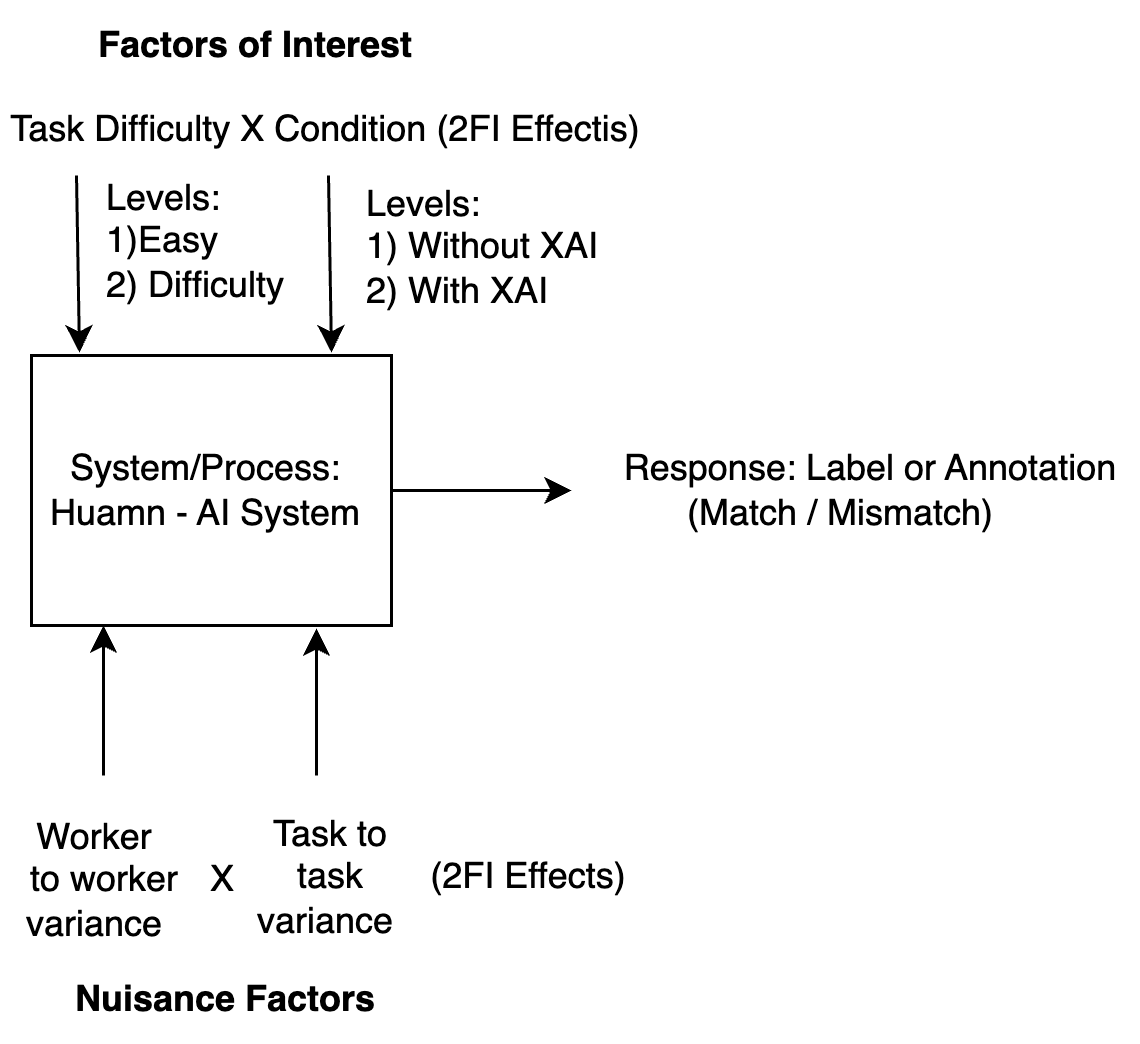
The motivating cases for this research are three experiments on AI-enabled systems conducted by the authors (salehi2023evaluating), wherein two were deployed in crowdsourcing platforms and the third conducted in-person at different airports as part of a funded project with the Department of Homeland Security. A web-based platform was developed to emulate an automated face recognition system (AFRS) with a human-in-the-loop 111https://github.com/YangBa78/Facewise-Readit/tree/main/facewise. Participants were tasked to perform identity verification of two photos, the expected response being a "match" if the photos were of the same person or a "mismatch" if they were of different identities. The experiment was primarily focused on characterizing the effects of the manipulated factors related to the AFRS ("condition") on annotation performance (see Figure 1(b)). Further, the complexity of face matching tasks was empirically manipulated to be easy or difficult. These design variables are called "fixed effects" or factors of interest in experimental design theory (montgomery2017design). Further, following principled guidelines for designing statistically valid experiments, study variables that were not directly linked to the experimental hypotheses but affect the annotations or responses were also identified. These variables, often called nuisance or random effects, include task-to-task differences within a difficulty level and variation among participant competencies. Human-technology interaction studies, such as the one just described, are commonly deployed in the internet using crowdsourcing platforms (peng2013mapping).
In these studies, fixed effects are the primary study parameters that are posited to impact the response or outcome. As secondary parameters, random effects are a result of nuisance variables that are known a priori to have an impact on the outcome; however, typical strategies for alleviating their variational effects, such as randomization, may not be sufficient due to the unproctored and widely accessible nature of crowdsourced data collection. Thus, these nuisance variables are generally expected to contribute to the overall experimental error, which will affect the standard errors of fixed effect estimates and consequently, tests of significance.
While data quality in crowdsourcing platforms spans multi-faceted definitions such as accuracy (hsueh2009data) or completeness (van2010impact), we limit our definition of data quality as the ability of annotators to provide consistent and credible responses over the course of data collection (for succinctness, we refer to this as worker reliability). Consistency and credibility are constructs related to the capability of the measurement system to distinguish among intended variation (such as differences in control and treatment groups), variation due to random chance or experimental error, and measurement error.
Consistency, particularly when there’s no definitive ground truth or gold standard, reflects the degree of concordance among multiple annotators. Existing approaches for gauging consistency include the intra-class correlation coefficient (ICC) for numeric ratings (mehta2018performance) and the Kappa coefficient for categorical annotations (perez2016building; chmura2002kappa; junkes2015validity). These metrics, derived from classical test theory, exhibit some limitations in their applicability to crowdsourced data similar to the motivating case. The ICC, which applies variance decomposition methods akin to gage repeatability and reproducibility studies in quality control (montgomery2009statistical), is designed for truly numeric data. For categorical ratings or annotations such as in identity verification, the Kappa coefficient is a more suitable metric for reporting consistency. However, it bears its own set of limitations; it has been shown, for example, to underestimate true inter-rater reliability in the presence of a dominant category (e.g., unbalanced number of matches and mismatches (kappaharm; feinstein1990high; dettori2020kappa)).
The underlying issue with the Kappa statistic’s reliance on the assumption of independent and randomly distributed responses becomes particularly apparent in crowdsourced environments. Such platforms are prone to attracting annotators who may exhibit systematic, non-credible behaviors. Notorious among these are "spammers" who might, for example, consistently select the first response category. Such behaviors, which are driven not by thoughtful engagement to the task but by the pursuit of rapid financial gain, are overlooked by the Kappa statistic. Prior work has shown its tendency to be overinflated in the presence of spammers (hall2022quality). The metric calculates adjusted pairwise agreements which could artificially be inflated by spamming behaviors that disproportionately favor one category, leading to a high observed agreement that does not reflect true concordance. Thus, in addition to consistency, we must also analyze indicators of credibility of responses as a vital component of measuring the integrity of crowdsourced datasets by detecting potential spamming behaviors.
In this paper, we propose an integrated framework of metrics to retrospectively evaluate the consistency and credibility of crowdsourced data. These methods were particularly developed for online experiments in which preemptive strategies, such as attention checks, may not be sufficient in preventing non-credible responses due to the absence of study proctors. However, the methods proposed in this paper can also apply to manual annotation or labeling tasks for the purposes of generating ML training and testing sets.
The framework is designed to: (1) quantify measurement errors resulting from task-to-task, annotator-to-annotator, and task-within-annotator variation by applying a variance decomposition approach called generalized linear random effects model (GLRM); (2) detect and classify potential spamming behavior using Markov chains, KL divergence, and deletion analysis. We validate the efficacy of the proposed metrics for these tasks through simulation experiments and empirical trials conducted on both online and in-person platforms. Further, we use our proposed approach to corroborate the findings of a prior study (peer2022data) that compares worker reliability between two online platforms namely, Amazon’s Mechanical Turk (MTurk) and Prolific.co.
The proposed framework draws inspiration from classical test theory methodologies, such as item response theory (demars2010item) and generalizability theory (webb20064), yet it offers distinct benefits over traditional metrics. Unlike the Intra-class Correlation (ICC) commonly used in IRT, our method is versatile, capable of handling a diverse class of measurement scales (including binary and nominal responses) that frequently occur in crowdsourced data. Moreover, our use of the GLRM approach facilitates a unified analysis, merging data quality assessment with the estimation of random effects within a single modeling construct. Finally, our method expands on existing approaches by identifying additional indicators of anomalous behaviors in spammers, such as repeated patterns and random guessing.
2 Related Work
A significant portion of research into data quality for crowdsourced tasks has focused on the evaluation of preemptive strategies. These strategies range from employing bot-screening techniques (rodriguez2023creating), assessing worker competency through their track record (gadiraju2017using), mitigating effects of worker fatigue (zhang2018understanding), enhancing task engagement (liang2018intrinsic), to optimizing task design (ceschia2022task). Our proposal, however, takes a retrospective stance, focusing on the post-hoc analysis of data from completed experiments to identify patterns of spamming and subtle behavioral anomalies potentially overlooked by preventive strategies.
Other retrospective approaches in the literature focus on arriving at a consensus for annotations, while taking into account the presence of noise and other exogenous variables that affect data quality. Central to this endeavor are methods such as the Dawid-Skene (DS) algorithm, which applies expectation-maximization (EM) to estimate true labels by modeling the error rates of annotators (dawid1979maximum). These methodologies, rooted in psychometrics and reliability theory, typically use metrics like inter-annotator agreement and intra-class correlation to measure consistency. Thus, in the literature, consistency is often associated with how often annotators agree with themselves and among each other. Yet, they may not fully account for deliberate low-effort contributions or patterned behavior that undermine data integrity.
Recent advances have introduced adaptive algorithms that iteratively adjust to the data submission patterns of contributors, refining quality estimates over time (ipeirotis2014repeated). This reflects a shift toward dynamic assessment models that consider the temporal and behavioral aspects of annotation, which are critical in understanding and leveraging crowd-worker diversity. In practice, however, researchers are faced with budget constraints and it is typical to run online experiments with only one set of workers. Thus, while dynamic assessment models are useful in applications where tasks are laborious and repetitive, such as in image labeling, they have limited usefulness for experiments wherein cost constraints prevent researchers from separately evaluating potential participants.
In the following subsections, we examine existing metrics and methods for measuring the consistency and credibility of crowdsourced data. This discussion aims to set the stage for our contribution, which proposes novel metrics and modeling strategies to enhance the detection and treatment of low-quality data in crowdsourced environments.
2.1 Measures for Consistency
Classical Test Theory (CTT), first developed in the early 20th century (traub1997classical), has been a cornerstone in behavioral and social science research for evaluating the reliability and validity of measurement instruments through its unique focus on observed test scores and error components. In CTT (webb20064), the variance of observed scores () is decomposed into the variance of the true score () plus the variance due to measurement error () i.e., . The intra-class correlation coefficient (ICC), a common metric used to evaluate the consistency of measurement systems, which include annotators or operators, is calculated as:
| (1) |
The idea behind the ICC is to quantify how strongly objects in the same class are grouped together in a measurement (riezler2022validity). In Equation 1, the ICC denotes the ratio of the variance between objects of interest to the total variance , which can also be interpreted as the amount of variation coming from a source of interest. In the context of our motivating problem, the source of interest could be the variation coming from worker-to-worker differences in annotations. Thus, the ICC could be interpreted as the proportion of total variance attributed to inconsistencies in annotations among crowdsourcing workers. Some known limitations of the ICC are their appropriateness only for numeric-scale data (mehta2018performance) and their weaknesses in small-sample and unbalanced data scenarios (kappaharm).
Another widely-used statistical measure for assessing the consistency of annotations or observed responses is the Kappa coefficient. In comparison to the ICC, Kappa is commonly applied to categorical data scales, such as binary or nominal. Its suitability for categorical data is inherent in its calculation: in lieu of comparing variances from sources of interest, Kappa considers chance agreement and adjusts its calculation for chance correction. Two of the more popular variants are Cohen’s Kappa(mchugh2012interrater), which works best when there are two raters; and Fleiss Kappa (falotico2015fleiss), an extension of Cohen’s for any number of raters. Cohen’s Kappa is mathematically equivalent to ICC for binary data (fleiss1973equivalence).
Previous work have presented several weaknesses and limitations of the ICC and Kappa for evaluating crowdsourced data. In some cases, the Kappa score yields conflicting results, posting low values even in the presence of high agreement among annotators (kappaharm). Further, the Kappa score has been documented to be sensitive to the number of classes and raters i.e., a lower number of annotators and classes have been found to be subject to higher chances of random agreement (kappaharm). Additionally, kappa scores have the same class skew issue as ICC, which could affect chance correction, because more errors are expected for majority classes than rare classes. In a more general examination of using ICC and Fleiss’ Kappa for crowdsourced ratings, salminen2018inter found that the nature of the task impacts agreement ratings i.e., the more subjective the task is, the lower the agreement. This suggests that agreement-based metrics are not necessarily an effective, sole measure of overall data integrity.
Finally, both ICC and Kappa scores face interpretation challenges. While some empirical guidelines exist on categorizing whether consistency is poor, fair, good, or excellent based on the calculated values of the metrics, there is no universal recommendation for determining the relationship strength between agreement and calculated scores. For example, guidelines in the original paper (landis1977measurement) only focus on binary data, while many applications in crowdsourced environments yield nominal (e.g., class annotations) or ordinal (e.g., survey responses) data.
2.2 Measures for Credibility: Spammer Detection
Compared to credible online workers or credible online study participants (henceforth "worker" or "workers" for simplicity), spammers are distinguished through displayed systematic behavioral patterns, such as random guessing or choosing a single, consistent answer regardless of task demands. Spammers can also be bots (e.g., software automation), commonly found on crowdsourced platforms. Other types of spamming behaviors are classified and categorized in gadiraju2015understanding, which proposed a "maliciousness" index (MI) for classifying workers as untrustworthy or trustworthy based on the MI. MI is essentially a response acceptability measure that focuses on open-ended question responses. While gadiraju2015understanding validated their work based on average task completion time, indicating that time would have a positive connection with spamming behaviors, the efficacy of time would be argued as a validation metric: participants can achieve good performance with relatively less time spent. Therefore, we only use average task completion time as an auxiliary factor for identifying spammers, serving as a part of assessing workers’ credibility. Correspondingly, we validate our methods against accuracy on well-defined tasks, which provides a triangulating measure of effectiveness.
Among probabilistic methods, MACE (Multi-Annotator Competence Estimation) (hovy2013learning) has been proposed as a graphical model for identifying spammers via unsupervised learning. MACE models and estimates the credibility of annotators and their spamming preferences as latent variables via a generative process, an approach widely use for linguistic data. In comparison to other methods, MACE provides a more accurate estimate of true labels to reduce the noise of data collected in crowdsourcing. However, while MACE considers only one type of spammer, the type that always selects a specific preferred answer (we call these primary-choice spammers), our approach can tackle a wide range of spamming behaviors that notably includes a more challenging to detect behavior, random guessing.
3 Proposed Metrics
In this section, we propose a set of metrics for measuring worker consistency and detecting threats to the credibility of crowdsourced data. Some of these metrics are variance ratio-based, similar to the ICC in which consistency is gauged by the ratio of variance pertaining to the variable of interest against the overall variance, while other metrics are models-based, leveraging log-likelihood derived from the identical model that assesses worker consistency and statistical significance (p-value) to indicate which responses are spammers. We then introduce an alternative approach to detect spamming behaviors, which involves classifying common spamming behaviors and exploring the correlation between the efficacy of consistency measurement and the detection of potential spamming threats. Our results indicate the importance of assessing data quality from two facets: consistency and credibility.
3.1 Metric - Consistency
Classic Test Theory (CTT) and the intra-class correlation coefficient (ICC) are metrics employing the variance ratio concept, wherein the variance of interest is divided by the total variance. We adopt this framework to assess the consistency of crowdsourced data. In the context of crowdsourcing tasks, both tasks and participants are typically drawn randomly from their respective populations. Considering a simple scenario, a single crowd worker is assigned to handle multiple tasks while each task is completed by multiple workers. Thus, the total variance contains the variance of workers, the variance of tasks, and the variance of interactions between them. We propose a variance ratio-based metric called Spammer Index to measure the overall data quality.
| (2) |
Compared to the intra-class correlation coefficient (ICC) in equation (1), there is no residual variance , since generalized linear models do not estimate error terms in the same way as linear regression models do for numerical data. browne2005variance discusses methods for the estimate of the variance of error terms in the non-linear models, focusing primarily on logistic models, including simulation and latent variable approach. The simulation method requires extra computations while the latent variable approach treats the binary response variable (0, 1) coming from an underlying continuous variable and applies the variance for the standard logistic distribution = 3.29. However, this variance is fixed and serves as a regularization term without significant impact on the relative degree of the whole variance ratio. In this paper, even though we mainly discuss the scenario of binary response variables (more details in the Experiment Section), it is worth noting that our method can generally apply to multi-class cases. Therefore, for the sake of computing simplicity and broader applicability, we exclude error terms from Spammer Index. We employ generalized linear random-effects models (GLRM) to capture the variance components since random effects are of interest. We exclude fixed predictors because they are not relevant variables that determine data quality in crowdsourcing as shown in Figure 1(b). The GLRM specification for random effects is as below:
| (3) |
where i is the index of a crowd worker (i = 1, …,i); j is the index for a task (j =1, …, j). Let equal to 1 for one of the binary options and 0 for the other and is the probability of response of worker i for task j; is the intercept parameter. is the random effect of worker i and ; is the random effect of task j and ; is the random effect of worker i at task j and ;
When crowd workers are more likely to agree with themselves or other workers, the variance among workers is small, and vice versa. Therefore, to have quality data in crowdsourcing, the variance of workers should account for a small part of the total variance and the variance of tasks should dominate the total variance. On the other hand, when there is a higher variance among workers, it indicates less agreement among them and suggests the presence of less reliable crowd workers. Thus, a higher Spammer Index informs that there is a higher likelihood of data contamination by spamming or other unreliable contributions from workers.
In more complicated online experiments, experiment designers may require crowd workers to annotate the same tasks multiple times by shuffling the order of tasks. They can obtain more precise responses by aggregating the same workers’ annotations from different time stamps. In this scenario, the total variance of Spammer Index includes , and .
3.2 Metric - Credibility
3.2.1 Spamming Behaviors Classification
As a metric to assess the level of agreement among workers in the context of crowdsourcing, the Spammer Index may not encompass all information related to the credibility of workers. Rather, the Spammer Index is closely related to the distribution of worker responses and provides insights into the consistency or inconsistency of their responses. However, response patterns of spammers and unreliable workers vary. Our paper considers three typical spamming behaviors: Primary Choice, Repeated Pattern, and Random Guessing, described in more detail below.
-
•
Primary Choice: The spammer has a strong preference to choose a specific response; i.e., they usually do not pay attention to the question instructions and always select the same answer. Their responses have a skewed distribution and a long run with the same answer(s) continuously, e.g., 1 0 0 0 0 0 0 0 0 0 0 …
-
•
Repeated Pattern: The spammer switches their answers and repeats this type of behavior frequently through all tasks, e.g.: 0 1 0 1 0 1 0 1 …
-
•
Random Guessing: The spammer randomly picks their responses for each task. There is no obvious pattern for their responses. Their behavior patterns are very similar to those of credible workers if the tasks are also assigned randomly.
It is generally assumed that spammers do not adhere to task instructions and aim to complete tasks quickly with minimal effort, often to maximize financial reward (gadiraju2015understanding). There may also be cases in which study participants also do not adhere to task instructions and aim to complete a study task quickly and with minimal effort, due to social or other pressures, and not necessarily to gain any financial benefit. Our focus will be on identifying patterns associated with these typical spamming behaviors. While it is not a universal truth in every scenario, spammers often exhibit lower accuracy compared to credible workers, making accuracy a potential standard to validate our approaches.
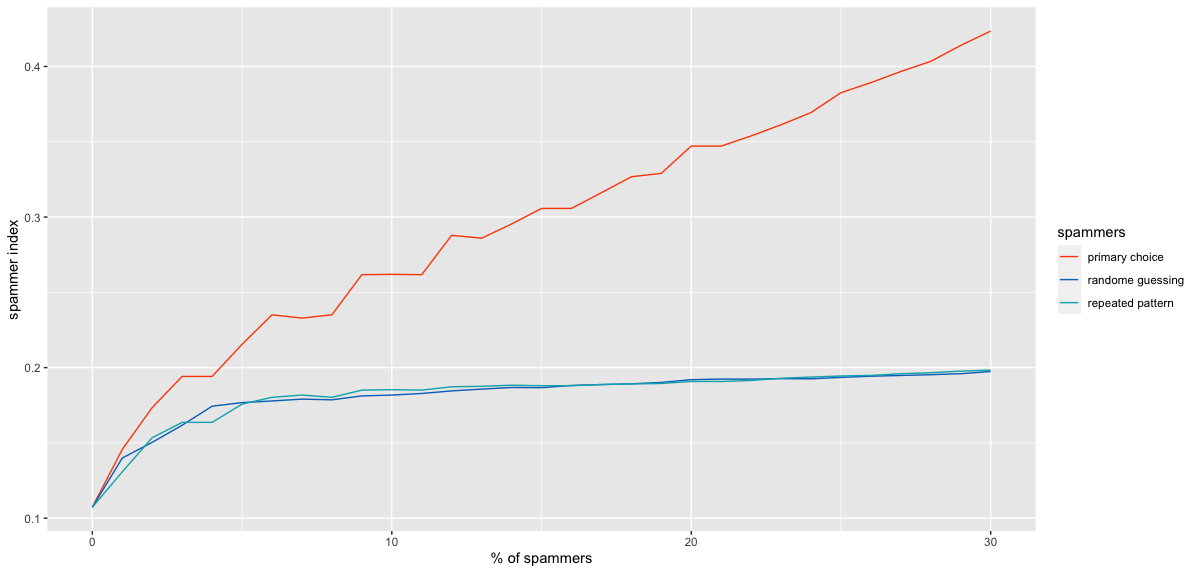
To explore the correlation between Spammer Index and multiple spamming behaviors, we intentionally added up different percentages of spamming behaviors based on the same amount of credible workers and compared how the Spammer Index changed for three different categories. Figure 2 shows that it is more sensitive to detecting crowd workers whose behaviors belong to Primary Choice. Because of this limitation, the Spammer Index is used as the first step of data quality evaluation to give us a sense of the consistency of the data, which can be considered one indicator of data quality. We will use other statistical methods to detect spamming behaviors based on different response patterns to measure credibility.
3.2.2 Markov Chains and Metrics based on KL Divergence
Our methods of identifying spamming behaviors focus on crowd workers’ responses. Workers input their responses task by task, which forms sequential discrete data. There are some patterns that distinguish spammers from credible workers within that sequence. Each response is considered a state and it is considered a stochastic process from one state to another state. Markov chain (spedicato2017discrete) is an appropriate method to deal with this discrete space stochastic process. The Markov property is satisfied by this process:
and denotes the responses from crowd workers. Because of the memory-less property, a transition probability matrix is estimated to represent the probability of transitioning from one state to another state: ; for each row in the matrix, they sum up to 1, .
The transition probability matrix estimated from observed data is called the observed transition matrix. The typical spamming matrix is called the target transition matrix. Each type of spammer has a specific target matrix. For example, typical Random Guessing spammers have an equal probability of transitioning from one state to another. We define the following three transition matrices:
represents the target transition matrix of Primary Choice spammers (pc), who always have a very high probability of going to the preferred choice no matter what the last choice is. denotes the target transition matrix of Repeated Pattern spammers (rp), who have a very high probability of switching their choices. is the target transition matrix of Random Guessing spammers (rg), whose probability of turning to either choice is 0.5.
Each row of the transition matrix is considered a distribution and a metric is applied to calculate the distance between the i-th row of the observed transition matrix and i-th row of the target transition matrix. Kullback-Leibler divergence (KLD) (belov2011distributions) is commonly used to calculate the similarity between two distributions. Minimizing the Kullback-Leibler divergence is equivalent to maximizing likelihood estimation. Therefore, we propose the average Kullback-Leibler divergence (aKLD) to measure the similarity of observed behavior patterns and typical spamming behaviors.
| (4) |
where , i=1, 2 (since we focus on binary cases); is the distribution of i-th row of observed transition matrix and is the distribution of i-th row of the target transition matrix. A small average KLD value means the observed behaviors are similar to the target spamming behaviors. The smaller aKLD a worker has, the more likely the worker is a spammer. We use the simulation method to determine empirical cutoffs for whether a crowd worker’s behaviors could be considered spamming.
Sometimes the estimated transition matrix may exhibit a mixed style that does not belong to any typical defined spamming behavior but their aKLD may be below one of the thresholds that identify spammers. See an example below:
In the first row of the transition matrix, the worker may belong to Random Guessing behaviors, while the second row of the transition matrix indicates that the worker may be exhibiting Primary Choice spamming behavior. However, we do not consider this type of inconsistent spamming behavior. To exclude weak spamming behavior patterns like this, we propose two strategies:
-
•
Apply aKLD to both and . Only if both and are lower than the threshold, we will consider these workers as spammers;
-
•
Use minimum KLD as the threshold. Minimum KLD is a stricter metric that tends to provide a lower threshold and it finds out the crowd workers whose behaviors present the highest similarity to the characteristics of spamming behaviors.
| (5) |
3.2.3 Deviance Distance
We introduce a second approach to evaluate the credibility of workers through residual analysis. Residual analysis is a technique to assess regression models’ validity and find out the influential data points by model diagnostics. Deviance residuals (smyth2003pearson; pierce1986residuals) are used to evaluate the goodness-of-fit of a generalized linear model (GLM) by comparing the fitted model with a fully saturated model. It is calculated by the sign of actual responses minus predicted responses to quantify the extent to which the probabilities estimated from the fitted model differ from the observed data, enabling the identification of observations that are poorly explained by the model. However, in the case of GLRM, we refer to "the saturated model" as the original model with all observations.
| (6) |
where represents parameters of the GLRM with all data, denotes parameters of the GLRM after deleting observations from worker i. Deviance distance (D) is used to detect the most influential workers whose observations have a significant effect on the overall fit of the model. In other words, the most influential workers are the ones who have different response patterns compared to the rest of the workers.
Deviance distance equals to the log-likelihood ratio statistic, which follows an asymptotic Chi-squared distribution (wilks1938large). We pick the significant critical level (0.05) and employ the Chi-squared test to find out the most influential workers who significantly change the model parameters estimation. The degree of freedom is equivalent to the difference in dimensionality of and , the number of deleted observations of worker i. Deviance distance is a model-based metric that requires building the generalized linear random effects model correctly to represent the nature of the data, and identical to the model used to compute the Spammer Index.
In the following sections, we will demonstrate our approaches via a face-verification experiment described in the Introduction using both simulation and real-world scenarios. Even though the responses in our demonstration cases are binary, our approaches can be extended to multi-categorical scenarios easily. In detail, Markov chains can estimate transition probability that contains multiple levels. Correspondingly, the numerator of Equation 4 will change as (i = the number of levels of responses). Moreover, a generalized linear random-effects model is required to calculate the Spammer Index and Deviance Distance, where we recommend using the R package "brms" (burkner2017brms) which can fit the generalized linear random effects models for multi-category responses, for example.
4 Simulation Study
In this section, we demonstrate our methods for detecting spamming behaviors using simulated data. Using simulation techniques, we can generate synthetic data that mimic various spamming behaviors. This enables us to establish thresholds that aid in identifying and categorizing spamming behaviors accurately. Moreover, the simulation-based approach allows us to validate the robustness and reliability of our detection methods by assessing their performance in a controlled environment.
4.1 Simulation Procedure
The data simulation follows the variance decomposition approach, wherein responses from participants consist of multiple random effects, including random effects of tasks, random effects of workers, and random effects of their interactions. Spamming behaviors are simulated by manipulating the random effects, as we regard these effects as intrinsic properties. Since majority voting is the primary strategy to obtain the ground truth via aggregating responses of all participants, we treat the random effects of tasks as the ground truth in simulation. If the random effects of workers and interactions are small enough to make the random effects of tasks dominate, the response is more likely to be correct. Also, random effects of workers represent the workers’ individual preferences and random effects of interactions reflect how workers respond to specific tasks.
Simulation models vary based on different behavioral patterns. Specifically, credible workers have a smaller proportion of variance related to workers and interactions to guarantee that the variance of tasks would contribute the most part of the total variance, which thereby leads to an accuracy range of 0.75 to 0.9 for credible workers. For the Primary Choice spamming behavior, given that our tasks involve binary selections, we leverage the results of (schilling1990longest) to calculate the longest run of a binomial experiment. The expected length of the longest one-choice run is , where p= 0.5 and n is the number of tasks. When n = 80 for example, we expect the longest run of the same response continuously to be rounded to 6 and the standard deviation of the length of the longest run roughly equals . Thus, to approximate a 95% confidence interval, we simulated the same response to appear in a continuous length of at least 10 times (6+4) as representative of Primary Choice spamming behavior.
For the Repeated Patterns, we switched the probability of task n and task n+1 by controlling the random effects of interaction. In detail, if they have a 0.8 probability of making one decision for task n, they will have a 0.8 probability of making the opposite decision for task n+1. Random Guessing spammers were relatively easier to simulate – we controlled each decision to have an equal probability of selecting either answer by setting the addition of random effects equal to 0 and the logit of 0 as 0.5.
4.2 Emperical Average KLD Cutoffs Via Bootstrapping
Hypothesis testing is employed to determine empirical aKLD cutoffs for detecting spamming behaviors. We control type I error to 0.05 and simulate both 30000 of each type of spammers and 30000 of credible workers. The distributions of aKLD from spammers and credible workers are expected to be different. Our hypothesis is given below:
To test this hypothesis, we use aKLD as the test statistics. When aKLD , we reject the null hypothesis where is the empirical cutoff that is constructed at the 95 % confidence level. varies according to different spamming behaviors. In our case, . To be consistent with data we collected from a real crowdsourcing platform, we experimented with the number of tasks to be 72, 77, or 80 (Table 1).
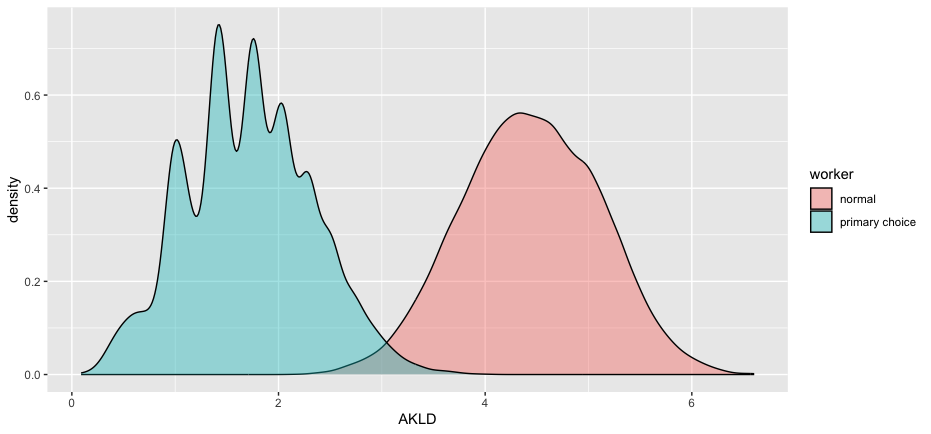
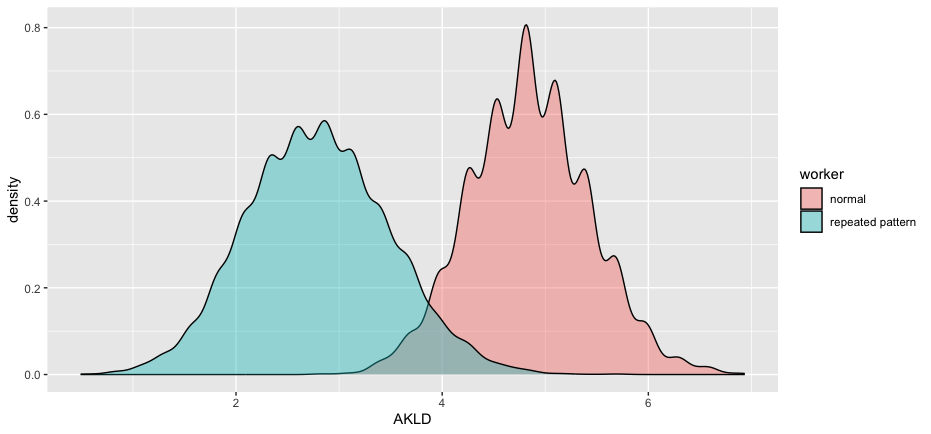
Figure 3(c) shows aKLD distributions of simulated data, where Figures 3(a) and 3(b) are cases that represent Primary Choice spammers and Repeated Pattern spammers, respectively. Their distributions depart from that of credible workers. Their type II errors are as small as 0.0044 and 0.0547, respectively. The aKLD cutoffs based on simulation are 3.367109 for Primary Choice and 3.924257 for Repeated Pattern.
For Random Guessing spammers, since their aKLDs follow an exponential-like distribution, we transform aKLD into its square root form for better comparison. We first use the Kolmogorov-Smirnov test (KS test) (berger2014kolmogorov), calculating the maximum difference based on the cumulative distribution function (CDF), to compare these two distributions and confirm that they are sampled from two distributions with the p-value of 2.2e-16 and D statistic of 0.4524.
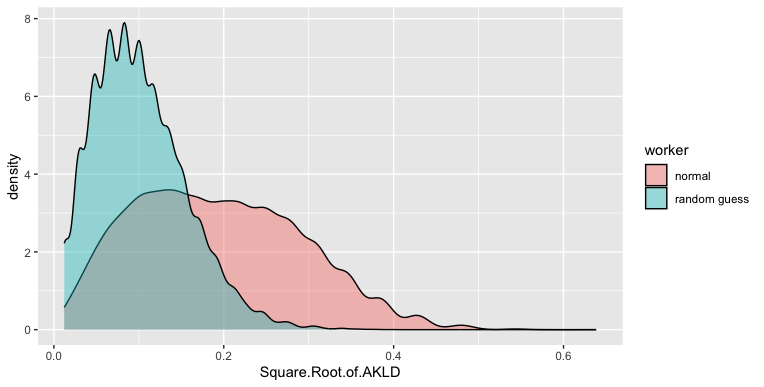
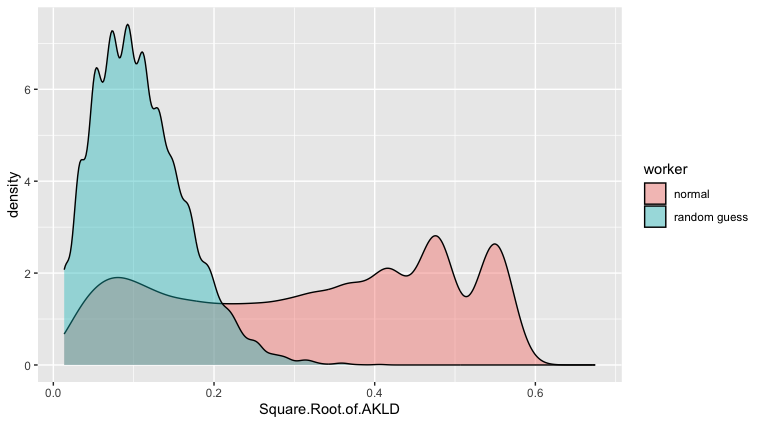
However, the aKLD distribution from Random Guessing spammers overlaps with credible workers (see Figure 3(c)). Its type II error is 0.8248 and aKLD cutoff is 0.002212449. Two reasons for this could be attributed to the remarkable similarity between Random Guessing spammers and credible workers, and the small number of tasks. From the response behaviors’ perspective, they have a similar pattern. In crowdsourced tasks, tasks are often allocated to workers randomly, resulting in a significant degree of randomness in credible workers’ responses. Also, responses from Random Guessing spammers are inherent with randomness, which explains their similarity and why the two distributions do not separate well in Figure 3(c). In imbalanced data scenarios (disproportionate distribution for classes of responses), the aKLD demonstrates superior performance (see Figure 4(a)). This improvement is attributed to the reduction of overlap between the distributions, resulting in a decrease in type II error. In such cases, credible workers are less likely to exhibit randomness from tasks with skewed distributions.
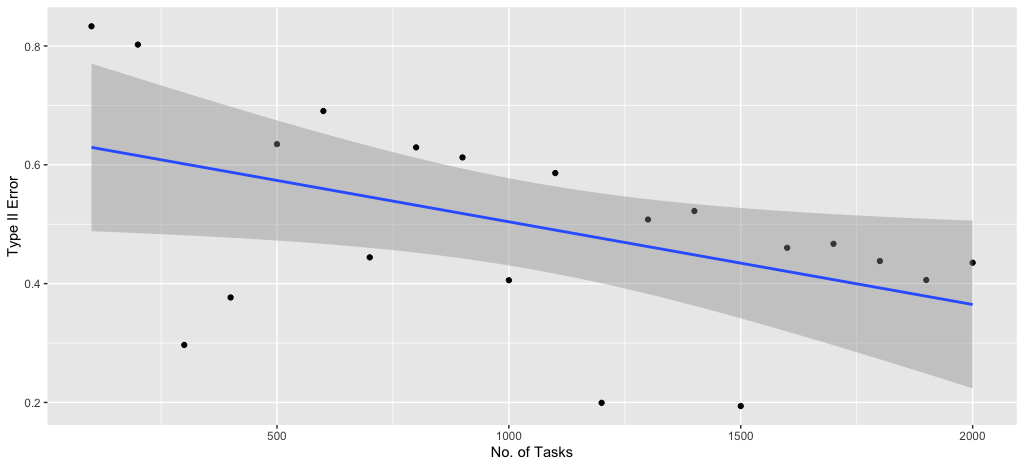
On the other hand, a small number of tasks would not accurately reflect the underlying distribution of responses. With the increase in the number of tasks workers deal with, the transition probability matrix from Markov chains can be estimated more precisely. We tested this assumption by increasing the number of tasks up to 2000 for balanced data. We can see the trend is clear in Figure 4(b): Type II error decreases as the number of tasks increases, and type II error observed with 2000 tasks is 0.4352, representing a significant improvement.
From these simulation results, it is evident that the empirical cutoff of aKLD exhibits strong statistical power at the 95% confidence level for detecting both Primary Choice and Repeated Pattern spammers. However, in cases of Random Guessing, while we can confidently identify workers flagged by the cutoffs as at least 95% likely to be spammers, we may overlook many other potential Random Guessing spammers.
In the subsequent analysis, we incorporate time as an auxiliary factor to filter the workers determined by aKLD, as time plays a decisive role in classifying spammers(wang2020collueagle). Assuming that spammers are motivated to complete tasks as quickly as possible with little to no human attention on the tasks being asked of them, we employ a filtering approach to identify crowd workers whose average task completion time falls below one standard deviation below the mean. Additionally, spending less time on particularly difficult tasks indicates carelessness or unreliability of workers’ responses, potentially leading to lower accuracy in results, even if spamming behavior is not intentional.
4.3 Deletion Analysis
To assess the deletion analysis approach, we simulated 10% spammers out of the total workers with the same simulation strategy, which contains 108 credible workers and 12 spammers, including 4 Primary Choices, 4 Repeated Patterns, and 4 Random Guessers. The IDs of spamming workers are from 1 to 12. Each worker is assigned to work on 80 different tasks. The dimension of simulated data is 120*80 = 9600. The data quality (Spammer Index) of credible workers is 0.01272426 and after involving spammers, this value increases to 0.0607043.
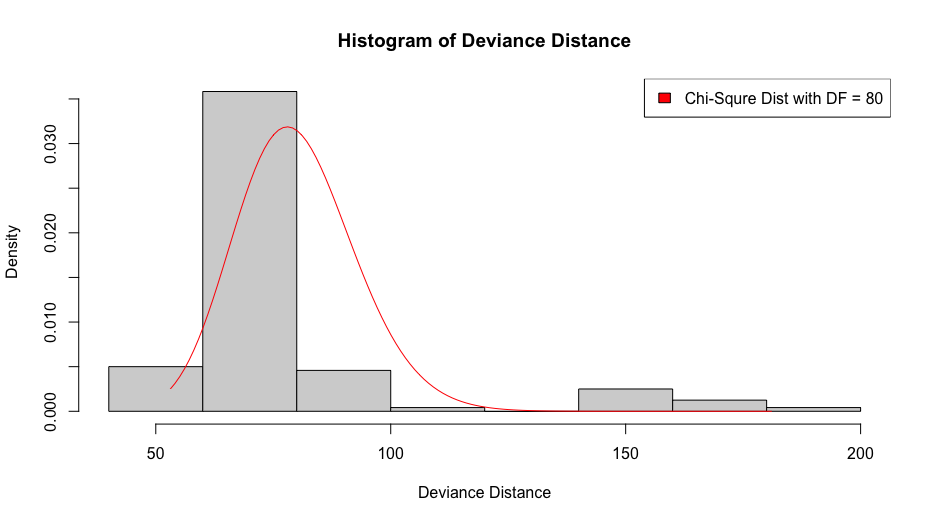
We generate the histogram of deviance distance for the simulation data and fit a Chi-squared distribution with 80 degrees of freedom (the red curve in Figure 5(a) ) to verify the Chi-squared distribution of deviance distance. Figure 5(b) is the result after performing deletion analysis. The red line is the distribution of the Chi-squared test with 80 degrees of freedom for a significant level of 0.05. The deviance distances of the first 12 workers all exceeded the cutoff, indicating the successful detection of all spammers.
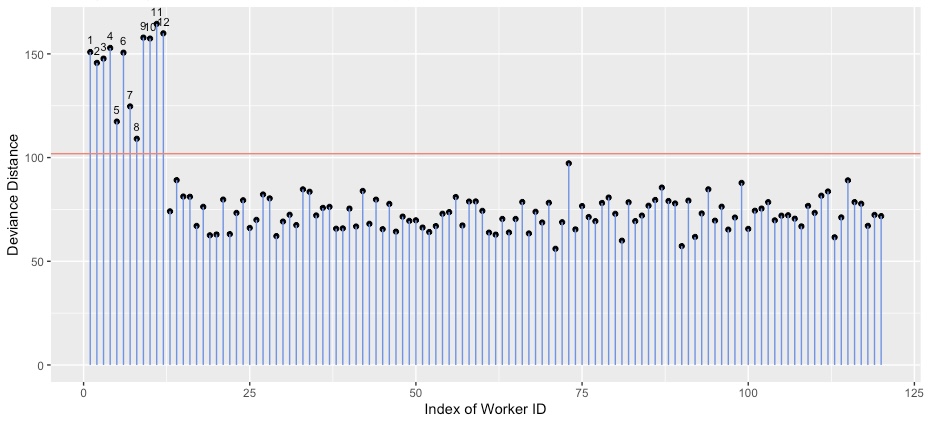
One drawback of deletion analysis is its heavy computational burden when dealing with large datasets, as it requires iterating all observations from each worker. Additionally, we will obtain little information about the type of spamming behavior. However, by comparing the value of deviance distance, the deletion method appears relatively insensitive to Primary Choice spamming. This observation is evident in Figure 5(b), where the deviance distances associated with Primary Choice spammers (Worker No. 5 to No. 8) are smaller compared to those of the other two spammer types. It is recommended that applying both methods to measure credibility would be beneficial.
5 Experiment
In this section, we present an experiment mentioned in the introduction to validate the effectiveness of our methods in measuring crowd workers’ consistency and credibility. We illustrate the application of our proposed metrics to assess data quality in a real-world scenario and filter participants using auxiliary information, the time spent on tasks, to identify spammers. We use the accuracies of the workers’ responses in our experimental tasks (in which the ground truth is known by the experimenters) to serve as the standard in our validation.
5.1 Data Collection in Crowdsourcing and from Experts
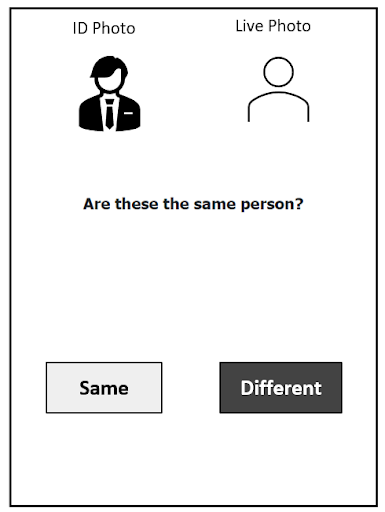
We designed a set of face-verification tasks to gather responses from crowd workers. In these tasks, workers are instructed to imagine themselves as Transportation Security Officers (TSOs) responsible for the ID verification process at airport checkpoints. Their task is to compare two similar face images and determine whether the image pair depicts the same person(Figure 7). Their responses are logged as either "Same" or "Different". We selected two representative crowdsourcing platforms: Amazon Mechanical Turk (MTurk) and Prolific. MTurk (mturk) is one of the earliest and largest crowdsourcing platforms with a vast pool of workers from diverse backgrounds. While Prolific(prolific), a newer platform used primarily for academic research, has experienced rapid growth in the past few years. Both platforms offer monetary compensation. Previous research (peer2022data) states that the data quality collected from Prolific exceeds that in MTurk. Therefore, we expect data collection via Prolific to be of better quality and involve fewer spamming behaviors. We recruited 160 participants from MTurk, each tasked with completing 77 tasks, and 138 participants from Prolific, each assigned 72 tasks.
Furthermore, to facilitate a comparison with the data quality in crowdsourcing, we enlisted 152 subject matter experts, U.S. Transportation Security Officers (TSOs) from three major U.S. airports in Phoenix, Las Vegas and San Diego. Each of TSOs agreed to participate in our experiment without financial rewards to complete 80 face-matching tasks. We assume that data collection from TSOs exhibits high quality because of their expertise in face-matching tasks. However, this does not necessarily imply that they are consistently motivated and focused throughout tasks to provide quality data without any spamming in the light that they could feel bored due to the difference between our experiment and the real task they are facing daily and they are volunteers in the absence of monetary incentives. Table 1 provides details of the data and data quality in these three experiments.
| Platform | Number of Workers | Number of Tasks | Spammer Index |
| MTurk | 160 | 77 | 0.166 |
| Prolific | 138 | 72 | 0.065 |
| Airports | 152 | 80 | 0.079 |
The generalized linear random-effects model is built by R programming language and package "lme4" (lme4). The model structure in R code is below:
5.2 aKLD Performance
Applying the aKLD method requires empirical thresholds that are derived from simulated data based on the descriptions in Table 1. We implement the first strategy discussed in the Proposed Metric section: Apply aKLD to both and . Only those individuals with both and values smaller than the threshold would be deemed to pass our selection criteria. Table 2 shows the results. Workers’ accuracy is calculated through all tasks as the standard to validate the performance of the Markov chain & aKLD method. Two scales for accuracy evaluation are employed here: lower than the mean, which is lower than 50% of participants, and lower than one standard deviation (SD) below the mean, which is lower than 84% of participants.
| Platform | Number of total spammers | Number of spammers for Primary Choice | Number of spammers for Repeated Pattern | Number of spammers for Random Guessing | Number of spammers whose accuracy lower than the mean | Number of spammers whose accuracy lower than 1 SD below the mean |
|---|---|---|---|---|---|---|
| MTurk | 29 (18) | 18 (12) | 6 (5) | 5 (1) | 22 (15) | 11 (7) |
| Prolific | 10 (5) | 5 (2) | 3 (3) | 2 (0) | 5(2) | 3(1) |
| Airports | 13 (8) | 8(3) | 3(3) | 2(2) | 4(3) | 4(3) |
-
Note: The number within parentheses denotes the amount of identified spammers after applying time filtering: whose average time on tasks is below the mean.
Given that spammers are assumed to spend less time accomplishing tasks, we can identify those whose average task completion time is below the overall average to reduce the false positive error. The values within parentheses in Table 2 represent the numbers of spammers detected for each dataset after applying the filter based on task completion time —specifically, those whose average time on tasks is below the overall average.
Table 2 shows that the number of detected spamming behaviors is highly correlated with the Spammer Index in Table 1, where we found some interesting trends. 1) When the Spammer Index is higher, we tend to observe a larger count of spammers. Simplistic spamming behaviors (Primary Choice and Repeated Patterns) are relatively common. 2) As the Spammer Index increases, the correlation between detected spammers and lower accuracy becomes more apparent. The data collected from MTurk has the worst data quality of these three sources and among its spammers detected, 74.86% (83.33% after time filtering) of their accuracies are lower than the average and 37.93% (38.89% after time filtering) are lower than one standard deviation below the average. In contrast, the data from Prolific exhibits the highest data quality among these three datasets, with the fewest spammers detected. Among them, 50% (40% after time filtering) of their accuracies fall below the average, and 30% (20% after time filtering) is lower than one standard deviation from the average. For the data collected from TSOs, 30.77% (37.5% after time filtering) of accuracies of spammers fall below the average while 30.77% (37.5% after time filtering) are lower than one standard deviation from the average respectively.
5.3 Deletion Analysis Results
To implement deletion analysis, we employ the generalized linear random effects model, sharing the same underlying structure as the model used to calculate the Spammer Index, to compute the deviance distance. Deletion analysis is carried out based on the worker ID. In Figure 8(c), the worker IDs above the red line represent potential spammers who exceed the thresholds set by the Chi-squared test (0.05 significant level). In the MTurk data, we identify 6 crowd workers whose response patterns are significantly different from the rest. 1 potential spammer is detected in the Prolific data while 4 spammers are found in the airport data. The result is consistent with the assumption that a larger Spammer Index indicates more potential spamming behaviors in the data.
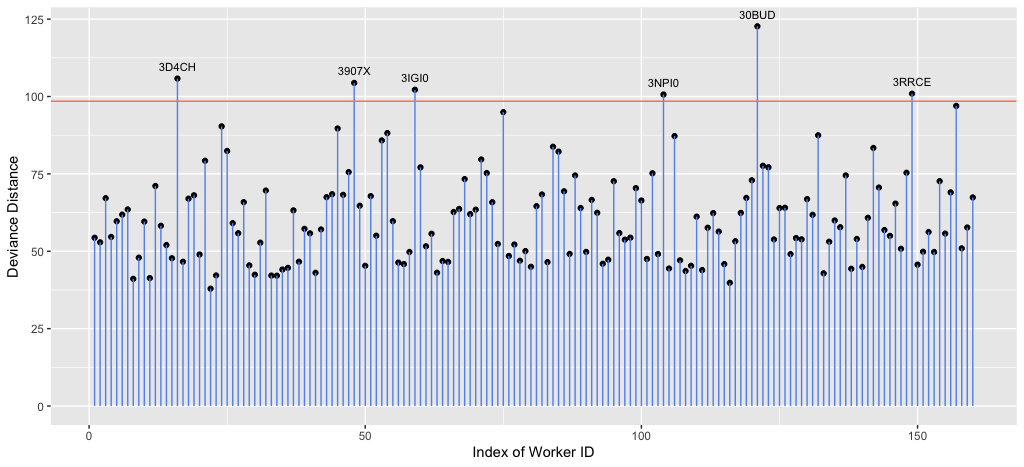
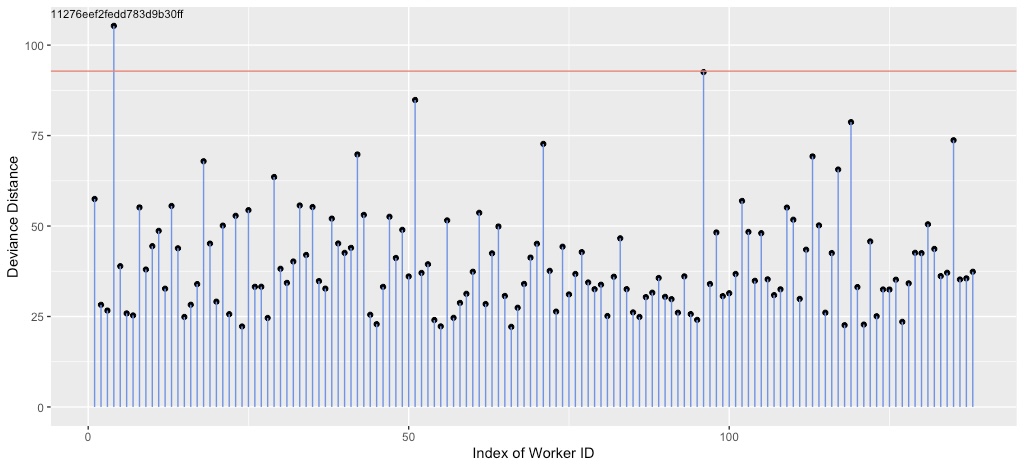

Six potential spammers are detected in MTurk(Figure 8(a)), the accuracies of whom all fall below the average and five out of six are lower than one standard deviation from the average (Table 3). Only one potential spammer is observed above the cutoff in Prolific (Figure 8(b)). The number of spammers in the airport datasets ranks between MTurk and Prolific (Figure 8(c)), all of whose accuracies are lower than 1 standard deviation below the average (Table 3). Compared to the aKLD method, deletion analysis tends to uncover fewer instances of spamming behaviors, but those detected are often more severe. Individuals identified by model-based deviance distance may not easily fit into specific categories of spammers, but a significant majority exhibit notably low accuracy.
| Platform | Number of total spammers | Number of spammers whose accuracy lower than the mean | Number of spammers whose accuracy lower than 1 SD below the mean |
|---|---|---|---|
| MTurk | 6 | 6 | 5 |
| Prolific | 1 | 1 | 1 |
| Airports | 4 | 4 | 4 |
5.4 Categorize Potential Spammers
In the two approaches described above, we categorize and evaluate potential spammers into three levels: "High risk", "Moderate risk", and "Undetermined risk" (Table 4). These classifications are based on three perspectives of spamming behaviors: behavior patterns, average time on tasks, and accuracy. Scores in each dimension can take on values of 0, 0.5, or 1. Specifically, if a worker’s behavior aligns with one of the specific typical spamming behaviors identified through examination of the transition probability matrix they will receive 0.5 and 0 if otherwise. Workers will receive an additional score of 0.5 if their response patterns match typical spamming behaviors. For the average time and accuracy, workers will get a score of 0 if their average time or accuracy is above the mean, 0.5 if it is below the mean, and 1 if it is lower than one standard deviation below the mean. Finally, the scores from these three dimensions are summed, and workers are categorized as follows:
-
•
"High risk": if the total score is greater than or equal to 2.5. Workers or participants whose scores fall on or above this threshold are most likely spammers and are recommended for exclusion.
-
•
"Moderate risk": if the total score falls between 1.5 and 2. Workers or participants whose scores fall within this range are more likely to be spammers and may be worth manual inspection and judgment.
-
•
"Undetermined risk" if the total score is between 0 and 1. Workers or participants with these scores present ambiguity in classification because of equal odds of being true credible or spammers.
| Platform | Spammer Index | High risk | Moderate risk | Undetermined risk |
| MTurk | 16.6% | 9 | 17 | 9 |
| Prolific | 6.5% | 1 | 3 | 6 |
| Airports | 7.9% | 3 | 4 | 9 |
6 Discussion
document
6.1 Empirical Guidelines
We propose an empirical set of guidelines and recommendations (see Figure 10) for measuring consistency and credibility, and consequently, identifying non-credible behaviors in online experiments. First, it is recommended that researchers use a variance decomposition method, such as the GLRM, for initial model fitting and for evaluating the consistency of workers on the same set of tasks. This step produces a Spammer Index, or SI. Based on simulations and case studies, we found a threshold of to be a reasonable criterion for estimating that there are potentially workers (where is the total number of workers) that may exhibit spamming behavior. The use of GLRM at the early stage of data analysis serves two purposes – 1) it can determine the presence of potential spammers in the data set, and 2) it provides an initial assessment of the impacts of fixed effects (see Table 5 for initial tests of significance).
The next step is to measure credibility by employing Criterion 1 (C1) – Markov chains and aKLD or mKLD threshold – to test if the responses of identified potential spammers match specific spamming behaviors. When the calculated aKLD or mKLD value is below its threshold, we also propose using a lower-bound threshold on the average time-to-complete as an auxiliary criterion, similar to the approach in gadiraju2015understanding. Workers with average task times lower than the threshold are then subject to Criterion 2 (C2 – deletion analysis – for further assessment. This is done by deleting candidate spammers one at a time and comparing the model-based deviance distance using a Chi-squared test. Participants who are subject to the deletion analysis have been empirically observed to have lower overall accuracy (see Section Experiment), while participants who fail Criteria 1 and 2 in addition to the auxiliary criterion, are deemed to be spammers. Data obtained from these participants are then excluded from further analysis.
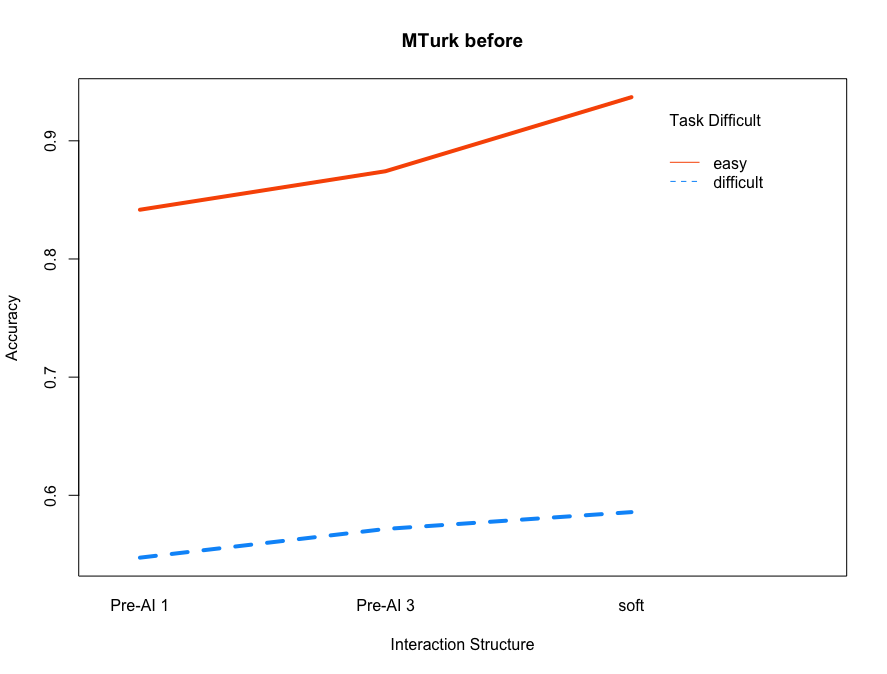
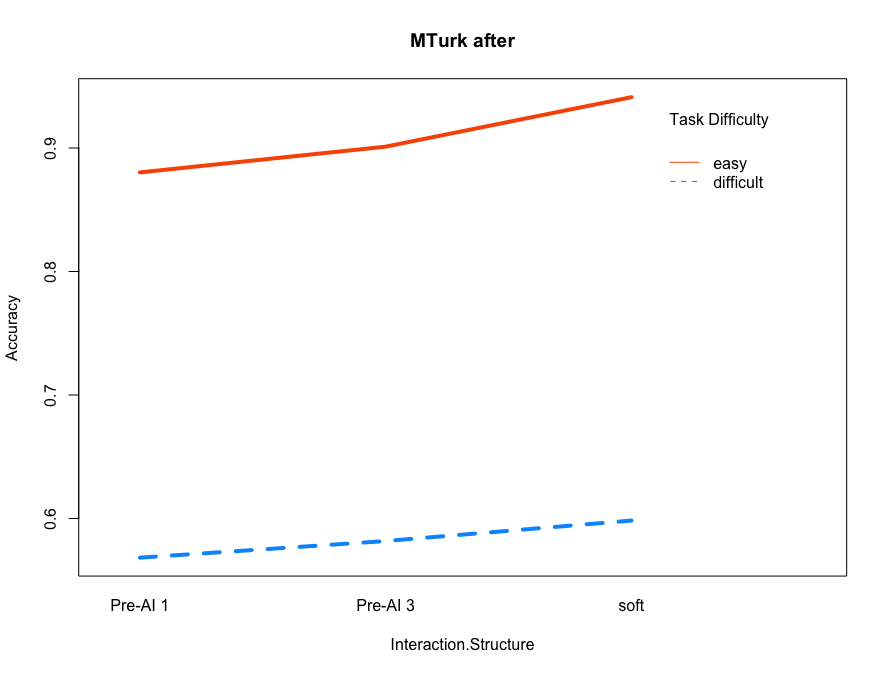
To determine the impact of spammers on fixed effects screening, we proceed to delete their responses from the three datasets and then observe the impact on tests of significance of main and 2FI effects. Table 5 shows the differences in results in Type III Wald -tests pre- and post-deletion. The reported -values are ANOVA-type tests that are designed for model reduction or variable screening in GLRMs (bolker2015linear). We find changes in the -values of coefficients for fixed effects in the two crowdsourced datasets: MTurk and Prolific (Table 5). Specifically, in MTurk, a notable change is observed in the coefficient estimate for the significant two-factor interaction (see Table 6 in Appendix), resulting in a slight change in the conclusion with regard to the patterns of the impact of the Interaction Structure variable (Difficulty: Condition) on the response. Figure 9 illustrates that in the post-deletion model, there is congruence between the estimated slopes of easy and difficult tasks as one changes Interaction Structure from one category to another; while in the pre-deletion model, the slopes seem to be different between the two types of tasks. This result highlights the impact of the presence of potential spammers on biases in estimation.
For the Prolific dataset, deleting all three types of spamming behaviors (Table 4) resulted in changes in the conclusion for the test of significance with respect to the Condition variable, with the -value shrinking post-deletion. Potential spamming behavior deletion leads to the reallocation of variance attributed to each predictor, whose changes are captured by the fixed effects tests. On the other hand, no significant changes resulted from deleting possible spamming behaviors for the airport dataset. Note that this experiment was deployed in-person using professionally trained agents in face verification, so it is sensible that due to their professional training and experience, participants’ abilities at this task are more consistent with each other i.e., the detected potential spamming behaviors are unlikely to be genuine spammers. Therefore, deleting these observations had little to no impact on the significance tests.
| Experiment | Fixed Effects | P-Value Before | P-Value After |
| MTurk | Intercept | 0.1214 | 0.0379∗ |
| Difficulty | 7.312e-16∗ | 9.563e-16∗ | |
| Condition | 0.2715 | 0.7463 | |
| Difficulty : Condition | 6.588e-11∗ | 2.357e-05∗ | |
| Prolific | Intercept | 0.05110 | 0.05602 |
| Difficulty | 0.28047 | 0.32726 | |
| Condition | 0.09019 | 0.02082∗ | |
| Difficulty : Condition | 0.46251 | 0.27657 | |
| In Person | Intercept | 1.255e-05∗ | 1.258e-05∗ |
| (Airports) | Difficulty | 3.606e-07∗ | 4.367e-07∗ |
| Condition | 0.2886 | 0.2073 | |
| Difficulty : Condition | 0.7168 | 0.8164 |
-
Note: Asterisk (∗) denotes the coefficient estimate significant in 0.05 critical value; responses of the models are participants’ accuracy.
We recommend that researchers follow the flowchart in Figure 10 as an empirical procedure to assess data quality and identify spamming behaviors. The procedure offers a degree of flexibility with respect to the order of operation and inclusion of either one or both criteria. More specifically, deletion analysis and C2 can come first in the order of steps before C1. In our case, we performed spammer behavior identification first because C1 is more sensitive to potential spammers than C2 and at this point, we do not worry about false detection because there are other criteria (including the auxiliary criterion). Further, if practitioners are not particularly interested in spamming behavior types, then they can go straight to deletion analysis where more severe spamming behaviors can be detected, albeit fewer. However, computational time will increase for a larger pool of workers. Thus, we strongly recommend applying C1 to reduce the pool.
6.2 Limitations
The metrics and methods proposed in this paper have been shown to be effective at spammer detection, yet they face several limitations that merit attention. The two simulation-based metrics – aKLD and mKLD – are robust to unbalanced data (e.g., number of match vs. mismatch cases), which presents an advantage over existing methods. However, establishing thresholds for aKLD or mKLD requires an understanding of task distribution. We suggest using majority voting for positing a preliminary distribution.
Moreover, the variability in datasets necessitates a flexible definition of primary choice spamming behaviors and adjustments in the cutoffs for aKLD or mKLD. This adaptability is guided by theoretical frameworks, specifically the longest run of identical answers theory (schilling1990longest), emphasizing the need for a tailored approach to different data scenarios.
A significant technical challenge is in the precise estimation of the transition probability matrix, a task further exacerbated by the typical volume of tasks assigned to participants. This poses a particular challenge in identifying patterns of Random Guessing, a common spamming behavior.
These metrics are proposed with the assumption that the study design closely follows principles for designing statistically valid experiments (montgomery2017design). However, poorly designed experiments may confound true spamming behavior with artifacts of experimental error as a result of variables not adequately addressed in the experimental design.
Finally, using time-to-complete as an auxiliary factor in identifying spammers is not recommended when the imposed time limits are required on task completion, because doing so may confound legitimate behaviors with spamming behaviors. It is recommended that other behavioral metrics based on the time spent on specific components of a task, for instance, to compare time on tasks of difficulty levels rather than on the average time spent, or whether the participant used a specific functionality within the testbed, should instead be explored.
7 Conclusion
In this paper, we proposed a framework for determining the quality of crowdsourced data and the identification of possible spamming behaviors in online experiments. Crowdsourced experiments have risen in popularity in the social and behavioral sciences due to their expediency and cost-effectiveness. However, it has been known from previous work that crowdsourced data, particularly from unproctored data collection, are highly susceptible to inconsistent and non-credible responses from participants. Current state-of-the-art methods for evaluating the consistency and credibility of crowdsourced data fall short because of their inability to handle more complex data structures. Furthermore, in many cases, researchers who rely on crowdsourcing platforms are often budget-constrained, making it impossible for them to attempt more trials to collect high-quality data; thus, it is necessary to ensure that responses collected are subject to quality control procedures prior to model building or data analysis. Our major contribution lies in the proposed suite of metrics that can detect potential spammers, followed by identifying posited behavior commonly found among online crowd workers. Through simulations, we show that the Spammer Index serves as an indicator of consistency in data quality and is directly associated with the number of actual spammers artificially imputed into the dataset. Our method is also validated on real-world experimental data that our team collected from Amazon MTurk, Prolific.co, and offline (in-person) data collection with subject matter experts. Through our proposed metrics, the previous finding of better data quality from Prolific.co than Amazon’s MTurk is verified. Even though we focus on experiments with binary responses in this paper, our framework is easily extendable to other data scales falling within the exponential family of distributions.
Acknowledgments
This material is based on work supported by the U. S. Department of Homeland Security under Grant Award Number 17STQAC00001-05-00. The views and conclusions contained in this document are those of the authors and should not be interpreted as representing the official policies, either expressed or implied, of the Department of Homeland Security, Department of Defense, or the university.
Declarations
The authors have no financial or proprietary interests in any material discussed in this article. All data simulated or analyzed during this study are included in this published article. The code was implemented by R. All materials are available in the the repository, https://github.com/YangBa78/Data-Reliabilty.
8 Appendix
| Experiment | Fixed Effects | Coefficients Before | Coefficients After |
| MTurk | Intercept | 0.24218 | 0.36485 |
| Task.Easy | 1.72905 | 1.98470 | |
| Condition.Pre-AI3 | 0.07139 | 0.04418 | |
| Condition.Soft.Deferral | 0.12781 | 0.06879 | |
| Task.Easy: Condition.Pre-AI3 | 0.17292 | 0.18483 | |
| Task.Easy: Condition.Soft.Deferral | 0.81746 | 0.65937 | |
| Prolific | Intercept | -1.0411 | -1.0779 |
| Task.Easy | 0.8197 | 0.7888 | |
| Condition.Soft.Deferral | 0.2113 | 0.2615 | |
| Task.Easy: Condition.Soft.Deferral | 0.1511 | 0.2447 | |
| In Person | Intercept | 0.89985 | 0.94458 |
| (Airports) | Task.Easy | 1.44520 | 1.51685 |
| Condition.LowMAST | -0.10571 | -0.12799 | |
| Task.Easy: Condition.LowMAST | -0.03637 | 0.02512 |
-
Note: The bold number denotes the coefficient estimate significant in 0.05 critical value; responses of the models are participants’ accuracy.