Experimental evidence for the tail of the nonphononic spectra of glasses
Abstract
It is now established that glasses feature low-frequency, nonphononic excitations, in addition to phonons that follow Debye’s vibrational density of state (VDoS). Extensive computer studies demonstrated that these nonphononic, glassy excitations follow a universal non-Debye VDoS , at low frequencies . Yet, due to intrinsic difficulties in disentangling from the total VDoS , which is experimentally accessible through various scattering techniques, the tail of lacked direct experimental support. We develop a procedure to extract from the measured , based on recent advances in understanding low-frequency excitations in glasses, and apply it to available datasets for diverse glasses. The resulting analysis shows that the tail of the nonphononic vibrational spectra of glasses is nontrivially consistent with a broad range of experimental observations. It also further supports that makes an additive contribution to .
Introduction.—Glasses, which are nonequilibrium disordered materials, reveal properties that are distinct from their crystalline counterparts [1, 2, 3, 4, 5]. Many of these properties are related to the low-frequency part of the material’s vibrational spectra. It is now well established that while both glassy and crystalline materials feature low-frequency phonons, which are related to global continuous symmetries independently of the underlying material structure [6], glasses also host low-frequency, nonphononic excitations [7, 8, 9, 10, 11, 12]. Extensive recent studies of computer glasses, demonstrated that these low-frequency, nonphononic excitations are quasilocalized in space [12], as opposed to the extended nature of low-frequency phonons. Moreover, it has been shown that the quasilocalized, nonphononic excitations follow a non-Debye VDoS that grows as at low vibrational frequencies , independently of composition, interatomic interaction, dimensionality and the nonequilibrium history of a glass [12, 13, 14, 15, 16, 17, 18, 19, 20, 21].
Quasilocalized, nonphononic excitations generically coexist and hybridize with extended phonons [22, 23], which follow Debye’s VDoS (in dimensions), such that it is difficult to determine their spatial structure and number. The above-mentioned progress in computer glasses has been enabled by the development of tools to disentangle the two species of low-frequency excitations, involving thoughtfully selected finite glass sizes [13] and/or the accessibility of atomic-scale quantities [24, 25, 26, 27]. These powerful tools are usually not applicable to laboratory glasses, which feature macroscopic sizes (realizing the thermodynamic limit) and where atomic-scale quantities are largely inaccessible.
Experiments on laboratory glasses are able to probe the total VDoS through various scattering techniques (down to a technique-specific frequency), as well as macroscopic response quantities such as the specific heat and elastic wave-speeds. So far, such measurements provided only indirect evidence for the tail of the nonphononic vibrational spectra of glasses, mainly through a contribution to the specific heat at low temperatures [3, 28]. Recent analysis indicated that while quasilocalized, nonphononic excitations generically hybridize with phonons, their number per frequency contributes additively to [23, 29], in line with earlier suggestions [30, 31, 9, 32].
In three dimensions (), the additive structure takes the form
| (1) |
at low frequencies , where is Debye’s prefactor of the phononic contribution (that can be obtained through the elastic wave-speeds [33]) and is its analog for the nonphononic contribution [17]. The validity of the additive structure of the 3D VDoS has been very recently established in computer glasses [29]. Finally, the very recent application of Eq. (1) to experimental and data of boron oxide glasses provided preliminary evidence for the tail of [34].
Here, we employ the mathematical properties of Eq. (1) to develop a procedure to extract the tail of from the experimentally measured . We apply the procedure to a variety of VDoS available in the literature for diverse glassy materials. The results provide experimental evidence for the tail of the nonphononic VDoS in glasses, and support the additive structure of in Eq. (1). The latter indicates that the low-frequency vibrational spectra of glasses are exclusively populated by hybridized phonons and quasilocalized, nonphononic excitations.
Basic relations and analysis methodology.—Equation (1) implies the following relations
| (2) | |||||
| (3) |
in the limit of low frequencies, , and is known as the reduced VDoS. We use the term ‘Debye’s plateau’ to refer to the low-frequency plateau (constant) of the reduced VDoS, which also corresponds to Debye’s prefactor . We distinguish between the two because they are independently measurable, and may differ due to inaccuracies in the measurements, see below.
For the relations in Eqs. (2)-(3) to be realized in an experimentally measured VDoS , the latter should go down to sufficiently low frequencies . In order to establish criteria for a given to qualify for the analysis to be performed below, we first note that the nonphononic VDoS has been very recently shown to feature an intrinsic peak/maximum, at a frequency denoted as [34]. The latter should be distinguished from the peak/maximum of the reduced VDoS , known as the conventional boson peak occurring at , as extensively discussed in [34]. For Eq. (2) to be revealed in the experimental data, i.e., for the power-law tail to be observed, the measurement of should go down to frequencies well below , which is our first qualification criterion.
For the relation in Eq. (3) to be experimentally realized, the reduced VDoS should reveal a Debye’s plateau. A slightly weaker condition would be that the reduced VDoS reveals significant curvature that reasonably indicates a convergence towards a plateau, if lower frequencies would have been probed. These constitute our second qualification criterion. Suppose now that a given experimentally measured is judged to be qualified for the analysis, and in particular that there exists a discrete set of frequencies (with the accompanying ) that satisfy the criteria stated above. Our next goal is to develop a procedure that allows to test for the consistency of the tail of with the experimental data, in view of Eqs. (2)-(3).
To that aim, we define based on , where is an unknown parameter. If the tail is consistent with experimental data, then one expects that the correct value of Debye’s prefactor would be such that fluctuate around a constant. Here, the constant corresponds to , cf. Eq. (2), and the fluctuations correspond to experimental measurement noise. Consequently, we consider the coefficient of variation , which is a dimensionless measure of the agreement of an experimental dataset with the tail, and select such that it minimizes , serving as our objective function [35].
Once is selected, automatically follows. In order to assess the agreement between the outcome of this single-parameter procedure and the prediction in Eq. (1) (and hence in Eqs. (2)-(3)), we invoke 3 physical criteria to be met: (i) The minimal value of should be much smaller than unity. (ii) The fluctuations around should be qualified as reasonable experimental measurement noise (e.g., not reveal systematic functional trends and/or clear biases). (iii) The selected value should agree with Debye’s plateau according to Eq. (3).
These assessment criteria pose rather strong self-consistency constraints on the developed, single-parameter procedure. These would provide us with quantitative tools to assess the consistency of available experimental datasets with the prediction in Eq. (1), even in view of the rather limited experimental scaling regime implied by the smallest vibrational frequencies probed by current scattering techniques. In addition, in situations in which is also independently extracted in the experiments based on elastic wave-speeds measurements, we compare it to the selected in the analysis. Finally, we construct a dimensionless ratio out of the extracted and (see below), and compare it to the corresponding ratio available through computer glass studies, which is yet another self-consistency test.
| Glassy material | Data source |
|---|---|
| Toluene | Fig. 2 (22 K dataset) [36] |
| Dibutyl phthalate | Fig. 2 (22 K dataset) [36] |
| Polybutadiene | Fig. 12 (60 K dataset) [37] |
| Glycerol | Fig. 4 (80 K dataset) [38] |
| Ambient silica | Fig. 1c (solid circles) [39] |
| Densified silica | Fig. 1d (solid circles) [39] |

Analysis of experimental data.—We apply the above procedure to 6 experimentally measured VDoS that were judged to qualify for the analysis according to the above stated qualification criteria. These correspond to diverse glassy materials, of different compositions and nonequilibrium histories, as detailed in Table 1 and in the references therein. The experimental data were obtained using various scattering techniques (e.g., nuclear inelastic scattering, neutron scattering and inelastic x-ray scattering), as detailed in the references provided in Table 1.
Each dataset was obtained by digitizing the published experimental data (the precise figure sources are detailed in Table 1) using a commercial software [40]. Whenever data were presented for several measurement temperatures, we digitized the lowest temperature one (indicated in Table 1) in order to minimize anharmonic effects. Whenever was independently measured and reported, it was extracted as well.
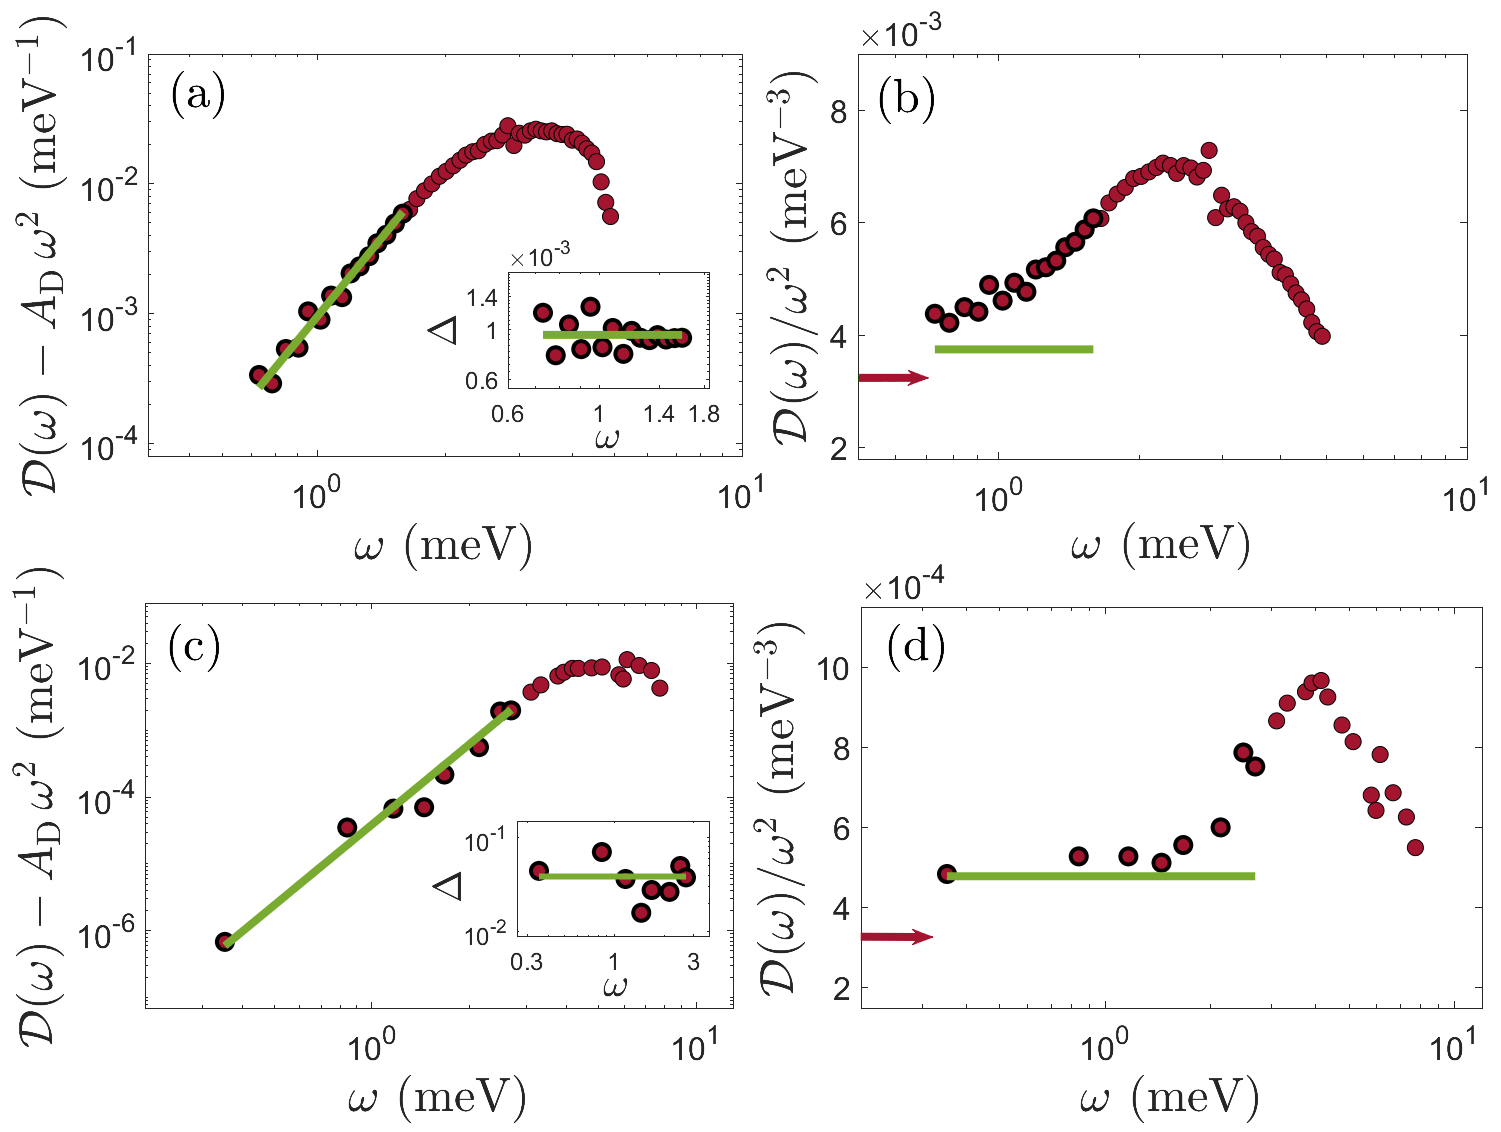
In Figs. 1a-b, we present the analysis of of glassy toluene (see Table 1), which is the first experimental dataset discussed. It is also used to introduce the presentation format of our results and the application of the above stated assessment criteria. In Fig. 1a, we plot on a double-logarithmic scale (brown circles) using that minimizes (see caption). All data points used in the analysis (marked by the thick-boundary circles) have frequencies below the peak (see caption), as required by our first qualification criterion. The superimposed solid green line corresponds to , with (see caption). It is observed that the obtained is in very good quantitative agreement with the experimental data, as is also clear from the minimal value of the objective function, .
In the inset of Fig. 1a, we present , which appears to reveal a legitimate -dependent noise. Finally, in Fig. 1b, we plot the reduced VDoS on a semi-logarithmic scale, marking by thick-boundary circles the very same data points used in the analysis in panel (a), similarly marked therein. The data indeed approach a Debye’s plateau at the lowest frequencies, as required by our second qualification criterion. We then superimpose in the solid green line the value of obtained in panel (a), which is observed to remarkably agree with Debye’s plateau. Consequently, the glassy toluene analysis in Figs. 1a-b is nontrivially consistent with the tail of the nonphononic VDoS of glasses.
In Figs. 1c-d, the same analysis is performed for glassy dibutyl phthalate (see Table 1). The consistency of the data with the prediction in Eq. (1) is even stronger than that of the toluene data in Figs. 1a-b, as is visually evident and manifested by the very small value of the objective function, . These results provide additional experimental evidence for the tail of the nonphononic spectra of glasses. The experiments giving rise to the datasets analyzed in Fig. 1 did not independently measured Debye’s prefactor [36]. Next, we analyze two additional datasets, for different glassy materials, in which independent measurements of Debye’s prefactor are available.
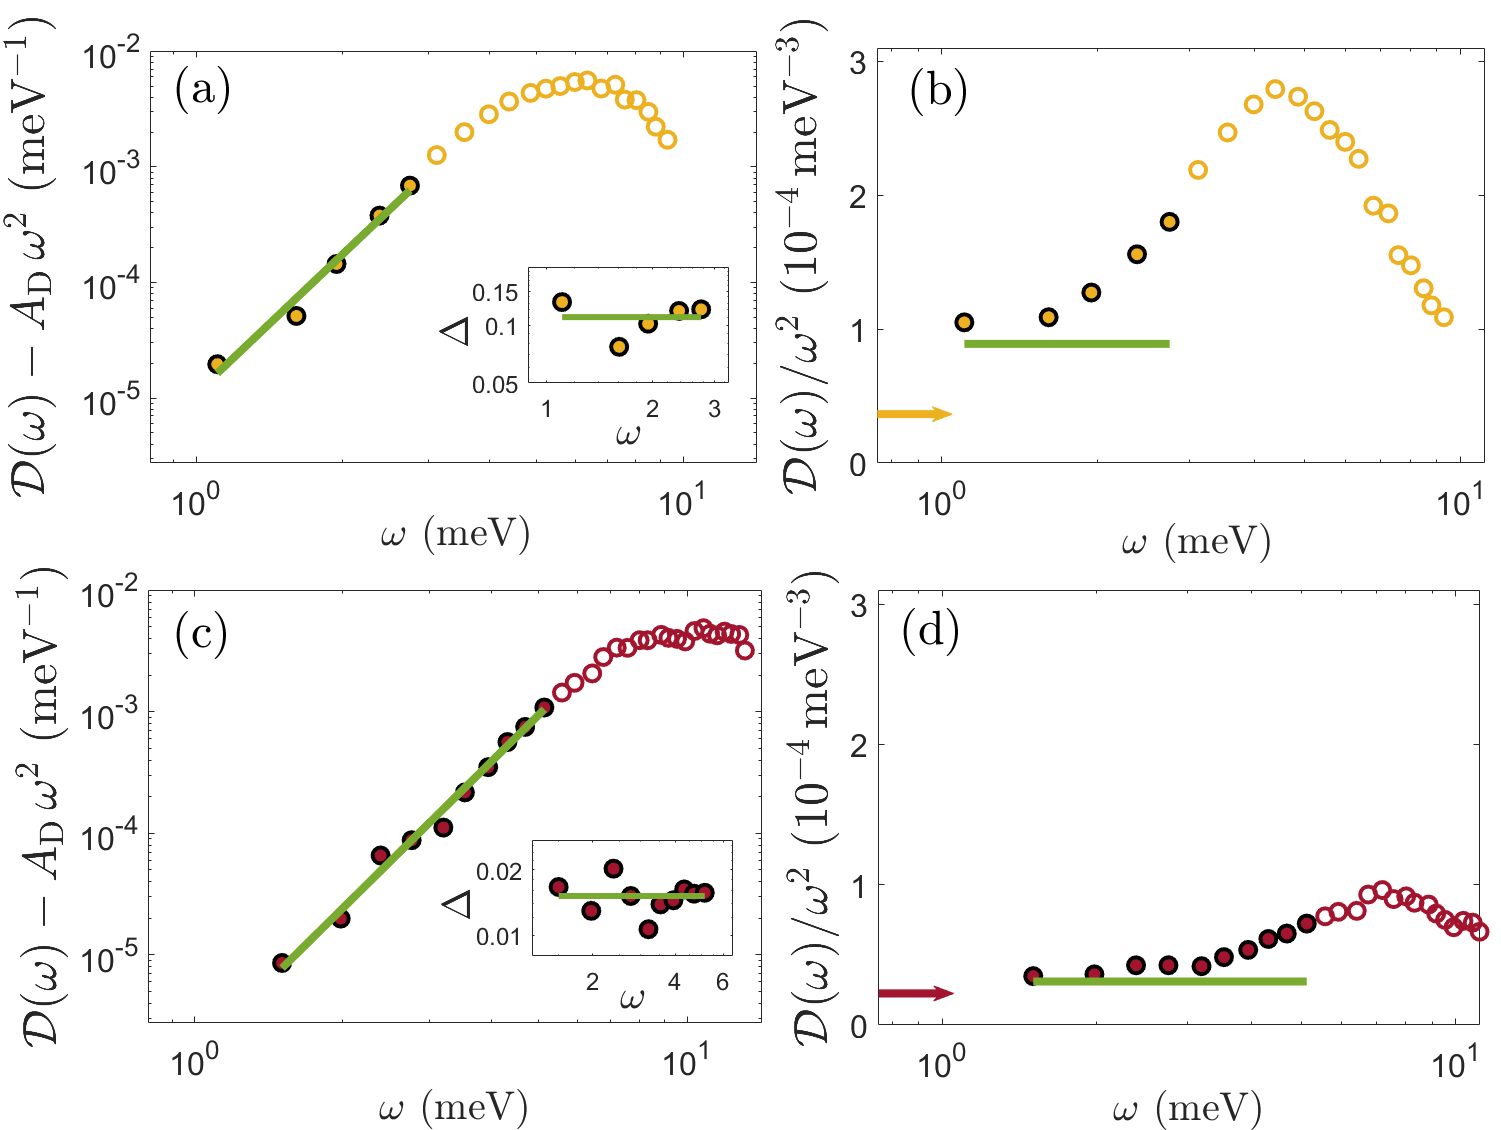
In the top row of Fig. 2, we present results for glassy polybutadiene (see Table 1), using exactly the same presentational format as in Fig. 1. The results in Fig. 2a reveal excellent agreement between the experimental data and the tail for the selected (see caption). is superimposed (green line) on the reduced VDoS in Fig. 2b and appears to be consistent with an extrapolated Debye’s plateau. The reduced VDoS in Fig. 2b reveals curvature on the semi-logarithmic scale used, but not yet a plateau. Interestingly, the independently measured (brown arrow) is smaller than the extracted value and may appear less consistent with an extrapolated Debye’s plateau, though a strictly quantitative statement cannot be made in the absence of a clear Debye’s plateau.
The situation is different in the bottom row of Fig. 2, where we present results for glassy glycerol (see Table 1). The results in Fig. 2c yet again reveal reasonably good agreement between the experimental data and the tail for the selected , see figure caption for the extracted parameters. Note that the value of the minimal objective function is smaller than unity, , yet it is larger than the corresponding values in the analyses in Fig. 1 (as is also evident from the observed fluctuations). The selected is superimposed (green line) on the reduced VDoS in Fig. 2b and is perfectly consistent with the observed Debye’s plateau. In contrast, the independently measured (brown arrow) deviates quite significantly from Debye’s plateau, indicating that the elastic measurements used to independently estimate might be inaccurate. Consequently, our analysis not only demonstrates experimental consistency with the tail, but also naturally detects possible inaccuracies in the independently measured .
In Figs. 1-2, we analyzed experimental data for 4 glassy materials, differing in composition, interatomic interactions and possibly preparation protocols. In Fig. 3, we turn our attention to a pair of glasses that share the same composition (and hence interatomic interactions), but differ in their nonequilibrium history. Specifically, we consider silica glasses at different densities, which opens the way for comparing different glassy states on equal footing, where our a priori expectation is that both and decrease upon densification.
In the top row of Fig. 3, we present the analysis of of silica glass formed under ambient conditions (orange circles), see Table 1. The results reveal excellent agreement with the tail of the nonphononic VDoS (panel (a)) and the selected is in great quantitative agreement with the respective Debye’s plateaus (panel (b)), while the independently measured (orange arrow) significantly deviates from the respective Debye’s plateau.
In the bottom row of Fig. 3, we present the corresponding analysis for densified silica glass (brown circles), which also reveals strong consistency with Eq. (1), in terms of all of the considered assessment criteria. Moreover, the obtained and in both rows of the figure (visually observed in the figure and quantitatively reported in the caption) indeed decrease with densification, as expected. Overall, the results in Fig. 3 lend additional support to our main finding.
The analyses presented above tested the consistency of the tail scaling with experimental data for various glasses. In view of the frequency range of scaling accessible through current experimental techniques, below , it is legitimate to ask to what extent the data considered might be consistent with , with . In [41], we present analyses of the dibutyl phthalate dataset (smallest , , see Fig. 1c-d) and the glycerol dataset (largest , , see Fig. 2c-d) with and . The results presented in [41], and their discussion in view of our assessment criteria, indicate that is rather robustly selected by the experimental data, with an uncertainty window that shrinks with .
Our analysis gives rise to the VDoS prefactors and , which are associated with characteristic vibrational frequencies of glasses. Specifically, is a characteristic frequency scale of quasilocalized, nonphononic excitations, while Debye’s frequency is a characteristic frequency scale of phononic excitations [6, 33]. The dimensionless frequency ratio has been measured in a variety of computer glasses. In [41], we collect available data on various computer glass models under a wide variety of nonequlibrium histories. We show that spans the range , including deeply supercooled glassy states, expected to be relevant for laboratory glasses.
In the captions of Figs. 1-3, we report the values of emerging from our analysis of experimental data for the 6 glassy materials considered, found to span the range . The latter quite remarkably overlaps the corresponding range for computer glasses (towards its lower part), lending additional support to the experimental evidence provided in this work for the tail of the nonphononic vibrational spectra of glasses.
Brief summary and outlook.—We developed a procedure to compare the predictions of Eq. (1) to experimental data for various glassy materials. Equation (1) predicts that (i) the low-frequency regime of the total VDoS is exclusively populated by quasilocalized nonphononic vibrations and phonons, (ii) the VDoSs of the two species contribute additively to , (iii) the tail of the nonphononic VDoS scales as . The analysis shows that Eq. (1) is nontrivially consistent with a broad range of experimental data, and hence provides experimental evidence for its validity, and for the nonphononic tail in particular.
The simple procedure can be straightforwardly applied to other experimental datasets of glasses. Future experimental techniques will hopefully be able to probe smaller frequencies, further constraining the emerging physical picture. Future work should also go beyond the tail regime and consider the boson peak regime, in particular the intrinsic peak of (observed on the left panels of each figure above) and the conventional peak of the reduced VDoS (observed on the right panels of each figure above), following recent developments [34].
Acknowledgements. A.M. acknowledges support from the James S. McDonnell Foundation Postdoctoral Fellowship Award in Complex Systems (https://doi.org/10.37717/2021-3362). E.B. acknowledges support from the Ben May Center for Chemical Theory and Computation and the Harold Perlman Family.
Supplemental materials
The goal of this document is to discuss the robustness of the experimental evidence for the scaling of the low-frequency tail of the nonphononic spectra of glasses, with . The analysis presented in the manuscript is supplemented here in Sect. S-I with a few examples of analyses involving , along with an accompanying discussion. Finally, we also provide in Sect. S-II details about the literature sources of the ratios of computer glasses, reported in the manuscript.
S-I Analyses with
We start by generalizing the coefficient of variation defined in the manuscript, which is a central quantity in testing the consistency of Eqs. (1)-(2) therein with experimental data. Specifically, we define
| (S1) |
which conforms with the definition used in the manuscript for . Note that the dimension of varies with , and is identical to that of (recall that is of inverse frequency dimension). Subsequently, we define
| (S2) |
which yet again conforms with the corresponding definition used in the manuscript for . We select for the analyses the dataset with the smallest minimal (optimal) objective function, i.e., for glassy dibutyl phthalate (cf. Fig. 1c in the manuscript), and the one with the largest minimal (optimal) objective function, i.e., for glassy glycerol (cf. Fig. 2c in the manuscript). We discuss the results in view of the three assessment criteria formulated in the manuscript.
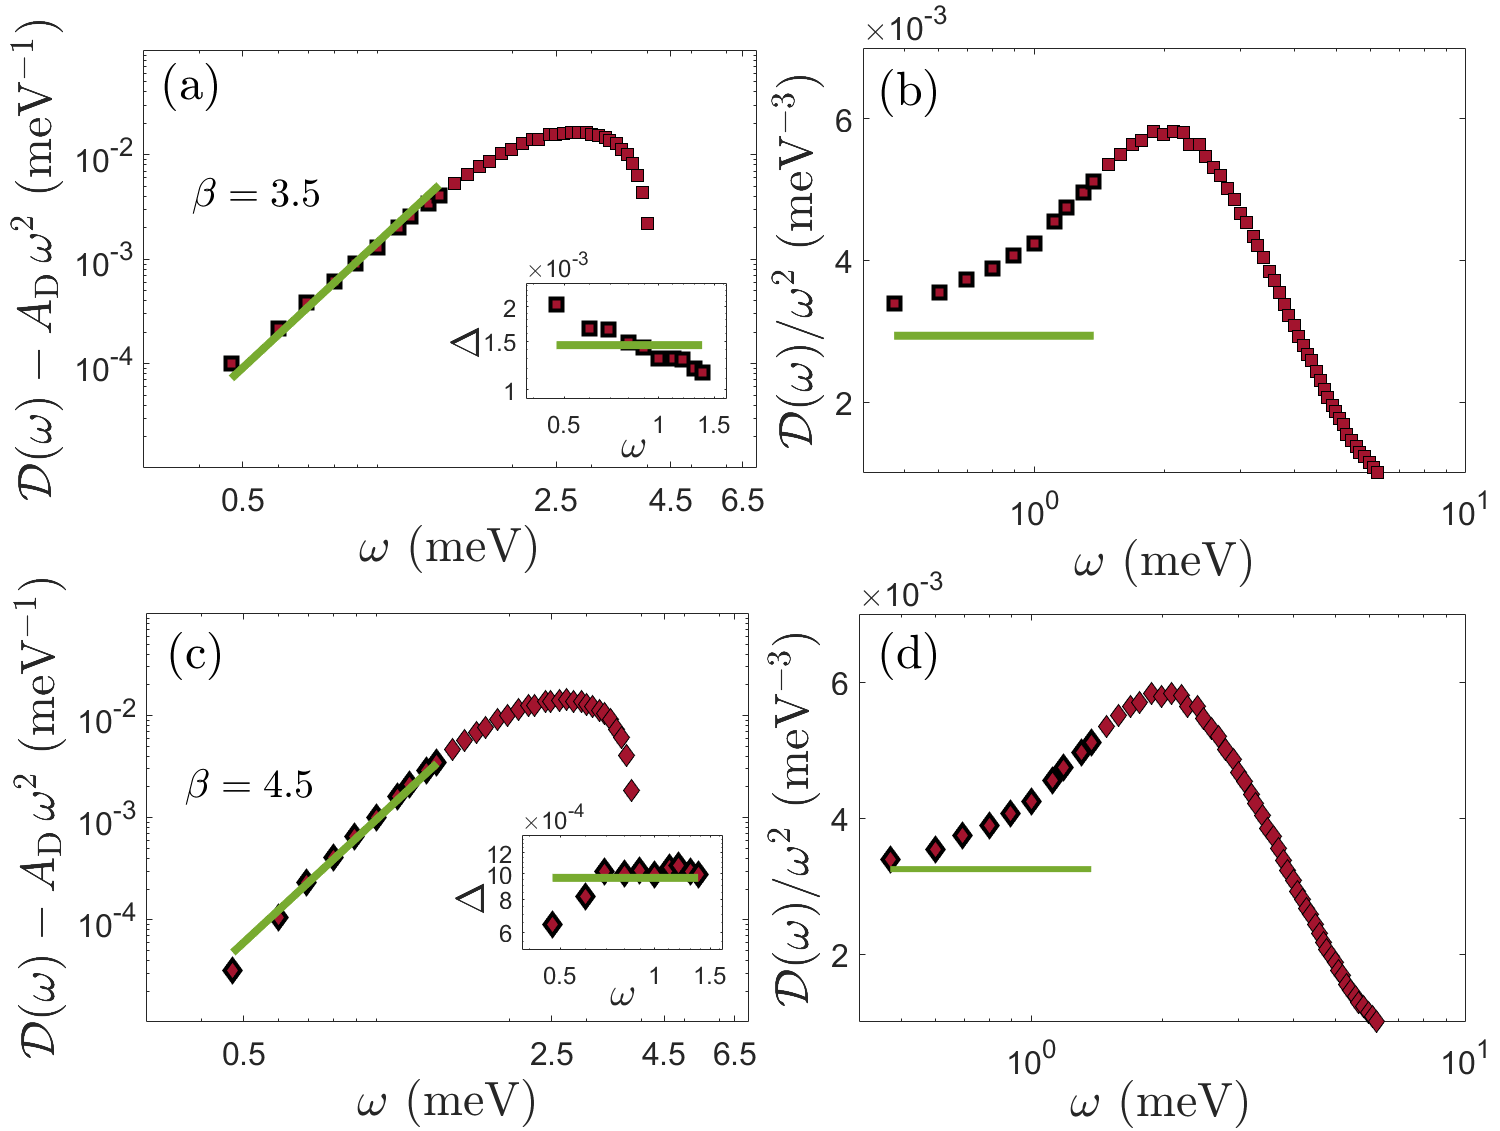
In the top row of Fig. S1, we present the analysis of of glassy dibutyl phthalate with . First, it is observed (Fig. S1b and its caption) that the selected is very similar to the one selected in the manuscript for ( compared to ), which is expected since is still significantly larger than 2, hence fluctuations in are reduced by properly eliminating the dominant contribution to . Second, it is observed that while the objective function attains a somewhat smaller value of (see caption, compared to , see caption of Fig. 1 in the manuscript), the inset of Fig. S1a reveals that the distribution of around its mean appears deterministic (it is a monotonically decreasing function of ), i.e., it does not appear to correspond to a reasonable experimental measurement noise. This is also visually evident from comparing the green line to the experimental data in the main panel of Fig. S1a. Consequently, we conclude that is far less consistent with the experimental data for glassy dibutyl phthalate compared to .
In the bottom row of Fig. S1, we present the corresponding analysis for . First, it appears (Fig. S1d) that the extrapolated Debye’s plateau would intersect the selected value. Second, the inset of Fig. S1c reveals apparently systematic deviations at low frequencies , as is also visually observed in the main panel of Fig. S1c. These deviations give rise to a larger minimal (optimal) value of the objective function, (see caption, compared to , see caption of Fig. 1 in the manuscript). Consequently, we also conclude that is less likely than for the glassy dibutyl phthalate dataset. Taken together, it appears as if the experimental data in this case rather robustly selects .
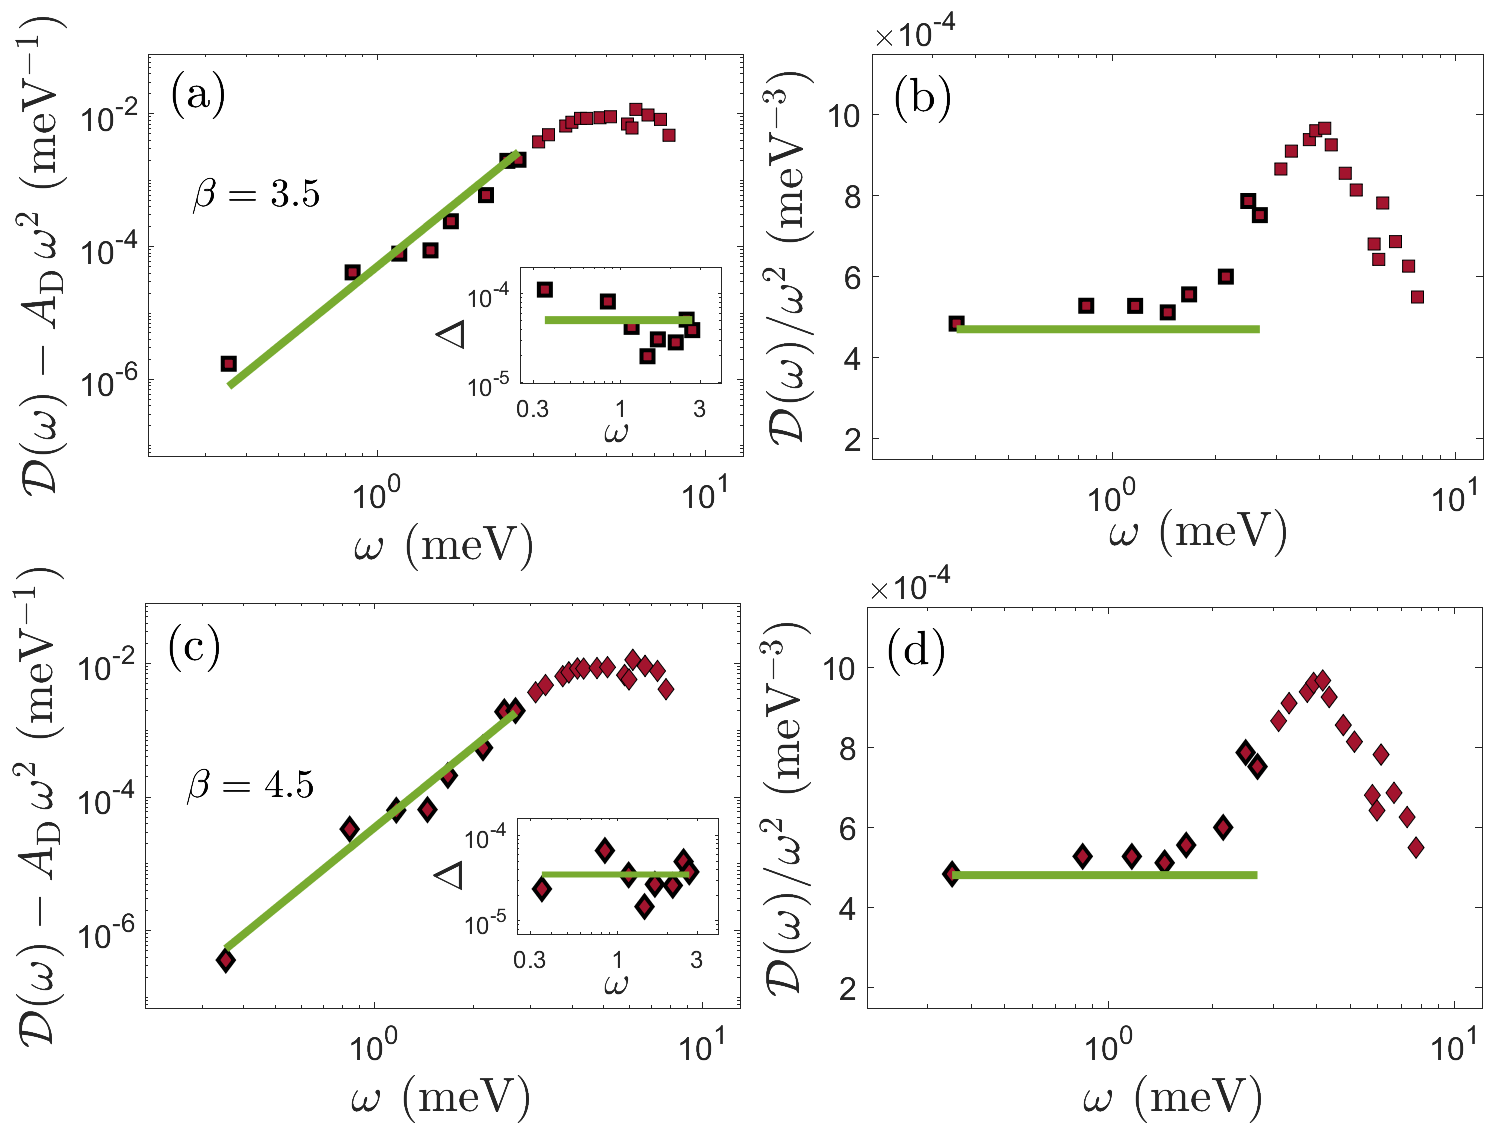
In the top row of Fig. S2, we present the analysis of of glassy glycerol with . First, it is observed (Fig. S2b and the caption) that the selected is similar to the one selected in the manuscript for ( compared to ). Second, it is observed in the inset of Fig. S2a that the distribution of around its mean is quite similar to — yet slightly less symmetric than — the corresponding distribution in the inset of Fig. 2c in the manuscript, while the value of the objective function is very similar to that of (, see caption, compared to , see caption of Fig. 2 in the manuscript). Consequently, we conclude that is roughly similarly consistent with the experimental data for glassy glycerol compared to .
In the bottom row of Fig. S2, we present the corresponding analysis for . It is observed in the inset of Fig. S2c that the distribution of around its mean is broader than the corresponding distribution in the inset of Fig. 2c in the manuscript, resulting in a larger value of the minimal (optimal) objective function compared to the corrsponding value for (, see caption, compared to , see caption of Fig. 2 in the manuscript). Consequently, we conclude that is somewhat less consistent with the experimental data for glassy glycerol compared to . Taken together, it appears as if the experimental data in this case is consistent with within 10-15%. We attribute the larger uncertainty in in the glassy glycerol dataset compared to the glassy dibutyl phthalate dataset to the emerging values of the optimal , and , respectively. We note that is an outlier in our analysis (see manuscript) and that in general — as stressed — the value of the minimal/optimal does not exclusively determine the consistency with , but rather the three assessment criteria together.
S-II The dimensionless frequency ratio in computer glasses
In the manuscript, we reported that in computer glasses spans the range . Here, we specify the literature sources of this data compilation.
We first consider a polydisperse glass-forming model [42] that can be very deeply supercooled (possibly deeper than laboratory glasses) using the swap-Monte-Carlo method, studied in [43]. In particular, the results presented in Fig. 1c of [43] correspond to , obtained for glassy states quenched from a ‘parent temperature’ of (see [43] for details). The results presented in Fig. 6a of the same work [43], corresponding to significantly deeper supercooling characterized by , gave rise to . Finally, we consider the so-called ‘sticky spheres’ glass-forming model of [44]. Specifically, the results presented in Fig. 7a of [44], corresponding to and (see details therein), gave rise to .
References
- Phillips [1972] W. Phillips, Tunneling states in amorphous solids, J. Low Temp. Phys. 7, 351 (1972).
- Anderson et al. [1972] P. W. Anderson, B. I. Halperin, and C. M. Varma, Anomalous low-temperature thermal properties of glasses and spin glasses, Philos. Mag. 25, 1 (1972).
- Buchenau et al. [1991] U. Buchenau, Y. M. Galperin, V. L. Gurevich, and H. R. Schober, Anharmonic potentials and vibrational localization in glasses, Phys. Rev. B 43, 5039 (1991).
- Pohl et al. [2002] R. O. Pohl, X. Liu, and E. Thompson, Low-temperature thermal conductivity and acoustic attenuation in amorphous solids, Rev. Mod. Phys. 74, 991 (2002).
- Ramos [2022] M. A. Ramos, Low-Temperature Thermal and Vibrational Properties of Disordered Solids (World Scientific, 2022).
- Chaikin and Lubensky [1995] P. Chaikin and T. Lubensky, Principles of Condensed Matter Physics (Cambridge University Press, 1995).
- Il’in et al. [1987] M. Il’in, V. Karpov, and D. Parshin, Parameters of soft atomic potentials in glasses, Zh. Eksp. Teor. Fiz. 92, 291 (1987).
- Gurevich et al. [2003] V. L. Gurevich, D. A. Parshin, and H. R. Schober, Anharmonicity, vibrational instability, and the boson peak in glasses, Phys. Rev. B 67, 094203 (2003).
- Schirmacher et al. [2007] W. Schirmacher, G. Ruocco, and T. Scopigno, Acoustic attenuation in glasses and its relation with the boson peak, Phys. Rev. Lett. 98, 025501 (2007).
- Shintani and Tanaka [2008] H. Shintani and H. Tanaka, Universal link between the boson peak and transverse phonons in glass, Nat. Mater. 7, 870 (2008).
- DeGiuli et al. [2014] E. DeGiuli, A. Laversanne-Finot, G. During, E. Lerner, and M. Wyart, Effects of coordination and pressure on sound attenuation, boson peak and elasticity in amorphous solids, Soft Matter 10, 5628 (2014).
- Lerner and Bouchbinder [2021] E. Lerner and E. Bouchbinder, Low-energy quasilocalized excitations in structural glasses, J. Chem. Phys. 155, 200901 (2021).
- Lerner et al. [2016] E. Lerner, G. Düring, and E. Bouchbinder, Statistics and properties of low-frequency vibrational modes in structural glasses, Phys. Rev. Lett. 117, 035501 (2016).
- Mizuno et al. [2017] H. Mizuno, H. Shiba, and A. Ikeda, Continuum limit of the vibrational properties of amorphous solids, Proc. Natl. Acad. Sci. U.S.A. 114, E9767 (2017).
- Kapteijns et al. [2018] G. Kapteijns, E. Bouchbinder, and E. Lerner, Universal nonphononic density of states in 2D, 3D, and 4D glasses, Phys. Rev. Lett. 121, 055501 (2018).
- Wang et al. [2019] L. Wang, A. Ninarello, P. Guan, L. Berthier, G. Szamel, and E. Flenner, Low-frequency vibrational modes of stable glasses, Nat. Commun. 10, 26 (2019).
- Rainone et al. [2020] C. Rainone, E. Bouchbinder, and E. Lerner, Pinching a glass reveals key properties of its soft spots, Proc. Natl. Acad. Sci. U.S.A. 117, 5228 (2020).
- Richard et al. [2020] D. Richard, K. González-López, G. Kapteijns, R. Pater, T. Vaknin, E. Bouchbinder, and E. Lerner, Universality of the nonphononic vibrational spectrum across different classes of computer glasses, Phys. Rev. Lett. 125, 085502 (2020).
- Bonfanti et al. [2020] S. Bonfanti, R. Guerra, C. Mondal, I. Procaccia, and S. Zapperi, Universal low-frequency vibrational modes in silica glasses, Phys. Rev. Lett. 125, 085501 (2020).
- Lerner and Bouchbinder [2022] E. Lerner and E. Bouchbinder, Nonphononic spectrum of two-dimensional structural glasses, J. Chem. Phys. 157, 166101 (2022).
- Shiraishi et al. [2023] K. Shiraishi, H. Mizuno, and A. Ikeda, Non-phononic density of states of two-dimensional glasses revealed by random pinning, J. Chem. Phys. 158, 174502 (2023).
- Bouchbinder and Lerner [2018] E. Bouchbinder and E. Lerner, Universal disorder-induced broadening of phonon bands: from disordered lattices to glasses, New J. Phys. 20, 073022 (2018).
- Lerner and Bouchbinder [2023] E. Lerner and E. Bouchbinder, Boson-peak vibrational modes in glasses feature hybridized phononic and quasilocalized excitations, J. Chem. Phys. 158, 194503 (2023).
- Gartner and Lerner [2016] L. Gartner and E. Lerner, Nonlinear modes disentangle glassy and Goldstone modes in structural glasses, SciPost Phys. 1, 016 (2016).
- Kapteijns et al. [2020] G. Kapteijns, D. Richard, and E. Lerner, Nonlinear quasilocalized excitations in glasses: True representatives of soft spots, Phys. Rev. E 101, 032130 (2020).
- Richard et al. [2021] D. Richard, G. Kapteijns, J. A. Giannini, M. L. Manning, and E. Lerner, Simple and broadly applicable definition of shear transformation zones, Phys. Rev. Lett. 126, 015501 (2021).
- Richard et al. [2023] D. Richard, G. Kapteijns, and E. Lerner, Detecting low-energy quasilocalized excitations in computer glasses, Phys. Rev. E 108, 044124 (2023).
- Ramos [2004] M. A. Ramos, Are the calorimetric and elastic debye temperatures of glasses really different?, Philos. Mag. 84, 1313 (2004).
- Lerner et al. [2024] E. Lerner, A. Moriel, and E. Bouchbinder, Enumerating low-frequency nonphononic vibrations in computer glasses, arXiv preprint arXiv:2404.12735 (2024).
- Yannopoulos et al. [2006] S. Yannopoulos, K. Andrikopoulos, and G. Ruocco, On the analysis of the vibrational boson peak and low-energy excitations in glasses, J. Non-Cryst. Solids 352, 4541 (2006).
- Kalampounias et al. [2006] A. Kalampounias, S. Yannopoulos, and G. Papatheodorou, A low-frequency raman study of glassy, supercooled and molten silica and the preservation of the boson peak in the equilibrium liquid state, J. Non-Cryst. Solids 352, 4619 (2006).
- Wang et al. [2021] L. Wang, G. Szamel, and E. Flenner, Low-frequency excess vibrational modes in two-dimensional glasses, Phys. Rev. Lett. 127, 248001 (2021).
- foo [a] , where Debye’s frequency is given by , with denoting the number of particles, the volume, and the shear and longitudinal wave-speeds, respectively.
- Moriel et al. [2024] A. Moriel, E. Lerner, and E. Bouchbinder, Boson peak in the vibrational spectra of glasses, Phys. Rev. Res. 6, 023053 (2024).
- foo [b] Using Matlab’s minimization function ‘fminsearch’ [45].
- Chumakov et al. [2004] A. Chumakov, I. Sergueev, U. Van Bürck, W. Schirmacher, T. Asthalter, R. Rüffer, O. Leupold, and W. Petry, Collective nature of the boson peak and universal transboson dynamics of glasses, Phys. Rev. Lett. 92, 245508 (2004).
- Zorn et al. [1995] R. Zorn, A. Arbe, J. Colmenero, B. Frick, D. Richter, and U. Buchenau, Neutron scattering study of the picosecond dynamics of polybutadiene and polyisoprene, Phys. Rev. E 52, 781 (1995).
- Wuttke et al. [1995] J. Wuttke, W. Petry, G. Coddens, and F. Fujara, Fast dynamics of glass-forming glycerol, Phys. Rev. E 52, 4026 (1995).
- Chumakov et al. [2014] A. I. Chumakov, G. Monaco, A. Fontana, A. Bosak, R. P. Hermann, D. Bessas, B. Wehinger, W. A. Crichton, M. Krisch, R. Rüffer, et al., Role of disorder in the thermodynamics and atomic dynamics of glasses, Phys. Rev. Lett. 112, 025502 (2014).
- Rohatgi [2024] A. Rohatgi, Webplotdigitizer (2024).
- [41] See Supplemental Materials attached to the PDF .
- Ninarello et al. [2017] A. Ninarello, L. Berthier, and D. Coslovich, Models and algorithms for the next generation of glass transition studies, Phys. Rev. X 7, 021039 (2017).
- Kapteijns et al. [2021] G. Kapteijns, E. Bouchbinder, and E. Lerner, Unified quantifier of mechanical disorder in solids, Phys. Rev. E 104, 035001 (2021).
- González-López et al. [2021] K. González-López, M. Shivam, Y. Zheng, M. P. Ciamarra, and E. Lerner, Mechanical disorder of sticky-sphere glasses. II. Thermomechanical inannealability, Phys. Rev. E 103, 022606 (2021).
- The MathWorks Inc. [2022] The MathWorks Inc., Matlab version: 9.13.0.2166757 (R2022b) (2022).