Chandra HETG X-ray Spectra and Variability of Aqr, a Cas-type Be star.
Abstract
High-resolution X-ray spectra of Aqr, a Cas-type star, obtained with the Chandra/HETG grating spectrometer, revealed emission lines of H-like ions of Mg, Si, S, and Fe, a strong, hard continuum, and a lack of He-like ions, indicating the presence of very hot thermal plasma. The X-ray light curve showed significant fluctuations, with coherent variability at period of about s in one observation. The hardness ratio was relatively constant except for one observation in which the spectrum was much harder and more absorbed. We interpret the X-ray emission as arising from accretion onto the secondary, which is likely a magnetic white dwarf, an intermediate polar system.
Accepted for publication in ApJL
1 Introduction
Aqr was recently identified as a Cas-type star by Nazé et al. (2017). The Cas-types are O/Be stars which in X-rays have unusually hard spectra, with characteristic temperatures exceeding (), yet appear to be thermal due to presence of Fe xxv and Fe xxvi emission lines. Given their thermal spectrum and low X-ray luminosities, their nature as accreting X-ray binaries containing a neutron star or a black hole companion is ruled out. Several Cas types are known to be some form of binary including Aqr (Bjorkman et al., 2002): it is the nature of the companion which makes them of special interest. Postnov et al. (2017) proposed a neutron star where direct accretion is impeded magneto-centrifugally, the so called propeller state. Langer et al. (2020) gave an account of possible evolutionary states, with preference for stripped-core companions, either SdO or He-stars. Gies et al. (2023) argued that SdO companions would be bright enough to see optically, so they prefer a white dwarf companion hypothesis. Tsujimoto et al. (2018), based on X-ray spectral modeling of two Cas-type stars, also prefer a white dwarf companion. In XMM-Newton spectra of Aqr, Nazé et al. (2017) found a plasma temperature of about () from isothermal fits of thermal spectra, and found no significant emission line features in the lower-energy RGS spectral band. In Swift data, Nazé et al. (2019) had similar results requiring an isothermal plasma with (), and local absorption of about . Tsujimoto et al. (2023) modeled NuSTAR and XMM-Newton spectra of Aqr and found a maximum temperature of () from a cooling flow model (Pandel et al., 2005), concluding that Aqr could host either a magnetic or non-magnetic white dwarf. The interferometric survey of Be stars by Klement et al. (2024) included several Cas-type stars with X-ray emission. They failed to detect any companions, and excluded SdO and main-sequence companions for Aqr, leaving a white dwarf as the most viable secondary and source of X-ray emission.
Here we present X-ray spectral and temporal properties of Aqr revealed by recent Chandra/HETG observations. § 2 details the observations and reduction of the Chandra HETG data. The spectra are described and interpreted through spectral modeling in § 3. Finally in § 4 we comment on variability observed in our dataset, in particular a notable hardening of the spectra arising from a jump in absorbing column density during the last of our observational sets.
2 Observations and Processing
We obtained Chandra/HETG data for Aqr in six observations made during August to October, 2022, for a total exposure of . Details are provided in Table 1.111Data are available at https://doi.org/10.25574/ObsID, where is to be replaced with the values from Table 1. Canizares et al. (2005) gave a description of the instrument. Data were processed with CIAO (Fruscione et al., 2006) following standard procedures, except for use of a narrower spatial region defining the HEG and MEG loci. This removes ambiguity between the two grating types at the shortest wavelengths, and can improve flux determination below in particular for hard sources where standard regions overlap. Spectra were analyzed using the ISIS package (Houck & Denicola, 2000) in conjunction with AtomDB (Foster et al., 2012). For timing analysis, we used the SITAR ISIS package222For a description of SITAR routines, see https://space.mit.edu/cxc/analysis/SITAR/., as distributed with ISISscripts.333The ISISscripts package is available from http://www.sternwarte.uni-erlangen.de/isis/.
| ObsID | DATE-OBS | Exposure | |
|---|---|---|---|
| [Chandra start date] | [] | ||
| 10.25574/26079 (catalog 26079) | 2022-08-23T15:37:02 | 9.93 | 0.40 |
| 10.25574/27269 (catalog 27269) | 2022-08-27T04:24:31 | 9.99 | 0.44 |
| 10.25574/26080 (catalog 26080) | 2022-09-05T00:58:47 | 29.67 | 0.54 |
| 10.25574/26001 (catalog 26001) | 2022-09-13T00:14:35 | 19.80 | 0.64 |
| 10.25574/27412 (catalog 27412) | 2022-09-14T06:16:23 | 21.78 | 0.65 |
| 10.25574/27325 (catalog 27325) | 2022-10-30T09:44:35 | 9.76 | 0.20 |
Note. — The orbital phase is defined as for the maximum radial velocity (redshift) of the secondary, using the error-weighted-mean ephermeris of Bjorkman et al. (2002): , .
3 Spectrum and Modeling
We analyzed the spectrum in two parts because one observation, with about of the total exposure, had a very different character in terms of hardness (see § 4 for variability details). We show the low hardness ratio state HETG spectrum in the left side of Figure 1, where strong Fe xxv () and Fe xxvi () emission lines are seen, with a shoulder on the red side of the He-like line that may be Fe K fluorescence. The rest of the spectrum clearly shows the H-Ly-like emission lines from S xvi (), Si xiv (), and Mg xii () on top of a strong continuum. There may be some Fe xxiv emission lines near Mg xii and between –. The He-Ly-like emission lines from S, Si, and Mg are conspicuous in their absence. These characteristics point to very high-temperature plasmas; the H-like lines, except for Fe, are weak because the plasma is dominated by temperatures well above the peaks of the emissivity functions, on the long tail of the H-like emissivities and well beyond the significant region of He-like emissivity. In an isothermal plasma, to obtain a limit in the Si xiii to Si xiv flux less than the observed ratio of requires a temperature greater than , and to obtain the observed ratio of Fe xxvi to Fe xxv requires a temperature of at least .
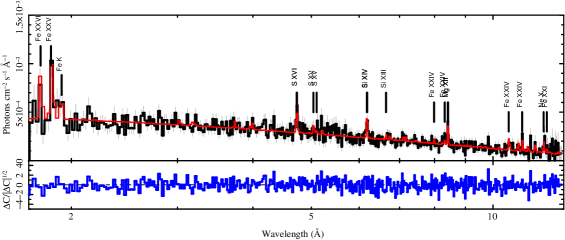
To characterize the spectrum more systematically, we have fit a few-temperature model using AtomDB emissivities. For such a hot plasma, the continuum shape provides limited leverage on the temperature, since above about , the turnover of the thermal bremsstrahlung occurs below , and the shape above that is largely flat and featureless. We find that three temperatures are sufficient to describe the spectrum, to which we added a Gaussian for the possible Fe K fluorescence. Each temperature component shared a common Doppler shift and “turbulent” broadening term for any Gaussian intrinsic width. Instrumental broadening is handled by forward-folding through the calibrated responses, and common elemental abundances, for which Mg, Si, S, and Fe were free to vary. However, for few-temperature plasmas, abundances are degenerate with temperature since there are two ways to change a model line flux: vary the temperature, or vary the abundance. Should the temperature not be accurate, the abundance will be not be accurate as well. We also include a single absorption term, however note that the foreground interstellar absorption is small in this band (, Gudennavar et al. (2012)).
The fit converges on a very hot component to produce enough Fe xxvi and to provide the correct shape between an . However, the Fe xxvi flux is rather uncertain by about 40%, so anything over would be adequate. A component of about is required to give the observed Fe xxv flux, some Fe xxvi, and most of the S xvi emission, plus Si xiv, Mg xii, and Fe xxiv. The third component, at also contributes to the H-like series, and to the Fe xxiv ionization, but this component has the lowest normalization. However, if larger, it would contribute to Si xiii, which is weak or absent. The emission measure, for a distance of (Gaia Collaboration et al., 2016, 2018) is . The absorption required is , which has a transmission factor of about at . The absorbed model flux in the – band is , and the X-ray luminosity is . The lines required some broadening beyond instrumental, with a turbulent velocity term of , which corresponds to S xvi, Si xiv and Mg xii full-widths, half-maxima (s) of about (for ). The Doppler shift from the global fit was , without correction for the line-of-sight velocities at these epochs, which is less than . The range is incommensurate with the Bjorkman et al. (2002) solution for the secondary at these phases of about . Plasma model details are given in Table 2.
We have also fit the few emission lines with intrinsic Gaussian profiles, folded through the instrument response, in order to determine fluxes, velocity offsets, and widths. The features with signal-to-noise ratio and which have good resolution are Si xiv and Mg xii. These have , consistent with the plasma model determination. Their Doppler shifts are consistent with . Line fit details are given in Table 3.
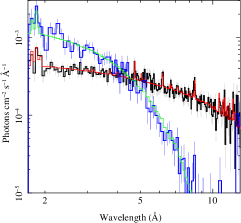
The right panel of Figure 1 shows the high hardness state spectrum compared to the low hardness state. We see that the high hardness state is brighter below , but much more absorbed. We fit this hard state spectrum with a two temperature model since less information is available from emission lines - only Fe xxv, being so heavily absorbed, and having only exposure. The plasma is much hotter, has higher flux, and much greater absorption. Details are given in Table 2
| Parameter | Value | Value | Unit | ||
|---|---|---|---|---|---|
| Normal HR | High HR | ||||
| ” | |||||
| ” | |||||
| ” | |||||
| ” | |||||
| ” | |||||
| (Mg) | Relative to Solar | ||||
| (Si) | ” | ||||
| (S) | ” | ||||
| (Fe) | ” | ||||
Note. — “Normal HR” refers to all observations except 27325, and “High HR” is for 27325 in the high hardness-ratio state. Flux is integrated from the model over the – band. The emission measure used a distance of , and is related the the normalizations by a factor of . Relative abundances are referenced to Anders & Grevesse (1989). Uncertainties are .
| Line | Flux | ||||||
|---|---|---|---|---|---|---|---|
| [ Å] | [] | [] | [] | ||||
| Fe xxvi | |||||||
| Fe xxv | |||||||
| FeK | |||||||
| S xvi | |||||||
| Si xiv | |||||||
| Si xiii(r) | |||||||
| Mg xii | |||||||
Note. — Wavelengths for Fe xxvi and Fe xxv are weighted means over the components in each group; each was fit with a single Gaussian model. The Fe xxvi offset from Fe xxv was frozen. The width of FeK was tied to that of Fe xxvi. The S xvi width was tied to that of Si xiv, since the former has a fairly low signal-to-noise ratio. The flux limit on the Si xiii resonance line was computed with a frozen position and a width frozen at the value for Si xiv. Uncertainties are for confidence intervals.
4 Variability
It is well known that Cas-type stars are variable in optical and X-ray bands (Nazé et al., 2020b, c, a). Optical variability can be highly periodic and is generally attributed to the B-star’s rotation or pulsations. X-ray fluctuations can exceed factors of two or three in short times, behavior often referred to as “flaring” (but not like coronal flares in the Sun and late-type stars, which have increases in both flux and temperature and are strongly tied to stellar magnetism).
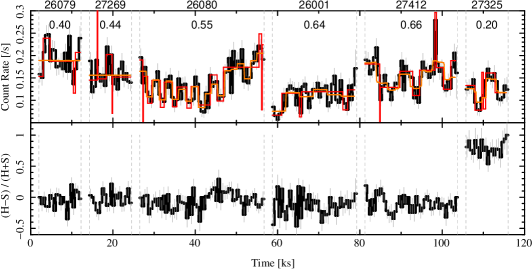

We extracted X-ray light curves of Aqr from the dispersed first-order events and found significant variability with about a factor of two amplitude in count rate. For the longest observation (; Observation ID 26080) of the six segments, we also found significant cyclic variability, with a period of about s. In Figure 2 we show light curve and hardness ratio for all observations, and the epoch-folding period search for the segment showing the strongest periodic signal. To our knowledge, this is only the second case of a clear X-ray modulation with an approximately one hour period in a Cas-type star, the first being found by Lopes de Oliveira et al. (2006) in HD 161103. The other segments, which range from to exposures, had statistically significant variability, but not as strong an indication of coherence.
The hardness ratio, defined as , with and defined as count rates in bands chosen to on average have equal counts (–, –), was relatively constant for most of the time, as we show in the left hand side of Figure 2, bottom panel. The last observation, however, stands out as extremely hard, which led us to analyze the spectrum of that state separately.
5 Interpretations
The HETG observations presented here strongly support the case that the Aqr B-star’s companion is an accreting white dwarf. The emission lines of H-like ions show that there is thermally emitting plasma, and that the temperature is high, given the lack of He-like ions for anything but Fe. Furthermore, the continuum is consistent with Bremsstrahlung for the same temperature required for the emission lines. Even though the spectral turnover is below , there is some leverage in the spectral curvature in the observed band. The temperatures we have derived are consistent with free-fall accretion onto a white dwarf with mass between – (Mukai, 2017; Tsujimoto et al., 2023). This is consistent with prior XMM-Newton and NuSTAR observations, but since emission lines are weak, the HETG band and spectral resolving power were required to detect and characterize them. The best characterized lines, those of Mg xii and Si xiv, have similar widths and centroid offsets as in early B-star stellar winds, but they are an order of magnitude more luminous in Aqr, and cooler species are missing (Pradhan et al., 2023). Consequently, the spectrum is incompatible with a superposition of a powerlaw continuum with a B-star thermal spectrum.
The detection of variability with a period of about suggests that if the companion is a white dwarf, that it is magnetic, such as in an intermediate polar where accretion is funneled onto the white dwarf by a moderately strong global magnetic field. The period would then be rotational modulation. The breadth of the peak obtained through epoch folding is also reminiscent of the compact object being a white dwarf (see Figure 2 in Hui et al., 2012) as opposed to a neutron star where narrower peaks are expected because of the very coherent pulsations. The coherent variability was only seen in one observation, however. The others show both similar amplitude but more sporadic fluctuations and also changes in the mean flux level. One would expect under the hypothesis of an accreting white dwarf, that if the accretion is steady, and the polar region of a white dwarf always visible, then the rotational “clock’s” pulsations would be persistent. The variations are obviously due to something more complicated than a coherent rotationally modulated accretion spot. We have evidence that very large changes can occur. In addition to periodic modulation and irregular variations, there was the state with the high hardness ratio. The absorption increased by an order of magnitude, while the flux nearly doubled, and the luminosity more than doubled. We do not know if this is a random episodic or a phase-dependent event. It occurred near orbital phase , when viewing the companion behind the B-star, through the B-star wind, and perhaps downstream along the accretion column (see Tab. 1 and Fig. 2). The Swift monitoring by Nazé et al. (2019) also has their highest absorption near this phase.
There is precedent for complex structure in intermediate polar accretion disks, with bulges, streams, and veiling which can perturb light curves, such as has been seen in optical, UV, and X-ray observations of EX Hya (Belle et al., 2002, 2005). Hiding spin modulation in X-rays with disk instabilities is very speculative, however, and will require longer term X-ray monitoring to separate coherent modulation from other variability. One would have to either hide the accretion hot spot with strong absorption, or mask the rotational pulsations with other fluctuations. Empirically, we can say that there is sometimes coherent X-ray modulation, but also more random fluctuations, and large, persistent changes in spectral hardness. These all suggest complex and variable X-ray emitting and absorbing structures.
While our evidence is circumstantial, we suggest that the Aqr variations indicate that a white dwarf companion is likely, given the episode of periodic variation. But there is some other source of variability which can change emission and absorption levels. We cannot determine from our dataset whether this is stochastic, episodic, or orbitally phase dependent.
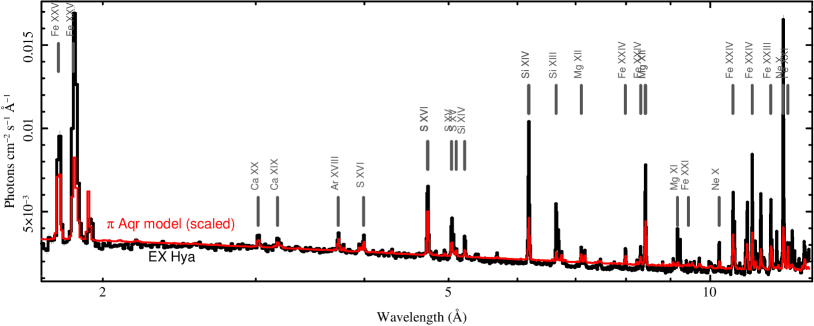
EX Hya is a well studied intermediate polar with a white dwarf rotation period of about s (Warner, 1983; Luna et al., 2015), similar to our detected period in Aqr. To compare X-ray spectra, we took our three-temperature model, removed the absorption and renormalized to the HETG-observed flux of EX Hya. We found overall qualitative agreement, but with some interesting differences. Figure 3 shows our unabsorbed model against the observed EX Hya spectrum, which has little neutral absorption (; Luna et al. (2015)). EX Hya has emission from the H- and He-like ions of O, Ne, Mg, Si, S, Ar, Ca, and Fe (see details in Luna et al., 2015). In Aqr, we only see the H-like lines of Mg, Si, S, and Fe, as well as He-like Fe; longward of , Aqr absorption is too strong for detection at our exposure. The differences seen, however, show that the Aqr plasma is substantially hotter than that of EX Hya, since the He-like lines are extremely weak in Aqr. Our emission measure distribution for Aqr, though with only 3 points, rises steadily from to . This parallels (at about 10 times the amplitude) the simple cooling flow model of Luna et al. (2015) for EX Hya, which they rejected in favor of their empirical model which declines steeply above about dex. Below , if we extrapolate our emission measure to follow the simple cooling flow model, we cannot tell if such plasma exists in Aqr because the predicted fluxes are below our sensitivity limit; the hot plasma greatly overwhelms any cooler plasma signature. It could be that the putative white dwarf in Aqr is more massive than that in EX Hya. According to Yuasa et al. (2010), a change of a few tenths of a Solar mass of a white dwarf can change the shock temperature by a factor of two. Hence, we tentatively conclude that there is a white dwarf companion in Aqr with somewhat more mass than the one in EX Hya, which is estimated by Luna et al. (2015) to be . The emission measure distribution of Aqr seems consistent with a cooling flow model, but higher signal-to-noise X-ray spectra will be required to quantify the contribution of cooler plasma through detection of He-like ion emission.
Our characterization with a few-temperature, slab-absorbed model is very rudimentary. We are beginning to apply cooling flow models, in which a continuous emission measure distribution is weighted inversely by the cooling time (Mushotzky & Szymkowiak, 1988; Pandel et al., 2005; Böhringer & Werner, 2010). Other refinements were implemented by Tsujimoto et al. (2023), such as partial covering, and reflection models to explain Fe K fluorescence. The cooling flow models specify a mass accretion rate through the X-ray luminosity and temperature extrema. For a simple, slab-absorbed, geometry-independent (optically thin) cooling-flow model, we obtained mass accretion rates for the low and high hardness states of and . These values are within an order of magnitude for low-accretion-rate intermediate polars. For the expected decretion disc densities at the white dwarf orbital separation (Jones et al., 2008), accretion rates up-to can be supported (assuming spherical accretion).
The high-resolution X-ray spectra presented here have further supported the cases put forward by Tsujimoto et al. (2023) and Klement et al. (2024) that the dominant X-ray source in Aqr is a magnetic white dwarf, probably an intermediate polar. Further observations are warranted, in particular long observations to monitor coherent variability, and phase-resolved coverage to separate geometric from stochastic variability.
References
- Anders & Grevesse (1989) Anders, E., & Grevesse, N. 1989, Geochim. Cosmochim. Acta, 53, 197
- Belle et al. (2005) Belle, K. E., Howell, S. B., Mukai, K., et al. 2005, AJ, 129, 1985
- Belle et al. (2002) Belle, K. E., Howell, S. B., Sirk, M. M., & Huber, M. E. 2002, ApJ, 577, 359
- Bjorkman et al. (2002) Bjorkman, K. S., Miroshnichenko, A. S., McDavid, D., & Pogrosheva, T. M. 2002, ApJ, 573, 812
- Böhringer & Werner (2010) Böhringer, H., & Werner, N. 2010, A&A Rev., 18, 127
- Canizares et al. (2005) Canizares, C. R., Davis, J. E., Dewey, D., et al. 2005, PASP, 117, 1144
- Davies (1990) Davies, S. R. 1990, MNRAS, 244, 93
- Foster et al. (2012) Foster, A. R., Ji, L., Smith, R. K., & Brickhouse, N. S. 2012, ApJ, 756, 128
- Fruscione et al. (2006) Fruscione, A., McDowell, J. C., Allen, G. E., et al. 2006, in Presented at the Society of Photo-Optical Instrumentation Engineers (SPIE) Conference, Vol. 6270, SPIE Conference Series
- Gaia Collaboration et al. (2016) Gaia Collaboration, Prusti, T., de Bruijne, J. H. J., et al. 2016, A&A, 595, A1
- Gaia Collaboration et al. (2018) Gaia Collaboration, Brown, A. G. A., Vallenari, A., et al. 2018, A&A, 616, A1
- Gies et al. (2023) Gies, D. R., Wang, L., & Klement, R. 2023, ApJ, 942, L6
- Gregory & Loredo (1992) Gregory, P. C., & Loredo, T. J. 1992, ApJ, 398, 146
- Gudennavar et al. (2012) Gudennavar, S. B., Bubbly, S. G., Preethi, K., & Murthy, J. 2012, ApJS, 199, 8
- Houck & Denicola (2000) Houck, J. C., & Denicola, L. A. 2000, in Astronomical Society of the Pacific Conference Series, Vol. 216, Astronomical Data Analysis Software and Systems IX, ed. N. Manset, C. Veillet, & D. Crabtree, 591
- Hui et al. (2012) Hui, C. Y., Seo, K. A., Hu, C. P., Lin, L. C. C., & Chou, Y. 2012, ApJ, 759, 109
- Jones et al. (2008) Jones, C. E., Sigut, T. A. A., & Porter, J. M. 2008, MNRAS, 386, 1922
- Klement et al. (2024) Klement, R., Rivinius, T., Gies, D. R., et al. 2024, ApJ, 962, 70
- Langer et al. (2020) Langer, N., Baade, D., Bodensteiner, J., et al. 2020, A&A, 633, A40
- Lopes de Oliveira et al. (2006) Lopes de Oliveira, R., Motch, C., Haberl, F., Negueruela, I., & Janot-Pacheco, E. 2006, A&A, 454, 265
- Luna et al. (2015) Luna, G. J. M., Raymond, J. C., Brickhouse, N. S., Mauche, C. W., & Suleimanov, V. 2015, A&A, 578, A15
- Mukai (2017) Mukai, K. 2017, PASP, 129, 062001
- Mushotzky & Szymkowiak (1988) Mushotzky, R. F., & Szymkowiak, A. E. 1988, in NATO Advanced Study Institute (ASI) Series C, Vol. 229, Cooling Flows in Clusters and Galaxies, ed. A. C. Fabian, 53
- Nazé et al. (2020a) Nazé, Y., Motch, C., Rauw, G., et al. 2020a, MNRAS, 493, 2511
- Nazé et al. (2020b) Nazé, Y., Pigulski, A., Rauw, G., & Smith, M. A. 2020b, MNRAS, 494, 958
- Nazé et al. (2017) Nazé, Y., Rauw, G., & Cazorla, C. 2017, A&A, 602, L5
- Nazé et al. (2020c) Nazé, Y., Rauw, G., & Pigulski, A. 2020c, MNRAS, 498, 3171
- Nazé et al. (2019) Nazé, Y., Rauw, G., & Smith, M. 2019, A&A, 632, A23
- Pandel et al. (2005) Pandel, D., Córdova, F. A., Mason, K. O., & Priedhorsky, W. C. 2005, ApJ, 626, 396
- Postnov et al. (2017) Postnov, K., Oskinova, L., & Torrejón, J. M. 2017, MNRAS, 465, L119
- Pradhan et al. (2023) Pradhan, P., Huenemoerder, D. P., Ignace, R., Nichols, J. S., & Pollock, A. M. T. 2023, ApJ, 954, 123
- Scargle et al. (2006) Scargle, J. D., Norris, J., & Jackson, B. 2006, in Studies in Astronomical Time Series Analysis. VI
- Scargle et al. (2013) Scargle, J. D., Norris, J. P., Jackson, B., & Chiang, J. 2013, ApJ, 764, 167
- Tsujimoto et al. (2023) Tsujimoto, M., Hayashi, T., Morihana, K., & Moritani, Y. 2023, PASJ, 75, 177
- Tsujimoto et al. (2018) Tsujimoto, M., Morihana, K., Hayashi, T., & Kitaguchi, T. 2018, PASJ, 70, 109
- Warner (1983) Warner, B. 1983, in Astrophysics and Space Science Library, Vol. 101, IAU Colloq. 72: Cataclysmic Variables and Related Objects, ed. M. Livio & G. Shaviv, 155–171
- Yuasa et al. (2010) Yuasa, T., Nakazawa, K., Makishima, K., et al. 2010, A&A, 520, A25