IRX-CIGALE: a tailored module for Low-Luminosity AGN
The spectral energy distribution (SED) of low-luminosity active galactic nuclei (LLAGN) poses distinct challenges, primarily due to their radiation being comparable to their host galaxy and the complex accretion physics involved. This study unveils a novel module tailored for the CIGALE framework, explicitly aimed at the intricacies of SED fitting for LLAGN. This innovative module combines the empirical – relationship with physically grounded accretion models, specifically advection-dominated accretion flows (ADAFs) and truncated accretion disks, to more precisely depict LLAGN’s central engine emissions.
Applied to a curated selection of 52 X-ray-detected local galaxies, mainly LINERs and Seyferts, we conducted an extensive analysis to evaluate the module’s accuracy against higher-luminosity AGN from the COSMOS and SDSS datasets. Our module proves adaptable at estimating bolometric luminosities with remarkable accuracy, even amid significant galaxy contamination. We also introduce an X-ray bolometric correction formula spanning ten orders of magnitude in luminosity.
We also analyzed the , the index representing the slope between the UV and X-ray emissions, revealing unique trends diverging from high-luminosity AGN. Contrary to quasars, where correlates with , LLAGN exhibit either a constant or weakly correlated values. This variance highlights a shift in accretion dynamics and photon production in the low luminosity regime. Furthermore, for these LLAGN, we observe a decrease of 1.4 dex in specific star formation rates from the entire galaxy to a central 9-arcsecond aperture, suggesting a possible indication of a feedback mechanism in these sources.
Our insights affirm the critical role of a multiwavelength strategy in AGN research, revealing a distinct behavior for LLAGN from that of quasars. This contribution significantly enriches our comprehension of LLAGN, providing a robust framework for future studies to provide a complete census of the AGN population.
Key Words.:
galaxies: active — active galactic nuclei: low-luminosity — techniques: spectral fitting1 Introduction
Active galactic nuclei (AGN) are extremely luminous objects fueled by accretion onto supermassive black holes at the cores of galaxies (Alexander & Hickox, 2012). Their influence significantly shapes the evolution of host galaxies (e.g., Fabian, 2012) and plays a crucial role in regulating star formation and feedback processes (e.g., Heckman & Best, 2014). AGN exhibit diverse spectral and temporal variability, posing challenges for their classification and comprehension. A standard categorization method is based on luminosity, where typical AGN, like quasars (QSOs), have bolometric luminosities exceeding , while low-luminosity AGN (LLAGN) display lower luminosities (Peterson, 1997).
LLAGN can be defined as galaxies with X-ray luminosities less than erg s-1 and additional evidence of nuclear activity, such as AGN-like spectra (Ptak, 2001). This category often includes Low-Ionization Nuclear Emission-line Regions (LINERs, Ho, 1999). Seyferts, with generally higher luminosities, are typically categorized directly as AGN. However, exceptions exist, as seen in the case of low-luminosity Seyferts like NGC 1566 (Agüero et al., 2004). Behind these blurred boundaries, the community keeps debating whether LLAGN are downscaled versions of their brighter counterparts (e.g., Maoz, 2007) or whether they are dominated by different accretion physics (e.g., Ishibashi et al., 2014).
In the local Universe, LLAGN are more common than QSOs. The steep luminosity function of AGN suggests that LLAGN could be more prevalent at all redshifts than previously assumed, as indicated by various studies (e.g., Schawinski et al., 2009; Aird et al., 2012). Despite their prevalence, their nature is not fully understood due to lower luminosity compared to brighter AGN (Padovani et al., 2017; Hickox & Alexander, 2018). While AGN are known to significantly influence galaxy evolution through AGN feedback mechanisms, the potential role of LLAGN in galaxy evolution has not been fully elucidated.
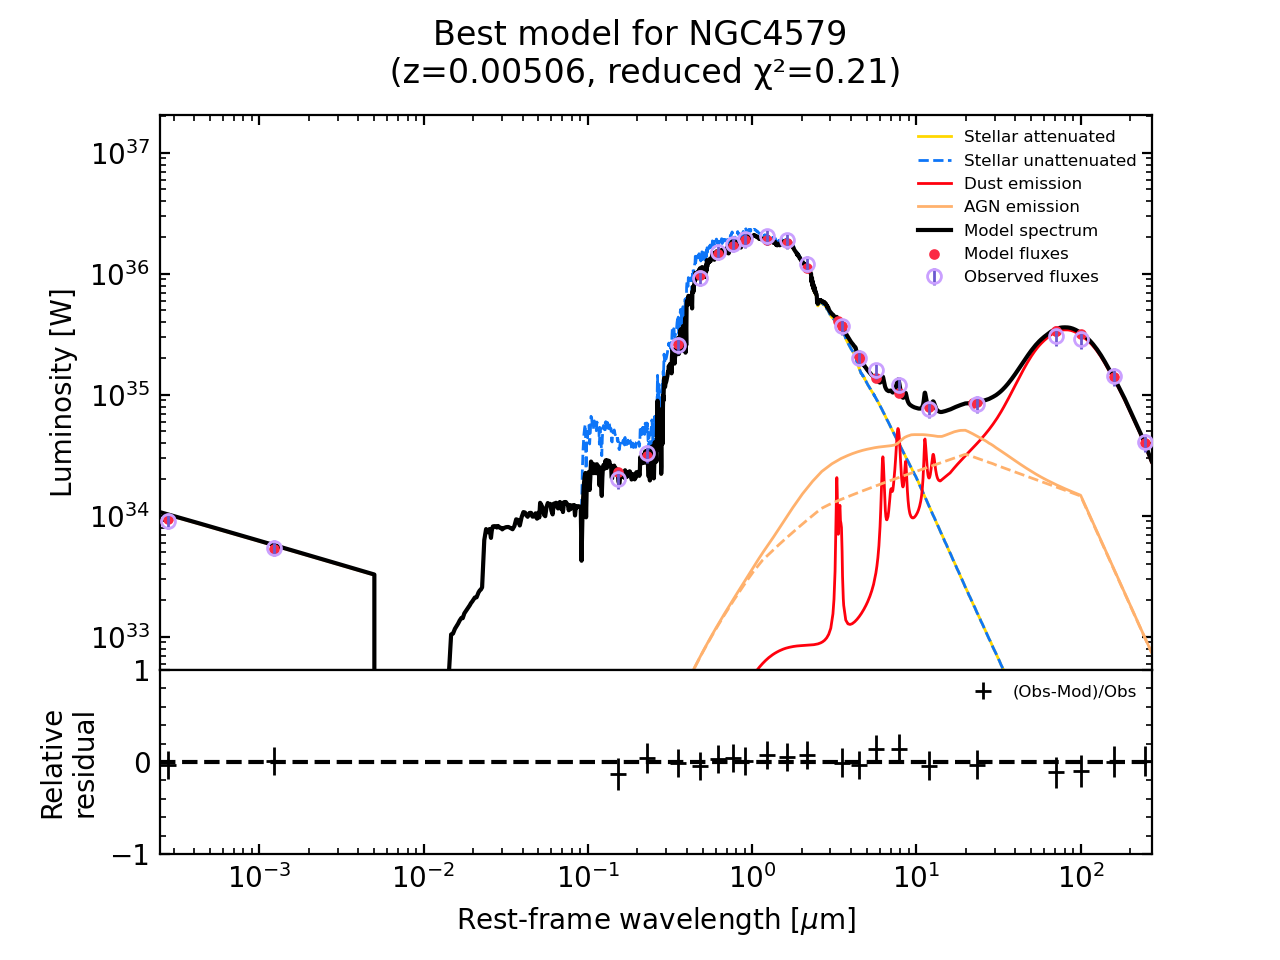
LLAGN can hide compact jets and release kinetic energy through them (e.g., Fernández-Ontiveros et al., 2023). Unlike the massive jets observed in radio-loud AGN, the lower-power jets from LLAGN may remain confined within the host galaxy, substantially affecting the interstellar medium (ISM) and altering star formation processes (Mukherjee et al., 2018). LINERs can be radio-quiet or radio-loud, with low-accreting black holes that launch sub-relativistic and relativistic jets, respectively (Baldi et al., 2021a). Beyond kinetic feedback, winds from sustained radiatively inefficient accretion can also suppress star formation (Almeida et al., 2023). For instance, in the Sombrero galaxy, winds—driven either by radiatively inefficient accretion or by jets—induce outflows exceeding 1000 km/s (Goold et al., 2023). Similarly, in the massive spiral galaxy NGC 4579, a radio jet confined to the host galaxy generates low-velocity shocks and turbulence, significantly influencing the ISM by heating the inner kpc and suppressing star formation (Ogle et al., 2024). Although these examples provide insights into the impacts on individual sources, as a collective, LLAGN might play a pivotal role in galaxy evolution, a role that is yet to be fully characterized. The high accretion phase of an AGN lasts only 5-10% of its duty cycle, with most of its cycle being in a low-accreting phase (Novak et al., 2011). Furthermore, local LLAGN may be the relics of previously high-accreting AGN. A comprehensive understanding of LLAGN properties and their evolution is vital for a thorough perspective on AGN and galaxy evolution.
While the luminosity definition of LLAGN allows for the possibility of high-accreting low-mass black holes, the local population of LLAGN generally exhibits low accretion rates ( , Ho, 2009). The accretion process in LLAGN is to occur through a radiatively inefficient mode, where gas cannot efficiently radiate its thermal energy due to either low density or strong magnetic fields. This leads to lower radiative efficiency and a harder X-ray spectrum (product of the optically thin free-free emission), distinguishing them from higher-luminosity AGN. Additionally, LLAGN lack a big-blue bump associated with the blackbody radiation of the internal orbits of a thin accretion disk; instead, they show a red-bump (Ho, 2008).
At low accretion rates, the accretion flow becomes less dense, optically thin, and less effective at cooling. Consequently, the standard accretion disk (geometrically thin, optically thick disks) becomes unstable and is supplanted by another mechanism. The exact mechanism driving accretion in LLAGN is still debated, with proposed models including hot, advection-dominated accretion flows (ADAF), adiabatic inflow-outflow solutions (ADIOS), and convection-dominated accretion flows (CDAF; for a review, see Yuan & Narayan, 2014). Additionally, standard accretion disks truncated at an inner radius and hybrid models combining truncated disks with hot flows are considered plausible mechanisms (Taam et al., 2012; Bu & Yang, 2019). Clarifying the nature of the accretion flow in LLAGN is essential for understanding their evolution, fueling mechanisms, and the growth of supermassive black holes in the local universe.
The identification and characterization of LLAGN present challenges due to their lower brightness and potential contamination from star formation and X-ray binaries (e.g., Annuar et al., 2020). Spectral energy distribution (SED) fitting, utilizing multiwavelength data, emerges as a powerful tool for addressing these challenges. SED fitting can be used to disentangle different physical mechanisms at play from the AGN and its host galaxy, providing insights into accretion disk and dusty torus properties, as well as host galaxy characteristics such as star formation rate (SFR) and stellar mass (). Crucially, SED fitting is the optimal method for obtaining the AGN bolometric luminosities.
Various SED-fitting popular codes are available and have recently been shown to yield similar distributions of general physical parameters (Pacifici et al., 2023). One of them is Code Investigating GALaxy Emission (CIGALE111https://cigale.lam.fr; Boquien et al., 2019). CIGALE leverages the wealth of information in multiwavelength data by incorporating related processes as priors in Bayesian fits. Including the X-ray component in the AGN model, commonly referred to as X-CIGALE and included inside the last CIGALE release, has expanded the capabilities of CIGALE (Yang et al., 2020, 2022). X-CIGALE incorporates a power law to model the intrinsic hot corona emission based on the slope between the X-ray emission at 2 keV and UV at 2500 Å (, Just et al., 2007). This relationship is expected due to the accretion disk emission peaking in the UV, with the X-ray emission produced in the corona believed to be Compton up-scattering of the UV photons (Haardt & Maraschi, 1993). With this and other improvements, X-CIGALE has been applied to study various aspects of AGN, including star formation history, AGN feedback, and black hole accretion on local mass scaling relations (e.g., Masoura et al., 2021; Mountrichas et al., 2022; López et al., 2023). However, in contrast to the – relation well-established for high-luminosity QSOs (e.g., Lusso et al., 2010), the relation for LLAGN remains elusive, perhaps due to intrinsic differences in the accretion process.
A promising avenue for investigating LLAGN is the – relation, establishing a connection between intrinsic X-ray luminosity (2-10 keV) and the nuclear 12 micron luminosity, as shown by Gandhi et al. (2009). These emissions share a common bond since mid-infrared (MIR) emission is also reprocessed UV emission. The nuclear dust absorbs the emission generated by accretion and reemits it thermally in the IR. This relation has been systematically explored across various luminosity regimes and seems valid for Seyferts and LINERs in the luminosity regime – erg s-1 (Asmus et al., 2015; Fernández-Ontiveros et al., 2023). Additionally, it has already been incorporated into SED fitting methodologies, providing an alternative approach to link X-ray emission with optical-IR emission (Duras et al., 2020).
This study introduces a novel X-ray module into the widely utilized SED fitting code CIGALE. This module integrates two principal components: the – relationship, employed as a prior, and a central accretion engine modeled as an ADAF, complemented by an optional truncated accretion disk. Section 2 offers an in-depth examination of the code and this innovative module. Section 3 demonstrates the application of this module on a X-ray-detected sample of 52 local LLAGN. We elucidate our methodological approach for acquiring X-ray intrinsic fluxes, UV-to-FIR photometry, and SED fitting parameters. Moreover, we present secondary AGN samples to validate the – relation. Section 4 details the outcomes, starting with validating our methodology for the secondary AGN samples and comparing our findings for the LLAGN with those from previous studies. We analyze the X-ray bolometric correction, extending down to the lower limit of erg s-1. Furthermore, we address the issue of galaxy contamination, investigate parameter for LLAGN, noting deviations from QSO extrapolations, and assess the influence of LLAGN on star formation, comparing it with a sample of high-luminosity AGN. Section 5 synthesizes our findings and conclusions, highlighting how this new CIGALE module furnishes a potent toolkit for probing the lower-luminosity regime. This advancement will facilitate the study of supermassive black holes in states of low accretion and is poised to augment future AGN censuses, thereby enriching our comprehension of the role these LLAGN play in the evolution of galaxies.
2 The Code
2.1 Motivation
CIGALE is recognized as a powerful multiwavelength SED template fitting tool tailored for extragalactic research (Boquien et al., 2019). It can accurately derive physical parameters spanning the X-ray to radio spectrum, meticulously accounting for dust attenuation in the UV-optical and its corresponding infrared re-emission via energy balance. This process involves fitting observed SEDs with a user-generated model library incorporating diverse physical templates. The likelihood distribution is computed using each fit, and a Bayesian-like analysis allows for extracting key physical parameters.
Notable enhancements to CIGALE were done by Yang et al. (2020, 2022), particularly the integration of an X-ray module and the SKIRTOR AGN model (Stalevski et al., 2012, 2016). The X-ray module employs the – relation from Just et al. (2007) as a foundational prior, bridging UV photons from the accretion disk with X-rays from the corona. This well-established relation for QSOs correlates the intrinsic AGN luminosity at with , the SED slope between 2500 UV and two keV X-ray bands, as modeled in a standard scenario where UV-optical photons are inverse-Compton scattered to X-ray energies (Haardt & Maraschi, 1991).
The SKIRTOR model encapsulates emissions from three AGN main components: the accretion disk, polar dust, and a clumpy torus. Notably, for the emission of the accretion disk—also referred to as the central engine or seed photons—CIGALE adopts a range of parametric disk models. This allows introducing a delta parameter () to modulate the power-law slope within the 0.125 to 10-micron range. Specifically, for the accretion disk from Schartmann et al. (2005):
CIGALE also includes an alternative accretion disk model based on the original SKIRTOR disk, improved to better reproduce with observational data (Feltre et al., 2012), maintaining a similar form to the model described above.
Despite its efficacy across a broad wavelength range and its substantial contributions to galaxy astrophysics, CIGALE’s application to LLAGN reveals notable limitations. For instance, while Maoz (2007) observed similarities between LLAGN and QSOs, suggesting potential model applicability, divergences in accretion flow-dominated UV photon populations in LLAGN challenge the universal application of the – relation. The complex accretion physics of LLAGN continues to fuel debate, highlighting the need for tailored approaches rather than relying on universally applied relations.
Ho (2008) show fundamental discrepancies in LLAGN SEDs relative to QSOs, notably below , characterized by a dominant red bump over the expected big blue bump. This discrepancy complicates the direct application of QSO models to LLAGN. Additional studies, such as Xu (2011), have explored the – relation for samples of Seyferts and LINERs, revealing certain similarities with established QSO calibrations. However, their determination of is through proxies derived from H and B-band (4420 Å) extrapolation. Even in models assuming LLAGN as scaled versions of QSOs, pure ADAF models deviate slightly from the – relation observed in QSOs (Maoz, 2007). Furthermore, Esparza-Arredondo et al. (2020) demonstrated that certain faint AGN deviate from the expected relation. Nemmen et al. (2014), through a physically motivated SED fitting, predicted an for LLAGN far from extrapolations of its high-luminosity counterparts, emphasizing the influence of radiatively inefficient accretion processes.
To overcome the challenges posed by the unique accretion physics of LLAGN, we propose a novel X-ray module (IRX) designed specifically for these sources. Recognizing the current uncertainties in their accretion physics and the need for a more customized approach, we propose two main changes: the seed photons from the central engine and the prior link of the X-ray emission to the rest of the SED.
Nonetheless, the current adaptation of this module introduces a critical caveat. Given that an ADAF has a considerable synchrotron emission it can also be observed in the radio and submillimeter (sub-mm) wavelengths, so careful consideration is required for another important component of the AGN framework: radio jets. Typically, radio jets are accounted for exclusively within radio frequencies for high-luminosity AGN. The radio module extends to the far-IR in CIGALE, modeling the synchrotron emission as a power law. This specificity enables the distinct determination of the spectrum slope, differentiating it from other sources, such as star-forming regions, modeled with another power law with a different slope.
However, the emission from radio jets spans the entire electromagnetic spectrum, not just the radio domain. This omnipresence can complicate SED fittings that omit their modeling, leading to potential contamination of SEDs intended to map the photon production by SMBH accretion processes. As highlighted by Nemmen et al. (2014), while the typical ADAF exhibits a SED characterized by distinct bumps, the average jet emission in LLAGN manifests as a softer, more constant output across the spectrum from 100 microns to X-ray wavelengths. This spectral behavior makes it impossible to fit without a constraint from the radio bands. Because of that, in this work, jet emission will be neglected in the X-ray to IR analysis. In future studies, we will incorporate the ADAF emission into the radio module of CIGALE, facilitating the differentiation between potential jet models and ADAFs. This development will allow for precisely fitting and identifying sub-mm and radio emissions in LLAGN, thereby excluding potential synchrotron interference in the broader spectrum. Such advancements will enable us to avoid possible synchrotron emission in the rest of the spectra and thus model the total emission from an AGN more accurately and better understand the role of jets in LLAGN activity.
2.2 The new module
We have introduced two main modifications to enhance the utility of CIGALE’s AGN model for LLAGN.
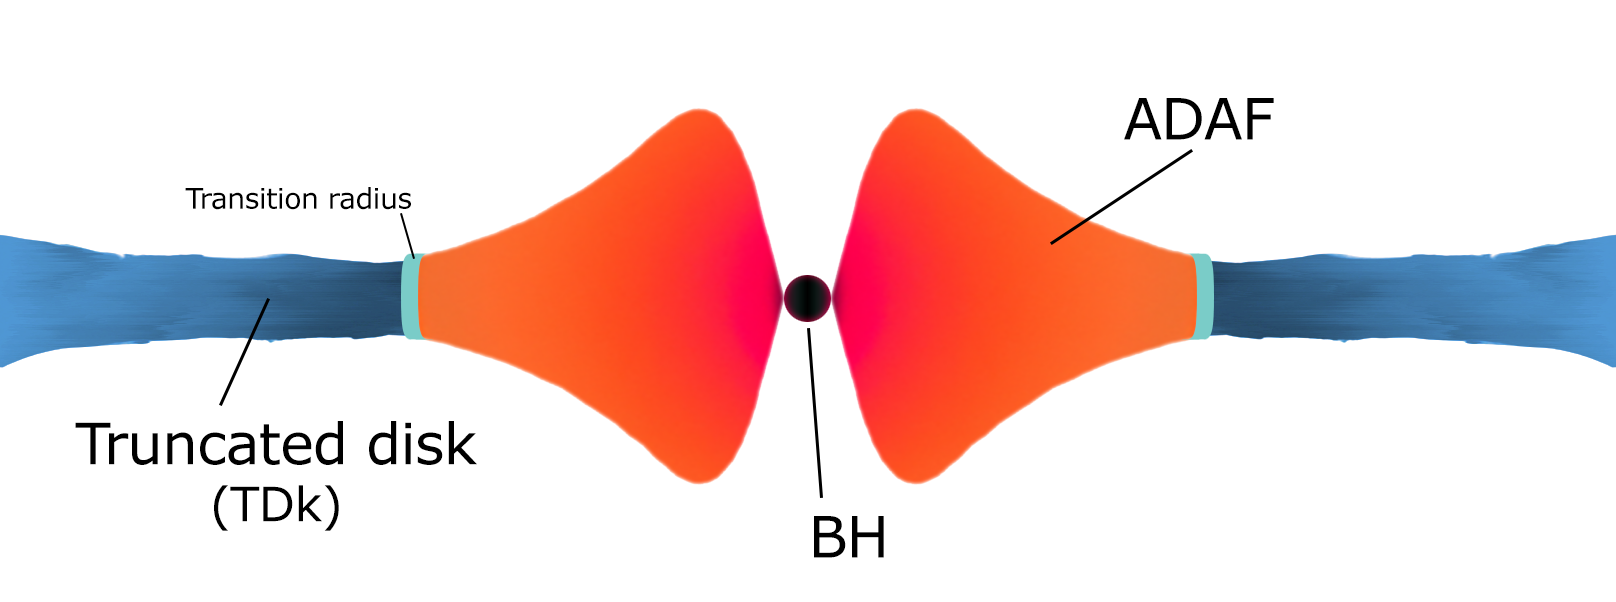
Firstly, the modeling of seed photons emanating from the central engine has been refined by incorporating a combination of a truncated thin disk and an ADAF. A schematic view of the central engine is shown in Fig. 1. Traditional accretion disks, characterized as geometrically thin and optically thick, generate a SED that is the sum of blackbody emission222The disk can be modeled as a sum of rings, each emitting as a blackbody where its temperature depends on its distance from the SMBH.. In contrast, ADAFs are hot, optically thin solutions, and quasi-spherical, with a SED produced by synchrotron radiation, Bremsstrahlung radiation, and inverse Compton scattering. A truncated disk emulates the blackbody spectrum like a standard disk, albeit without the innermost and hotter orbits responsible for UV photon production. The details of the implementation are described in Section 2.2.1.
Secondly, we revisit the connection between the X-ray module and the UV-to-IR SKIRTOR model. The traditional – relation is replaced with an empirical – relation (Asmus et al., 2015). This relation connects the intrinsic X-ray luminosity (2-10 keV) and the nuclear 12 micron luminosity. The details of this implementation are outlined in Section 2.2.2.
2.2.1 A new central engine
For the ADAF component, we parameterize the mean SED based on the ADAF template from Nemmen et al. (2014). This module employs a physically motivated code, considering a hot, geometrically thick, optically thin two-temperature accretion flow with primary radiative processes being synchrotron emission, bremsstrahlung, and inverse Compton scattering. Our parameterization is limited to the UV-to-IR bands, as different CIGALE modules address radio and X-ray. The parameterization is as follows:
| (1) |
In Nemmen et al. (2014), the option of a truncated accretion disk just outside the ADAF is also considered. These truncated disks are crucial for modeling an IR-bump not present in the non-thermal continuum (for an example, see Sombrero galaxy in Fernández-Ontiveros et al., 2023). However, these two components are not independent, as they share bonding conditions with the ADAF. Furthermore, an external disk will reprocess the X-ray radiation produced by the ADAF. Fortunately, Nemmen et al. (2014) demonstrates that this effect is negligible, resulting in a SED identical to the standard disk. Building upon this, we separate both SED components and model the disk as follows:
| (2) |
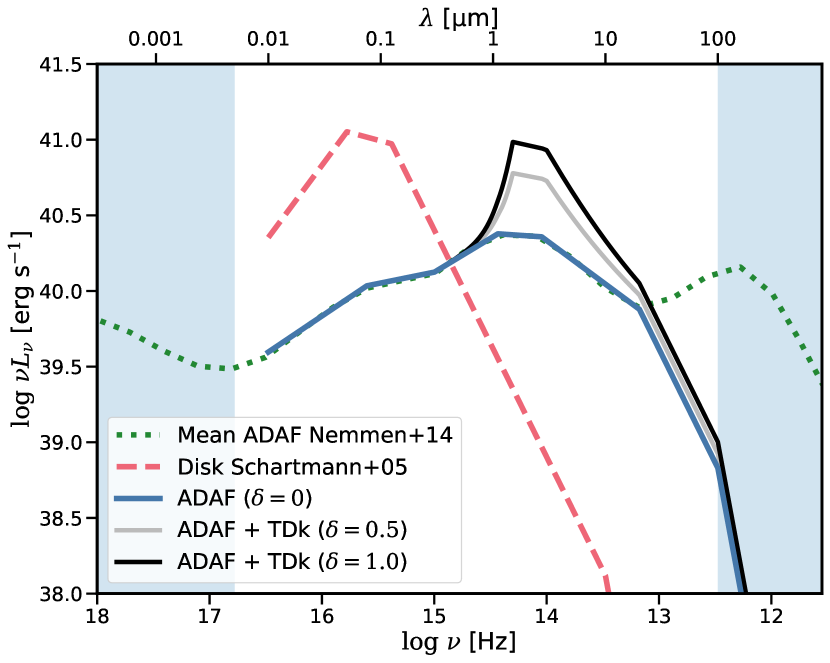
We have modified the parameter within CIGALE to introduce a scaling factor between a truncated disk and the ADAF continuum. With , the central engine is represented solely as an ADAF. Conversely, increasing values of indicate progressively stronger emissions from the truncated accretion disk relative to the ADAF. Figure 2 showcases the SED comparison between the standard QSO accretion disk model from Schartmann et al. (2005), the mean ADAF SED delineated by Nemmen et al. (2014), and our new UV-to-IR parametrization implemented in CIGALE. This comparison highlights the impact of varying on the relative strength of the truncated accretion disk within the total SED, illustrating the adjustable nature of our model in accommodating different LLAGN configurations. The total SED is given by:
| (3) |
This simplification allows the SEDs of both components to be managed independently, accommodating scenarios with and without a red bump.
2.2.2 A new way to connect X-ray to the SKIRTOR model
The decision to move away from the – relation is motivated by the lack of reliable calibrations for this relation in the low-luminosity regime. Given that this relation links photons from the accretion disk with reprocessed emissions in the X-ray spectrum, changes in the UV photon population could significantly alter its calibration.
In contrast, the – relation is based on a direct linkage between two different reprocessed photon types: X-ray and MIR. This relation has proven valid for a wide variety of AGN types, including Seyferts I, II, and LINERs, across five orders of magnitude up to erg s-1. Notably, this relation has been successfully utilized by Duras et al. (2020) for SED fitting, providing estimates of bolometric luminosity and corrections across various bands widely accepted in the field.
The – relation is founded on the principle that UV-optical photons, originating from accretion physics, are reprocessed into X-rays by the corona and into IR by nuclear and polar dust. Interestingly, this relation appears unaffected by obscuration, exhibiting less than 0.1 dex differences between unobscured and highly obscured objects (Asmus et al., 2015). This stability is attributed to emissions from the polar outflow regions in the MIR and potentially higher covering factors in more obscured objects, which mitigate differences due to anisotropic viewing angles. This characteristic makes the relation particularly suitable for LLAGN, which, at low Eddington ratios, are believed to have high covering factors ( – Ramos Almeida & Ricci, 2017). Mason et al. (2012) demonstrated the applicability of this relation to LLAGN using Spitzer data. Further validation is provided by Fernández-Ontiveros et al. (2023), who found that at sub-parsec resolution, all their LLAGN samples conformed to the – relation as delineated by Asmus et al. (2015), confirming its broad applicability to LLAGN.
We implement this relation into the new X-ray module for CIGALE through the parameter , defined as:
| (4) |
We have set with a default value of 0.3, allowing for a minimum value of 0.0 and a maximum of 0.6, with intermediate values possible. This choice is supported by the findings of Asmus et al. (2015), where the dispersion is measured at 0.33. The calculation of in CIGALE considers the sum of the three AGN components (accretion disk, polar dust, and toroid), while is derived from the power-law fit for the AGN component due to the intrinsic nature of X-ray data. We assume the relationship holds at low luminosities because even at low accretion rates, both processes will be similarly affected due to the scarcity of UV photons. As usual, potential host contamination from X-ray binaries and host galaxy dust emissions will be accounted for in the grid models for SED fitting.
These refinements aim to provide a more precise and customized modeling strategy for LLAGN within the CIGALE framework. The code is accessible through the official CIGALE repository333The current version of this code is available on this branch: https://gitlab.lam.fr/cigale/cigale/-/tree/alpha_irx?ref_type=heads. Although initially devised for CIGALE, the underlying concept is versatile and can be adapted for other computational frameworks. By addressing the existing model’s limitations and uncertainties, we expect to enhance parameter accuracy and achieve a more authentic depiction of the physical phenomena occurring in LLAGN.
3 Data and Fitting
This section describes the two samples used to evaluate the new CIGALE module presented in this work. The primary sample discussed in Section 3.1 comprises 52 local galaxies classified as Seyferts and LINERs. This sample will assess the LLAGN properties and validate the module’s performance in the low luminosity regime. A subset of the primary sample, with independent bolometric luminosities, will be used to test the module’s specific validity in this regime. As a secondary sample (Section 3.2), we use the COSMOS and SDSS QSO samples employed in previous CIGALE studies. These sources will be used to confirm the validity of our analysis’s higher luminosity regime of the – relation, a key underlying assumption. Finally, Section 3.3 discusses the fitting methodology and goodness of the fit.
3.1 LLAGN Sample
We compiled a sample of 52 local galaxies, each featuring a central X-ray detection with luminosities falling below . Characterized by low accretion rates, as indicated by their Eddington ratios ( ), these galaxies are predominantly classified as radiatively inefficient accretion flow (RIAF) candidates. This classification suggests that the central engine might operate under a radiatively inefficient accretion mode (Ho, 2009). The calculation of Eddington ratios was primarily based on bolometric corrections from X-ray luminosities, adopting a as per Ho (2009), or through SED fitting for each source, as detailed in studies by Eracleous et al. (2010) and Nemmen et al. (2014).
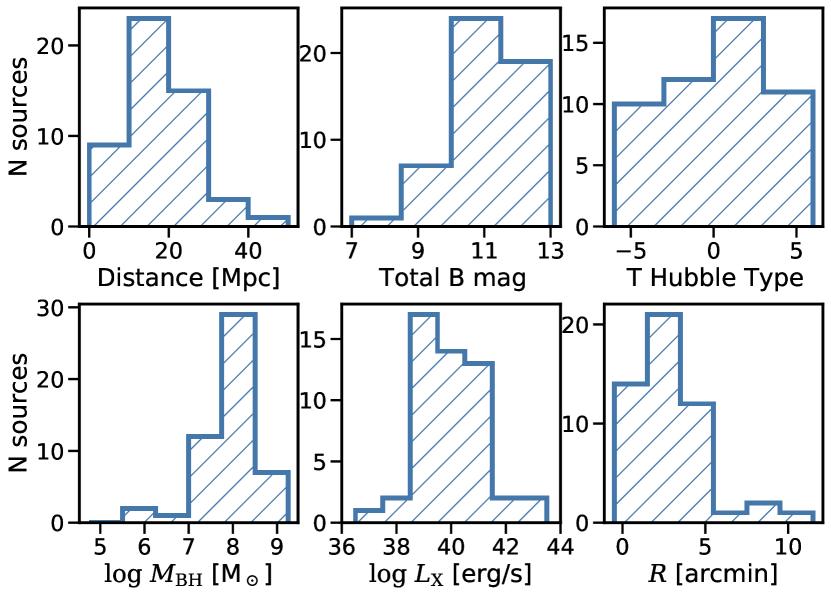
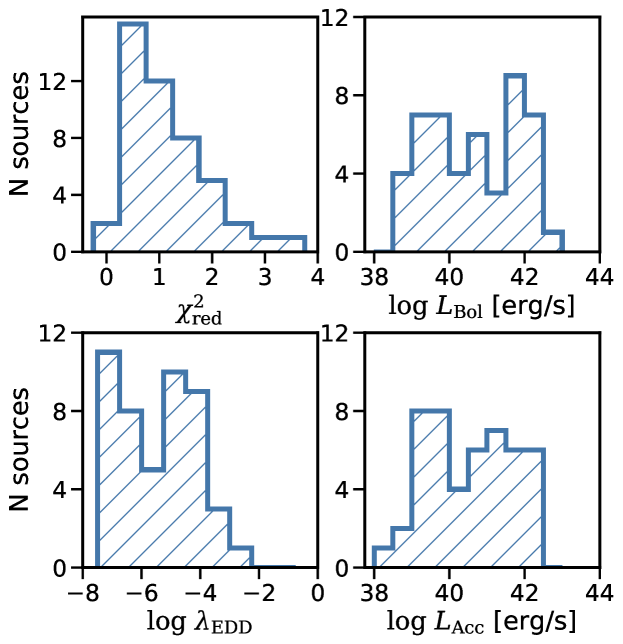
Most of these galaxies are located within 40 Mpc and exhibit a size of less than five arcmin in radius. They span a wide range of morphologies, with their Hubble types ranging from -5 to 5. The SMBH masses, as retrieved from the literature, predominantly fall within the range of , though the sample includes several galaxies hosting less massive SMBHs. A comprehensive list of the galaxies and their characteristics can be found in Table 1, with the distributions of these properties depicted in Fig. 3.
| ID | RA | Dec | z | Dist | Ref | |
|---|---|---|---|---|---|---|
| [Mpc] | [erg/s] | |||||
| NGC1052 | 40.269 | -8.2558 | 0.00496 | 19.19 | 41.20 | 2 |
| NGC2273 | 102.536 | 60.8457 | 0.00613 | 29.76 | 40.89 | 1 |
| NGC2685 | 133.894 | 58.7343 | 0.00295 | 13.26 | 39.00 | 2 |
| NGC2655 | 133.909 | 78.2234 | 0.00467 | 23.82 | 41.20 | 2 |
| NGC2768 | 137.906 | 60.0373 | 0.00451 | 22.07 | 39.73 | 1 |
| NGC2787 | 139.826 | 69.2033 | 0.00232 | 7.41 | 39.20 | 1 |
| NGC2841 | 140.511 | 50.9766 | 0.00211 | 14.51 | 38.94 | 1 |
| NGC3031 | 148.888 | 69.0652 | -0.00013 | 3.59 | 39.15 | 1 |
| NGC3079 | 150.491 | 55.6799 | 0.00368 | 19.01 | 40.05 | 1 |
| NGC3147 | 154.223 | 73.4007 | 0.00934 | 42.72 | 41.92 | 1 |
| NGC3185 | 154.410 | 21.6883 | 0.00410 | 24.98 | 39.40 | 2 |
| NGC3190 | 154.526 | 21.8326 | 0.00437 | 23.98 | 40.07 | 1 |
| NGC3193 | 154.603 | 21.8940 | 0.00460 | 33.01 | 38.76 | 1 |
| NGC3414 | 162.817 | 27.9750 | 0.00490 | 25.92 | 40.48 | 1 |
| NGC3516 | 166.697 | 72.5685 | 0.00883 | 38.01 | 42.49 | 1 |
| NGC3718 | 173.145 | 53.0679 | 0.00331 | 16.98 | 41.22 | 1 |
| NGC3898 | 177.313 | 56.0843 | 0.00385 | 21.97 | 38.93 | 1 |
| NGC3945 | 178.306 | 60.6755 | 0.00427 | 21.57 | 39.80 | 1 |
| NGC3953 | 178.454 | 52.3266 | 0.00350 | 18.93 | 38.04 | 1 |
| NGC3982 | 179.117 | 55.1252 | 0.00371 | 21.55 | 40.78 | 5 |
| NGC4013 | 179.630 | 43.9468 | 0.00277 | 19.71 | 38.80 | 1 |
| … | … | … | … | … | … | … |
In particular, ten galaxies were classified as Seyfert galaxies with low Eddington ratios: NGC2273, NGC3185, NGC3516, NGC3982, NGC4051, NGC4151, NGC4258, NGC4565, NGC4725, NGC5273. While the accretion regime is already inefficient, a standard accretion disk is not probable; sixty percent of them have independent evidence of showing radiatively inefficient accretion. Some galaxies show hints of having an ADAFs scenarios like NGC3516 (Cao & Wang, 2014), NGC4258 (Doi et al., 2005; Szanecki et al., 2023), NGC4565 (Doi et al., 2005; Liu & Wu, 2013) or NGC 5273 (Giroletti & Panessa, 2009). NGC4051 are discussed to be a pure accretion flow scenario (Peterson et al., 2000; Meyer-Hofmeister & Meyer, 2011), or a truncated accretion disk with a comptonizated region (Zhang & Wu, 2006). NGC4151 is discussed to be a pure accretion flow scenario (Niedźwiecki et al., 2015), a truncated accretion disk (Szanecki et al., 2021) or a hybrid-scenario (Alexander et al., 1999; Mahmoud & Done, 2020).
The rest of the samples are classified as LINERs, from which all show evidence of hosting an AGN, mainly through the ionization power of its central X-ray emission (e.g., NGC2655, Reynaldi et al., 2020) or through radio nuclear emission with compact jets (e.g., Baldi et al., 2018, 2021b). For sixty percent of them, there are independent hints of an ADAF scenario or non standard accretion disk scenario: NGC1052 (Yuan et al., 2009; Falocco et al., 2020), NGC2787 (Doi et al., 2005; Pellegrini, 2005; Liu & Wu, 2013), NGC2841 (Pellegrini, 2005), NGC3031 (Doi et al., 2005; Nemmen et al., 2014), NGC3079 (Chang et al., 2002), NGC3147 (Doi et al., 2005; Liu & Wu, 2013), NGC3414 (Wójtowicz et al., 2023), NGC3718 (Doi et al., 2005), NGC4111 (Hauschild Roier et al., 2022), NGC4125 (Pellegrini, 2005), NGC4138 (Liu & Wu, 2013), NGC4203 (Doi et al., 2005; Yuan et al., 2009; Liu & Wu, 2013), NGC4261 (Yuan et al., 2009; Nemmen et al., 2014; Pellegrini, 2005), NGC4374 (Doi et al., 2005; Pellegrini, 2005), NGC4438 (Pellegrini, 2005), NGC4457 (Nemmen et al., 2014), NGC4486 (Doi et al., 2005; Nemmen et al., 2014; Pellegrini, 2005), NGC4494 (Nemmen et al., 2014), NGC4552 (Doi et al., 2005; Nemmen et al., 2014; Pellegrini, 2005), NGC4579 (Doi et al., 2005; Nemmen et al., 2014; Yuan et al., 2009), NGC4594 (Nemmen et al., 2014; Pellegrini, 2005; Liu & Wu, 2013), NGC4698 (Tran et al., 2011), and NGC4736 (Nemmen et al., 2014; Liu & Wu, 2013).
The primary X-ray catalogs utilized for sample compilation include Williams et al. (2022), Osorio-Clavijo et al. (2023), and González-Martín et al. (2009). These catalogs offer spectral fits to data from the Chandra and XMM-Newton telescopes, focusing on various models tailored to spectral features. Our emphasis is on the intrinsic emission from the corona or ADAF, characterized by power-law spectra. The extracted gamma () and normalization values for the power-law component were used to compute X-ray fluxes in both the soft (0.5-2 keV) and hard (2-10 keV) X-ray bands.
For specific sources, we utilized data from catalogs that incorporate reflection components, complex thermal elements, or torus models to understand their obscuration better. We used better constraints on the intrinsic power-law spectra of telescopes such as Swift-BAT or NuSTAR less affected by obscuration. For detailed information on individual sources, we refer to Yun et al. (2022) for NGC 5033, Kammoun et al. (2020) for NGC 3982, and Masini et al. (2022) for NGC 4258. Additionally, for NGC 4051, NGC 4151, and NGC 4725, the spectral fittings are taken from Cappi et al. (2006).
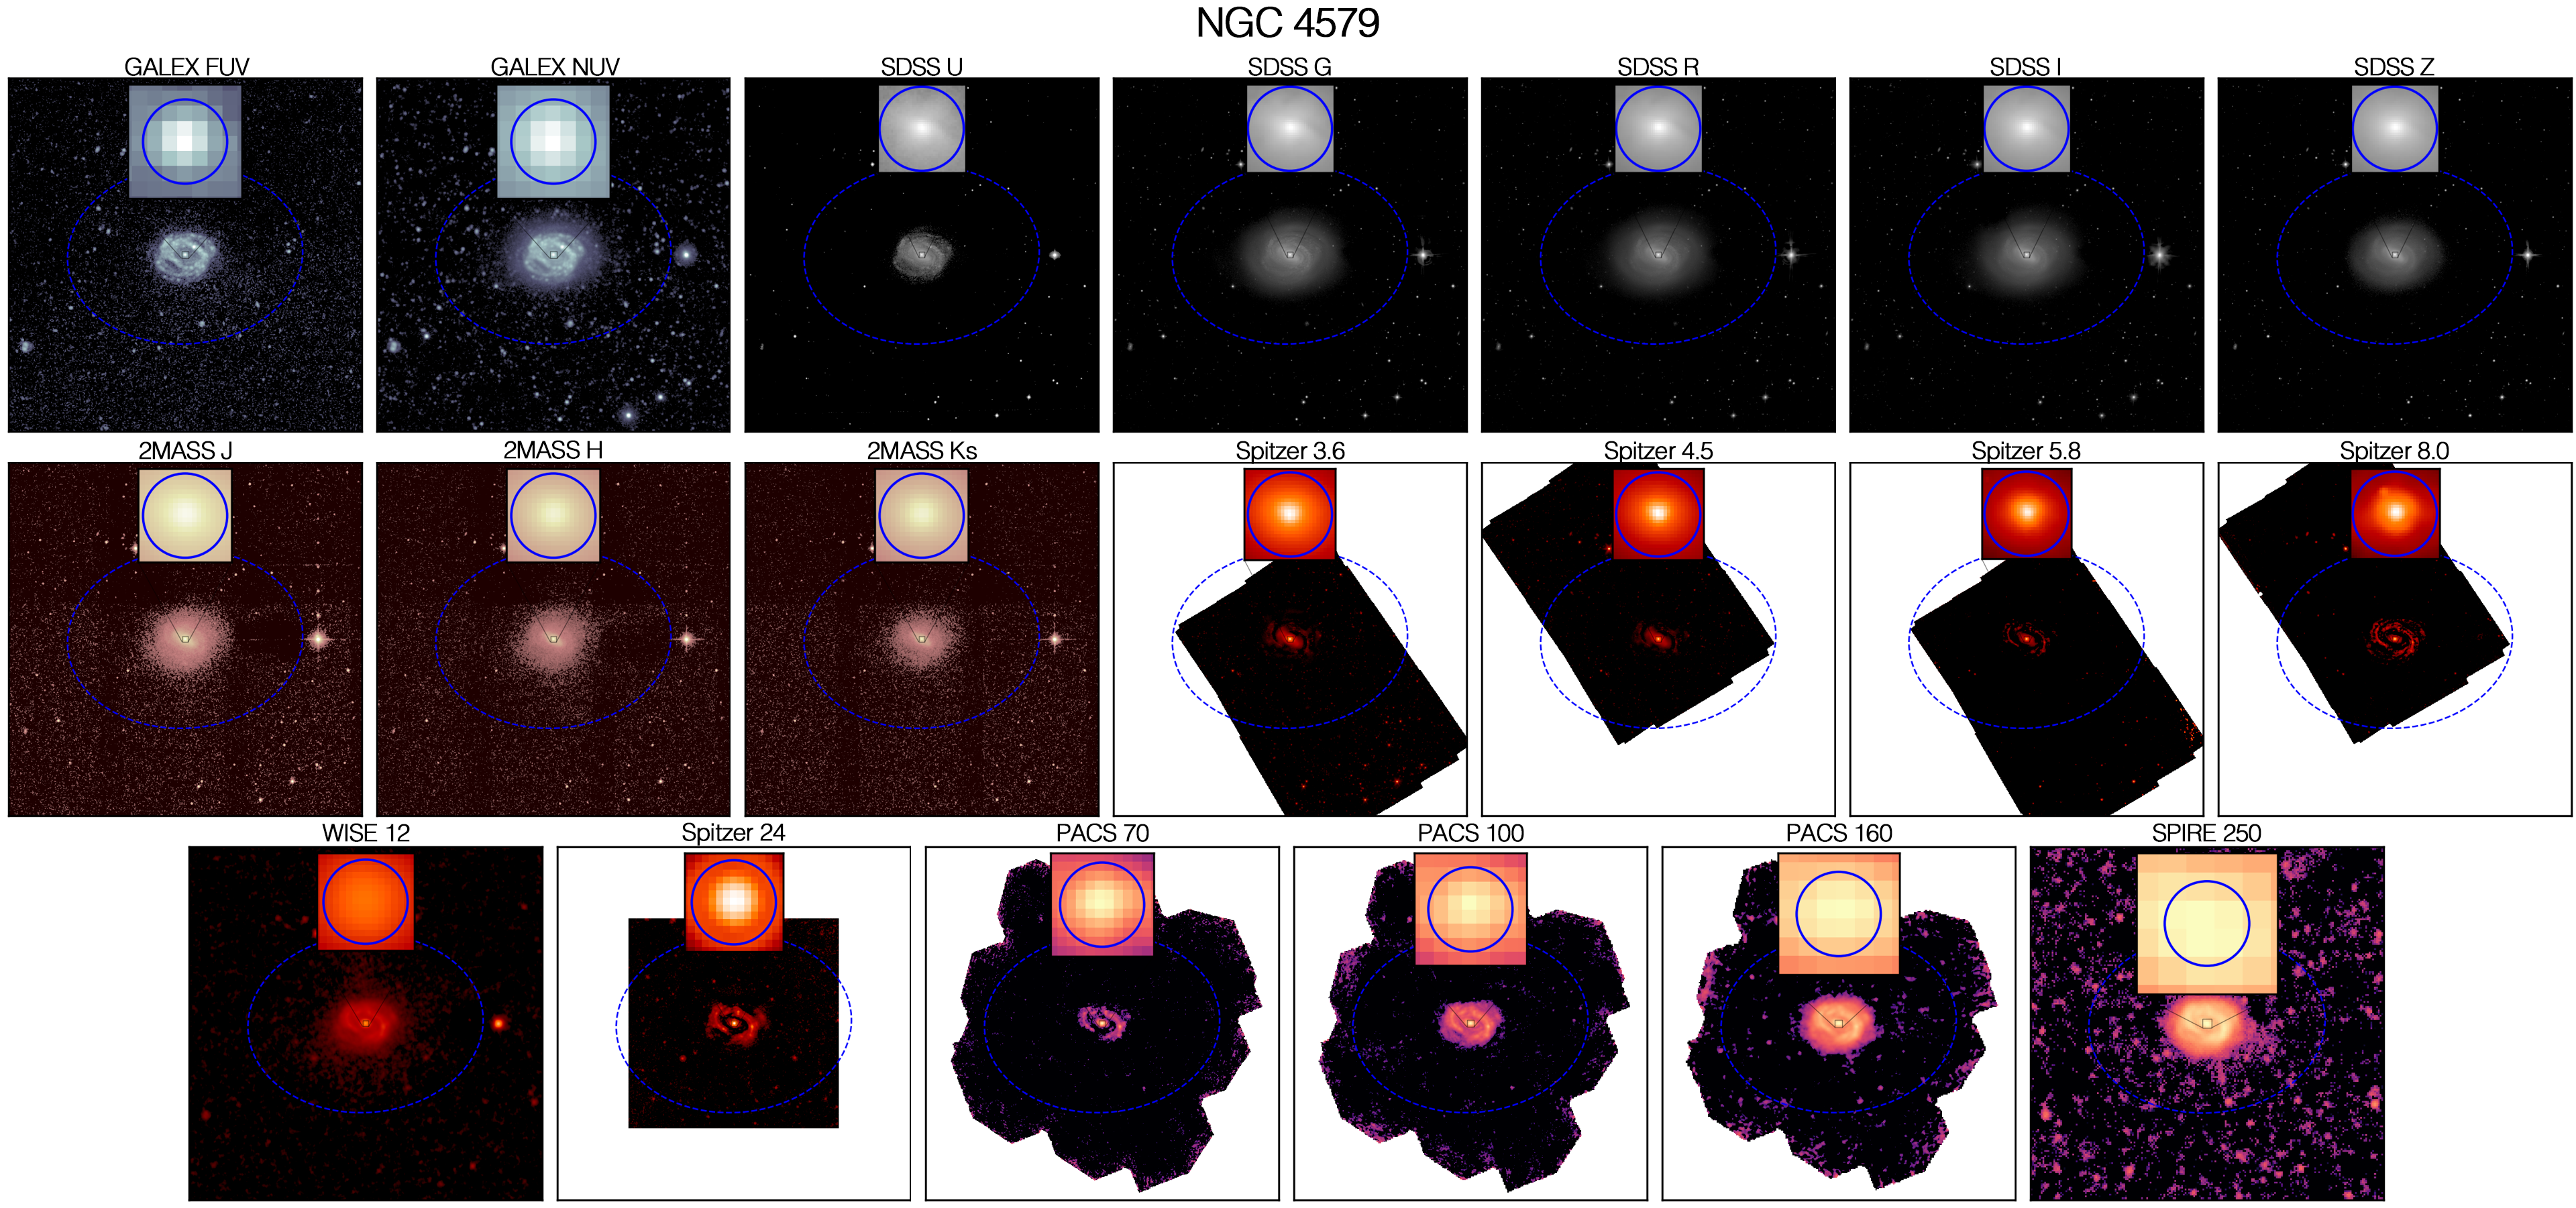
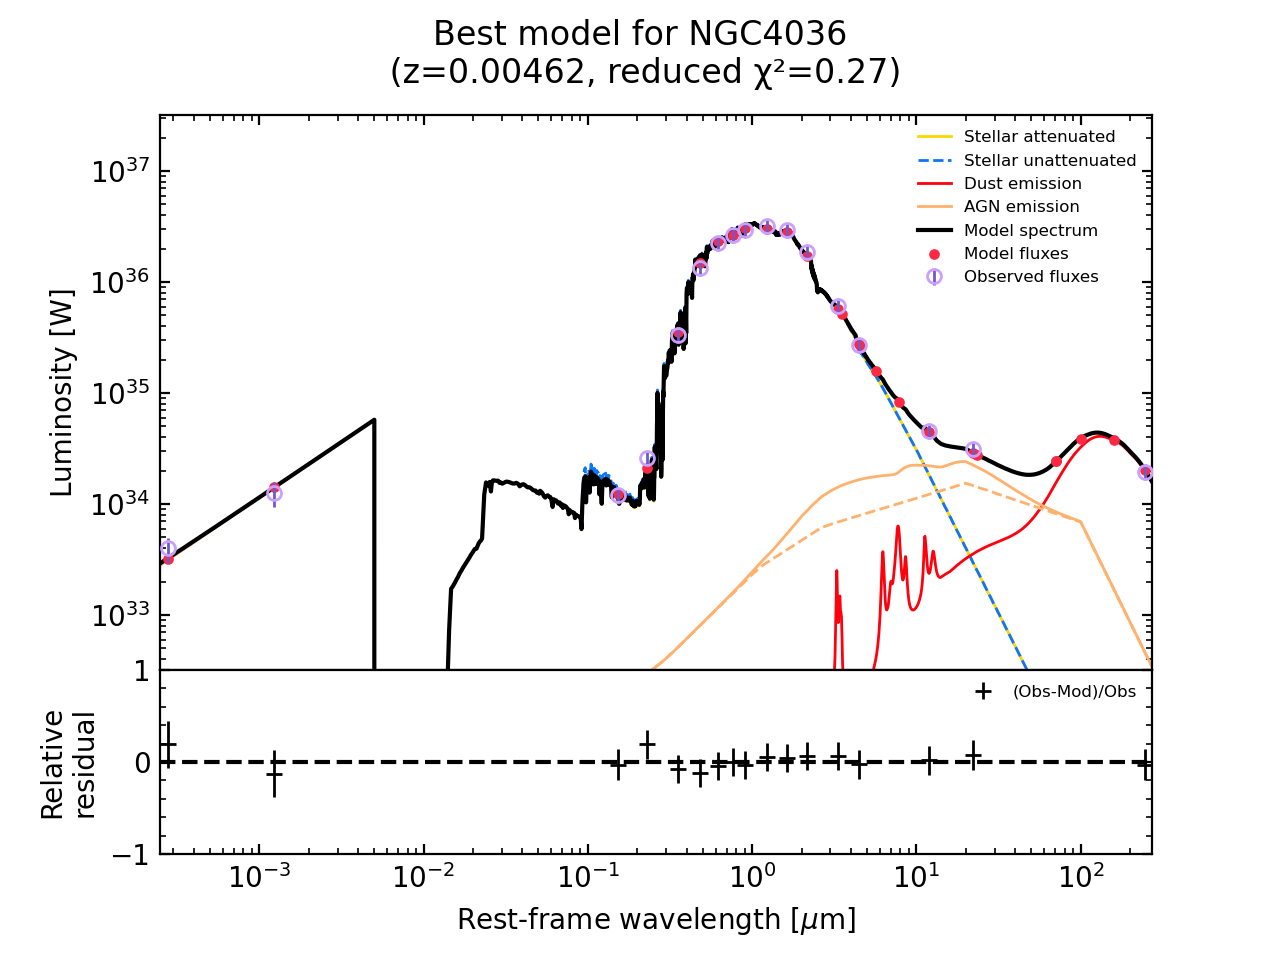
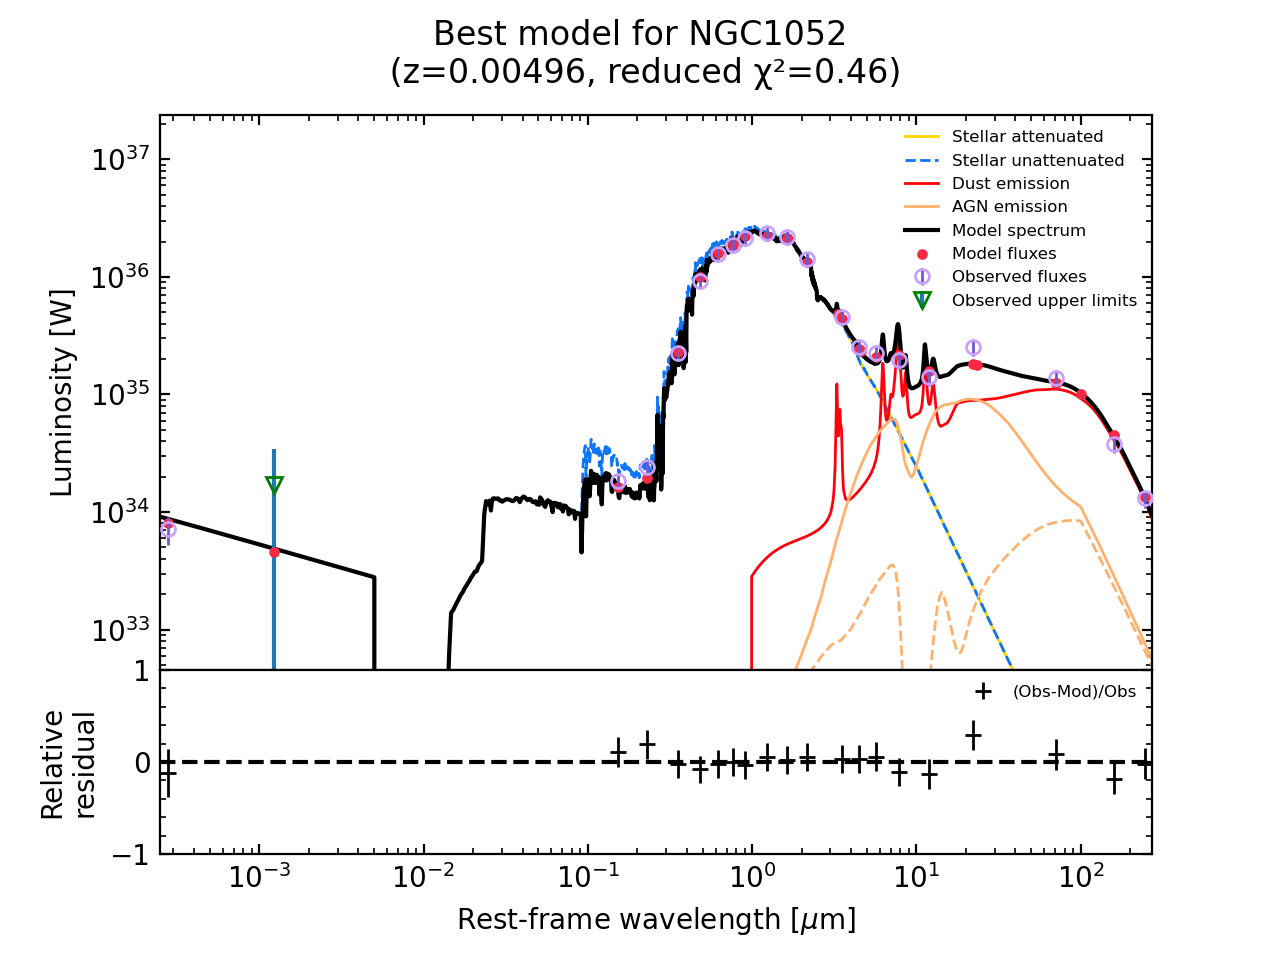
For each galaxy, we conducted photometry spanning UV to FIR bands using calibrated images from the DustPedia database444http://dustpedia.astro.noa.gr/Data. We performed forced photometry in a 9-arcsecond radius aperture centered on each galaxy (refer to Fig. 4 for an example). This aperture covered GALEX NUV and FUV filters, ugriz SDSS bands, JHKs bands from 2MASS, Spitzer IRAC1-4 and WISE 1-4, Spitzer MIPS 24-70 microns, 100, Herschel PACS 70-100-160 microns, and Herschel SPIRE 250 microns. The 9-arcsecond radius was deliberately chosen to align with the diameter required to encompass the Full Width at Half Maximum (FWHM) of the Point Spread Function (PSF) for each filter in our analysis. Upper limits at were set for non-detected sources.
Using the Photutils library version 1.9555https://photutils.readthedocs.io/, we utilized a two-dimensional modeling approach to perform background calculations. To determine the background, we also implemented a sigma clipping technique and, where feasible, masked the galaxy using a mask derived from the largest isophote in the DustPedia database. Additionally, we applied aperture corrections and corrected for Milky Way extinction.
3.2 AGN Samples
We conducted validation tests using well-established datasets from high-luminosity AGN studies to verify the robustness of the hypothesis outlined in Section 2.2.2 regarding our newly developed IRX-CIGALE module. Specifically, we utilized the COSMOS and SDSS QSO samples referenced in previous CIGALE publications (Yang et al., 2020, 2022), enabling direct comparisons with established X-ray modules. These studies determined the bolometric luminosity of AGN using the prior, which we adopted as a benchmark to assess the robustness of our new prior.
The SDSS sample consists of type 1 AGN that are optically selected from the DR14 quasar catalog (Pâris et al., 2018), including 1986 AGN detected in the 2–12 keV X-ray band with XMM-Newton at a significance level greater than 3. Galactic extinction corrections were applied to ensure the reliability of this dataset. The COSMOS sample, derived from the COSMOS-Legacy survey, comprises 590 X-ray-selected AGN with photometric data sourced from the COSMOS2015 catalog (Laigle et al., 2016) that spans 14 broad optical and infrared bands. Redshift measurements were taken from Marchesi et al. (2016).
For both the SDSS and COSMOS samples, the SED fitting methodology followed the parameters established in Yang et al. (2020), keeping the classic accretion disk model from Schartmann et al. (2005) and incorporating the new module using the for comparative analysis (see Section 4.1).
3.3 LLAGN Fitting
The SED fitting process for the LLAGN sample was conducted using a combination of CIGALE modules, comprehensively modeling both AGN and host galaxy emissions. The host galaxy characterization was performed using a Chabrier (2003) initial stellar mass function (IMF) with two possible metallicity values, a delayed star formation history for the stellar population and accounting for dust extinction. Dust emissions were effectively modeled using the Themis module (Jones et al., 2017). For the AGN component, seed photons were modeled using our novel ADAF + TDk approach, detailed in Section 2.2. This method allows adjustable parameters to explore the relevance of the truncated disk with values set at and , accommodating a wide range of AGN fractions. The toroid’s opening angle was set at , achieving a covering factor of 80% to model better the type of obscuration typical in low-accreting sources (Ricci et al., 2017). Viewing angles were adjusted to allow a direct view of the central engine () or complete cover (), with intermediate angles tested but showing no significant impact on the results. The X-ray module was also employed to model emissions from the host galaxy, accounting for emissions from X-ray binaries and the AGN X-ray power law across a range of power indexes. A detailed list of the parameters used in the CIGALE input is presented in Table LABEL:table:06cigale-input.
| Parameter | Model/values |
|---|---|
| Star formation history: delayed model | |
| Age of the main population | 3000, 5000, 7000, 10000 Myr |
| e-folding time | 100, 500, 1000, 3000 Myr |
| Burst stellar mass fraction | 0.0, 0.1 |
| Simple Stellar population: Bruzual & Charlot (2003) | |
| Initial Mass Function | Chabrier (2003) |
| Metallicity | 0.008 (LMC), 0.02 (Solar) |
| Galactic dust extinction | |
| Dust attenuation recipe | modified Calzetti et al. (2000) |
| E(B-V)lines | 0.1, 0.3, 0.5, 0.7 |
| E(B-V)factor | 0.1, 0.44, 0.7 |
| Power-law slope modifying the attenuation curve | -0.4, 0.0 |
| Galactic dust emission: Themis (Jones et al. 2017) | |
| 0.02, 0.17, 0.24 | |
| 0.1, 0.5, 2.5, 5.0, 10.0, 50.0 | |
| slope in | 2.1, 2.5, 2.9 |
| 0.4 | |
| AGN module: SKIRTOR | |
| Torus optical depth at 9.7 microns | 3, 7, 11 |
| Torus opening angle | |
| Viewing angle | |
| Disk spectrum | ADAF + Truncated disk |
| Delta parameter for the truncated disk | 0, 1.0 |
| AGN fraction | 0.001, 0.01, 0.05, 0.1, 0.2, 0.3 |
| Extinction law of polar dust | SMC |
| of polar dust | 0.0, 0.3, 0.6 |
| Temperature of polar dust | 100 K |
| Emissivity of polar dust | 1.6 |
| X-ray module: this paper | |
| AGN photon index | 1.6, 1.8, 2.0, 2.5, 3.0, 3.5 |
| 0, 0.15, 0.3, 0.45, 0.6 | |
| Deviation from expected LMXB and HMXB | 0., 0. |
| Total number of models per redshift | 671,846,400 |
e
Galaxies with fits resulting in were excluded from the analysis, leading to the exclusion of only three galaxies out of the initial 52: NGC4013, NGC4826, and NGC5866. NGC4013 and NGC5866 present challenges due to their dusty nature and pronounced side-view orientation, complicating AGN detection and subsequent SED fitting. Specifically, NGC4013 experiences additional complexity due to star contamination near its center. Although NGC4826 has no side-view orientation, it is characterized by a prominent absorbing dust lane.
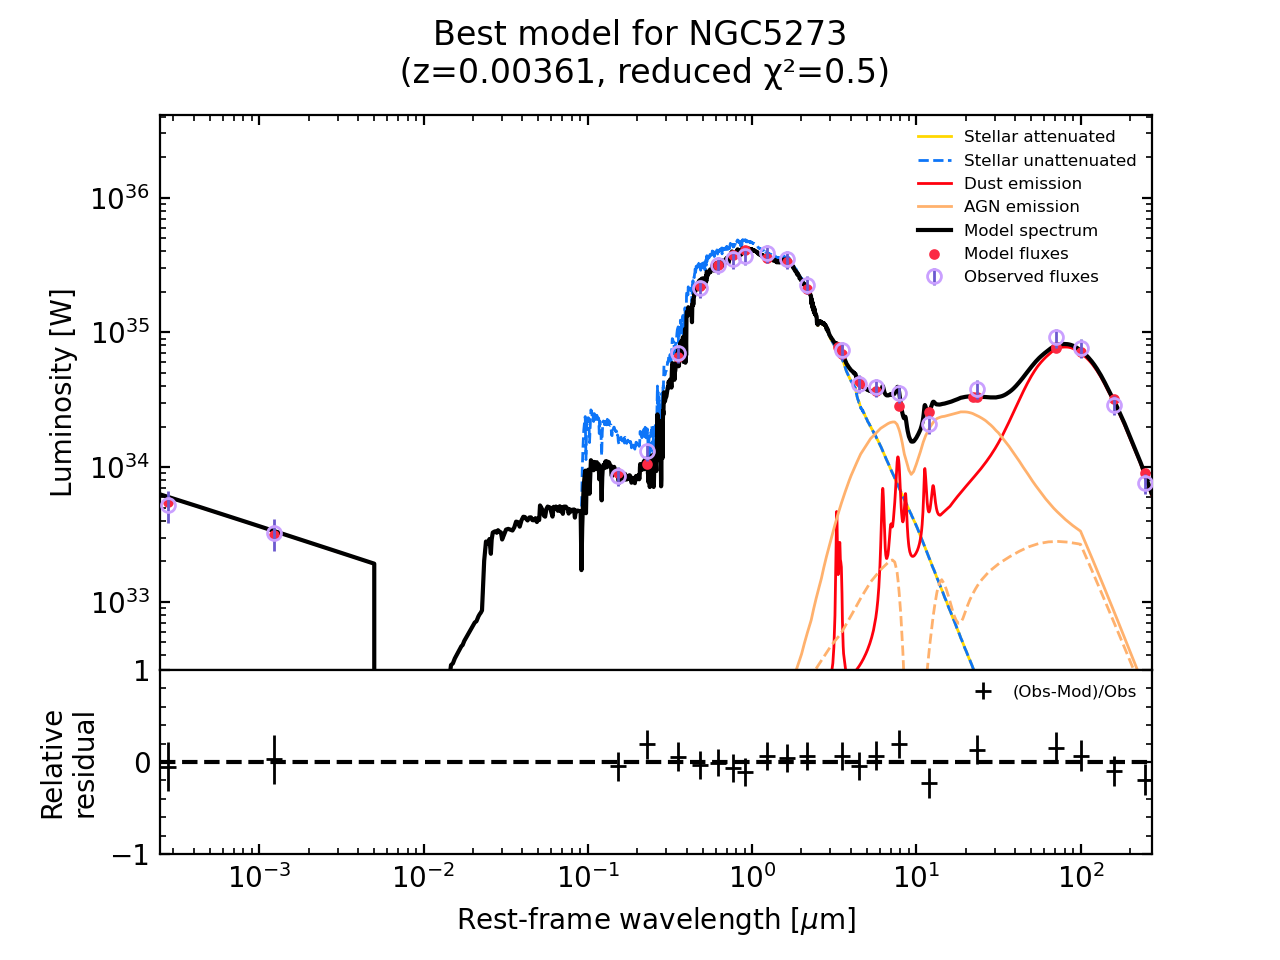
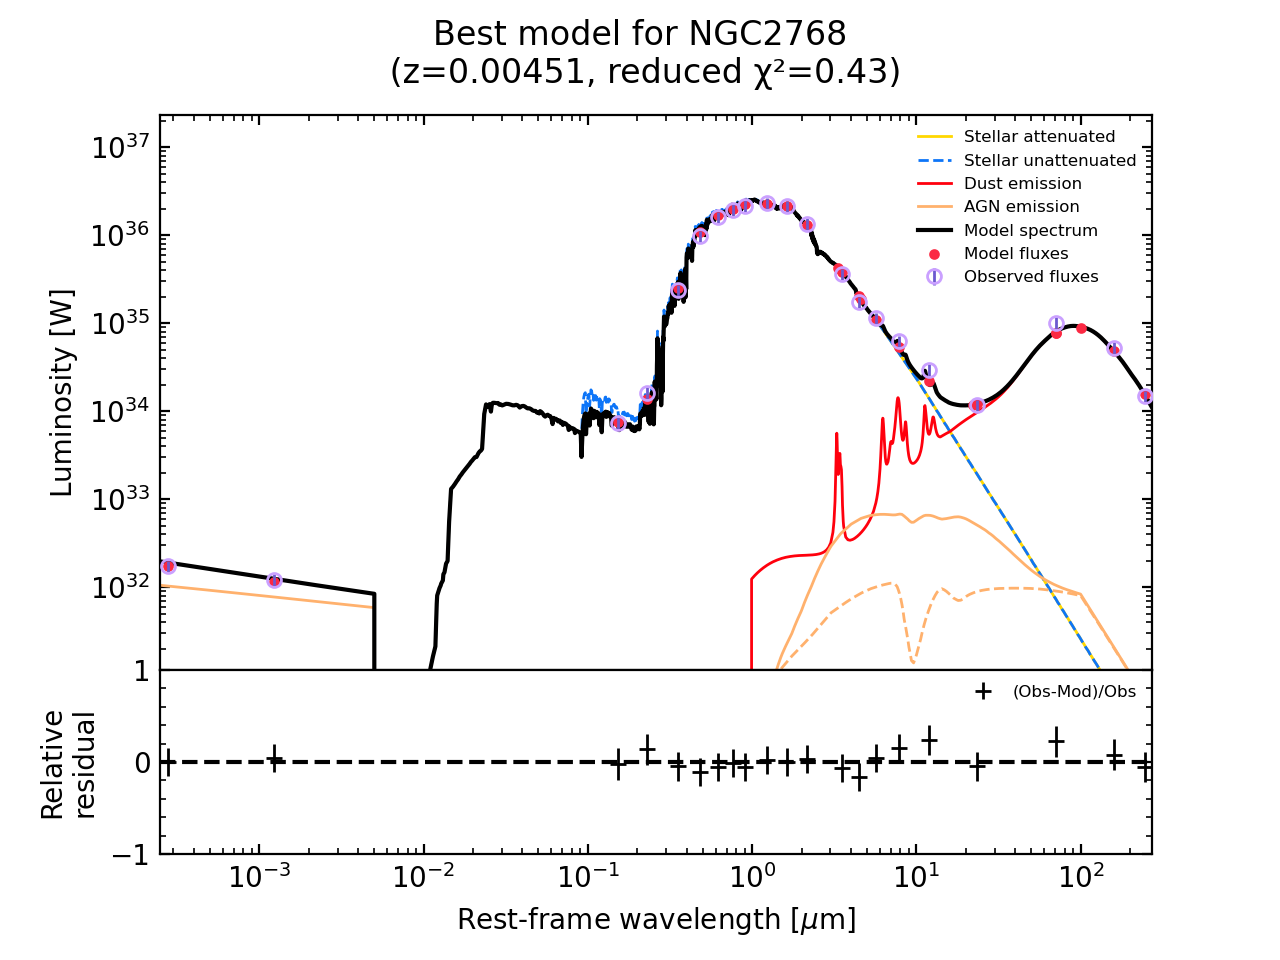
The analysis of SED fitting results revealed a median reduced value of 1.02 and a mean value of 1.24, affirming consistently satisfactory fit quality. Figure 5 displays the distribution of essential AGN properties, including luminosities and Eddington ratios. The accretion luminosity (), representing the total radiation output of the central engine averaged across all directions, is contrasted with the bolometric luminosity (), which encompasses all AGN emissions, including dust re-emission. The measured luminosities for all sources span a broad range from to erg s-1. Utilizing alongside data sourced from the literature enabled the derivation of Eddington ratios predominantly within the range of to 0.001, aligning with expectations for this sample. Figure 6 offers visual confirmations of the SED fitting outcomes for a selection of galaxies, showcasing the model’s proficiency in mirroring observed SED patterns. Additionally, a compilation of the primary physical parameters estimated from the CIGALE output is cataloged in Table 3.
| ID | |||||||
|---|---|---|---|---|---|---|---|
| [erg/s] | [erg/s] | [erg/s] | [erg/s Hz] | [erg/s Hz] | |||
| NGC1052 | 42.16 0.23 | 8.61E-05 | 42.11 0.15 | 41.13 0.09 | 25.12 0.28 | 23.66 0.81 | -0.56 0.42 |
| NGC2273 | 41.82 0.21 | 3.29E-05 | 41.81 0.24 | 40.90 0.14 | 24.77 0.27 | 22.92 0.32 | -0.71 0.23 |
| NGC2685 | 39.35 0.45 | 6.78E-07 | 39.30 0.30 | 38.47 0.16 | 22.31 0.50 | 20.74 0.39 | -0.60 0.34 |
| NGC2655 | 42.02 0.31 | 3.48E-05 | 42.25 0.08 | 41.20 0.04 | 24.97 0.37 | 24.03 0.06 | -0.36 0.16 |
| NGC2768 | 40.14 0.25 | 4.21E-07 | 40.06 0.21 | 39.17 0.13 | 23.11 0.30 | 21.27 0.30 | -0.70 0.23 |
| NGC2787 | 38.43 0.57 | 7.87E-08 | 38.62 0.28 | 37.87 0.20 | 21.39 0.62 | 21.48 0.20 | 0.03 0.31 |
| NGC2841 | 38.95 0.16 | 2.82E-08 | 39.02 0.23 | 38.13 0.20 | 21.91 0.22 | 20.28 0.51 | -0.62 0.28 |
| NGC3031 | 40.96 0.25 | 6.02E-06 | 41.12 0.17 | 40.40 0.05 | 23.92 0.30 | 22.12 0.06 | -0.69 0.14 |
| NGC3079 | 40.68 0.02 | 1.48E-04 | 40.53 0.02 | 39.52 0.04 | 23.64 0.14 | 21.51 0.18 | -0.81 0.12 |
| NGC3147 | 42.37 0.27 | 9.28E-05 | 42.56 0.14 | 41.82 0.05 | 25.33 0.31 | 23.55 0.06 | -0.68 0.14 |
| NGC3185 | 40.45 0.47 | 9.46E-06 | 40.41 0.27 | 39.61 0.07 | 23.42 0.51 | 21.57 0.16 | -0.71 0.26 |
| NGC3190 | 41.84 0.27 | 2.53E-05 | 41.84 0.15 | 41.18 0.07 | 24.78 0.32 | 25.17 0.08 | 0.14 0.15 |
| NGC3193 | 39.64 0.54 | 1.20E-07 | 39.68 0.44 | 38.87 0.28 | 22.60 0.58 | 22.32 0.24 | -0.10 0.31 |
| NGC3414 | 41.30 0.26 | 9.92E-06 | 41.37 0.08 | 40.36 0.05 | 24.27 0.30 | 22.39 0.13 | -0.72 0.16 |
| NGC3516 | 42.20 0.41 | 6.20E-05 | 42.26 0.24 | 41.44 0.11 | 25.16 0.46 | 24.30 0.26 | -0.32 0.28 |
| NGC3718 | 41.32 0.31 | 2.91E-05 | 41.66 0.14 | 41.01 0.06 | 24.21 0.41 | 22.88 0.12 | -0.51 0.20 |
| NGC3898 | 39.10 0.14 | 1.13E-07 | 38.98 0.15 | 38.01 0.14 | 22.06 0.21 | 21.64 0.27 | -0.16 0.18 |
| NGC3945 | 39.99 0.34 | 6.89E-07 | 40.16 0.21 | 39.34 0.10 | 22.96 0.39 | 22.73 0.15 | -0.08 0.21 |
| NGC3953 | 39.25 0.14 | 6.45E-07 | 39.45 0.20 | 38.69 0.14 | 22.21 0.21 | 20.55 0.19 | -0.63 0.15 |
| NGC3982 | 42.21 0.13 | 2.73E-04 | 42.09 0.09 | 41.09 0.05 | 25.18 0.20 | 23.32 0.19 | -0.71 0.15 |
| NGC4036 | 41.40 0.28 | 1.38E-05 | 41.61 0.19 | 40.80 0.11 | 24.37 0.33 | 24.00 0.26 | -0.14 0.22 |
| … | … | … | … | … | … | … | … |
4 Results and Discussion
This section delineates the outcomes derived from applying our novel CIGALE module, which is tailored to fit the SEDs of LLAGN. Specifically, Section 4.1 validates our methodological approach, outlines the selection of our principal hypothesis, and contextualizes our findings within the existing literature. In Section 4.2, we explore the X-ray bolometric corrections within the low-luminosity regime. Section 4.3 studies the modeled indices extracted from our SED fits, investigating their alignment with established scaling relations observed in QSOs. Furthermore, Section 4.4 evaluates the specific star formation rates (sSFR) derived from our analysis, facilitating a comparison with a sample of high-luminosity QSOs.
4.1 Validation
The incorporation of the - relation is substantiated by the findings presented in Section 2.1. This relation establishes a robust connection between the AGN’s X-ray and mid-infrared emissions, spanning at least five orders of magnitude in luminosity. It applies to a broad range of AGN types and is minimally affected by obscuration. Diverse AGN samples covering different luminosity ranges were employed to validate its inclusion in our module.
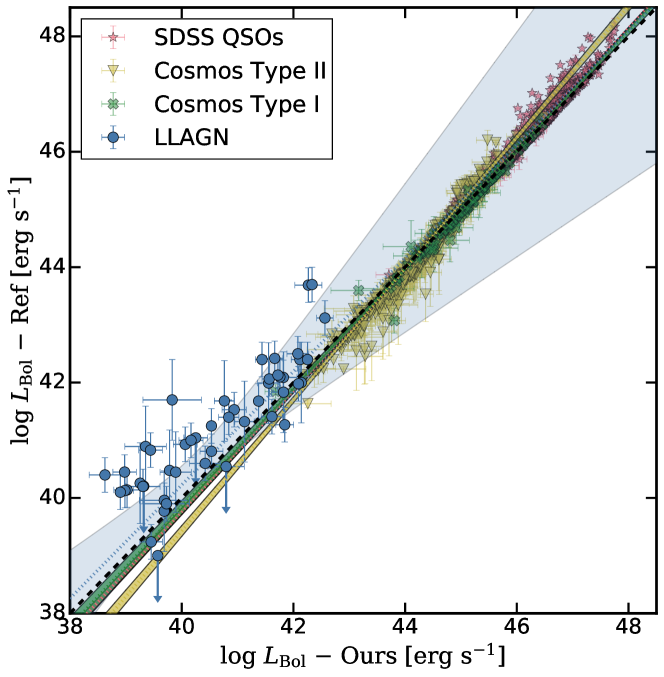
For the high-luminosity regime ( erg s-1), bolometric luminosities used for reference were derived for the SDSS and COSMOS samples using the conventional CIGALE approach (). In the low-luminosity regime, bolometric luminosities from Eracleous et al. (2010) were adopted for the 14 sources in common, and a bolometric correction of (Ho, 2009) was assumed for the remaining sources.
Figure 7 compares these bolometric luminosities with those obtained in this work. The AGN samples exhibit linear fits closely following the 1:1 relationship within the error margins. However, for the SDSS QSOs, a deviation from the 1:1 relationship is observed beyond a luminosity of erg s-1. This deviation could be attributed to the increasing influence of photons from the big blue bump at higher luminosities. For the LLAGN sample, a similar luminosity trend is observed, but the reference values fall above the 1:1 relationship. Our luminosities plotted originate from AGN modeling, while the reference values are derived from observations with an angular resolution of 1 arcsec (Eracleous et al., 2010). This large aperture could introduce significant host galaxy contamination, explaining the observed offset. Additionally, the other reference values were determined using a bolometric correction larger than the one obtained in our study, a point we will discuss further in the next section.
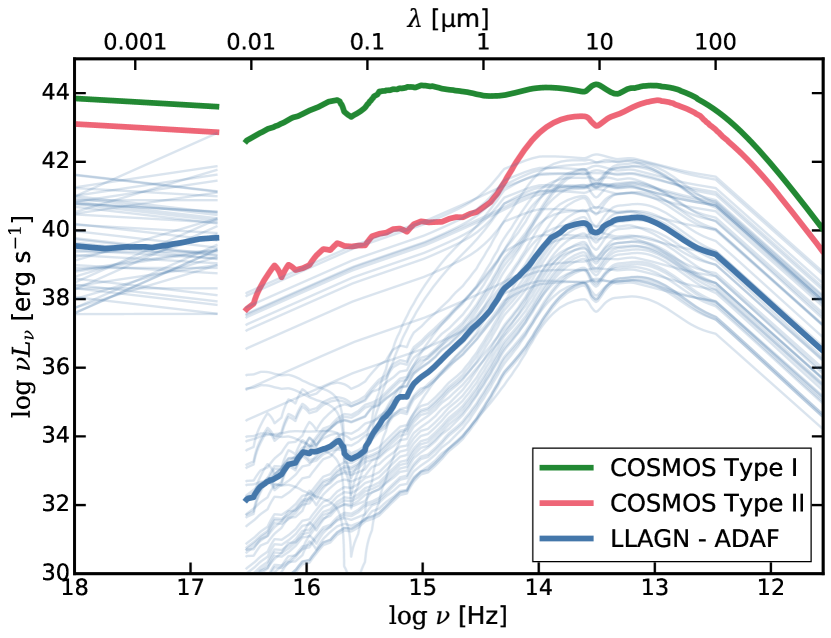
In Fig. 8, we compare the mean SEDs for the high-luminosity Type I and Type II AGN from the COSMOS sample with our LLAGN model. All SEDs include the central engine plus the toroid and polar dust emission. For the AGN sample, the conventional CIGALE approach is used; instead, the LLAGN model incorporates the ADAF+TdK as the central engine.
The SEDs reveal distinguishing characteristics between Type I and Type II AGN. Type II AGN exhibits weaker UV-optical emission due to the torus constraining the central engine. Beyond 1 micron and into the infrared bands, both SEDs become more similar, with a subtle divergence observed in the 9.7-micron silicate complex. This feature manifests as either absorption or emission depending on the optical depth at 9.7 microns, accompanied by a small bump emission at 50 microns for Type II AGN.
While QSOs encompass higher luminosities, both LLAGN models display comparatively lower luminosities. Initially, the mean SED of LLAGN shows characteristics of obscuration, as expected, since most LLAGN are Type II. This obscuration does not precisely match the shape of a Type II from COSMOS, exhibiting a less abrupt thermal emission at 1 micron. Transparent lines in Fig. 8 represent individual sources, revealing that some sources exhibit UV-optical slopes closer to Type II, indicative of unabsorbed ADAF. These non-obscured LLAGN showcase the expected UV shape (Fig. 2). Introducing the ADAF model brings about a notable change in the infrared, where remission from polar dust and the toroid alters the power slope of the overall AGN emission.
4.2 Bolometric correction on the lower-luminosity regime
The X-ray bolometric correction () is essential for converting observed X-ray luminosity () of an AGN into its total bolometric luminosity. This correction addresses the fact that X-rays represent only a portion of the total radiation emitted by the AGN. However, X-rays play a significant role in conducting AGN surveys as AGN emissions dominate this energy band and can be easily identified. This becomes particularly vital in our LLAGN sample, where emissions from the host galaxy overshadow the UV-optical ranges, necessitating the consideration of the host galaxy’s impact on bolometric luminosity.
SED fitting has proven to be an invaluable method for determining of AGN. This technique comprehensively estimates total AGN luminosity as detailed in Section 3.3. By comparing with , we derive the bolometric correction factor , such that . The concept of X-ray bolometric correction has been the subject of detailed investigation in studies by Hopkins et al. (2007), Lusso et al. (2012), and Duras et al. (2020). Notably, Duras et al. (2020) developed a function for that leverages SED fitting incorporating an infrared-X relation within a similar framework to ours, parametrizing how varies with luminosity:
| (5) |
This formula demonstrates the dependence of on bolometric luminosity, which becomes flatter below a specific luminosity threshold. Extrapolations from Duras et al. (2020) suggest a for the lower luminosity regime, while Eracleous et al. (2010) and Ho (2009) propose and , respectively.
In Fig. 9, we compare the relationship between and for our LLAGN sample with the sample from Nemmen et al. (2014) and the low-luminosity extrapolation from Duras et al. (2020). The Pearson correlation coefficient is approximately 0.9. A linear regression performed on our data yields:
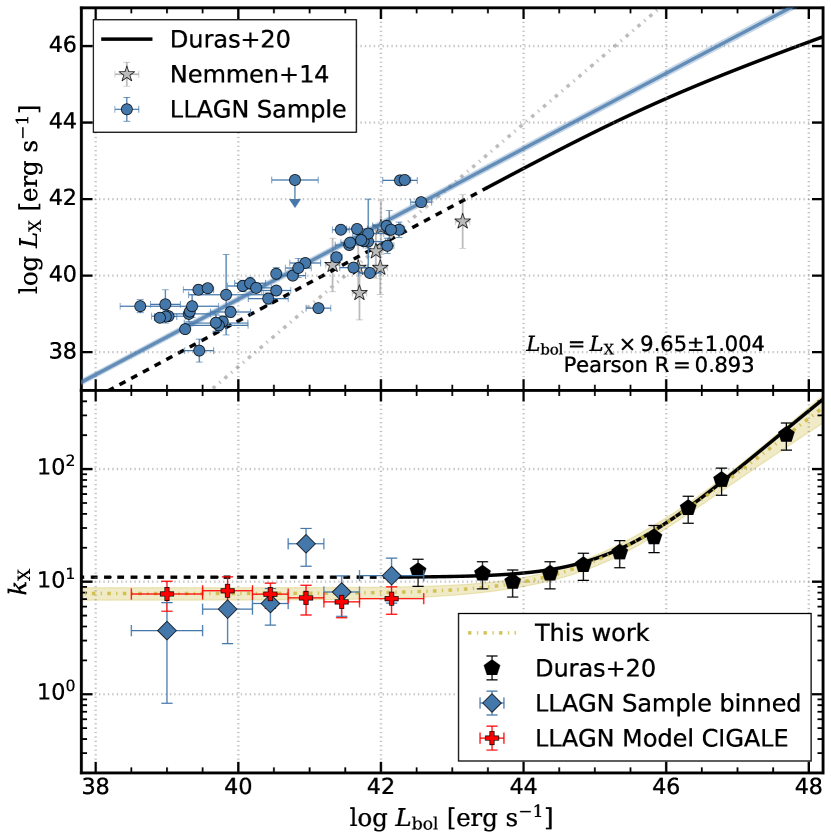
| (6) |
This fit indicates a value lower than those typically reported in the literature, yet it aligns closely, within error margins, with the extrapolation by Duras et al. (2020). Differences from previous studies can be attributed to several factors in our methodology: our specific modeling of the accretion process, a larger sample size that reduces the impact of statistical fluctuations, and the inclusion of host galaxy X-ray emissions in our modeling.
Our fit of , as illustrated in the lower panel of Fig. 9, combines our observational binned data from the lower-luminosity regime with the high-luminosity binned data from Duras et al. (2020). This comprehensive approach allows us to provide an expression for that spans nearly ten orders of magnitude in luminosity. The fitting achieves a of 0.73, with parameters , , and . The binned data, comprising observational and derived from SED fitting, reveal a lower value in the first bin, indicative of the host galaxy’s X-ray emission becoming comparable to that of the AGN and influencing the relationship. This underscores the significant role of host galaxy X-ray contributions, primarily from X-ray binaries, in shaping the bolometric correction calculation.
We also plot the values obtained from modeling pure AGN X-ray emissions in CIGALE, yielding a mean . This value closely aligns with our fit, emphasizing the consistency of our approach in modeling the AGN and host galaxy X-ray emissions and their collective impact on the bolometric correction. CIGALE considers that the host galaxy X-ray emission is primarily produced by low-mass X-ray binaries (LMXBs), high-mass X-ray binaries (HMXBs), and hot gas (Yang et al., 2020). The CIGALE X-ray module utilizes the recipe from Mezcua et al. (2018) to model X-ray emission from these components, with luminosities for LMXBs and HMXBs described as functions of stellar age and metallicity. In contrast, the hot gas emission is quantified in terms of SFR. While shocks produced, for example, by a supernova and AGN feedback, can produce X-ray emission, CIGALE does not yet include shock models. Figure 10 showcases sources where the hard X-ray band significantly contributes to the host galaxy’s X-ray emission, demonstrating CIGALE’s capability to distinguish between LLAGN and host galaxy contributions, thereby refining the bolometric correction calculation.
The debate surrounding the accretion mechanisms in LLAGNmotivated the inclusion of an ADAF and the possibility of a truncated thin disk, as elaborated in Section 2.2. Although it is hypothesized that all sources in our sample undergo a non-standard form of accretion, only 60% have independent evidence supporting this premise. To assess the potential for a traditional accretion mechanism, we implemented a SED fitting approach that utilizes the – correlation and a standard accretion disk. This approach incorporates the Schartmann et al. (2005) accretion disk model with adjustments in the optical slope (). Analysis of the reduced chi-square values revealed comparable fitting quality between the ADAF and conventional disk accretion models, highlighting a limitation in employing SED fitting as a discriminant between these models. Moreover, the bolometric luminosities derived from both ADAF and disk models are within error margins of each other. It is noteworthy, however, that bolometric luminosities obtained via the disk model are marginally higher, exhibiting an average difference of 0.1 dex. This finding indicates a notable consistency in bolometric corrections across different accretion scenarios.
This comparison reveals that although the distribution of UV-to-IR photons may vary, the total integrated luminosity exhibits no significant dependency on the chosen accretion model. This independence arises because the – relationship, which serves as a foundational prior for AGN emission, effectively balances the SED profile. This equilibrium compensates for the lack of UV photons with an increased presence of IR emissions, resulting in a bolometric correction that remains unaffected by the accretion mode. This finding underscores the model-independence of bolometric corrections, emphasizing their reliability across different accretion regimes.
4.3 Galaxy contamination
Exploring the influence of different photometric apertures on the SED fitting for our LLAGN sample sheds light on how solid this module is for future applications. We specifically evaluated how different the AGN properties obtained from our 9-arcsec central photometry are from those obtained from entire galaxy photometry provided by DustPedia.
Figure 11 compares bolometric luminosities calculated using these two distinct methods. The congruence observed between the results signifies that our module effectively discerns the LLAGN bolometric luminosities across a wide luminosity range. Moreover, the findings from the aperture-based method closely mirror those acquired through full galaxy photometry. However, the full galaxy photometry seems to have lower luminosities than the central aperture but follows the 1:1 relation within the uncertainties, suggesting minimal discrepancy within the bounds of error.
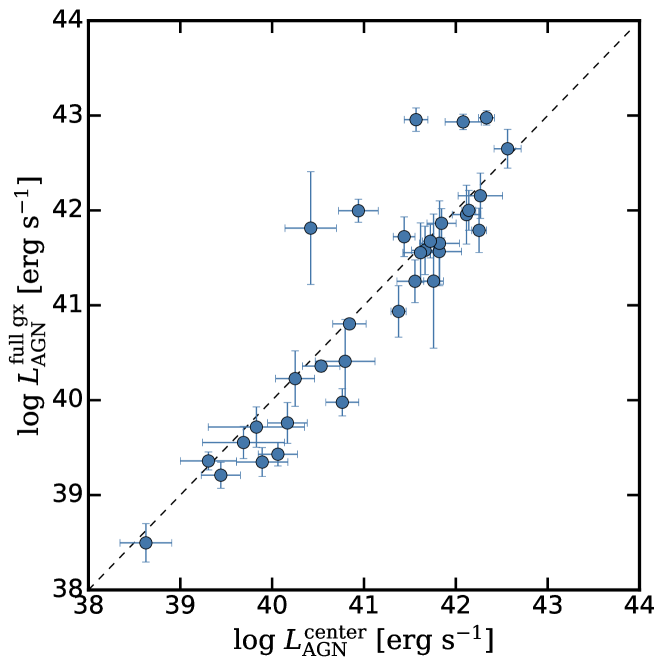
This consistency in bolometric luminosity estimation becomes particularly pertinent for sources at higher redshifts. At such distances, an instrument’s PSF might encapsulate emissions from the central regions and the periphery of galaxies, potentially complicating the task of distinctly resolving galactic structures. Despite these challenges, the IRX module demonstrates a steadfast capability to accurately estimate bolometric luminosities, demonstrating its effectiveness even when full galaxy photometry is employed. These observations highlight the utility of this module when the photometry accounts for the galaxy’s total emitted flux, extending its applicability to high-redshift observations.
4.4 in Low-Luminosity AGN
Our approach does not dictate a specific value for but instead facilitates the reconstruction of the modeled 2500,Å emission at its core to compare with the 2 keV emission. This methodology allows for examining the behavior within the modeled framework, offering predictions for the low-luminosity domain.
The fundamental premise of the – relationship is the interplay between 2 keV and 2500 Å emissions. Figure 12 delineates this association and juxtaposes it with the linear correlations observed in both high and low-luminosity regimes, as reported by studies such as Lusso et al. (2010), Just et al. (2007), and Xu (2011). Our analysis reveals a shift towards lower UV luminosities for comparable X-ray luminosity levels. The equation for the linear fit to our data is as follows:
| (7) |

Although a linear fit approximates the overall trend, the residuals indicate considerable scatter ( ).
Figure 13 presents the relationship with UV and X-ray luminosities. In the QSO regime, a pronounced correlation exists between and UV luminosity, which is less apparent with X-ray luminosity. Lusso et al. (2010) found to loosely correlate with , exhibiting more scatter with . Xu (2011) noted a similar pattern for within the LLAGN regime, albeit with greater dispersion, while no distinct correlation emerged for . In the QSO regime, the predominance of UV photons, primarily from the big blue bump, over corona-generated X-rays domain the relation and determines the .
Our findings in the lower luminosity range, as illustrated in blue in Fig. 13, uncover a weak correlation of with UV luminosity, characterized by a slope of , and a slight inverse correlation with X-ray luminosity, indicated by a slope . The dispersion of residuals in both cases is . The values in LLAGN primarily range between 0 and 1, covering four X-ray and UV luminosities magnitudes. Furthermore, our data straddle the extrapolated fit from Lusso et al. (2010) in the 2500 Å luminosity plane, suggesting that neither consistent nor variable behaviors can be conclusively dismissed, especially considering the margin of error.
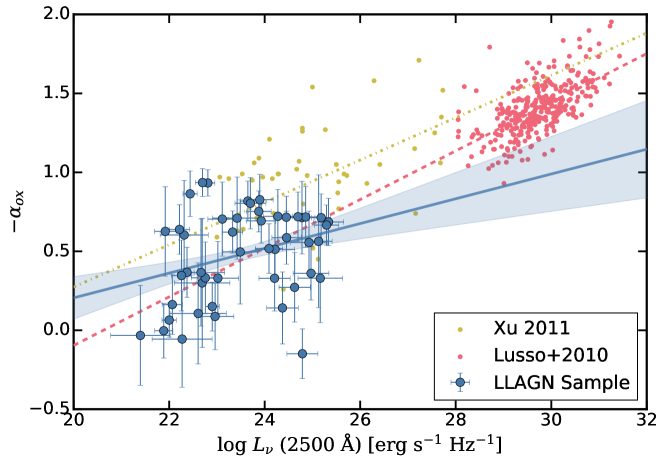
While UV and X-rays exhibit correlation in the high-luminosity regime, the source of X-ray photons in low-luminosity AGN may not solely be a hot corona. ADAFs are known for their pronounced emission in hard X-rays. Hence, X-ray photons in this context could stem from various processes, including inverse-Compton scattering, but operating at disparate scales. This complexity could account for the observed significant dispersion in the – relationship.
We further examine the – domain to gain deeper insights. The correlation found in QSOs sources by Lusso et al. (2010), where sources with higher accretion rates showcase elevated values, corroborates the notion that increased accretion intensifies the big blue bump, thereby boosting UV photon production. In contrast, an anticorrelation in LLAGN was observed by Xu (2011), suggesting a divergent behavior in this regime.
Our findings, depicted in Fig. 14, reveal that LLAGN tend to exhibit either a mild correlation or maintain constant values across different accretion rates. By binning our data, combining it with the data retrieved by Lusso et al. (2010), and applying a broken power-law fit, we capture behavior spanning nine orders of magnitude in . The equation fitted is:
| (8) |
Since the accretion regime is supossed to switch at , we anchor . The fit yields a of 0.4, characterized by parameters and . Figure 14 showcases the behavior of the relation.
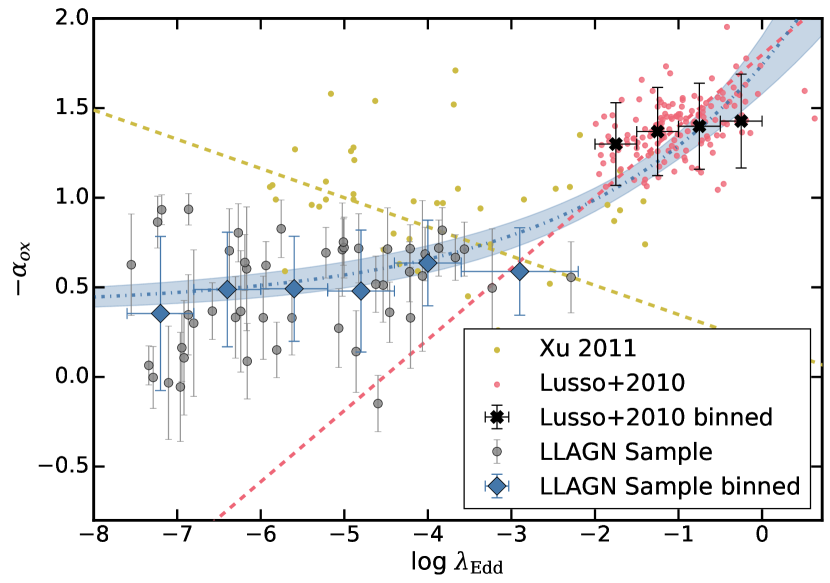
This outcome is consistent with the UV/X-ray correlation depicted in Fig. 12, suggesting a stable ratio between these emissions and a uniform . Whereas in conventional QSOs, variations in accretion rates can modify the big blue bump across the UV-optical spectrum, in the low-luminosity regime, the accretion flows predominantly generate the optical/UV photons. This process involves the inverse Compton scattering of soft synchrotron photons by hot electrons within the ADAF, a phenomenon governed more by magnetic field dynamics than by mass influx into the flow.
Nonetheless, a deeper exploration is warranted to grasp the ramifications of this accretion paradigm fully. Measuring UV emissions in LLAGN is complicated by their inherently faint nature, and our analysis leverages ADAF-centric modeling. For instance, the study by Xu (2011) relies on UV luminosity estimations derived from optical photon proxies, like continuum or emission lines. Future research employing high-resolution data across UV, optical, and infrared spectrums from instruments like the Hubble Space Telescope (HST) and the James Webb Space Telescope (JWST), will be crucial for more accurately delineating the SED in the central parsec of these galaxies.
4.5 LLAGN effects in SFR
AGN feedback is known to affect the SFR of host galaxies, with even LLAGN capable of influencing their environments. Instances such as NGC4579 (Ogle et al., 2024) demonstrate how radio jets can impact the ISM, suppressing star formation within the galaxy’s inner disk. Similarly, Almeida et al. (2023) have shown that the diminished radiative power characteristic of an ADAF can effectively hinder star formation by heating and ionizing surrounding gas. However, the precise dynamics between LLAGN activity and SFR remain partially understood.
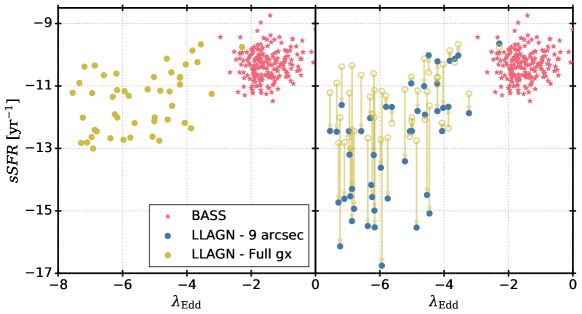
Figure 15 showcases a comparative analysis of the specific star formation rate (sSFR=SFR) versus the Eddington ratio for the selected sample of LLAGN. The sSFR is derived for different apertures from the complete galaxy aperture data sourced from Dustpedia (first panel) and those derived from our targeted central nine arcsec photometry (second panel). Given our sample’s average distance, the latter encompasses an effective area roughly equivalent to a 1.5 kpc diameter.
To contextualize our findings within the broader AGN spectrum, we compare these results against a sample of high-luminosity AGN from the BASS survey (Koss et al., 2022a, b). This comparison is pertinent, as our sample and the BASS survey’s local X-ray detected AGN at similar evolutionary stages within their respective host galaxies. Utilizing high-luminosity AGN data from the BASS survey along with their corresponding host galaxy properties (Koss et al., 2021), it appears that a relation exists across different Eddington ratios, wherein the sSFR calculated for the entire galaxy increases by at least two orders of magnitude at higher Eddington ratios. This trend suggests the existence of underlying feedback or fueling dynamics that interlink star formation with SMBH accretion processes.
Nevertheless, for most of the LLAGN in our sample, the sSFR experiences a significant drop (approximately -1.4 dex from its mean value) when calculated from 9 arcsec photometry. This is illustrated in the second panel of Figure 15, where arrows indicate the change in integrated sSFR versus the central sSFR for each source, predominantly showing a decrease along the sSFR axis. This pattern suggests that LLAGN may predominantly suppress star formation in the central regions of their host galaxies.
These findings indicate that the influence of AGN on star formation extends beyond high-luminosity sources, with LLAGN also affecting their host galaxies’ SFRs—primarily within central regions. This impact might also stem from prior AGN activity, leaving an altered LLAGN and ISM as a remnant of such events. Future investigations leveraging the H emission as a proxy for the historical activity of the fading AGN (Esparza-Arredondo et al., 2020) could offer further insights into the specifics of each scenario. Nonetheless, a rigorous comparison with inactive galaxies is necessary to address this trend comprehensively. This study only aims to introduce a novel approach to SED modeling for LLAGN and explore its potential applications, leaving a detailed examination of the mechanisms affecting and suppressing star formation for subsequent research.
5 Summary and Conclusions
This work introduces an innovative CIGALE code module tailored to analyze low-luminosity AGN. By implementing empirical relationships and physically-based accretion models, this module enhances our understanding of LLAGN through SED fitting, avoiding commonly used QSO extrapolation. Key findings from our comparison of local LLAGN properties to those of QSOs using this new module include the following:
-
1.
The creation of a specialized CIGALE module for LLAGN SED fitting. This development leverages the empirical – relationship to link AGN X-ray and infrared emissions. It introduces the option of modeling the central engine with both an ADAF and a truncated accretion disk.
-
2.
A comprehensive dataset of 52 X-ray-detected local galaxies, primarily LINERs and Seyferts, was compiled to test and affirm the module’s accuracy in lower luminosity ranges. Comparison of these with higher luminosity AGN from the COSMOS and SDSS samples facilitated a robust comparative analysis, validating the module’s effectiveness through its alignment with established reference values.
-
3.
The new module demonstrated exceptional precision in estimating LLAGN bolometric luminosities, effectively mitigating galaxy contamination. This is particularly noteworthy in cases where the central aperture might not entirely capture galaxy emissions (refer to Section 4.3).
-
4.
We expand the X-ray to bolometric correction formula to the lower luminosity regime, arriving to do it applicable across ten orders of . While this formula shows lower values of for LLAGN than other assumed values, it is consistent with extrapolations for high-luminosity AGN from similar methodology studies. Our method is compared with standard accretion models, underscoring the robustness and model independence in characterizing the AGN emission across all ranges of luminosities (refer to Fig. 9).
-
5.
The analysis of the index revealed patterns that deviate from those seen in the high-luminosity regime. Unlike in QSOs, where demonstrates a correlation with , in LLAGN, tends to remain constant or exhibit only weak correlations. This difference may indicate a shift in accretion physics and photon production mechanisms within LLAGN environments (see Fig. 14).
-
6.
The sSFR decreases by 1.4 dex in mean value from an aperture that includes the entire galaxy to one with a diameter of approximately 1.5 kpc. This suggests a potential feedback mechanism from present or past AGN activity localized at the center of these galaxies (refer to Fig. 15).
Our findings substantially advance the characterization and comprehension of LLAGN, a category of active galactic nuclei with significant analytical challenges. These insights pave the way for future explorations into LLAGN’s distinctive attributes and impacts, emphasizing the critical role of a multi-wavelength perspective in AGN research.
Acknowledgements.
We kindly thank Dra. Cristina Ramos-Almeida, for valuable comments and discussion on this work. This action has received funding from the European Union’s Horizon 2020 research and innovation programme under Marie Skłodowska-Curie grant agreement No 860744 ”Big Data Applications for Black Hole Evolution Studies” (BiD4BESt666https://www.bid4best.org/) and the European Union’s Horizon 2020 research and innovation program under grant agreement no. 101004168, the XMM2ATHENA project. The color schemes used in this work are color-blind friendly from Paul Tol’s Notes777https://personal.sron.nl/~pault/. We also acknowledge the use of computational resources from the parallel computing cluster of the Open Physics Hub888https://site.unibo.it/openphysicshub/en at the Physics and Astronomy Department of the University of Bologna. EB acknowledges the support of the INAF Large Grant 2022 ”The metal circle: a new sharp view of the baryon cycle up to Cosmic Dawn with the latest generation IFU facilities”. SB acknowledges support from the Spanish Ministerio de Ciencia e Innovación through project PID2021-124243NB-C21.References
- Agüero et al. (2004) Agüero, E. L., Díaz, R. J., & Bajaja, E. 2004, A&A, 414, 453
- Aird et al. (2012) Aird, J., Coil, A. L., Moustakas, J., et al. 2012, ApJ, 746, 90
- Alexander & Hickox (2012) Alexander, D. M. & Hickox, R. C. 2012, New A Rev., 56, 93
- Alexander et al. (1999) Alexander, T., Sturm, E., Lutz, D., et al. 1999, ApJ, 512, 204
- Almeida et al. (2023) Almeida, I., Nemmen, R., & Riffel, R. A. 2023, MNRAS, 526, 217
- Annuar et al. (2020) Annuar, A., Alexander, D. M., Gandhi, P., et al. 2020, MNRAS, 497, 229
- Asmus et al. (2015) Asmus, D., Gandhi, P., Hönig, S. F., Smette, A., & Duschl, W. J. 2015, MNRAS, 454, 766
- Baldi et al. (2021a) Baldi, R. D., Williams, D. R. A., Beswick, R. J., et al. 2021a, MNRAS, 508, 2019
- Baldi et al. (2018) Baldi, R. D., Williams, D. R. A., McHardy, I. M., et al. 2018, MNRAS, 476, 3478
- Baldi et al. (2021b) Baldi, R. D., Williams, D. R. A., McHardy, I. M., et al. 2021b, MNRAS, 500, 4749
- Boquien et al. (2019) Boquien, M., Burgarella, D., Roehlly, Y., et al. 2019, A&A, 622, A103
- Bu & Yang (2019) Bu, D.-F. & Yang, X.-H. 2019, ApJ, 871, 138
- Cao & Wang (2014) Cao, X. & Wang, J.-X. 2014, MNRAS, 444, L20
- Cappi et al. (2006) Cappi, M., Panessa, F., Bassani, L., et al. 2006, A&A, 446, 459
- Chabrier (2003) Chabrier, G. 2003, PASP, 115, 763
- Chang et al. (2002) Chang, H.-Y., Choi, C.-S., & Yi, I. 2002, AJ, 124, 1948
- Doi et al. (2005) Doi, A., Kameno, S., Kohno, K., Nakanishi, K., & Inoue, M. 2005, MNRAS, 363, 692
- Duras et al. (2020) Duras, F., Bongiorno, A., Ricci, F., et al. 2020, A&A, 636, A73
- Eracleous et al. (2010) Eracleous, M., Hwang, J. A., & Flohic, H. M. L. G. 2010, ApJS, 187, 135
- Esparza-Arredondo et al. (2020) Esparza-Arredondo, D., Osorio-Clavijo, N., González-Martín, O., et al. 2020, ApJ, 905, 29
- Fabian (2012) Fabian, A. C. 2012, ARA&A, 50, 455
- Falocco et al. (2020) Falocco, S., Larsson, J., & Nandi, S. 2020, A&A, 638, A67
- Feltre et al. (2012) Feltre, A., Hatziminaoglou, E., Fritz, J., & Franceschini, A. 2012, MNRAS, 426, 120
- Fernández-Ontiveros et al. (2023) Fernández-Ontiveros, J. A., López-López, X., & Prieto, A. 2023, A&A, 670, A22
- Gandhi et al. (2009) Gandhi, P., Horst, H., Smette, A., et al. 2009, A&A, 502, 457
- Giroletti & Panessa (2009) Giroletti, M. & Panessa, F. 2009, ApJ, 706, L260
- González-Martín et al. (2009) González-Martín, O., Masegosa, J., Márquez, I., Guainazzi, M., & Jiménez-Bailón, E. 2009, A&A, 506, 1107
- Goold et al. (2023) Goold, K., Seth, A., Molina, M., et al. 2023, arXiv e-prints, arXiv:2307.01252
- Haardt & Maraschi (1991) Haardt, F. & Maraschi, L. 1991, ApJ, 380, L51
- Haardt & Maraschi (1993) Haardt, F. & Maraschi, L. 1993, ApJ, 413, 507
- Hauschild Roier et al. (2022) Hauschild Roier, G. R., Storchi-Bergmann, T., McDermid, R. M., et al. 2022, MNRAS, 512, 2556
- Heckman & Best (2014) Heckman, T. M. & Best, P. N. 2014, ARA&A, 52, 589
- Hickox & Alexander (2018) Hickox, R. C. & Alexander, D. M. 2018, ARA&A, 56, 625
- Ho (1999) Ho, L. C. 1999, Advances in Space Research, 23, 813
- Ho (2008) Ho, L. C. 2008, ARA&A, 46, 475
- Ho (2009) Ho, L. C. 2009, ApJ, 699, 626
- Hopkins et al. (2007) Hopkins, P. F., Richards, G. T., & Hernquist, L. 2007, ApJ, 654, 731
- Ishibashi et al. (2014) Ishibashi, W., Auger, M. W., Zhang, D., & Fabian, A. C. 2014, MNRAS, 443, 1339
- Jones et al. (2017) Jones, A. P., Köhler, M., Ysard, N., Bocchio, M., & Verstraete, L. 2017, A&A, 602, A46
- Just et al. (2007) Just, D. W., Brandt, W. N., Shemmer, O., et al. 2007, ApJ, 665, 1004
- Kammoun et al. (2020) Kammoun, E. S., Miller, J. M., Koss, M., et al. 2020, ApJ, 901, 161
- Koss et al. (2022a) Koss, M. J., Ricci, C., Trakhtenbrot, B., et al. 2022a, ApJS, 261, 2
- Koss et al. (2021) Koss, M. J., Strittmatter, B., Lamperti, I., et al. 2021, ApJS, 252, 29
- Koss et al. (2022b) Koss, M. J., Trakhtenbrot, B., Ricci, C., et al. 2022b, ApJS, 261, 1
- Laigle et al. (2016) Laigle, C., McCracken, H. J., Ilbert, O., et al. 2016, ApJS, 224, 24
- Liu & Wu (2013) Liu, H. & Wu, Q. 2013, ApJ, 764, 17
- López et al. (2023) López, I. E., Brusa, M., Bonoli, S., et al. 2023, A&A, 672, A137
- Lusso et al. (2012) Lusso, E., Comastri, A., Simmons, B. D., et al. 2012, MNRAS, 425, 623
- Lusso et al. (2010) Lusso, E., Comastri, A., Vignali, C., et al. 2010, A&A, 512, A34
- Mahmoud & Done (2020) Mahmoud, R. D. & Done, C. 2020, MNRAS, 491, 5126
- Maoz (2007) Maoz, D. 2007, MNRAS, 377, 1696
- Marchesi et al. (2016) Marchesi, S., Civano, F., Elvis, M., et al. 2016, ApJ, 817, 34
- Masini et al. (2022) Masini, A., Wijesekera, J. V., Celotti, A., & Boorman, P. G. 2022, A&A, 663, A87
- Mason et al. (2012) Mason, R. E., Lopez-Rodriguez, E., Packham, C., et al. 2012, AJ, 144, 11
- Masoura et al. (2021) Masoura, V. A., Mountrichas, G., Georgantopoulos, I., & Plionis, M. 2021, A&A, 646, A167
- Meyer-Hofmeister & Meyer (2011) Meyer-Hofmeister, E. & Meyer, F. 2011, A&A, 527, A127
- Mezcua et al. (2018) Mezcua, M., Civano, F., Marchesi, S., et al. 2018, MNRAS, 478, 2576
- Mountrichas et al. (2022) Mountrichas, G., Buat, V., Yang, G., et al. 2022, A&A, 663, A130
- Mukherjee et al. (2018) Mukherjee, D., Bicknell, G. V., Wagner, A. Y., Sutherland, R. S., & Silk, J. 2018, MNRAS, 479, 5544
- Nemmen et al. (2014) Nemmen, R. S., Storchi-Bergmann, T., & Eracleous, M. 2014, MNRAS, 438, 2804
- Niedźwiecki et al. (2015) Niedźwiecki, A., Stȩpnik, A., & Xie, F.-G. 2015, ApJ, 799, 217
- Novak et al. (2011) Novak, G. S., Ostriker, J. P., & Ciotti, L. 2011, ApJ, 737, 26
- Ogle et al. (2024) Ogle, P. M., López, I. E., Reynaldi, V., et al. 2024, ApJ, 962, 196
- Osorio-Clavijo et al. (2023) Osorio-Clavijo, N., Gonzalez-Martín, O., Sánchez, S. F., Guainazzi, M., & Cruz-González, I. 2023, MNRAS, 522, 5788
- Pacifici et al. (2023) Pacifici, C., Iyer, K. G., Mobasher, B., et al. 2023, ApJ, 944, 141
- Padovani et al. (2017) Padovani, P., Alexander, D. M., Assef, R. J., et al. 2017, A&A Rev., 25, 2
- Pâris et al. (2018) Pâris, I., Petitjean, P., Aubourg, É., et al. 2018, A&A, 613, A51
- Pellegrini (2005) Pellegrini, S. 2005, ApJ, 624, 155
- Peterson (1997) Peterson, B. M. 1997, An Introduction to Active Galactic Nuclei
- Peterson et al. (2000) Peterson, B. M., McHardy, I. M., Wilkes, B. J., et al. 2000, ApJ, 542, 161
- Ptak (2001) Ptak, A. 2001, in American Institute of Physics Conference Series, Vol. 599, X-ray Astronomy: Stellar Endpoints, AGN, and the Diffuse X-ray Background, ed. N. E. White, G. Malaguti, & G. G. C. Palumbo, 326–335
- Ramos Almeida & Ricci (2017) Ramos Almeida, C. & Ricci, C. 2017, Nature Astronomy, 1, 679
- Reynaldi et al. (2020) Reynaldi, V., Guainazzi, M., Bianchi, S., et al. 2020, MNRAS, 499, 5107
- Ricci et al. (2017) Ricci, C., Trakhtenbrot, B., Koss, M. J., et al. 2017, ApJS, 233, 17
- Schartmann et al. (2005) Schartmann, M., Meisenheimer, K., Camenzind, M., Wolf, S., & Henning, T. 2005, A&A, 437, 861
- Schawinski et al. (2009) Schawinski, K., Lintott, C. J., Thomas, D., et al. 2009, ApJ, 690, 1672
- Stalevski et al. (2012) Stalevski, M., Fritz, J., Baes, M., Nakos, T., & Popović, L. Č. 2012, MNRAS, 420, 2756
- Stalevski et al. (2016) Stalevski, M., Ricci, C., Ueda, Y., et al. 2016, MNRAS, 458, 2288
- Szanecki et al. (2023) Szanecki, M., Niedźwiecki, A., & Wojaczyński, R. 2023, MNRAS, 521, 2215
- Szanecki et al. (2021) Szanecki, M., Niedźwiecki, A., & Zdziarski, A. A. 2021, ApJ, 909, 205
- Taam et al. (2012) Taam, R. E., Liu, B. F., Yuan, W., & Qiao, E. 2012, ApJ, 759, 65
- Tran et al. (2011) Tran, H. D., Lyke, J. E., & Mader, J. A. 2011, ApJ, 726, L21
- Williams et al. (2022) Williams, D. R. A., Pahari, M., Baldi, R. D., et al. 2022, MNRAS, 510, 4909
- Wójtowicz et al. (2023) Wójtowicz, A., Stawarz, Ł., Cheung, C. C., Werner, N., & Rudka, D. 2023, ApJ, 944, 195
- Xu (2011) Xu, Y.-D. 2011, ApJ, 739, 64
- Yang et al. (2022) Yang, G., Boquien, M., Brandt, W. N., et al. 2022, ApJ, 927, 192
- Yang et al. (2020) Yang, G., Boquien, M., Buat, V., et al. 2020, MNRAS, 491, 740
- Yuan & Narayan (2014) Yuan, F. & Narayan, R. 2014, ARA&A, 52, 529
- Yuan et al. (2009) Yuan, F., Yu, Z., & Ho, L. C. 2009, ApJ, 703, 1034
- Yun et al. (2022) Yun, S. B., Miller, J. M., Barret, D., et al. 2022, ApJ, 935, 12
- Zhang & Wu (2006) Zhang, F. & Wu, X.-B. 2006, Chinese J. Astron. Astrophys., 6, 165