3cm3cm3cm3cm
Subset SSD for enhanced indexation with sector constraints
Abstract
In this paper we apply second order stochastic dominance (SSD) to the problem of enhanced indexation with asset subset (sector) constraints. The problem we consider is how to construct a portfolio that is designed to outperform a given market index whilst having regard to the proportion of the portfolio invested in distinct market sectors.
In our approach, subset SSD, the portfolio associated with each sector is treated in a SSD manner. In other words in subset SSD we actively try to find sector portfolios that SSD dominate their respective sector indices. However the proportion of the overall portfolio invested in each sector is not pre-specified, rather it is decided via optimisation.
Computational results are given for our approach as applied to the S&P 500 over the period August 2018 to December 2023. This period, over 5 years, includes the Covid pandemic, which had a significant effect on stock prices. Our results indicate that the scaled version of our subset SSD approach significantly outperforms the S&P 500 over the period considered. Our approach also outperforms the standard SSD based approach to the problem.
1Departamento de Ciência da Computação,
Universidade Federal de Minas Gerais,
Belo Horizonte, MG 31270-010, Brasil
{arbex,acunha}@dcc.ufmg.br
2Brunel University
Mathematical Sciences, UK
john.beasley@brunel.ac.uk
Keywords: enhanced indexation, finance, optimisation, portfolio optimisation, second order stochastic dominance
1 Introduction
In this paper we consider the problem of enhanced indexation with asset subset (sector) constraints. In this problem we aim to outperform a given market index whilst having regard to the proportion of the portfolio invested in distinct market sectors. We apply second order stochastic dominance (SSD) to the problem. Computational results are given for our approach as applied to the S&P 500.
The structure of this paper is as follows. In Section 2 we review the relevant literature as to second order stochastic dominance. In Section 3 we present SSD from a mathematical viewpoint together with discussion of the standard cutting plane procedure associated with its resolution. In Section 4 we present our subset SSD approach when we have sector (asset subset) constraints present that constrain investment in a number of different subsets of assets. In Section 5 we present computational results obtained when our subset SSD approach is applied to the S&P 500. In Section 6 we present our conclusions.
We believe that the contribution to the literature of this paper is:
-
•
to present a new approach, subset SSD, for the problem of enhanced indexation with asset subset (sector) constraints
-
•
to demonstrate computationally, using data that we make publicly available, that our subset SSD approach significantly outperforms both the S&P 500 and the standard SSD approach to the problem
2 Literature review
The importance of stochastic dominance (SD) within financial portfolio selection has been recognised for decades (Hadar and Russell, 1969; Bawa, 1975; Levy, 1992). For two random variables and it is well known that dominates under first-order stochastic dominance (FSD, ) if and only if it is preferrable over any monotonic increasing utility function. Likewise, dominates under second-order stochastic dominance (SSD, ) if and only if it is preferrable over any increasing and strictly concave (risk-averse) utility function (Whitmore and Findlay, 1978).
For many years however SD was primarily a theoretical framework in terms of financial portfolio optimisation. This was due to the perceived computational difficulties associated with finding SD-efficient portfolios. In the past twenty years, however, there has been a shift towards applying SD (especially SSD) principles in practice, with several optimisation approaches having been proposed for finding portfolios that are either SSD-efficient (with regards to a specified set of feasible portfolios) or SSD-dominating (with regards to a benchmark).
Ogryczak and Ruszczynski (2002) identified several risk measures that can be employed in mean-risk () decision models that are consistent with the SSD relation in the sense that implies that and . These measures include tail value-at-risk, tail Gini mean difference and weighted mean deviation from a quantile. The authors presented stochastic linear programming formulations for these models whose optimal solutions are guaranteed to be SSD-efficient.
Kuosmanen (2004, 2001) developed the first SSD efficiency tests based on mathematical programming. Their formulation finds, if it exists, the portfolio with the highest in-sample mean that dominates a benchmark in the SSD sense. Post (2003) developed linear programming models for testing if a given portfolio is SSD-efficient with respect to all possible portfolios given a set of assets.
Dentcheva and Ruszczynski (2006, 2003) first combine the available assets to produce a reference (or benchmark) distribution, and then compute a portfolio which SSD-dominates the benchmark. They used the lower partial moment of order one to develop the SSD ranking concerning the benchmark portfolio. Their work has been the basis of several later papers in literature, as referenced below.
Roman et al. (2006) introduced a multi-objective optimisation model to find a portfolio that achieves SSD dominance over a benchmark. If no such portfolio exists they find the portfolio whose return distribution comes closest to the benchmark. They showed that SSD efficiency does not necessarily make a return distribution desirable, as demonstrated by the optimal portfolio with regards to maximum expected return (which is SSD-efficient). They emphasised the crucial role played by a carefully selected benchmark in the process.
Luedtke (2008) presented a model that generalises that of Kuosmanen (2004) which includes FSD constraints based on a cutting-plane formulation for problems with integrated chance constraints. Their model involves integer variables, but relaxing integrality yields a formulation with SSD constraints. Their objective is to maximise expected portfolio return.
Fábián et al. (2011a, b) introduced a cutting plane reformulation of Roman et al. (2006) which generalises Dentcheva and Ruszczynski (2006). The authors replaced the multi-objective nature of the problem by maximising the minimum value in the SSD relation with regards to a benchmark. Roman et al. (2013) applied the SSD cutting plane formulation in an enhanced indexation setting. Valle et al. (2017) added exogenous constraints and reformulated the problem as an integer linear program, for which a branch-and-cut algorithm was developed.
Kopa and Post (2015); Post and Kopa (2013) introduced a more generalised efficiency test which allows for unequal probabilities and higher orders. In the case of inefficiency their dual model finds a dominating portfolio. If the portfolio being tested is a benchmark, this dual model can be seen as equivalent to a model for enhanced indexation.
The set of SSD efficient portfolios is generally very large, and investors need to decide how to select a portfolio in which to invest from within this set. The formulation from Post and Kopa (2013) may be used to find different SSD-efficient portfolios depending on how some parameters are specified. Hodder et al. (2015) proposed ways to assign values to these parameters with the goal of helping investors select a single portfolio out of the efficient set.
Bruni et al. (2017, 2012) developed an alternative approach for SD-based enhanced indexation. They proposed a criterion called “cumulative zero-order stochastic -dominance” (CZSD). Zero-order SD happens when all returns from a given portfolio are superior to all returns from an alternative portfolio. The authors attempt to minimise underperformance by adding an exponential number of constraints related to the CZSD criterion, where is the maximum underperformance allowed. The separation algorithm they use is equivalent to optimising conditional value-at-risk via linear programming.
Sharma et al. (2017) introduced a relaxed-SSD formulation for enhanced indexation. The SSD constraints are relaxed by adding under/overachievement where SSD violation is controlled by setting an appropriate upper bound related to the total underachievement. The concept of relaxed-SSD was first introduced by Lizyayev and Ruszczyński (2012).
Sharma and Mehra (2017) proposed a SSD-based approach for producing sector portfolios. For each sector, their model seeks a SSD portfolio that dominates the corresponding sector index, whilst focusing on a number of financial ratios when making sector portfolio decisions. These sector portfolios are then combined using another model that optimises their mean return subject to being (if possible) SSD-dominating with respect to the main market index. If SSD dominance cannot be achieved, either in relation to a sector, or in relation to the main market index, they relax the dominance constraints in their models.
Liu et al. (2021) showed that FSD and SSD may not be sufficient to discriminate between multiple dominating portfolios with regards to a benchmark. They proposed a new criterion called Interval-based SD (ISD) in which different SD orders are applied to different parts of the support of the return distribution. They present a reformulation of Dentcheva and Ruszczynski (2006) that maximises portfolio return subject to ISD constraints.
Sehgal and Mehra (2021) presented a robust version of the SSD-formulation of Dentcheva and Ruszczynski (2006). Robustness is introduced by varying asset returns, and the model is developed as the deterministic equivalent of a stochastic programming formulation. Goel and Sharma (2021) also generalised Dentcheva and Ruszczynski (2006) by considering the “utility improvement” in portfolio returns instead of the returns themselves. The authors proposed replacing the portfolio and benchmark returns by their respective deviations in the SSD constraints.
Malavasi et al. (2021) compared the performance of SSD portfolios with efficient portfolios derived using the standard mean-variance approach of Markowitz (1952). They also focused on the performance of the global minimum variance portfolio as compared with portfolios that are stochastically dominant to this minimum variance portfolio.
Cesarone et al. (2023) compared the formulations of Roman et al. (2013) and Kopa and Post (2015) with skewed benchmarks obtained by using the reshaping method of Valle et al. (2017). They found that SSD portfolios that dominate the skewed benchmark generally perform better out-of-sample.
Liesio et al. (2023) considered the problem of generating an efficient frontier using stochastic dominance. They presented an approach based on Pareto optimal solutions of a multiple objective optimisation problem.
3 Cutting plane based SSD formulation
Based on a reformulation of the conditional value-at-risk minimisation problem given by Künzi-Bay and Mayer (2006), Fábián et al. (2011a) proposed a novel cutting plane formulation of the SSD problem, one whose objective is to maximise the minimum value in the SSD relationship between the portfolio and a given benchmark (e.g. a market index or some reference distribution). Roman et al. (2013) then employed the formulation for enhanced indexation. In this section we outline their approach. Let
-
•
be number of assets available for investment
-
•
be number of scenarios, where the scenarios are assumed to be equiprobable
-
•
be the return of asset in scenario
-
•
be the benchmark return in scenario
-
•
be the return associated with a given asset portfolio in scenario
-
•
be the unconditional expectation of the smallest outcomes in , so the left tail of the portfolio return distribution
For a portfolio with asset weights and hence return in scenario we, as Fábián et al. (2011a) albeit with slightly different notation, define using
| (1) |
Here is the left tail of the cumulative return distribution associated with weighted by the constant factor.
Let be some index portfolio which we would (ideally) like to outperform. The index portfolio has known return in scenario . Let . Clearly we would like the tails of the chosen portfolio to improve on the index portfolio tails, so define the tail differences between the chosen portfolio and the index portfolio using
| (2) |
If then the portfolio is second order stochastic dominant to the index portfolio.
Now it is trivial to observe that the sum of the smallest portfolio returns in the scenarios can be found by considering all subsets of the scenarios of cardinality . In other words
| (3) |
If we are choosing scenarios from the scenarios then there are subsets that need to be considered. So Equation (3) defines the smallest portfolio returns in the scenarios using a combinatorial number of constraints.
Now to make use of the combinatorial definition of let be the minimum value of . Then a suitable optimisation program to decide the portfolio of assets that should be held is to
| (4) |
subject to
| (5) |
| (6) |
| (7) |
| (8) |
| (9) |
| (10) |
Equation (4), in conjunction with Equation (6), maximises the minimum tail difference. Equation (5) is the standard SSD combinatorial definition of the tail differences. Equation (7) ensures that all of our wealth is invested in assets. Equation (8) is the non-negativity constraint (so no short-selling). Equation (9) ensures that can be positive or negative whilst Equation (10) ensures that the tail differences can be positive or negative.
Equations (4)-(10) above is a portfolio choice optimisation program with explicit consideration of tails. If the objective function has a non-negative optimal value then the associated portfolio is second order stochastic dominant with respect to the index.
3.1 Cutting plane resolution
We can adopt a cutting plane resolution procedure for the portfolio optimisation program Equations (4)-(10) above. This has been given previously (albeit in a slightly different form) by Fábián et al. (2011a).
First define an initial scenario set where there is at least one set of cardinality , for all values of , in and amend Equation (5) to
| (11) |
- 1.
-
2.
Consider each value of () in turn and if in the solution to the amended optimisation program
(12) then add the scenario set associated with these smallest portfolio returns to . Here the scenario set that is added constitutes a valid cut associated with Equation (5) that is violated by the current solution.
-
3.
If scenarios sets have been added to go to Step (1), else terminate.
Upon termination at Step (3) above we will have a set of values satisfying all of the constraints in the amended optimisation program. It remains to prove that we have solved the original (unamended) optimisation program to optimality. Here the only difference between the original optimisation program and the amended optimisation program is the replacement of Equation (5) by Equation (11).
Consider a particular value of . Since we have terminated no cuts of the form shown in Equation (12) can be added, in other words we must have
| (13) |
But the term (sum of the smallest portfolio returns over the scenarios) corresponds to , since it is the sum of the smallest portfolio returns. So Equation (13) is equivalent to
| (14) |
Equation (14) in turn implies that satisfies Equation (5) in the original optimisation program. This is because the summation term on the right-hand side of that equation is over all subsets of cardinality , so equivalent to the minimisation term in Equation (14). Hence we have found the optimal solution to the original (unamended) optimisation program.
3.2 Scaled tails
One issue with using Equation (4) as an objective is that there may be multiple distinct portfolios, each of which has the same maximum value. However the SSD formulation can be tailored to focus on certain aspects of the return distribution associated with the portfolio chosen.
With Equation (6) and an objective of maximising more importance is given to when is small. Namely, for approaching is given the same relative importance by Equation (6) as for close to 1. But since the left tails are cumulative, for large values of the most positive portfolio returns are “diluted” among smaller returns. An unintended consequence of this is that solving the maximise formulation tends to yield portfolios that have a smaller left tail when compared to benchmark returns ], but also a smaller right tail.
4 Subset SSD
Above we have a single set of assets and we seek a portfolio chosen from these assets that, in a SSD sense, outperforms (if possible) a given asset index. In this section we generalise this approach to the case where it is possible to subdivide the entire set of assets into individual subsets, each with differing characteristics.
We might be interested in different asset subsets for a number of reasons, e.g. in a given set of index assets it could be that we believe that large capitalisation assets and low capitalisation assets exhibit different behaviour. So in our chosen portfolio we might wish to tailor our exposure to these two different asset subsets differently. Other asset subsets can be easily envisaged e.g. based on different market sectors, different momentum characteristics or any other economic metric. In our approach we do not assume that the asset subsets are disjoint, in other words a single asset can be in two or more subsets.
We should be clear here that under the standard SSD approach exposure to different asset subsets can be included by adding additional constraints to the SSD formulation, Equations (4)-(10), as seen above. However in our approach EACH individual asset subset portfolio is treated in a SSD manner. For clarity this standard SSD approach is given in Section 4.2 below.
Suppose that we have asset subsets where are the assets in asset subset and . We need for each asset subset an underlying index in order to create an appropriate SSD formulation. Such an index may be publicly available. If not, one can easily be produced using weights associated with any index that includes these assets.
As an illustration of this suppose that the weight associated with asset in an appropriate benchmark index is , where the index is price based, so the price of asset at time contributes to the index. Then the sub-index for the set at time is given by , so the index return associated with asset subset at time is . Let represent the returns on the index associated with asset subset . Then .
In the SSD formulation below we add a superscript associated with asset subset to the previous formulation (Equations (4)-(10)). Let be the tail difference between the chosen portfolio and the index portfolio associated with asset subset .
Let be the proportion of the portfolio invested in subset , where this proportion will be decided by the optimisation. However note here that, as will be seen below, the decision maker has the flexibility to impose bounds on , or indeed to specify the exact value that should take.
Then, drawing on the program given above, Equations (4)-(10), the constraints of the subset SSD optimisation program are
| (16) |
| (17) |
| (18) |
| (19) |
| (20) |
| (21) |
Equation (16) is the tail difference for each subset . In this equation the summation in the numerator of the first term on the right-hand side of the inequality is the return from the investment in assets associated with subset . But unlike Equation (5) above we do not necessarily have that the sum of the weights (over assets ) will equal one, so we have to scale this summation by the factor before subtracting the associated with subset .
Equation (17) defines the subset proportion based on the sum of the proportions of the total wealth invested in the assets in the subset. Equation (18) ensures that the proportion of the total investment in subset lies between and where these are the user defined lower and upper limits on the proportion of the portfolio invested in subset . Equation (19) ensures that all of our wealth is invested in assets. Equation (20) is the non-negativity constraint (so no short-selling) and Equation (21) ensures that the tail differences can be positive or negative.
Now assuming that (which we can ensure if we wish by adding constraints , where and small) we can linearise Equation (16) to
| (22) |
Here the term is nonlinear, but can be interpreted as the proportion weighted tail difference associated with set .
Now based on Equation (4) we might be tempted to have an objective function of the form where and . Here each tail difference influences the objective, bounding it from above. However we have no prior knowledge of the investment proportion associated with subset . So for example if we adopt an objective of this form we might have two subsets with the same tail difference (as calculated using Equation (16)), so with the same influence on , but very different investment proportions.
This seems perverse - surely an investment with a higher proportion should have more influence with respect to the objective? In other words (somehow) the investment proportion for subset should ideally be incorporated, so that the higher the value of the more impact subset has on the maximisation objective.
It is clear that one way forward is to replace the nonlinear proportion weighted tail difference term in Equation (22) by a single term, say , and adopt an objective function of the form
| (23) |
subject to
| (24) |
| (25) |
| (26) |
| (27) |
with the other constraints (Equations (17)-(20)) remaining as before. In Equation (25) is the scaling factor where for no scaling and for scaled tails as in Equation (15).
4.1 Cutting plane resolution -
We can adopt what is effectively the same cutting plane resolution procedure for the portfolio optimisation program as given previously by Fábián et al. (2011a) and seen above. For completeness here we set out this procedure in full.
First define an initial scenario set where there is at least one set of cardinality , for all values of , in and amend Equation (24) to
| (28) |
- 1.
-
2.
Consider all values of and () in turn and if in the solution to the amended optimisation program
(29) then add the scenario set associated with these smallest returns to . Here the scenario set that is added constitutes a valid cut associated with Equation (24) that is violated by the current solution.
-
3.
If scenarios sets have been added to go to Step (1), else terminate.
4.2 Standard SSD based approach
Above we have presented our approach where each individual asset subset is treated in a SSD manner. The standard approach to the problem of how to construct a portfolio that is designed to outperform a given market index whilst having regard to the proportion of the portfolio invested in distinct asset subsets (market sectors) is to add constraints related to asset subsets to the standard SSD formulation.
In term of the notation given above this approach would correspond to optimise Equation (4) subject to Equations (5)-(10),(17),(18). Here we have added the subset constraints, Equations (17),(18), to the standard SSD formulation.
Computational results, presented below, indicate that for the S&P 500 over the period which we considered, this standard approach is outperformed by our approach.
5 Computational results
We used a dataset associated with the S&P 500, with daily stock prices from August 2018 until December 2023. This time period, over 5 years, includes the Covid pandemic, which had a significant effect on stock prices. Our data has been manually adjusted to account for survivorship bias - on a given date only assets that were part of the S&P 500 index at that time are available to be selected for investment.
In order to define the scenarios required by SSD we used a lookback approach that included the most recent 85 daily prices, which then yield 84 in-sample returns (roughly a quadrimester in business days).
The SSD subsets were defined by the economic sectors to which each asset belongs. There are 11 different stock market sectors according to the most commonly used classification system, known as the Global Industry Classification Standard (GICS). These sectors are communication services, consumer discretionary, consumer staples, energy, financials, healthcare, industrials, materials, real estate, technology and utilities. For each sector, its benchmark consisted of the corresponding time series for the S&P sector indices111https://www.spglobal.com/spdji/en/index-family/equity/us-equity/sp-sectors/. Table 1 shows the S&P 500 sector breakdown as of October 2023 together with the approximate weight of the sector with regard to the index.
| Sector | Approximate weight (%) |
|---|---|
| Technology | 26.0 |
| Healthcare | 14.5 |
| Financials | 12.9 |
| Consumer discretionary | 9.9 |
| Industrials | 8.6 |
| Communication services | 8.2 |
| Consumer staples | 7.4 |
| Energy | 4.5 |
| Utilities | 2.9 |
| Materials | 2.6 |
| Real estate | 2.5 |
All of the data used in this paper is publicly available for the use by other researchers at:
We used CPLEX Optimizer 22.1.0 (2023) as the linear and integer programming solver, with default options. Our backtesting tool is developed in Python and all optimisation models are developed in C++. We ran all experiments on an Intel(R) Core(TM) i7-3770 CPU @ 3.90GHz with 8 cores, 8GB RAM and with Ubuntu 22.04.3 LTS as the operating system.
5.1 Out-of-sample performance
In this section we evaluate the performance of our subset SSD approach when compared to both the S&P 500 and the standard SSD approach with sector constraints, which was outlined above in Section 4.2.
As mentioned above we used an in-sample period of 85 days. We conducted periodic rebalancing every 21 days (roughly one month in business days). To illustrate our approach our first in-sample period of 85 days runs from August 2018 until December 2018. So using this in-sample period (with 84 return values for each asset) we choose a portfolio (using a SSD strategy) on December 2018, evaluate its performance out-of-sample for the next 20 business days so from December 2018 to January 2019, then repeat the process until the data is exhausted. In total this involved 60 out-of-sample periods for which we then have a single out-of-sample time series of returns. For simplicity we assume no transaction costs.
We evaluated four different strategies. The unscaled and scaled versions of our subset SSD approach and, equivalently, the unscaled and scaled versions of the standard SSD approach with sector constraints.
In order to define sector bounds, for a given sector we take its exposure from Table 1 as and define an interval such and , where and limit exposure to any particular sector, as in Equation (18). These bounds apply to both subset SSD and standard SSD. This choice ensures that the portfolios chosen under both subset and standard SSD have similar exposure to S&P 500 sectors, whilst, at the same time, giving some leeway to the SSD optimiser in its choice of portfolio.
Figures 2 and 2 show graphically the cumulative returns during the out-of-sample period for all four strategies and the S&P 500. For easier visualisation, we show these results separately, with the subset SSD results in Figure 2 and the standard SSD results in Figure 2. Both figures use exactly the same scale.
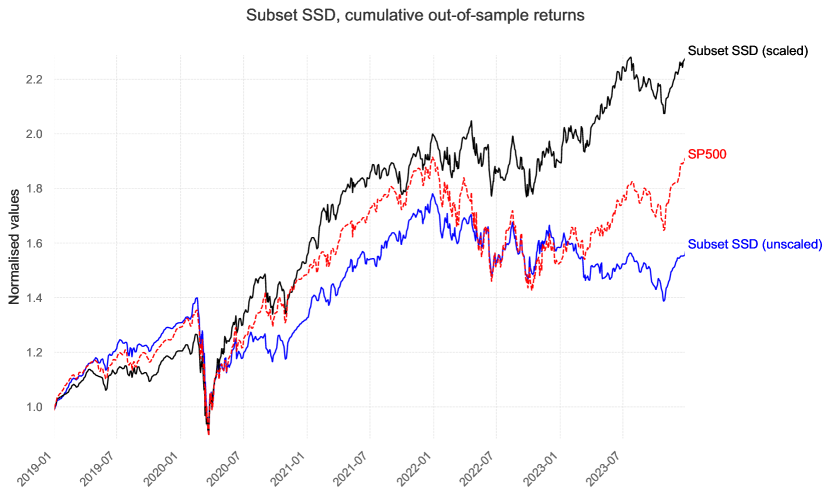
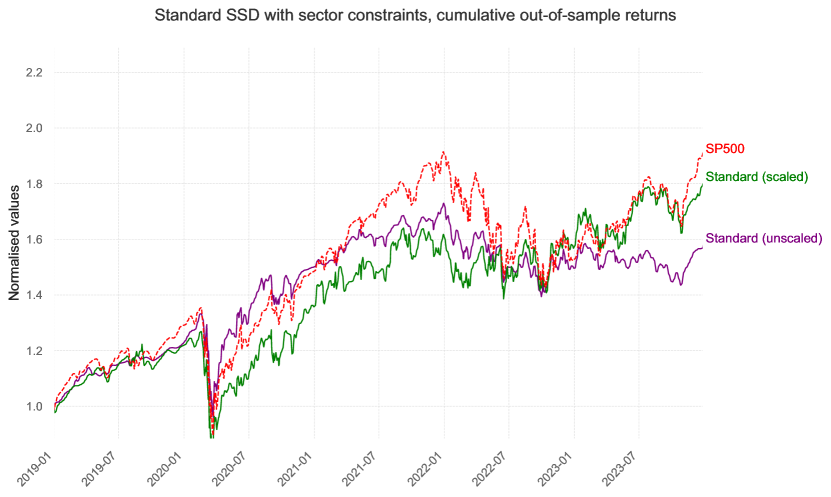
Considering these figures the effect of the Covid pandemic can be clearly seen, with a dramatic fall in cumulative returns for the S&P 500 in the first half of 2020. It is clear from these figures that the scaled version of our subset SSD approach significantly outperforms the S&P 500 over the time period considered.
In order to gain some numeric insight into the performance of the four strategies as seen in Figure 2 and Figure 2 we show some selected comparative statistics in Table 2. These are calculated from the out-of-sample returns for the four strategies, and correspondingly for the S&P 500 index.
Let be a series of daily portfolio values, where is the value of the given portfolio on day . In Table 2 FV stands for the final portfolio value, assuming a starting amount of $1, and is calculated as . CAGR stands for Capital Annualised Growth Rate and as a percentage is calculated as , where is an approximation for the number of years in the out-of-sample period. Column Vol represents the annualised sample standard deviation of the out-of-sample returns. Sharpe and Sortino are the annualised Sharpe and Sortino ratios respectively, where for their calculation we use the CBOE 10-year treasury notes (symbol TNX) as the risk-free rate. MDD represents the maximum drawdown and as a percentage is calculated as .
| Strategies | FV | CAGR | Vol | Sharpe | Sortino | MDD |
|---|---|---|---|---|---|---|
| Subset SSD (scaled) | 2.28 | 17.92 | 18.57 | 0.86 | 1.22 | 29.05 |
| Subset SSD (unscaled) | 1.57 | 9.40 | 19.53 | 0.44 | 0.60 | 36.30 |
| Standard SSD (scaled) | 1.80 | 12.48 | 20.89 | 0.56 | 0.77 | 33.93 |
| Standard SSD (unscaled) | 1.58 | 9.55 | 17.15 | 0.49 | 0.67 | 28.08 |
| S&P 500 | 1.90 | 13.74 | 21.31 | 0.61 | 0.84 | 33.92 |
With regard to the scaling of tails, Fábián et al. (2011b); Roman et al. (2013); Valle et al. (2017) all concluded that scaled SSD tends to achieve superior out-of-sample returns, but not necessarily superior risk, when compared to unscaled SSD. The reason for this is that by scaling the tails more importance is given to the returns in the right tails of the distribution. Here we observe the same behaviour, with the scaled versions of both standard and subset SSD outperforming their unscaled versions in terms of performance (FV, CAGR). The gain in absolute performance also translates to better risk-adjusted performance (Sharpe, Sortino). As can be seen from Table 2 the unscaled formulations both show inferior performance when compared to the S&P 500.
With regards to the scaled formulations, subset SSD performed considerably better than standard SSD with sector constraints. We would remind the reader here that the main difference between the two approaches is that with subset SSD we actively try to find sector portfolios that SSD dominate their respective sector indices, as opposed to standard SSD where there is no attempt to ensure this.
Subset SSD achieved better returns (in terms of FV and CAGR) and better risk (in terms of Vol and MDD) and therefore much improved risk-adjusted performance (Sharpe, Sortino) as compared with standard SSD and too as compared with the S&P 500. Despite the Covid drop in 2020, during the entire period considered the S&P 500 had a strong positive performance (almost doubling in value). However subset SSD was able not only to outperform the S&P 500 in terms of return, but also in terms of risk.
Despite the potentially exponential number of constraints involved in the cutting plane procedures for SSD solution our experience has been that the computational effort required to solve each portfolio rebalance to optimality was negligible. In our experiments a total of 60 rebalances were needed. For the scaled subset SSD formulation the average computational time per rebalance was 0.58s, with a maximum of 1.86s and a minimum of 0.13s (median 0.54s), while for the other strategies the average computational time was between 0.3s and 0.35s and no rebalance required more than a second.
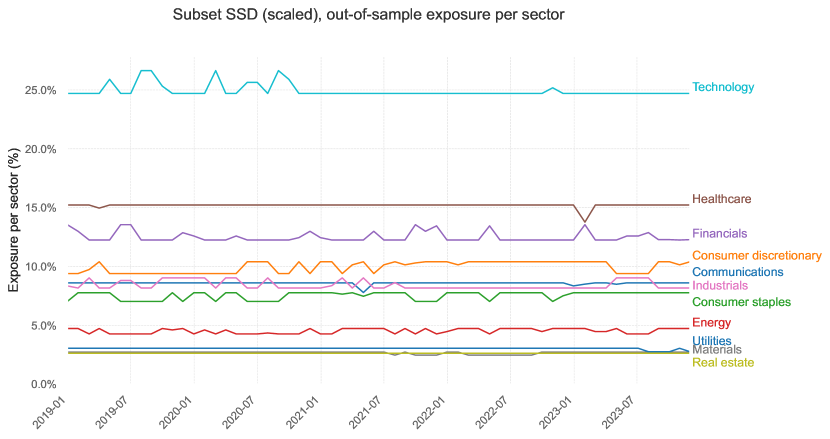
Figure 3 shows the exposure per sector for scaled subset SSD. The figure shows comparatively little variation per sector, as expected, since the strategies are limited by sector bounds to be within , here 5%, of the sector weightings in the S&P 500.
5.2 Varying sector bounds
To investigate the performance of our subset SSD approach when we varied sector bounds we performed ten different experiments. As above, in order to define sector bounds for a given sector we take its exposure from Table 1 as . Using we have and , where (as before) and limit exposure to any particular sector, as in Equation (18).
We evaluated the out-of-sample performance of both scaled subset SSD and scaled standard SSD for . The results can be seen in Table 3. In this table we have, for example for FV and scaled subset SSD, that over the ten values of considered, the mean FV value was 2.18, the median FV value was 2.13, the minimum FV value was 1.97 and the maximum FV value was 2.37.
It is clear from Table 3 that, for the data we considered, scaled subset SSD is superior to scaled standard SSD. For the four performance measures where high values are better (so FV, CAGR, Sharpe and Sortino) the minimum values for these measures for scaled subset SSD exceed the maximum values for these measures for scaled standard SSD. For the two performance measures where low values are better (so Vol and MDD) the maximum values for these measures for scaled subset SSD are below the minimum values for these measures for scaled standard SSD. In other words with regard to all six performance measures scaled subset SSD dominates scaled standard SSD.
In a similar fashion for the four performance measures where high values are better (so FV, CAGR, Sharpe and Sortino) the minimum values for these measures for scaled subset SSD exceed the values associated with the S&P 500. For the two performance measures where low values are better (so Vol and MDD) the maximum values for these measures for scaled subset SSD are below the values associated with the S&P 500. In other words with regard to all six performance measures scaled subset SSD dominates the S&P 500.
| Stats | Subset SSD (scaled) | Standard SSD (scaled) | S&P 500 | ||||||
|---|---|---|---|---|---|---|---|---|---|
| Mean | Median | Min | Max | Mean | Median | Min | Max | ||
| FV | 2.18 | 2.13 | 1.97 | 2.37 | 1.80 | 1.80 | 1.80 | 1.81 | 1.90 |
| CAGR | 16.88 | 16.32 | 14.52 | 18.90 | 12.51 | 12.51 | 12.44 | 12.59 | 13.74 |
| Vol | 18.55 | 18.57 | 18.31 | 18.74 | 20.91 | 20.91 | 20.82 | 21.02 | 21.31 |
| Sharpe | 0.81 | 0.79 | 0.70 | 0.91 | 0.56 | 0.56 | 0.56 | 0.57 | 0.61 |
| Sortino | 1.15 | 1.12 | 0.97 | 1.29 | 0.77 | 0.77 | 0.77 | 0.78 | 0.84 |
| MDD | 29.29 | 29.05 | 28.35 | 30.87 | 33.93 | 34.02 | 33.54 | 34.27 | 33.92 |
6 Conclusions
In this paper we have considered the problem of how to construct a portfolio that is designed to outperform a given market index, whilst having regard to the proportion of the portfolio invested in distinct market sectors.
We presented a new approach, subset SSD, for the problem. In our approach portfolios associated with each sector are treated in a SSD manner so that we actively try to find sector portfolios that SSD dominate their respective sector indices. The proportion of the overall portfolio invested in each sector is not pre-specified, rather it is decided via optimisation.
Computational results were given for our subset SSD approach as applied to the S&P 500 over the period August 2018 to December 2023. These indicated that the scaled version of our subset SSD approach significantly outperforms the S&P 500 over the period considered. Our approach also outperforms the standard SSD based approach to the problem.
References
- Bawa [1975] V. S. Bawa. Optimal rules for ordering uncertain prospects. Journal of Financial Economics, 2(1):95–121, 1975. doi: 10.1016/0304-405X(75)90025-2.
- Bruni et al. [2012] Renato Bruni, Francesco Cesarone, Andrea Scozzari, and Fabio Tardella. A new stochastic dominance approach to enhanced index tracking problems. Economics Bulletin, 32(4):3460–3470, 2012.
- Bruni et al. [2017] Renato Bruni, Francesco Cesarone, Andrea Scozzari, and Fabio Tardella. On exact and approximate stochastic dominance strategies for portfolio selection. European Journal of Operational Research, 259(1):322–329, 2017. doi: 10.1016/j.ejor.2016.10.006.
- Cesarone and Puerto [2024] Francesco Cesarone and Justo Puerto. New approximate stochastic dominance approaches for enhanced indexation models. https://arxiv.org/html/2401.12669v19, 2024.
- Cesarone et al. [2023] Francesco Cesarone, Raffaello Cesetti, Giuseppe Orlando, Manuel Luis Martino, and Jacopo Maria Ricci. Comparing SSD-efficient portfolios with a skewed reference distribution. Mathematics, 11(1), 2023. doi: 10.3390/math11010050.
- CPLEX Optimizer 22.1.0 [2023] CPLEX Optimizer 22.1.0. IBM. Available from https://www.ibm.com/products/ ilog-cplex-optimization-studio/cplex-optimizer/, last accessed October 17th 2023, 2023.
- Dentcheva and Ruszczynski [2003] Darinka Dentcheva and Andrzej Ruszczynski. Optimization with stochastic dominance constraints. SIAM Journal on Optimization, 14(2):548–566, 2003. doi: 10.1137/S1052623402420528.
- Dentcheva and Ruszczynski [2006] Darinka Dentcheva and Andrzej Ruszczynski. Portfolio optimization with stochastic dominance constraints. Journal of Banking & Finance, 30(2):433–451, 2006. doi: 10.1016/j.jbankfin.2005.04.024.
- Fábián et al. [2011a] C. Fábián, G. Mitra, and D. Roman. Processing second-order stochastic dominance models using cutting-plane representations. Mathematical Programming, 130(1):33–57, 2011a. doi: 10.1007/s10107-009-0326-1.
- Fábián et al. [2011b] C. Fábián, G. Mitra, D. Roman, and V. Zverovich. An enhanced model for portfolio choice with SSD criteria: a constructive approach. Quantitative Finance, 11(10):1525–1534, 2011b. doi: 10.1080/14697680903493607.
- Goel and Sharma [2021] Anubha Goel and Amita Sharma. Deviation measure in second-order stochastic dominance with an application to enhanced indexing. International Transactions in Operational Research, 28(4):2218–2247, 2021. doi: 10.1111/itor.12629.
- Hadar and Russell [1969] J. Hadar and W. Russell. Rules for ordering uncertain prospects. The American Economic Review, 59(1):25–34, 1969. doi: 10.2307/1811090.
- Hodder et al. [2015] James E Hodder, Jens Carsten Jackwerth, and Olga Kolokolova. Improved portfolio choice using second-order stochastic dominance. Review of Finance, 19(4):1623–1647, 2015. doi: 10.1093/rof/rfu025.
- Kopa and Post [2015] M. Kopa and T. Post. A general test for SSD portfolio efficiency. OR Spectrum, 37(1):703–734, 2015. doi: 10.1007/s00291-014-0373-8.
- Künzi-Bay and Mayer [2006] Alexandra Künzi-Bay and János Mayer. Computational aspects of minimizing conditional value-at-risk. Computational Management Science, 3(1):3–27, 2006. doi: 10.1007/s10287-005-0042-0.
- Kuosmanen [2001] Timo Kuosmanen. Stochastic dominance efficiency tests under diversification. https://econwpa.ub.uni-muenchen.de/econ-wp/fin/papers/0105/0105001.pdf, 2001.
- Kuosmanen [2004] Timo Kuosmanen. Efficient diversification according to stochastic dominance criteria. Management Science, 50(10):1390–1406, 2004. doi: 10.1287/mnsc.1040.0284.
- Levy [1992] Haim Levy. Stochastic dominance and expected utility: survey and analysis. Management Science, 38(4):555–593, 1992. doi: 10.1287/mnsc.38.4.555.
- Liesio et al. [2023] Juuso Liesio, Markku Kallio, and Nikolaos Argyris. Incomplete risk-preference information in portfolio decision analysis. European Journal of Operational Research, 304(3):1084–1098, FEB 1 2023. ISSN 0377-2217. doi: 10.1016/j.ejor.2022.04.043.
- Liu et al. [2021] Jia Liu, Zhiping Chen, and Giorgio Consigli. Interval-based stochastic dominance: theoretical framework and application to portfolio choices. Annals of Operations Research, 307(1):329–361, 2021. doi: 10.1007/s10479-021-04231-9.
- Lizyayev and Ruszczyński [2012] Andrey Lizyayev and Andrzej Ruszczyński. Tractable almost stochastic dominance. European Journal of Operational Research, 218(2):448–455, 2012. doi: 10.1016/j.ejor.2011.11.019.
- Luedtke [2008] James Luedtke. New formulations for optimization under stochastic dominance constraints. SIAM Journal on Optimization, 19(3):1433–1450, 2008. doi: 10.1137/070707956.
- Malavasi et al. [2021] Matteo Malavasi, Sergio Ortobelli Lozza, and Stefan Truck. Second order of stochastic dominance efficiency vs mean variance efficiency. European Journal of Operational Research, 290(3):1192–1206, MAY 1 2021. ISSN 0377-2217. doi: 10.1016/j.ejor.2020.08.051.
- Markowitz [1952] H. Markowitz. Portfolio selection. Journal of Finance, 7(1):77–91, 1952. doi: 10.1111/j.1540-6261.1952.tb01525.x.
- Ogryczak and Ruszczynski [2002] W. Ogryczak and A. Ruszczynski. Dual stochastic dominance and related mean-risk models. SIAM Journal on Optimization, 13(1):60–78, 2002. doi: 10.1137/S1052623400375075.
- Post and Kopa [2013] T. Post and M. Kopa. General linear formulations of stochastic dominance criteria. European Journal of Operational Research, 230(2):321–332, 2013. doi: 10.1016/j.ejor.2013.04.015.
- Post [2003] Thierry Post. Empirical tests for stochastic dominance efficiency. Journal of Finance, 58(5):1905–1931, 2003. doi: 10.1111/1540-6261.00592.
- Roman et al. [2006] D. Roman, K. Darby-Dowman, and G. Mitra. Portfolio construction based on stochastic dominance and target return distributions. Mathematical Programming, 108(2):541–569, 2006. doi: 10.1007/s10107-006-0722-8.
- Roman et al. [2013] D. Roman, G. Mitra, and V. Zverovich. Enhanced indexation based on second-order stochastic dominance. European Journal of Operational Research, 228(1):273–281, 2013. doi: 10.1016/j.ejor.2013.01.035.
- Sehgal and Mehra [2021] Ruchika Sehgal and Aparna Mehra. Robust reward–risk ratio portfolio optimization. International Transactions in Operational Research, 28(4):2169–2190, 2021. doi: 10.1111/itor.12652.
- Sharma and Mehra [2017] Amita Sharma and Aparna Mehra. Financial analysis based sectoral portfolio optimization under second order stochastic dominance. Annals of Operations Research, 256:171–197, 2017. doi: 10.1007/s10479-015-2095-y.
- Sharma et al. [2017] Amita Sharma, Shubhada Agrawal, and Aparna Mehra. Enhanced indexing for risk averse investors using relaxed second order stochastic dominance. Optimization and Engineering, 18(2):407–442, 2017. doi: 10.1007/s11081-016-9329-y.
- Valle et al. [2017] C. A. Valle, D. Roman, and G. Mitra. Novel approaches for portfolio construction using second order stochastic dominance. Computational Management Science, 14(2):257–280, 2017. doi: 10.1007/s10287-017-0274-9.
- Whitmore and Findlay [1978] G. A. Whitmore and M. C. Findlay. Stochastic dominance: an approach to decision-making under risk. Lexington Books, 1978.