Observational parameters of Blue Large-Amplitude Pulsators111Based on photometric observations obtained with the 1.3-m Warsaw telescope and spectroscopic data collected with the 6.5-m Magellan-Baade telescope at the Las Campanas Observatory of the Carnegie Institution for Science
Abstract
Blue Large-Amplitude Pulsators (BLAPs) are a recently discovered class of short-period pulsating variable stars. In this work, we present new information on these stars based on photometric and spectroscopic data obtained for known and new objects detected by the OGLE survey. BLAPs are evolved objects with pulsation periods in the range of 3–75 min, stretching between subdwarf B-type stars and upper main-sequence stars in the Hertzsprung-Russell diagram. In general, BLAPs are single-mode stars pulsating in the fundamental radial mode. Their phase-folded light curves are typically sawtooth shaped, but light curves of shorter-period objects are more rounded and symmetric, while many longer-period objects exhibit an additional bump. The long-term OGLE observations show that the period change rates of BLAPs are usually of the order of per year and in a quarter of the sample are negative. An exception is the triple-mode object OGLE-BLAP-030, which changes its dominant period much faster, at a rate of about per year. The spectroscopic data indicate that the BLAPs form a homogeneous group in the period, surface gravity, and effective temperature spaces. However, we observe a split into two groups in terms of helium-to-hydrogen content. The atmospheres of the He-enriched BLAPs are more abundant in metals (about five times) than the atmosphere of the Sun. We discover that the BLAPs obey a period–gravity relationship and we use the distance to OGLE-BLAP-009 to derive a period–luminosity relation. Most of the stars observed in the OGLE Galactic bulge fields seem to reside in the bulge, while the remaining objects likely are in the foreground Galactic disk.
1 Introduction
Blue Large-Amplitude Pulsators (BLAPs) form a recently discovered class of objects in the realm of variable stars. The first object was serendipitously found during a variability search of a 7-square-degree area containing 9 million stars of the Galactic disk in the direction tangent to the Carina arm (Pietrukowicz et al., 2013). The area was monitored during the third phase of the Optical Gravitational Lensing Experiment (OGLE-III, years 2001–2009, Udalski et al., 2008) in a quest for planetary transits (e.g., Udalski et al., 2002, 2004). With an amplitude of almost 0.28 mag in the band, a period of 28.25 min, and a sawtooth-shaped light curve, the star was initially classified as a pulsating variable of Scuti type. However, such a high amplitude at such a short period was very unusual for this type of pulsator. A low-resolution spectrum (Pietrukowicz et al., 2015) showed that the mysterious object is of late O type, thus it is much hotter than Scuti stars covering spectral types from A0 to F6. The estimated surface gravity was stronger than in upper main-sequence stars and weaker than in hot subdwarfs, which ruled out a possibility that it is a Cephei variable or an oscillating hot subdwarf.
The detection of thirteen variable stars with very similar photometric properties in the OGLE Galactic bulge fields and the results from the analysis of spectra obtained for several objects allowed Pietrukowicz et al. (2017) to introduce the new class of variable stars. The following characteristics of the stars gave name to the class, the Blue Large-Amplitude Pulsators (BLAPs): (1) location blueward of the main sequence in the color-magnitude diagram, (2) exceptionally large amplitudes in optical passbands for such hot objects, and (3) the proof of the pulsation nature for the observed brightness variations (color and effective temperature changes over the cycle). The published variables have amplitudes between 0.19 and 0.36 mag in the Cousins band (0.22–0.43 mag in the Johnson band) and pulsation periods between 22 and 40 min. All objects but the prototype, OGLE-BLAP-001, seemed to be single-mode pulsators. Long-term OGLE data showed that the detected variables are stable over time with period change rates of the order of several times yr-1. In most cases, the changes are positive. Information obtained from spectroscopy supported the view of BLAPs as a very uniform group of stars, with surface gravity in the range of 4.2–4.6 (where is in the units of cm s-2), effective temperature from about 26,000 to 32,000 K, and a helium-to-hydrogen ratio from to dex.
In the following years, new BLAPs were discovered. Four variables with much shorter periods than in the original pulsators, between 3 and 8 min, were found in high-cadence data from the Zwicky Transient Facility (ZTF; Bellm et al., 2019) by Kupfer et al. (2019). Phase-folded light curves of these variables are more symmetric than of the original BLAPs. Their amplitudes reach 0.30 mag in the ZTF- filter. Dedicated spectroscopic observations showed that the surface gravity of the stars is about an order of magnitude stronger ( between 5.2 and 5.7 dex). Therefore, the objects were named high-gravity BLAPs. They are on average slightly hotter ( from 31,400 to 34,000 K) than the original pulsators and their helium abundance turned out to be much lower ( between and dex).
Recently, a detection of 22 candidates for BLAPs, including six high-gravity pulsators, has been reported by McWhirter & Lam (2022). The stars were found by combining photometric measurements from Gaia space mission (Gaia Collaboration et al., 2018) with time-series data from ZTF. Their periods range from about 2.4 to 55 min. Seven of the candidates are located at Galactic latitudes higher than , while for three of them . One of the objects, ZGP-BLAP-01 with a pulsation period of 18.93 min, also known as TMTS-BLAP-1, has been found to have an unusually large period change rate of yr-1 (Lin et al., 2023). Based on data from the OmegaWhite survey (Macfarlane et al., 2015), Ramsay et al. (2022) identified four BLAPs toward the bulge, one of which was already known. The periods of these stars are between 10 and 33 min. Very recently, a discovery of a new low-gravity BLAP in the data from SkyMapper Southern Sky Survey has been announced by Chang et al. (2024).
Finally, the first two BLAPs in binary systems have been found. Pigulski et al. (2022) discovered a 32.37-min pulsator that orbits a main-sequence B-type star every 23.08 days. Interestingly, the system (HD 133729) is located at a moderately high Galactic latitude of almost . The previously mentioned object TMTS-BLAP-1 probably forms a wide binary of an orbital period of 1576 days (Lin et al., 2023). The number of known BLAPs has increased by 20 new objects discovered in the OGLE Galactic disk fields (Borowicz et al., 2023). At the moment of writing (January 2024), the total number of BLAPs exceeds 80 (if we include the stars reported in this work).
Since the discovery of the first BLAPs, several theoretical attempts have been undertaken to explain the nature and evolutionary status of these stars. It was already known that such large-amplitude oscillations may occur in stars with inflated envelopes or giant-like structure (Dziembowski, 1977). BLAPs are thought to pulsate through the -mechanism due to the presence of an enhanced amount of iron-group elements in the outer layers (the so called Z-bump in the opacity). Sufficient accumulation of iron and nickel around the opacity maximum at a temperature of about K is possible thanks to atomic diffusion and radiative levitation (Byrne & Jeffery, 2018, 2020).
Three stellar structure models have been proposed in the literature. In the first model, BLAPs are low-mass ( ) helium-core, shell hydrogen-burning pre-white dwarfs (pre-WDs) approaching the white dwarf cooling track (Córsico et al., 2018; Romero et al., 2018). Another possibility is that the stars are core helium-burning post giants evolving toward the extended horizontal branch (Byrne & Jeffery, 2018; Wu & Li, 2018). In the third model, BLAPs are in a phase of stable shell helium-burning on the surface of the CO core when the star evolves off the extended horizontal branch (Kupfer et al., 2019; Lin et al., 2023). The latter two models imply more massive stars ( ).
The formation of BLAPs is still a mystery. To create such a structure, the star needs to be stripped of its hydrogen-rich envelope after the helium core has formed. It is possible through mass transfer and/or common envelope ejection in binary system evolution (Byrne et al., 2021). Meng et al. (2020) proposed that BLAPs could be the surviving companions of single-degenerate Type Ia supernovae. In their original paper, Pietrukowicz et al. (2017) suggested that a significant mass loss could take place during the encounter of the star with the Milky Way’s central supermassive black hole. A lack of observed BLAPs in the Magellanic Clouds (Pietrukowicz, 2018) would support this hypothesis.
In this paper, we present new data on BLAPs that will help to understand the nature and origin of these stars. We report the detection of 23 additional stars in the OGLE-IV inner Galactic bulge area, six of which are in the period range of 14–20 min. For some of the stars, we obtained moderate-resolution spectra. We show that the high-gravity BLAPs and the original BLAPs form a single class of pulsators. We announce the discovery of a period–gravity relationship for BLAPs, the first such relation for Z-bump pulsators.
Our paper is organized as follows. We describe the photometric and spectroscopic data in Sec. 2. Sec. 3 is devoted to the analysis of the data. In the broad Sec. 4, we present the photometric properties of BLAPs, including information on multimodality and period changes. We also derive the atmospheric parameters of the metal composition of a handful of BLAPs. Further, we announce the discovery of the period-gravity relation and we derive the first period-luminosity relation for BLAPs. At the end of this section, we focus on the kinematics and location of these stars in the Milky Way. Finally, we discuss and summarize our results in Sec. 5 and Sec. 6, respectively.
2 Data
2.1 Photometric data
The photometric data presented in this paper were obtained by the Optical Gravitational Lensing Experiment. OGLE is a long-term survey conducted with the 1.3-m Warsaw telescope at the Las Campanas Observatory, Chile222The observatory is operated by the Carnegie Institution for Science.. The survey started in 1992, with the primary goal to detect microlensing events through monitoring of dense stellar fields. Over years 1992–1995, OGLE observed a 0.9-square-degree region around the Baade’s Window toward the Galactic bulge. A larger bulge area covering 11 square degrees was monitored during the second phase in years 1997–2000 (OGLE-II, Udalski et al., 1997). In that phase, regular observations of the Magellanic Clouds began. The third phase started with the installation of an 8-detector mosaic camera, which allowed the project to increase the surveyed area again. During OGLE-III (Udalski et al., 2008), conducted between June 2001 and May 2009, the bulge coverage reached about 69 square degrees. The fourth phase (OGLE-IV, Udalski et al., 2015) was launched in March 2010 and continues to the present except for a break due to the Covid-19 pandemic, when regular observations were stopped for 29 months, between March 2020 and August 2022. The OGLE-IV camera is a 32-detector mosaic covering a field of view of 1.4 square degrees. Currently, the survey monitors up to 3,600 square degrees of the sky including the Magellanic System and the entire Milky Way stripe visible from the Las Campanas Observatory. Images are collected mainly through the filter. To secure color information, additional images are taken through the filter. The data is reduced with the Difference Image Analysis (Wozniak, 2000), a method developed especially for dense stellar fields. Regular, precise, long-term brightness measurements by the OGLE survey have led to the discovery and unambiguous classification of over one million variable objects including transient, irregular, and periodic sources of various types (e.g., Mróz et al., 2015; Soszyński et al., 2016; Iwanek et al., 2019; Soszyński et al., 2019; Wrona et al., 2022).
2.2 Spectroscopic data
The spectroscopic follow-up data were obtained with MagE, a moderate-resolution echelle spectrograph attached to the 6.5-m Magellan-Baade telescope located at the Las Campanas Observatory. The spectrograph covers a wavelength range from about 3,200 Å to 10,000 Å. Observations were collected over three nights: on 2018 May 19/20 and 2019 May 31/June 1 under Chilean telescope time (programs CN2018A-102 and CN2019A-13, respectively) for eleven objects toward the Galactic bulge presented in this work, and on 2023 July 30/31 during telescope engineering time for three recently discovered objects in the Galactic disk (Borowicz et al., 2023). During the observations the seeing varied between 05 and 07. We used a slit width of 10 which provided a resolving power of 4,100 or spectral resolution of about 1.0 Å at 5,000 Å. For all but one object, two subsequent single spectra were taken, each exposed for half of the pulsation cycle. Experimentally, in the case of OGLE-BLAP-033, we took four exposures, each covering a quarter of the cycle. The science exposures were followed by an exposure of the calibration lamp. All the spectra were reduced using the IRAF package333IRAF was distributed by the National Optical Astronomy Observatory, USA, which is operated by the Association of Universities for Research in Astronomy, Inc., under a cooperative agreement with the National Science Foundation. (Tody, 1986, 1993). Debiasing, flat-fielding, and wavelength calibrations were performed in the standard way. For the wavelength calibrations, the Th-Ar lamp was used. In this paper, we also refer to the results of spectroscopic observations of the prototype object from the Galactic disk, OGLE-BLAP-001, taken with MagE on the night of 2016 April 22 using the same strategy (two science spectra followed by the calibration lamp). Thus, our spectroscopic sample includes 15 OGLE BLAPs observed with the MagE spectrograph. Eleven of them are from the Galactic bulge fields (this work), while the remaining four stars are from the Galactic disk fields (Pietrukowicz et al., 2017; Borowicz et al., 2023). All the spectra are presented in normalized flux.
| Name | RA(2000.0) | Dec(2000.0) | Remarks | ||||||||
|---|---|---|---|---|---|---|---|---|---|---|---|
| [h:m:s] | [:’:”] | [] | [] | [mag] | [mag] | [mag] | [mag] | [min] | [ yr-1] | ||
| OGLE-BLAP-001 | 10:41:48.77 | :25:08.5 | 288.06355 | 17.223 | 17.706 | 0.236 | 0.411 | 28.255 | triplet | ||
| OGLE-BLAP-002 | 17:43:58.02 | :16:54.1 | 8.05922 | 17.951 | 18.893 | 0.357 | 0.33 | 23.286 | |||
| OGLE-BLAP-003 | 17:44:51.48 | :10:04.0 | 3.98204 | 18.111 | 19.170 | 0.235 | 0.266 | 28.458 | |||
| OGLE-BLAP-004 | 17:51:04.72 | :09:03.4 | 6.44968 | 17.534 | 18.861 | 0.259 | 0.429 | 22.357 | |||
| OGLE-BLAP-005 | 17:52:18.73 | :56:35.0 | 358.16325 | 18.818 | 20.000 | 0.302 | 0.332 | 27.253 | |||
| OGLE-BLAP-006 | 17:55:02.88 | :50:37.5 | 0.27313 | 17.398 | 18.349 | 0.308 | 0.358 | 38.015 | |||
| OGLE-BLAP-007 | 17:55:57.52 | :52:11.0 | 1.21533 | 18.455 | 19.276 | 0.284 | 0.296 | 35.182 | |||
| OGLE-BLAP-008 | 17:56:48.26 | :21:35.6 | 358.28172 | 17.598 | 18.732 | 0.174 | 0.271 | 34.481 | |||
| OGLE-BLAP-009 | 17:58:48.20 | :16:53.7 | 2.90511 | 15.070 | 15.639 | 0.242 | 0.275 | 31.935 | dip | ||
| OGLE-BLAP-010 | 17:58:59.22 | :18:07.0 | 355.94188 | 16.924 | 17.260 | 0.343 | 0.383 | 32.133 | |||
| OGLE-BLAP-011 | 18:00:23.24 | :58:03.1 | 355.49826 | 16.977 | 17.260 | 0.286 | 0.23 | 34.875 | |||
| OGLE-BLAP-012 | 18:05:44.20 | :11:15.2 | 1.11870 | 17.625 | 18.251 | 0.341 | 0.353 | 30.897 | |||
| OGLE-BLAP-013 | 18:05:52.70 | :48:18.0 | 4.09671 | 18.194 | 19.251 | 0.228 | 0.236 | 39.326 | |||
| OGLE-BLAP-014 | 18:12:41.79 | :12:07.8 | 0.94058 | 16.682 | 16.788 | 0.265 | 0.342 | 33.623 | |||
| OGLE-BLAP-015 | 17:39:58.35 | :37:22.5 | 4.71127 | 16.602 | 17.525 | 0.159 | 0.206 | 43.073 | bump | ||
| OGLE-BLAP-016 | 17:47:41.33 | :14:27.1 | 354.83143 | 18.511 | 19.024 | 0.260 | 0.265 | 16.548 | |||
| OGLE-BLAP-017 | 17:48:01.46 | :20:43.2 | 6.77880 | 17.508 | 18.720 | 0.149 | 0.192 | 25.535 | |||
| OGLE-BLAP-018 | 17:49:44.57 | :54:31.7 | 355.33301 | 18.223 | 18.510 | 0.179 | 0.193 | 14.022 | |||
| OGLE-BLAP-019 | 17:53:34.39 | :02:11.6 | 359.94513 | 17.196 | 18.386 | 0.191 | 0.227 | 48.005 | bump | ||
| OGLE-BLAP-020 | 17:56:32.05 | :37:15.7 | 8.41333 | 17.341 | 18.618 | 0.225 | 0.348 | 47.923 | bump | ||
| OGLE-BLAP-021 | 17:58:30.23 | :38:09.2 | 0.82920 | 17.265 | 17.950 | 0.261 | 0.306 | 42.742 | |||
| OGLE-BLAP-022 | 17:58:51.29 | :28:53.3 | 1.86967 | 17.007 | 18.041 | 0.087 | 0.107 | 74.052 | bump | ||
| OGLE-BLAP-023 | 17:58:57.27 | :33:41.5 | 354.83492 | 17.807 | 17.952 | 0.20 | 0.20 | 19.196 | |||
| OGLE-BLAP-024 | 17:59:43.70 | :44:26.4 | 1.73988 | 16.418 | 17.167 | 0.124 | 0.186 | 48.268 | |||
| OGLE-BLAP-025 | 17:59:47.33 | :07:07.6 | 357.93256 | 16.886 | 17.744 | 0.182 | 0.227 | 47.724 | bump | ||
| OGLE-BLAP-026 | 18:00:12.90 | :34:22.2 | 2.80805 | 17.662 | 18.664 | 0.209 | 0.246 | 41.250 | bump | ||
| OGLE-BLAP-027 | 18:00:30.66 | :36:25.1 | 2.81090 | 17.328 | 19.011 | 0.119 | 0.167 | 48.018 | |||
| OGLE-BLAP-028 | 18:02:38.90 | :25:44.2 | 359.70732 | 17.987 | 18.644 | 0.177 | 0.204 | 16.965 | |||
| OGLE-BLAP-029 | 18:04:12.05 | :02:54.9 | 2.82788 | 17.214 | 17.931 | 0.113 | 0.124 | 51.008 | |||
| OGLE-BLAP-030 | 18:04:57.10 | :08:06.2 | 2.83324 | 17.477 | 17.954 | 0.174 | 0.220 | 21.162 | triplemode | ||
| OGLE-BLAP-031 | 18:05:56.03 | :53:55.5 | 356.10354 | 17.170 | 17.203 | 0.31 | 0.18 | 40.671 | |||
| OGLE-BLAP-032 | 18:06:28.93 | :31:10.4 | 4.41210 | 17.467 | 18.560 | 0.152 | 0.168 | 55.968 | |||
| OGLE-BLAP-033 | 18:07:31.70 | :58:20.8 | 3.25208 | 18.300 | 18.907 | 0.301 | 0.349 | 15.822 | |||
| OGLE-BLAP-034 | 18:07:50.55 | :04:47.6 | 1.43366 | 17.005 | 17.696 | 0.130 | 0.185 | 44.335 | bump | ||
| OGLE-BLAP-035 | 18:10:38.58 | :16:08.6 | 5.96101 | 18.135 | 19.122 | 0.157 | 0.191 | 28.975 | |||
| OGLE-BLAP-036 | 18:10:45.47 | :28:21.0 | 359.61805 | 16.199 | 16.539 | 0.120 | 0.145 | 54.289 | bump | ||
| OGLE-BLAP-037 | 18:19:20.89 | :29:56.3 | 4.91343 | 16.909 | 17.207 | 0.149 | 0.174 | 15.712 |
3 Analysis
3.1 Photometric data
BLAPs reported in this work were found as the result of a search for short-period ( h) variable objects in the OGLE-IV fields for the inner Galactic bulge. The search was conducted using time-series -band data covering seasons444Each bulge season starts in February and ends in October. 2010–2015 with the help of the FNPEAKS code555http://helas.astro.uni.wroc.pl/deliverables.php?lang=en&active=fnpeaks. It calculates Fourier amplitude spectra of unequally spaced data composed of a large number of points. The code substantially reduces the computation time for a discreet Fourier transform by co-adding correctly phased, low-resolution Fourier transforms of pieces of the large data set interpolated to high resolution. About 400 million stellar sources were inspected. The number of -band measurements taken in the years 2010–2015 was between about 200 and 13,000 per object, depending on the field. In the investigated period range ( h), any daily or seasonal aliases could not hamper the detection of real pulsators. In further work, we analyze time-series data from all OGLE-IV seasons before the pandemic (years 2010–2019) and also data from previous OGLE phases if available.
To study the photometric behavior of short-period variables like BLAPs, we converted moments of the brightness measurements from the heliocentric Julian date (HJD) to the barycentric Julian date (BJDTDB). Accurate pulsation periods and their errors were determined with the help of the TATRY code (Schwarzenberg-Czerny, 1996). The code employs periodic orthogonal polynomials to fit the data and the analysis of variance statistics to evaluate the quality of the fit. We removed evident outlying points in the phased light curves and corrected the periods. In the detected BLAPs, we look for possible multimodality and calculate period derivatives. Additional periodic signals were searched for after prewhitening of the phased light curves.
The analysis of the first BLAPs showed that the stars are characterized by slow period changes. Here, we investigate the changes based on a larger sample of objects and a longer time baseline. That includes more recently collected measurements from OGLE-IV and also data from previous OGLE phases. For fast period-changing objects, we determine pulsation periods for each OGLE-IV season separately to follow the changes on shorter time scales.
We note that the uncertainties of single brightness measurements are of about 0.003 mag at mag, about 0.007 mag at mag, about 0.03 mag at mag, and they reach 0.15 mag for stars with mag. We determine peak-to-peak amplitudes by finding the best Fourier fit to the phased light curve. Noise limits for periodic signals and amplitude uncertainties are of the order mentioned above.
3.2 Spectroscopic data
The atmospheric parameters for the 14 new BLAPs observed with the MagE spectrograph were derived in the same way as for the prototype star OGLE-BLAP-001 (Pietrukowicz et al., 2017). A grid of line-blanketed, non-LTE model atmospheres and synthetic spectra computed with the TLUSTY and SYNSPEC codes (Hubeny & Lanz, 2011a, b) was used to simultaneously fit the hydrogen and helium lines visible in the observed spectra (Brassard et al., 2010). This way, we derive the effective temperature (), surface gravity (), and helium abundance (). For each star, we analyzed the combined spectra, meaning that for each star the individual exposures were co-added. Thus we fit the “average” spectrum over one pulsation cycle. The uncertainties obtained for the atmospheric parameters are the formal errors returned by the fitting procedure and are only representative of the quality of the fit. As shown in Pietrukowicz et al. (2017) for the prototype, the atmospheric parameters vary during the pulsation cycle. The changes in can be of 5,000 K and of dex in (Bradshaw et al., 2024). The uncertainties quoted on the atmospheric parameters must be considered as minimum values. The radial velocity (RV, ) is also derived for each spectral line as part of the fitting procedure. We then compute the average RV (and standard deviation) obtained from a subset of lines that are well reproduced by the best fit. As for the atmospheric parameters, the RV of the spectral lines varies during the pulsation cycle, as a consequence of the expansion and contraction of the stellar atmosphere. The bluer lines are less affected by the RV variations which is why we used only the RV of the lines blueward than He i 5015 to compute the average RV of each star. Depending on the star, the average RV was computed from three to eight lines.
4 Results
4.1 Photometric properties
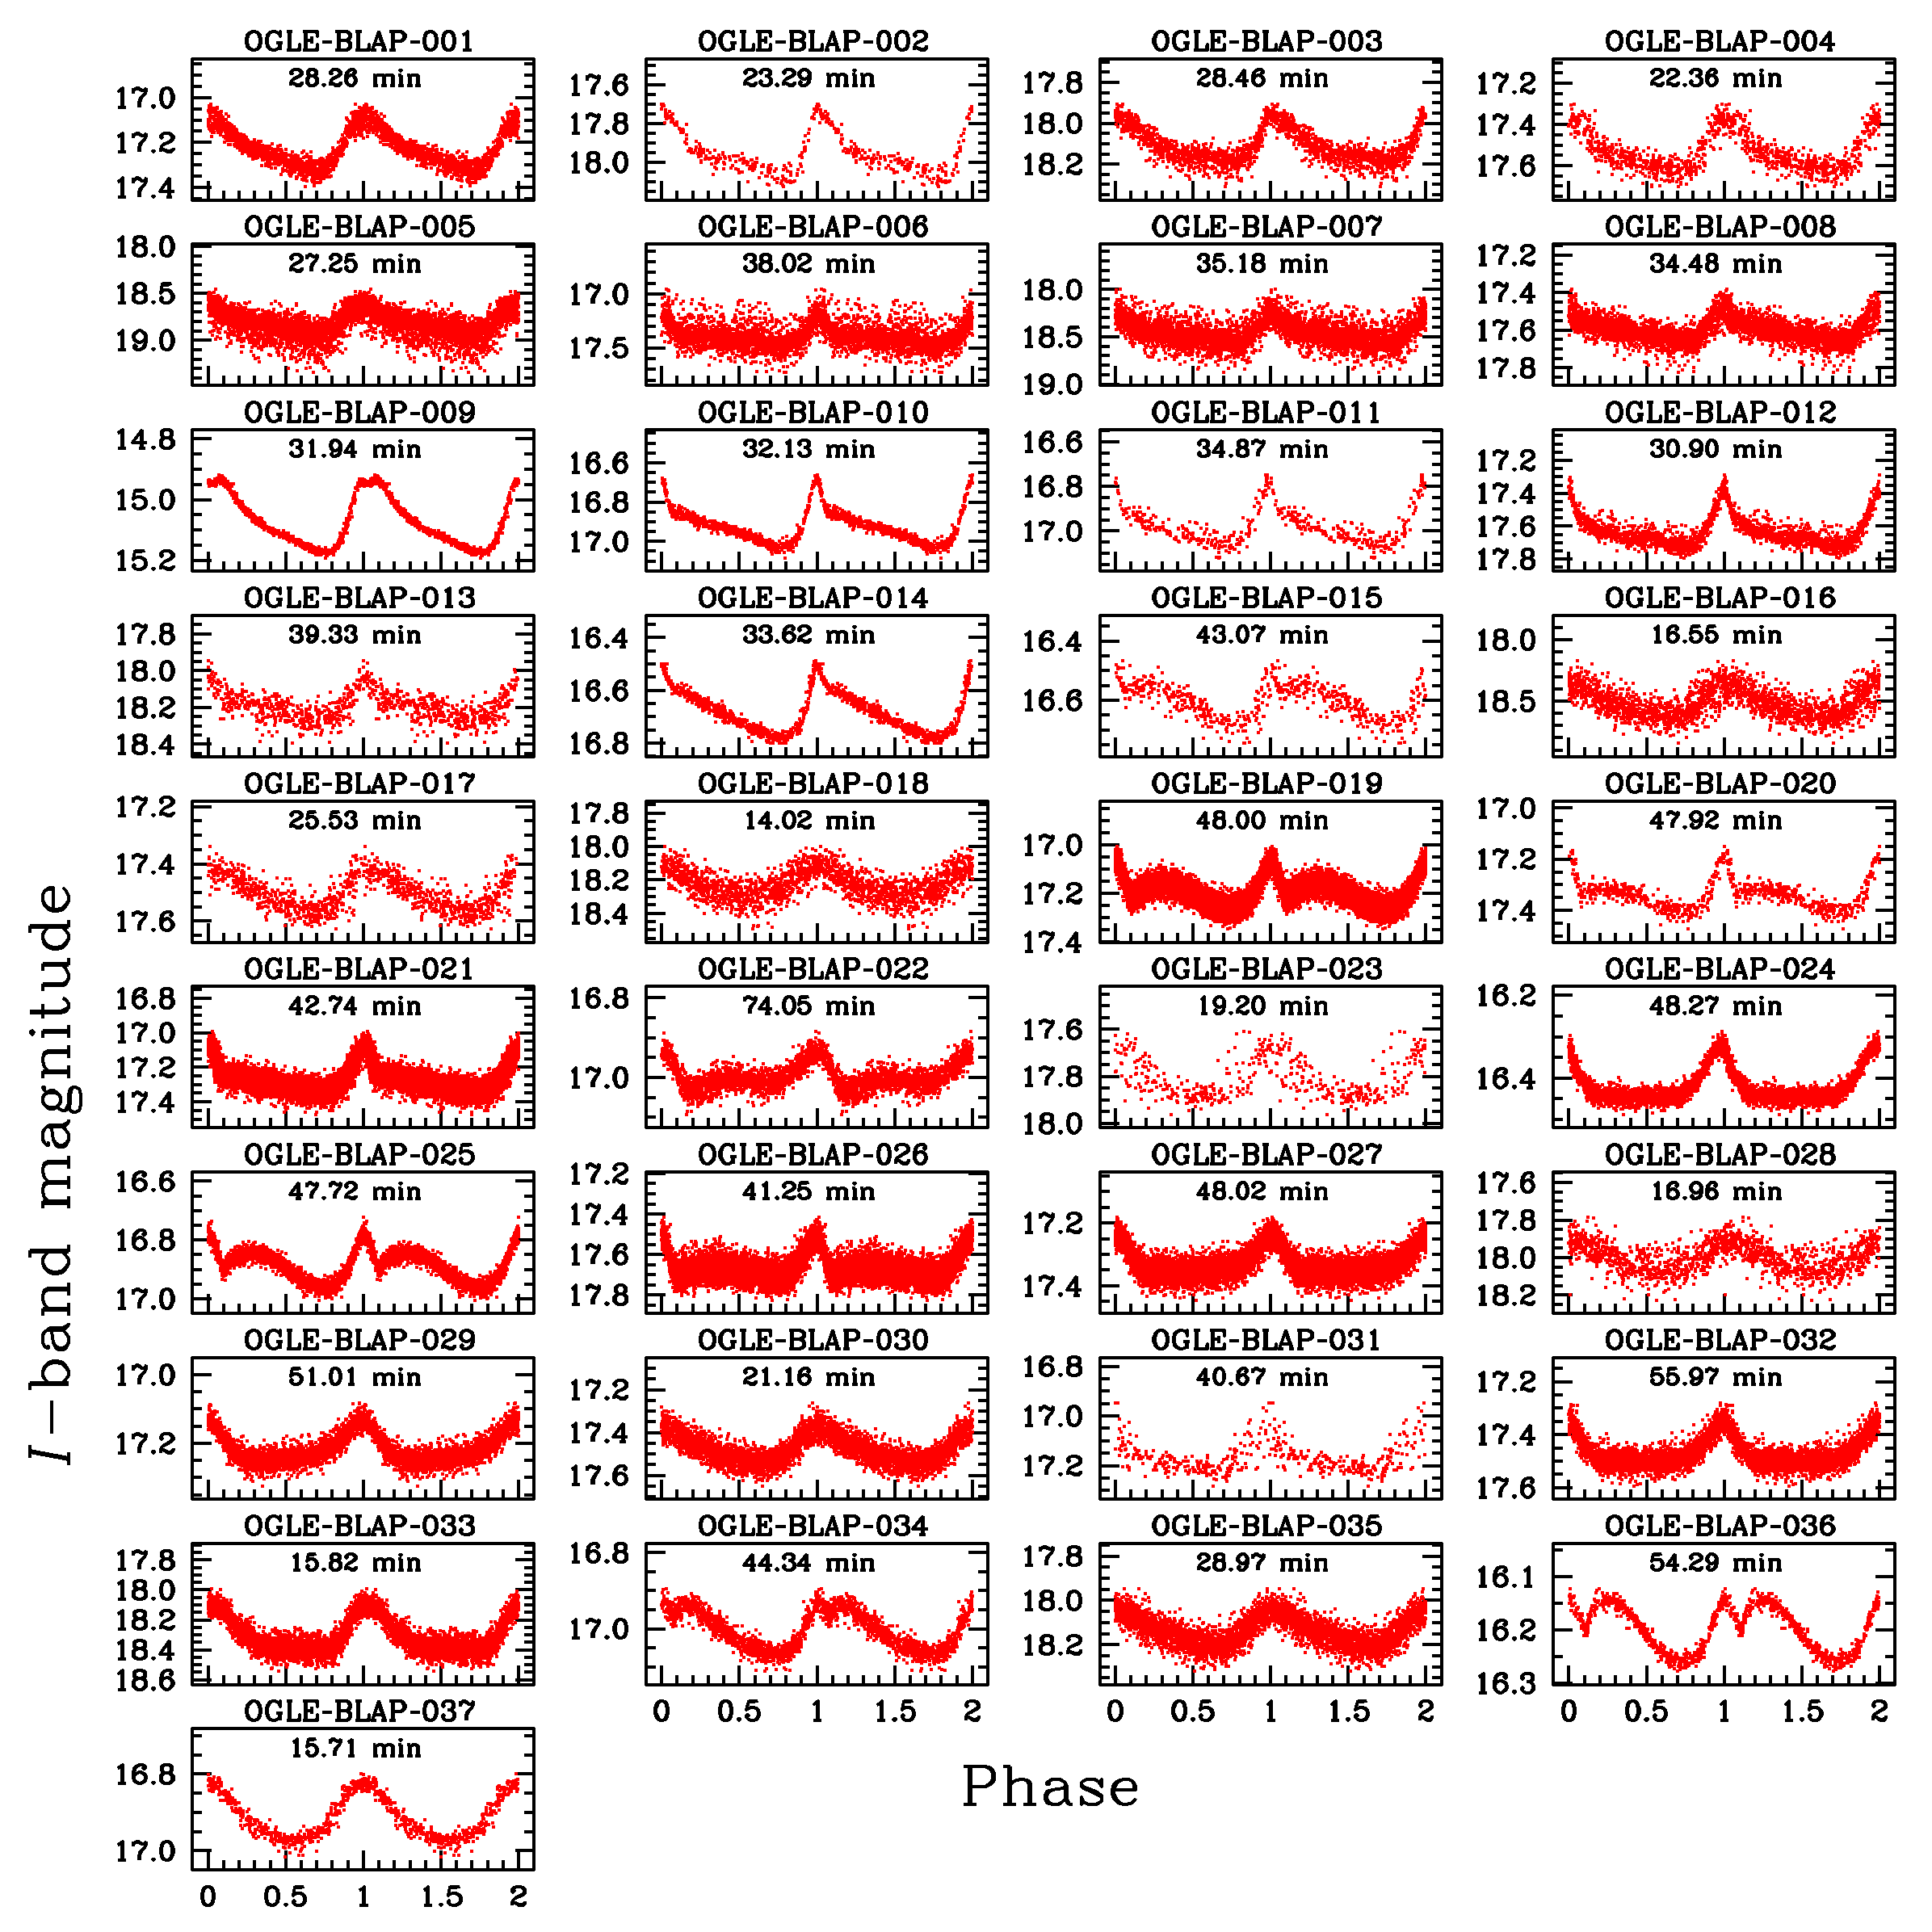
The first 14 discovered BLAPs were characterized by amplitudes in the range of 0.2–0.4 mag, pulsation periods between 20 and 40 min, and RRab-like light curve shapes (Pietrukowicz et al., 2017). Our search for short-period variables in the OGLE-IV fields, covering 172 deg2 of the inner Galactic bulge, led to the detection of 23 objects having more or less similar photometric properties. The spectroscopic follow-up observations clearly show that all the objects belong to the same group of stars, i.e., Blue Large-Amplitude Pulsators, but with a broader range of parameters and a larger variety of light curve shapes (see Sec. 4.3). In Fig. 1, we present the phase-folded -band light curves of the prototype object OGLE-BLAP-001 and all BLAPs from the Galactic bulge fields. Six new pulsators have pulsation periods below 20 min. They have nearly symmetric light curves with less sharp maxima than objects with min. Roughly half of the BLAPs with a period longer than 40 min exhibit an additional bump in the light curve, which is also observed in two well-known extreme helium stars, BX Cir ( h) and V652 Her ( h; Kilkenny et al., 1999). The bump has a sinusoidal shape with the maximum usually fainter than the main sharp peak. In the whole sample, object OGLE-BLAP-022 has the longest period (74.05 min) and the smallest amplitude (0.087 mag in ). This object also shows a reverse light curve in comparison to the other stars with a bump. In the light curve of object OGLE-BLAP-031, there is an unusually large scatter around the maximum. Nevertheless, our spectroscopic data indicate that both stars are true BLAPs (see Sec. 4.3). From the light curves presented in Fig. 1, we removed evident outlying data points. In the case of several stars in frequently monitored OGLE fields, for transparency, we show only measurements collected during one selected season (from 2013). This includes object OGLE-BLAP-030 which experiences fast period and amplitude changes (investigated in Sect. 4.2). We note that changes are also seen in the light curve of OGLE-BLAP-023. In 1, we show all available data for this object from years 2010–2014.
We note that additional periodic signals were detected only in two objects: OGLE-BLAP-001 and OGLE-BLAP-030. Hence, a significant majority of BLAPs seem to be single-mode pulsators. However, we cannot rule out a possibility that there are additional modes of very low amplitude ( mag), practically undetectable from the ground. The presented light curves of the two multi-mode BLAPs are phased with their dominant periods.
In Table LABEL:tab:photo, we provide information on the 37 BLAPs obtained from the OGLE photometry. The 23 new objects are ordered with the increasing right ascension and added to the 14 original variables of this type. We continue naming the variables in the format OGLE-BLAP-NNN, where NNN is a consecutive number. Besides the equatorial and galactic coordinates, mean magnitudes and amplitudes in the and bands, and pulsation period. We also provide the rate of period change () and information on multimodality and the presence of a bump or dip in the light curve (see Sec. 4.2).
BLAPs are relatively faint objects. In our set of 37 pulsators, none of the stars is brighter than mag and only three stars have mag. The measured amplitudes of BLAPs are in the range 0.08–0.36 mag in the band and 0.10–0.43 mag in the band. The median value of the -band to -band amplitude ratio is about 1.2, which is consistent with the pulsation nature of the stars.
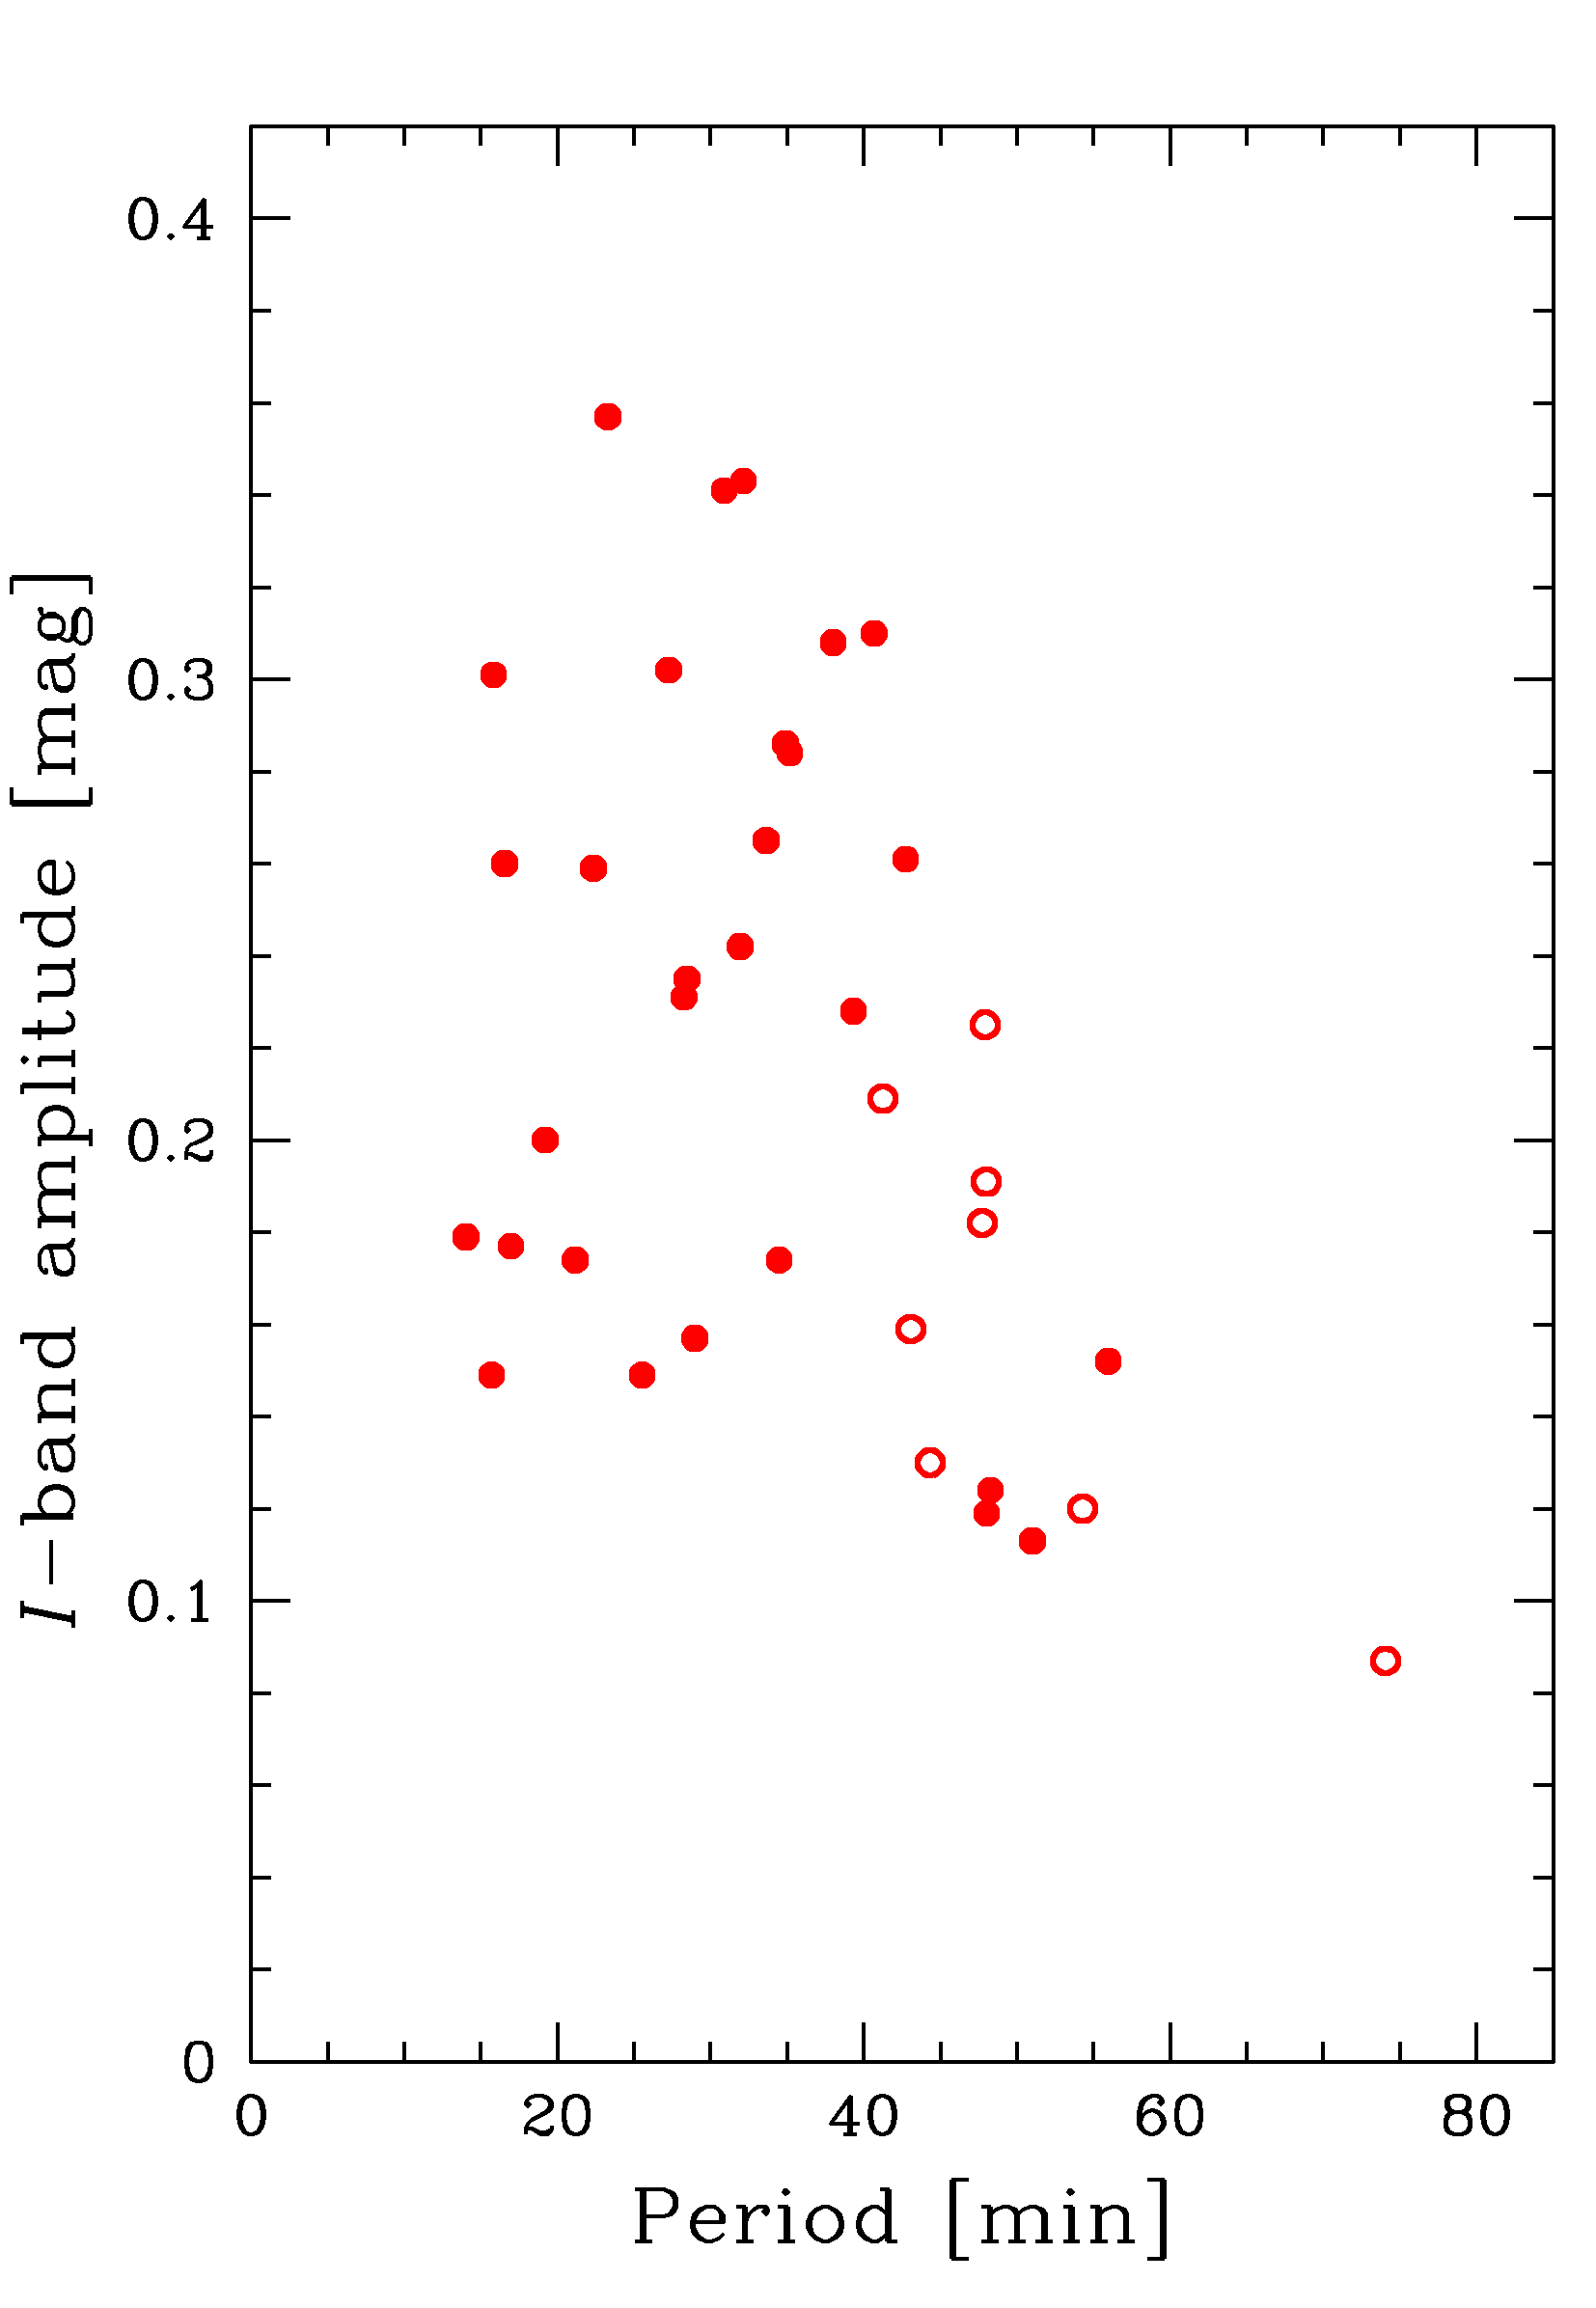
The pulsation periods of the investigated BLAPs are between 14 and 74 min. In Fig. 2, we show a period-amplitude diagram for the -band data. BLAPs with periods longer than 50 min have amplitudes below 0.2 mag. We mark the position of the eight stars with a bump in their light curve. Two of these stars have amplitudes above 0.2 mag.
4.2 Multimodality and period changes
Two BLAPs show more than one periodicity, namely objects OGLE-BLAP-001 and OGLE-BLAP-030. The former object, being the prototype of the whole class, was discovered in the OGLE-III data collected in years 2005–2006 (Pietrukowicz et al., 2013). The photometry revealed the presence of three periodic signals forming a symmetric triplet in the frequency space, with peaks at 49.06155(14), 50.96440(1), and 52.86723(13) cycles per day, separated from each other by about 1.9028 c/d. Hence, the dominant period is min, while the two additional periodicities are min and min. Such a triplet is present only in this object. OGLE-BLAP-001 was observed more recently in the fourth phase of OGLE (in years 2013–2020), but shallower and less frequent observations did not allow us to detect the side frequencies.
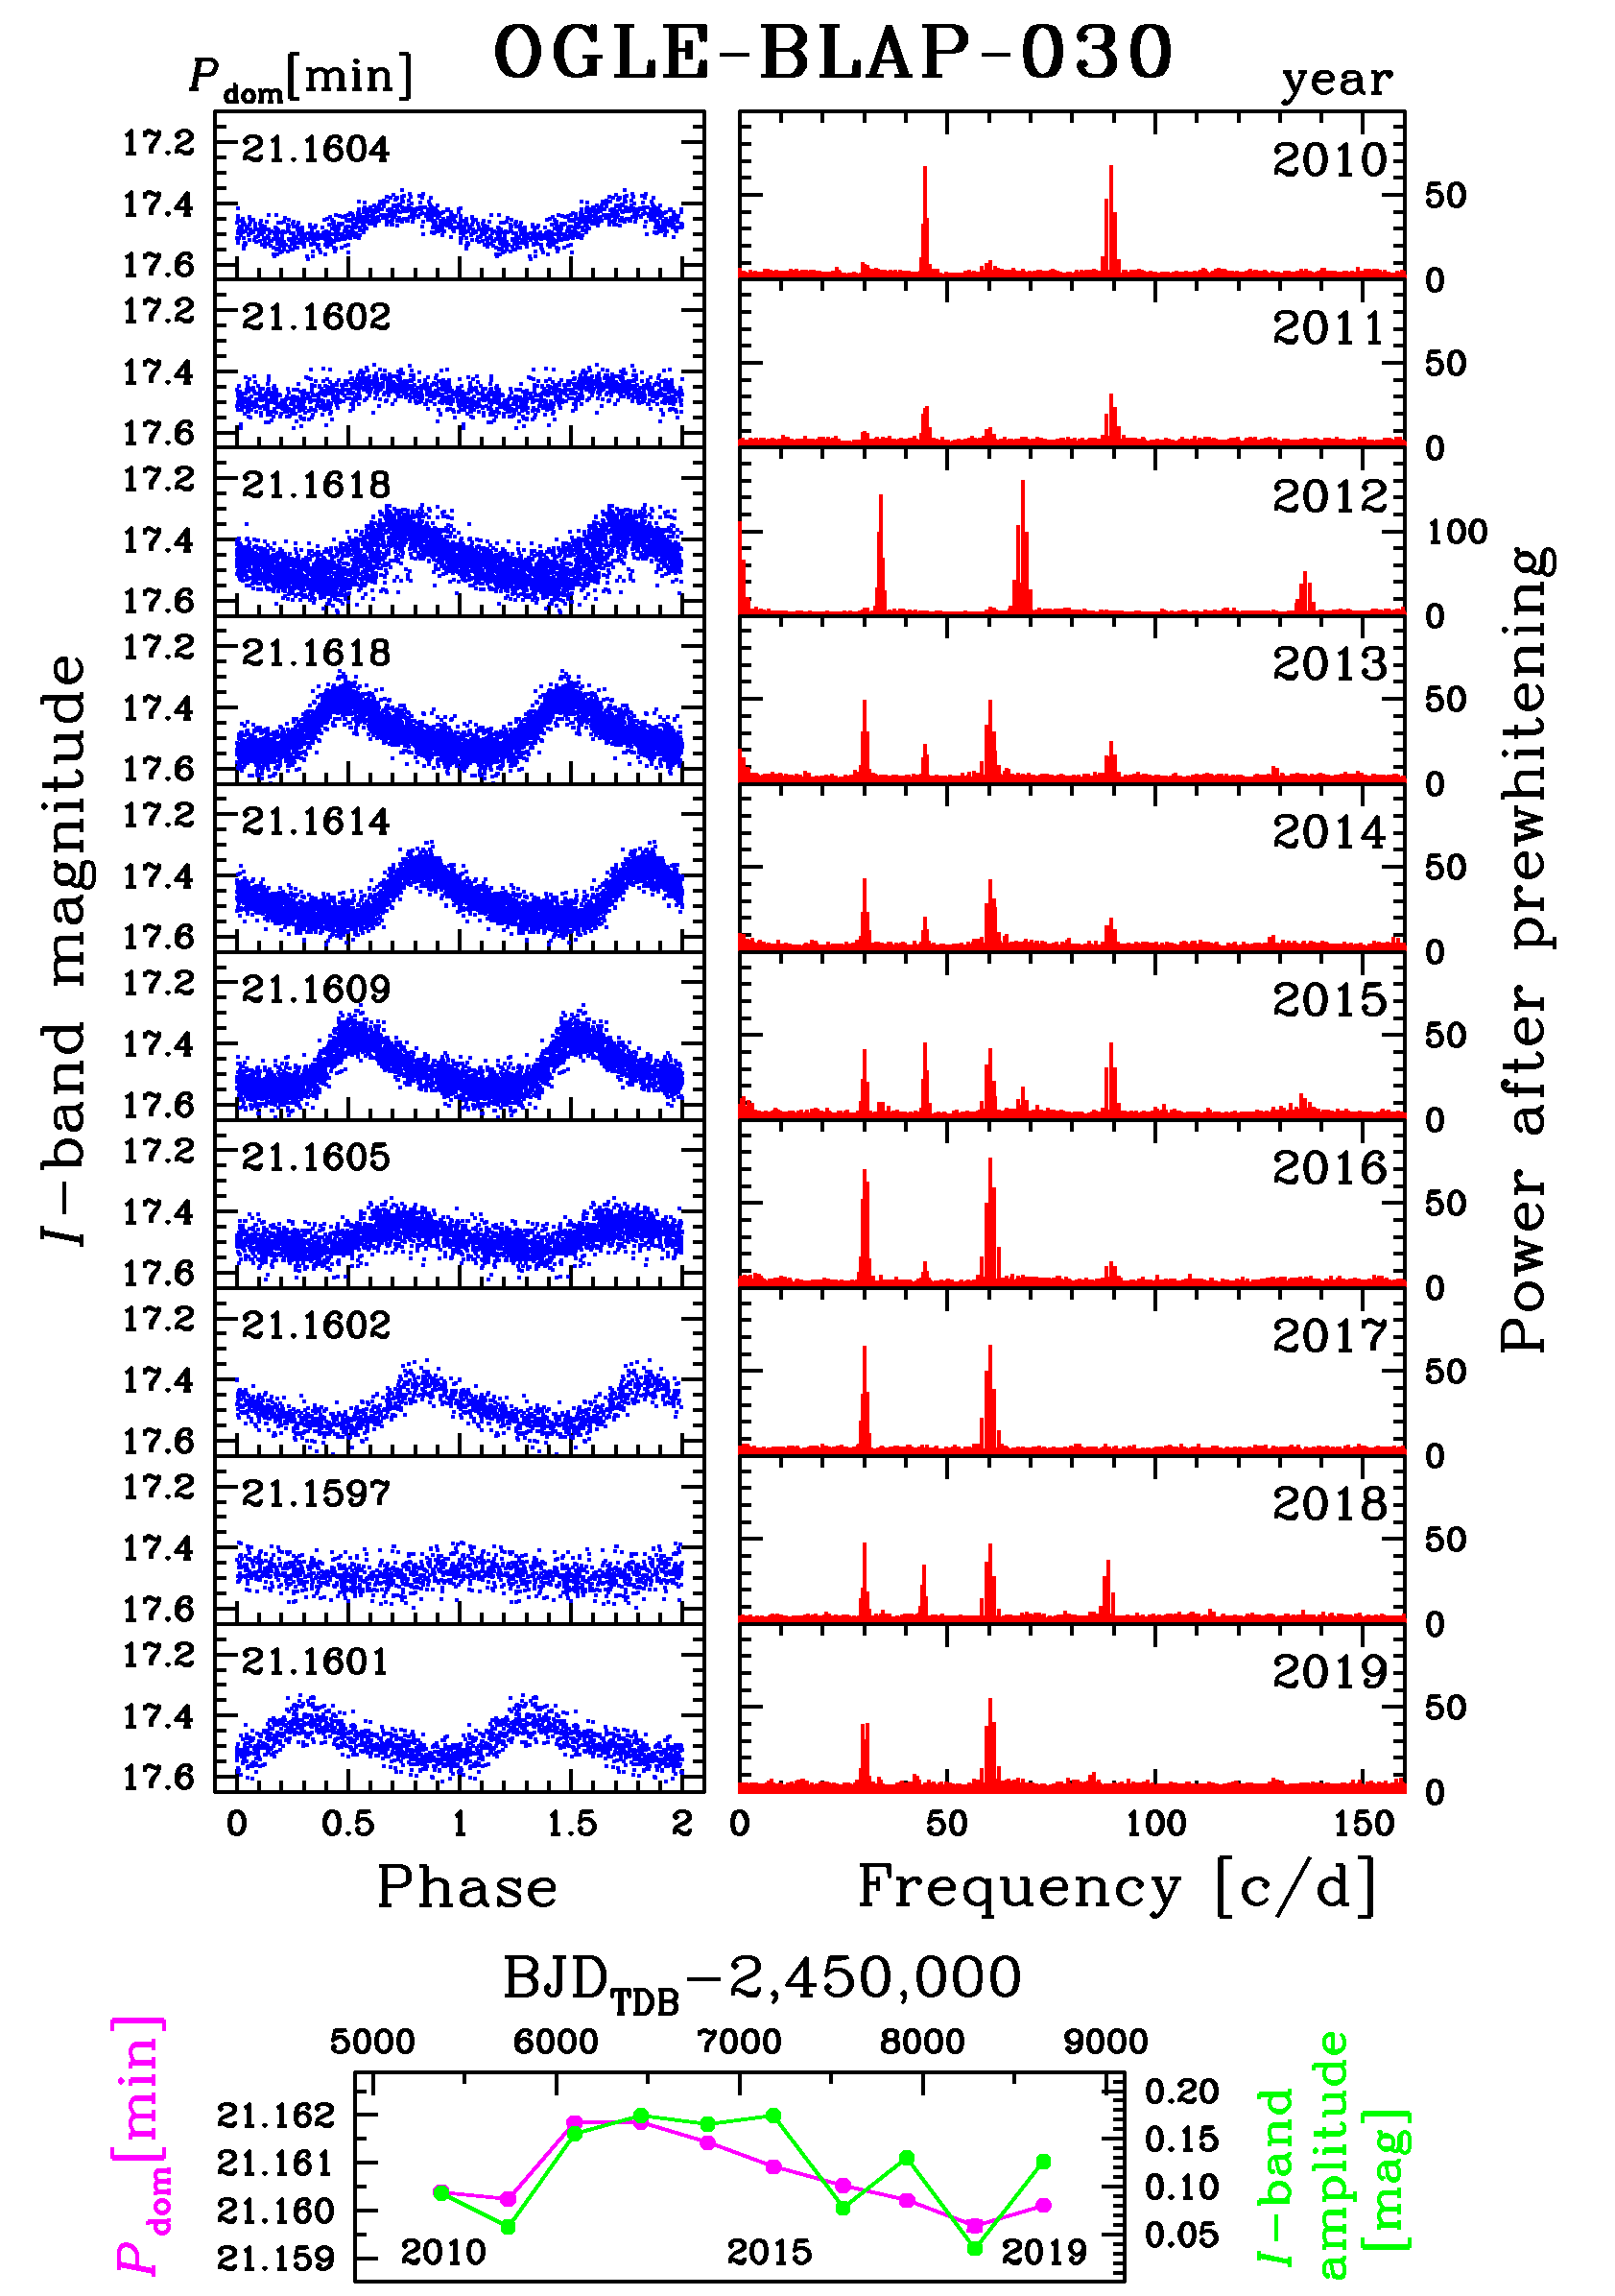
The second multiperiodic pulsator, OGLE-BLAP-030, shows strong amplitude and period changes. We analyzed the rich OGLE-IV photometry for this star by performing subsequent prewhitenings season by season from 2010 to 2019. The dominant signal is around 68.050 c/d, or at the period min. In Fig. 3, we present, for each season separately, a light curve folded with the actual dominant period and a power spectrum obtained after prewhitening with this value. We conclude that there are three independent frequencies in this star. Their exact values in 2015 were 68.04999(3), 89.31937(26), and 60.35173(26) c/d, or the periods min, min, and min, respectively. The remaining signals are subharmonics or combinations of the independent frequencies. The light curve shape of the dominant signal is characteristic for pulsations in the fundamental radial mode. The ratios between the periods are the following: , , and . The value is similar to the period ratio observed for stars pulsating in the fundamental mode and first overtone simultaneously, such as Scuti-type stars (Netzel et al., 2022). would then correspond to the first overtone. The source of the third periodicity () remains unknown. It could be a non-radial mode.
| Name | ||||
|---|---|---|---|---|
| [K] | [km s-1] | |||
| OGLE-BLAP-001 | 30,800 | |||
| OGLE-BLAP-010 | 29,800 | |||
| OGLE-BLAP-019 | 28,000 | |||
| OGLE-BLAP-020 | 29,200 | |||
| OGLE-BLAP-021 | 28,500 | |||
| OGLE-BLAP-022 | 28,900 | |||
| OGLE-BLAP-024 | 25,200 | |||
| OGLE-BLAP-030 | 31,400 | |||
| OGLE-BLAP-031 | 26,800 | |||
| OGLE-BLAP-033 | 33,100 | |||
| OGLE-BLAP-034 | 30,300 | |||
| OGLE-BLAP-037 | 32,800 | |||
| OLGE-BLAP-042 | 28,300 | |||
| OGLE-BLAP-044 | 32,700 | |||
| OGLE-BLAP-049 | 29,300 |
During the decade of OGLE-IV observations of OGLE-BLAP-030, the -band amplitude varied between 0.035 mag (in 2018) and 0.175 mag (in 2015) with about 0.002 magnitude error, while the dominant period changed between 21.159677(9) min (in 2018) and 21.161847(12) min (in 2013). We plot both the amplitude and dominant period variations in the bottom panel of Fig. 3. They are correlated in time.
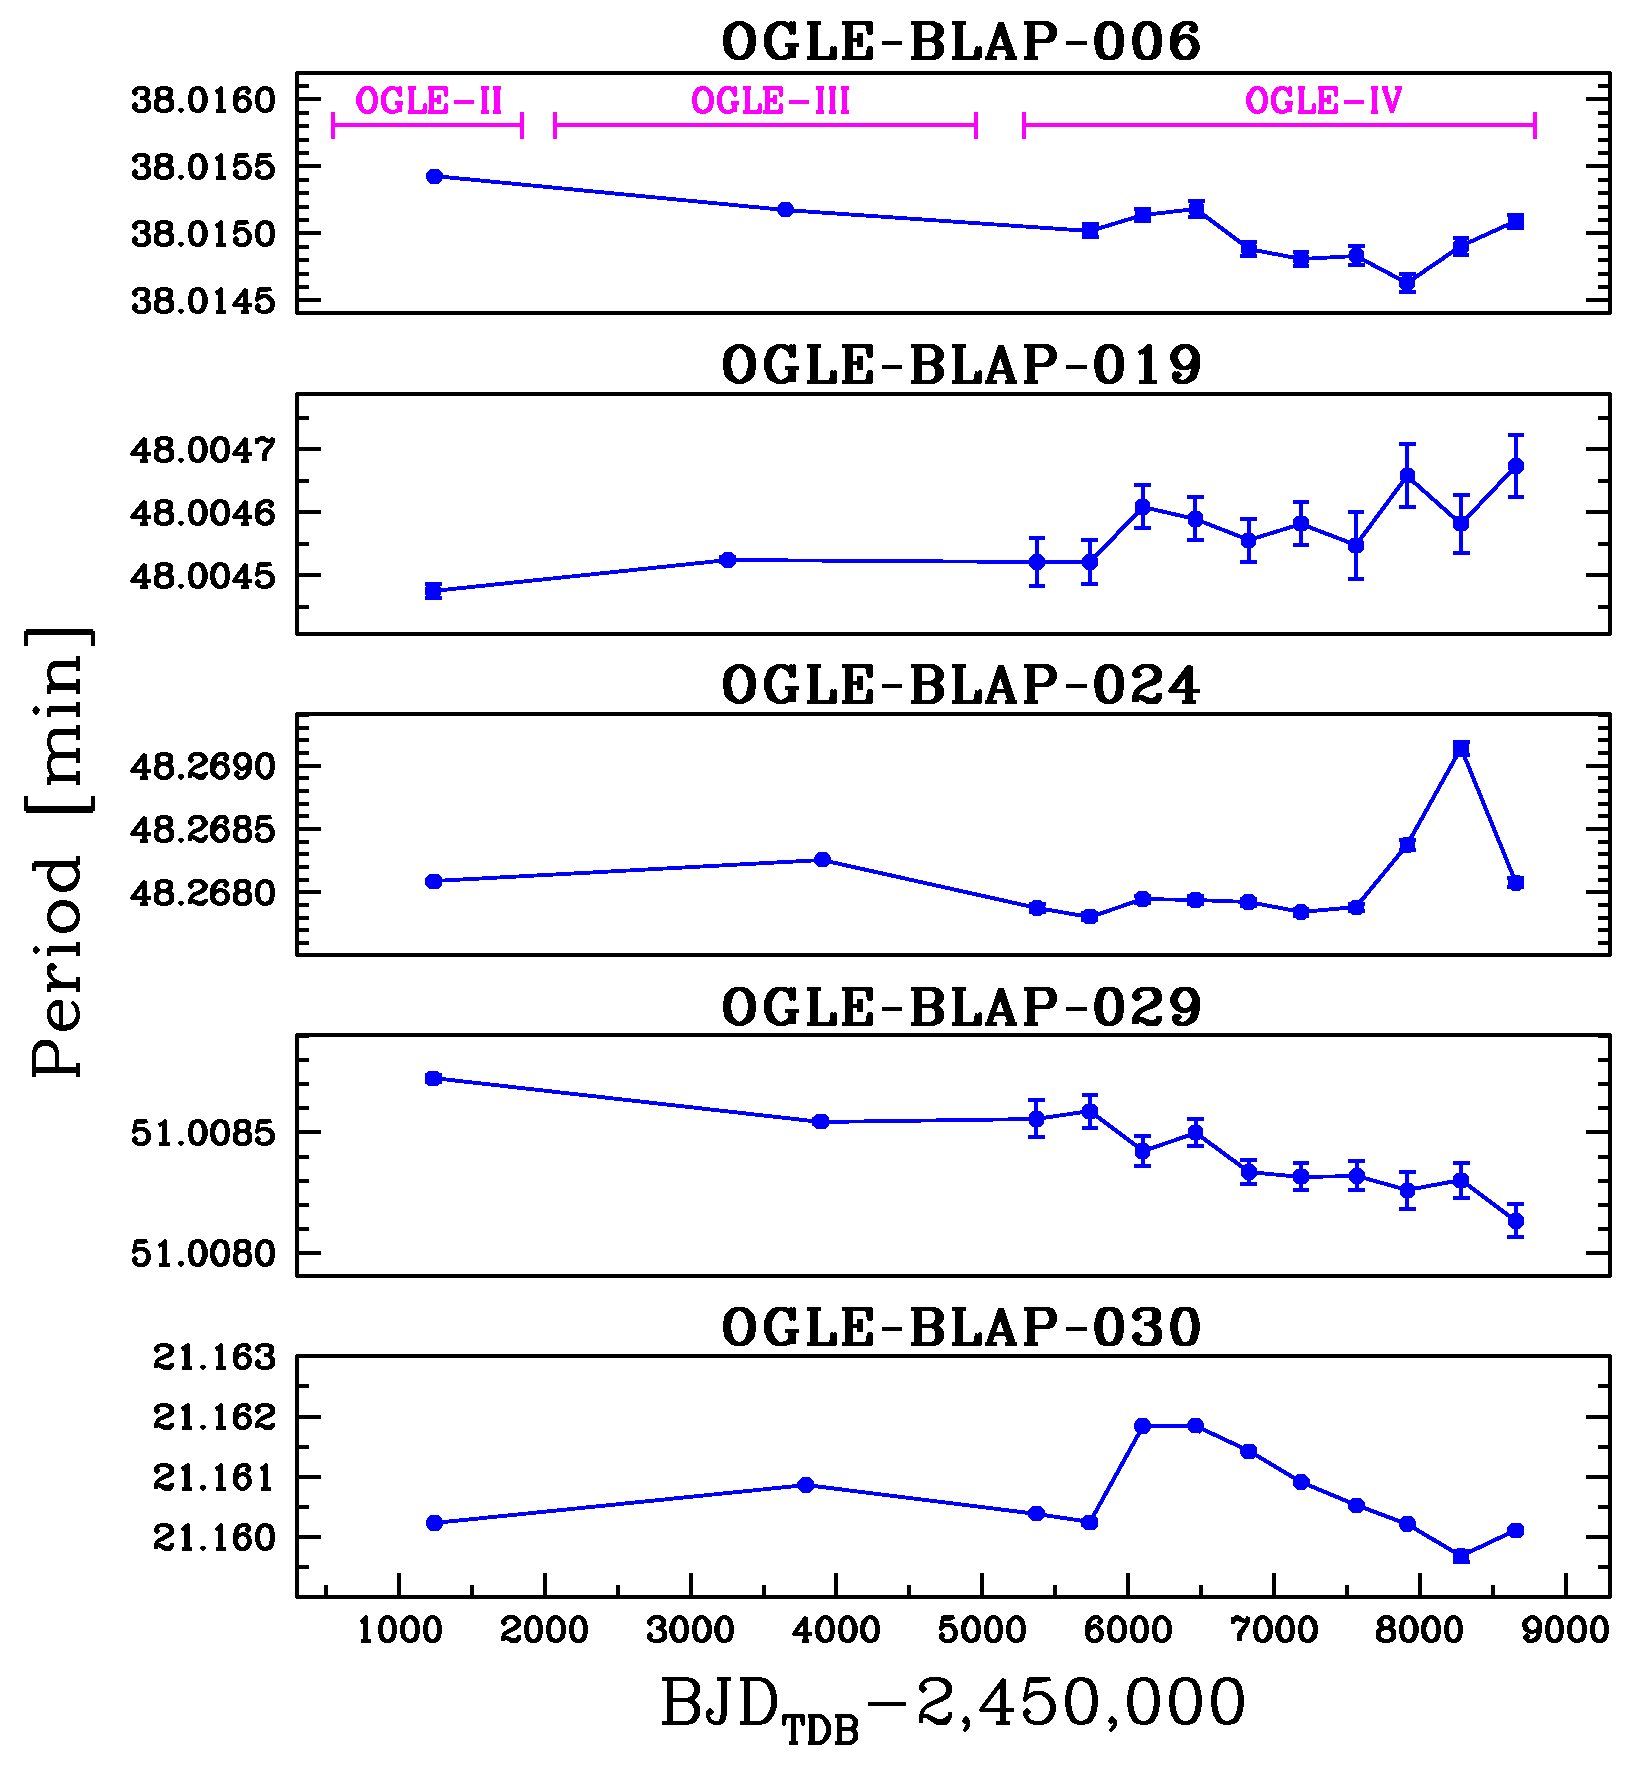
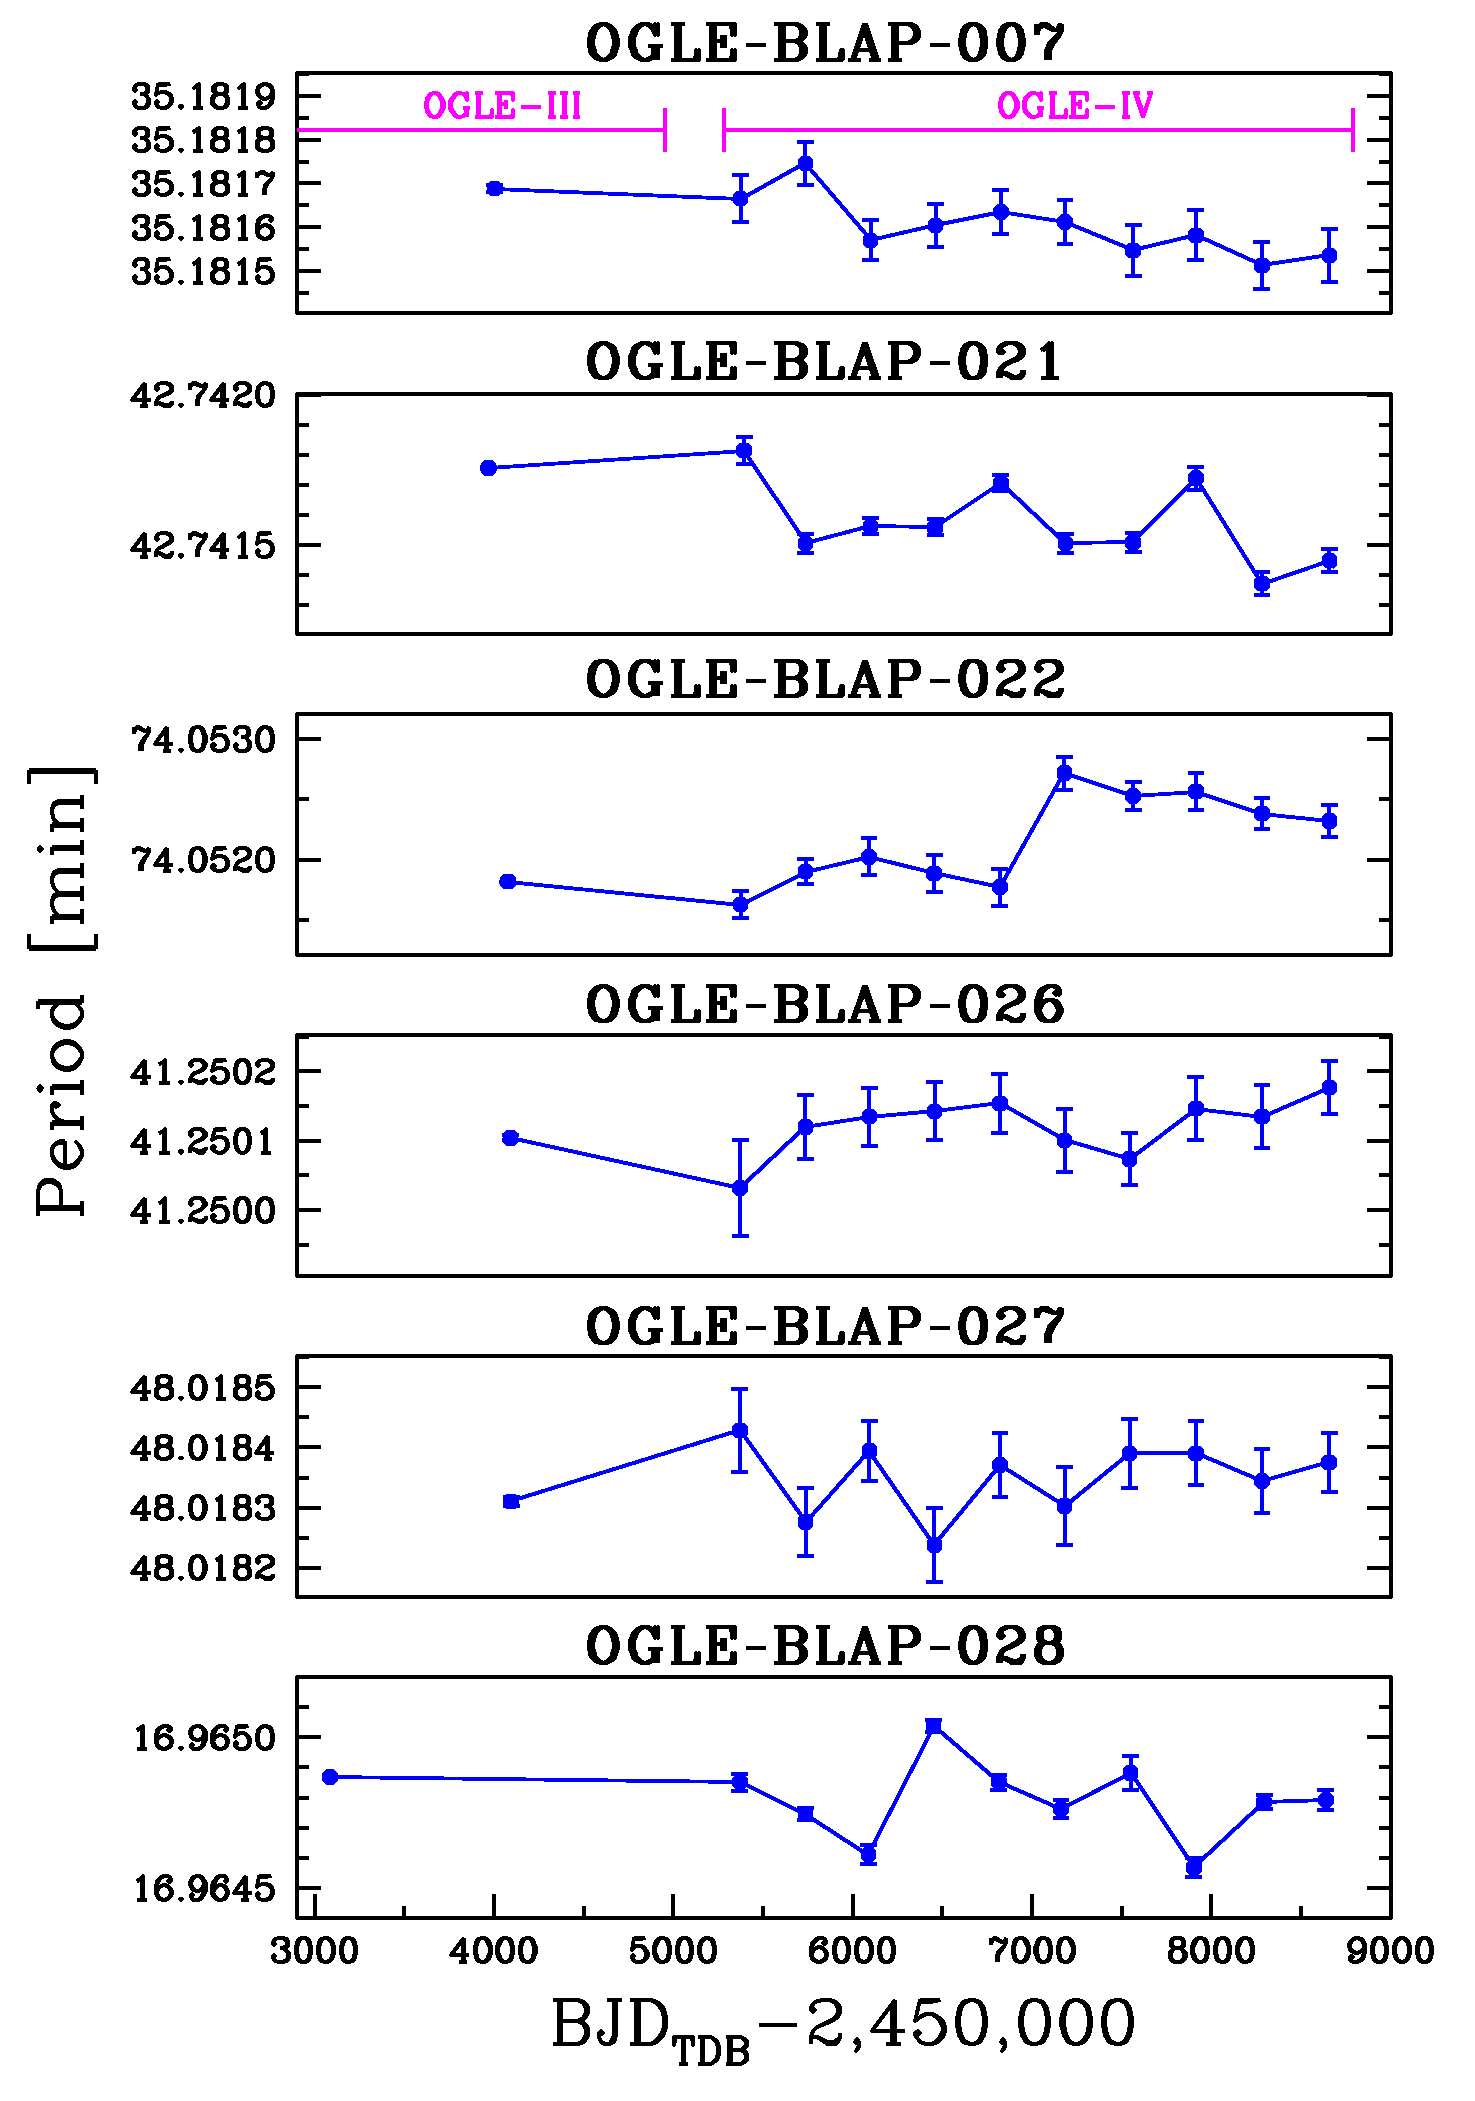
Five BLAPs, OGLE-BLAP-006, 019, 024, 029, and 030, have been observed over three OGLE phases, from OGLE-II to OGLE-IV. Period changes for these stars are plotted in Fig. 4. Unfortunately, the number of measurements in OGLE-II and OGLE-III is insufficient to investigate the seasonal changes. We determined one period value for each phase. Dividing the data into shorter sections of time results in too large error bars of the period. In general, the changes are irregular on time scales of months to years, but in some objects, such as OGLE-BLAP-006, 019, and 029, secular trends seem to emerge. For the remaining 23 BLAPs, the collected time-series data are shorter and cover only the phases of OGLE-III and OGLE-IV. Fig. 5 presents the period changes for six such stars.
For the prototype BLAP and 28 bulge objects with OGLE-III and OGLE-IV data, we calculated the period change rate in the most simple way as
| (1) |
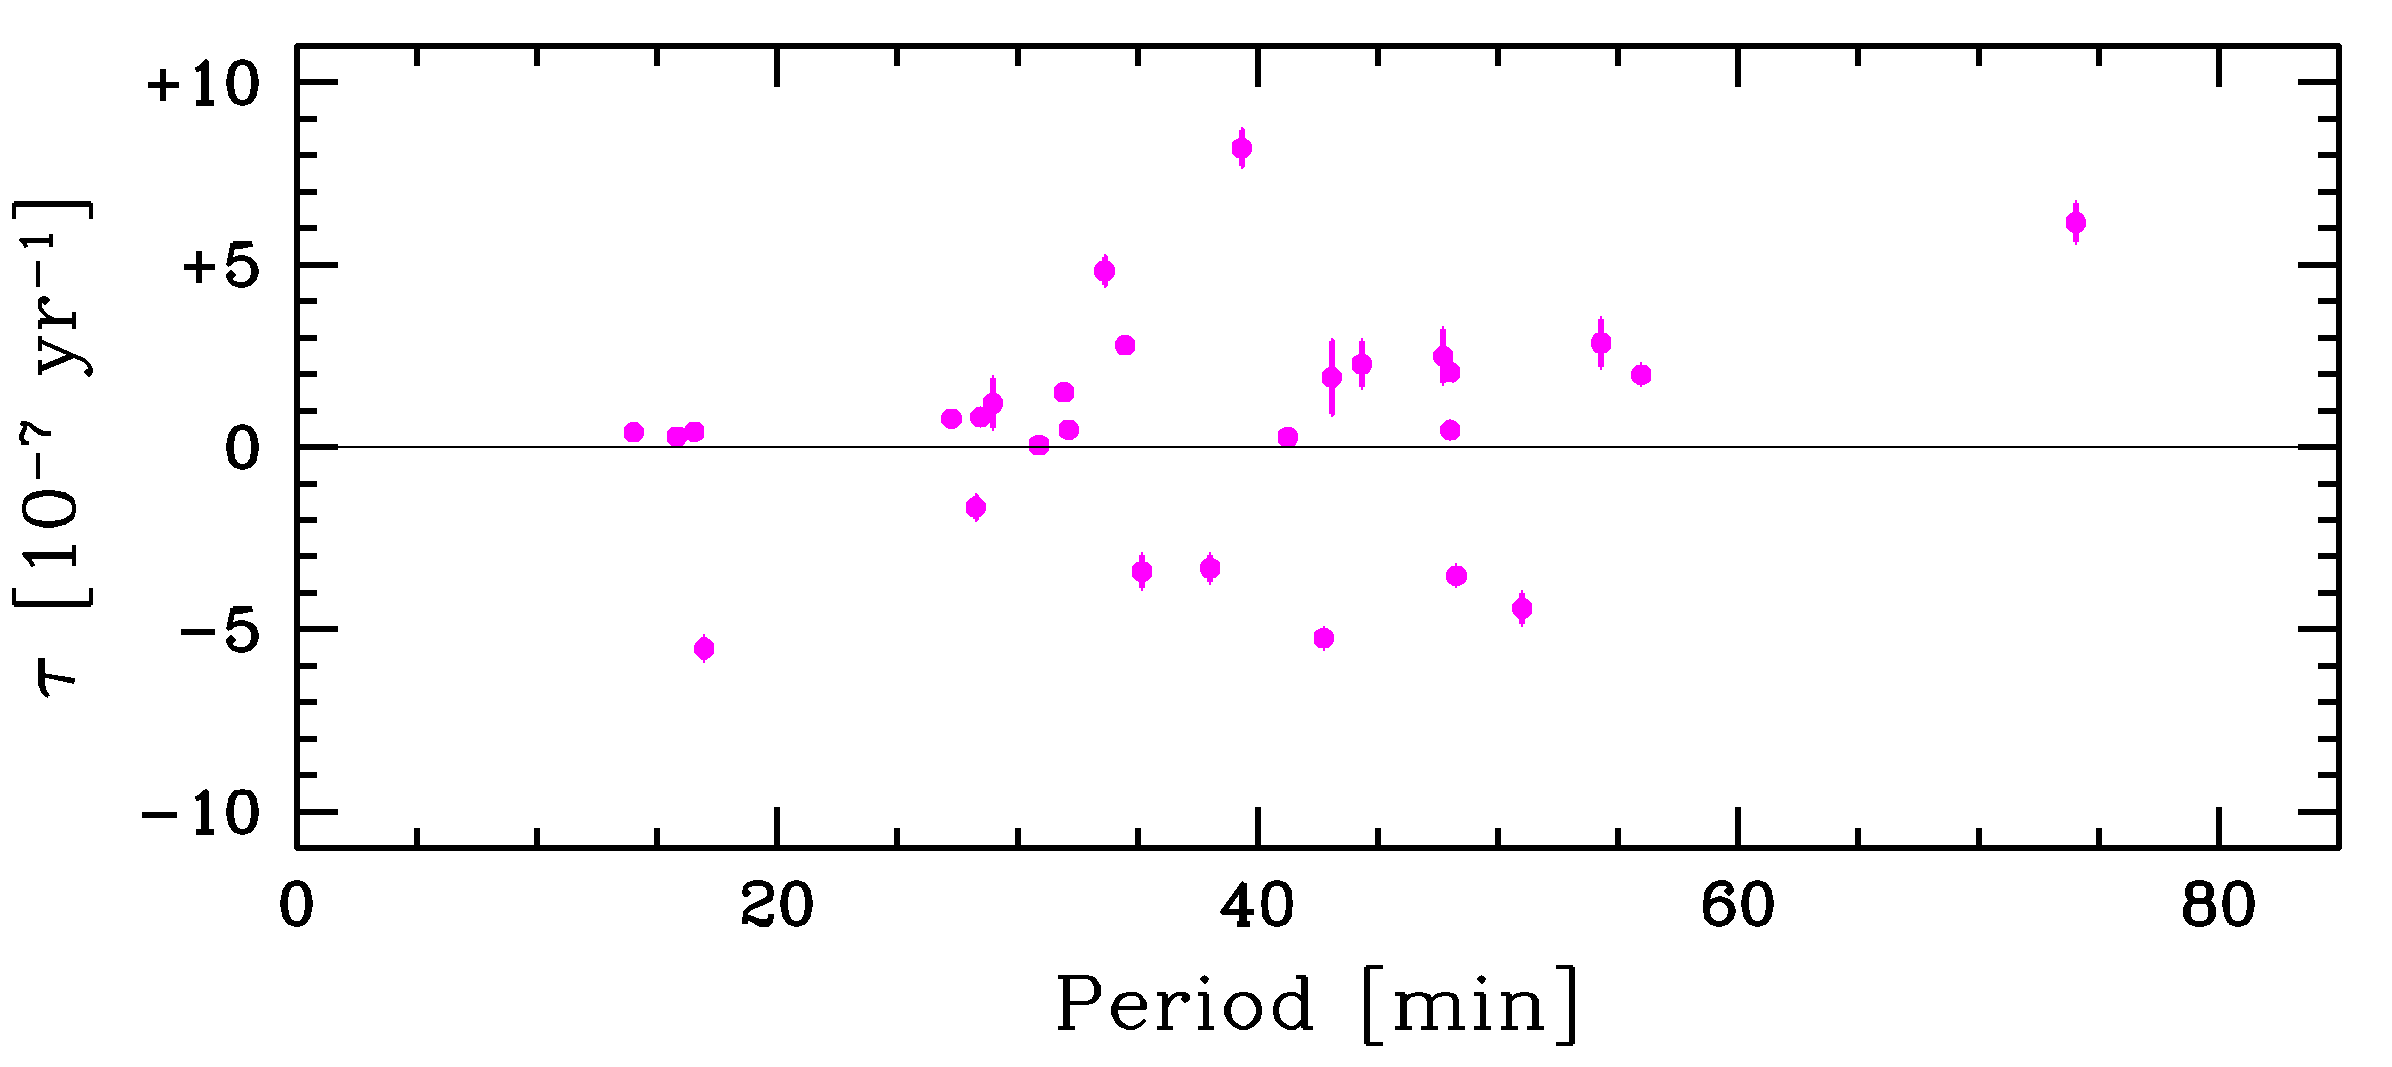
where and are the mean moments of the OGLE-III and OGLE-IV observations used to determine the periods and , respectively. Results are plotted in Fig. 6. Amongst the 29 BLAPs, seven objects show negative period changes, while for the remaining 22 objects the changes are positive. In general, the pulsation periods in BLAPs change slowly, with a rate of several times yr-1. Only the multimode pulsator OGLE-BLAP-030 experiences an order of magnitude faster variations, with a rate of yr-1 (beyond the scale in Fig. 6). There is no correlation between the rate of the changes and the pulsation period.
4.3 Atmospheric parameters
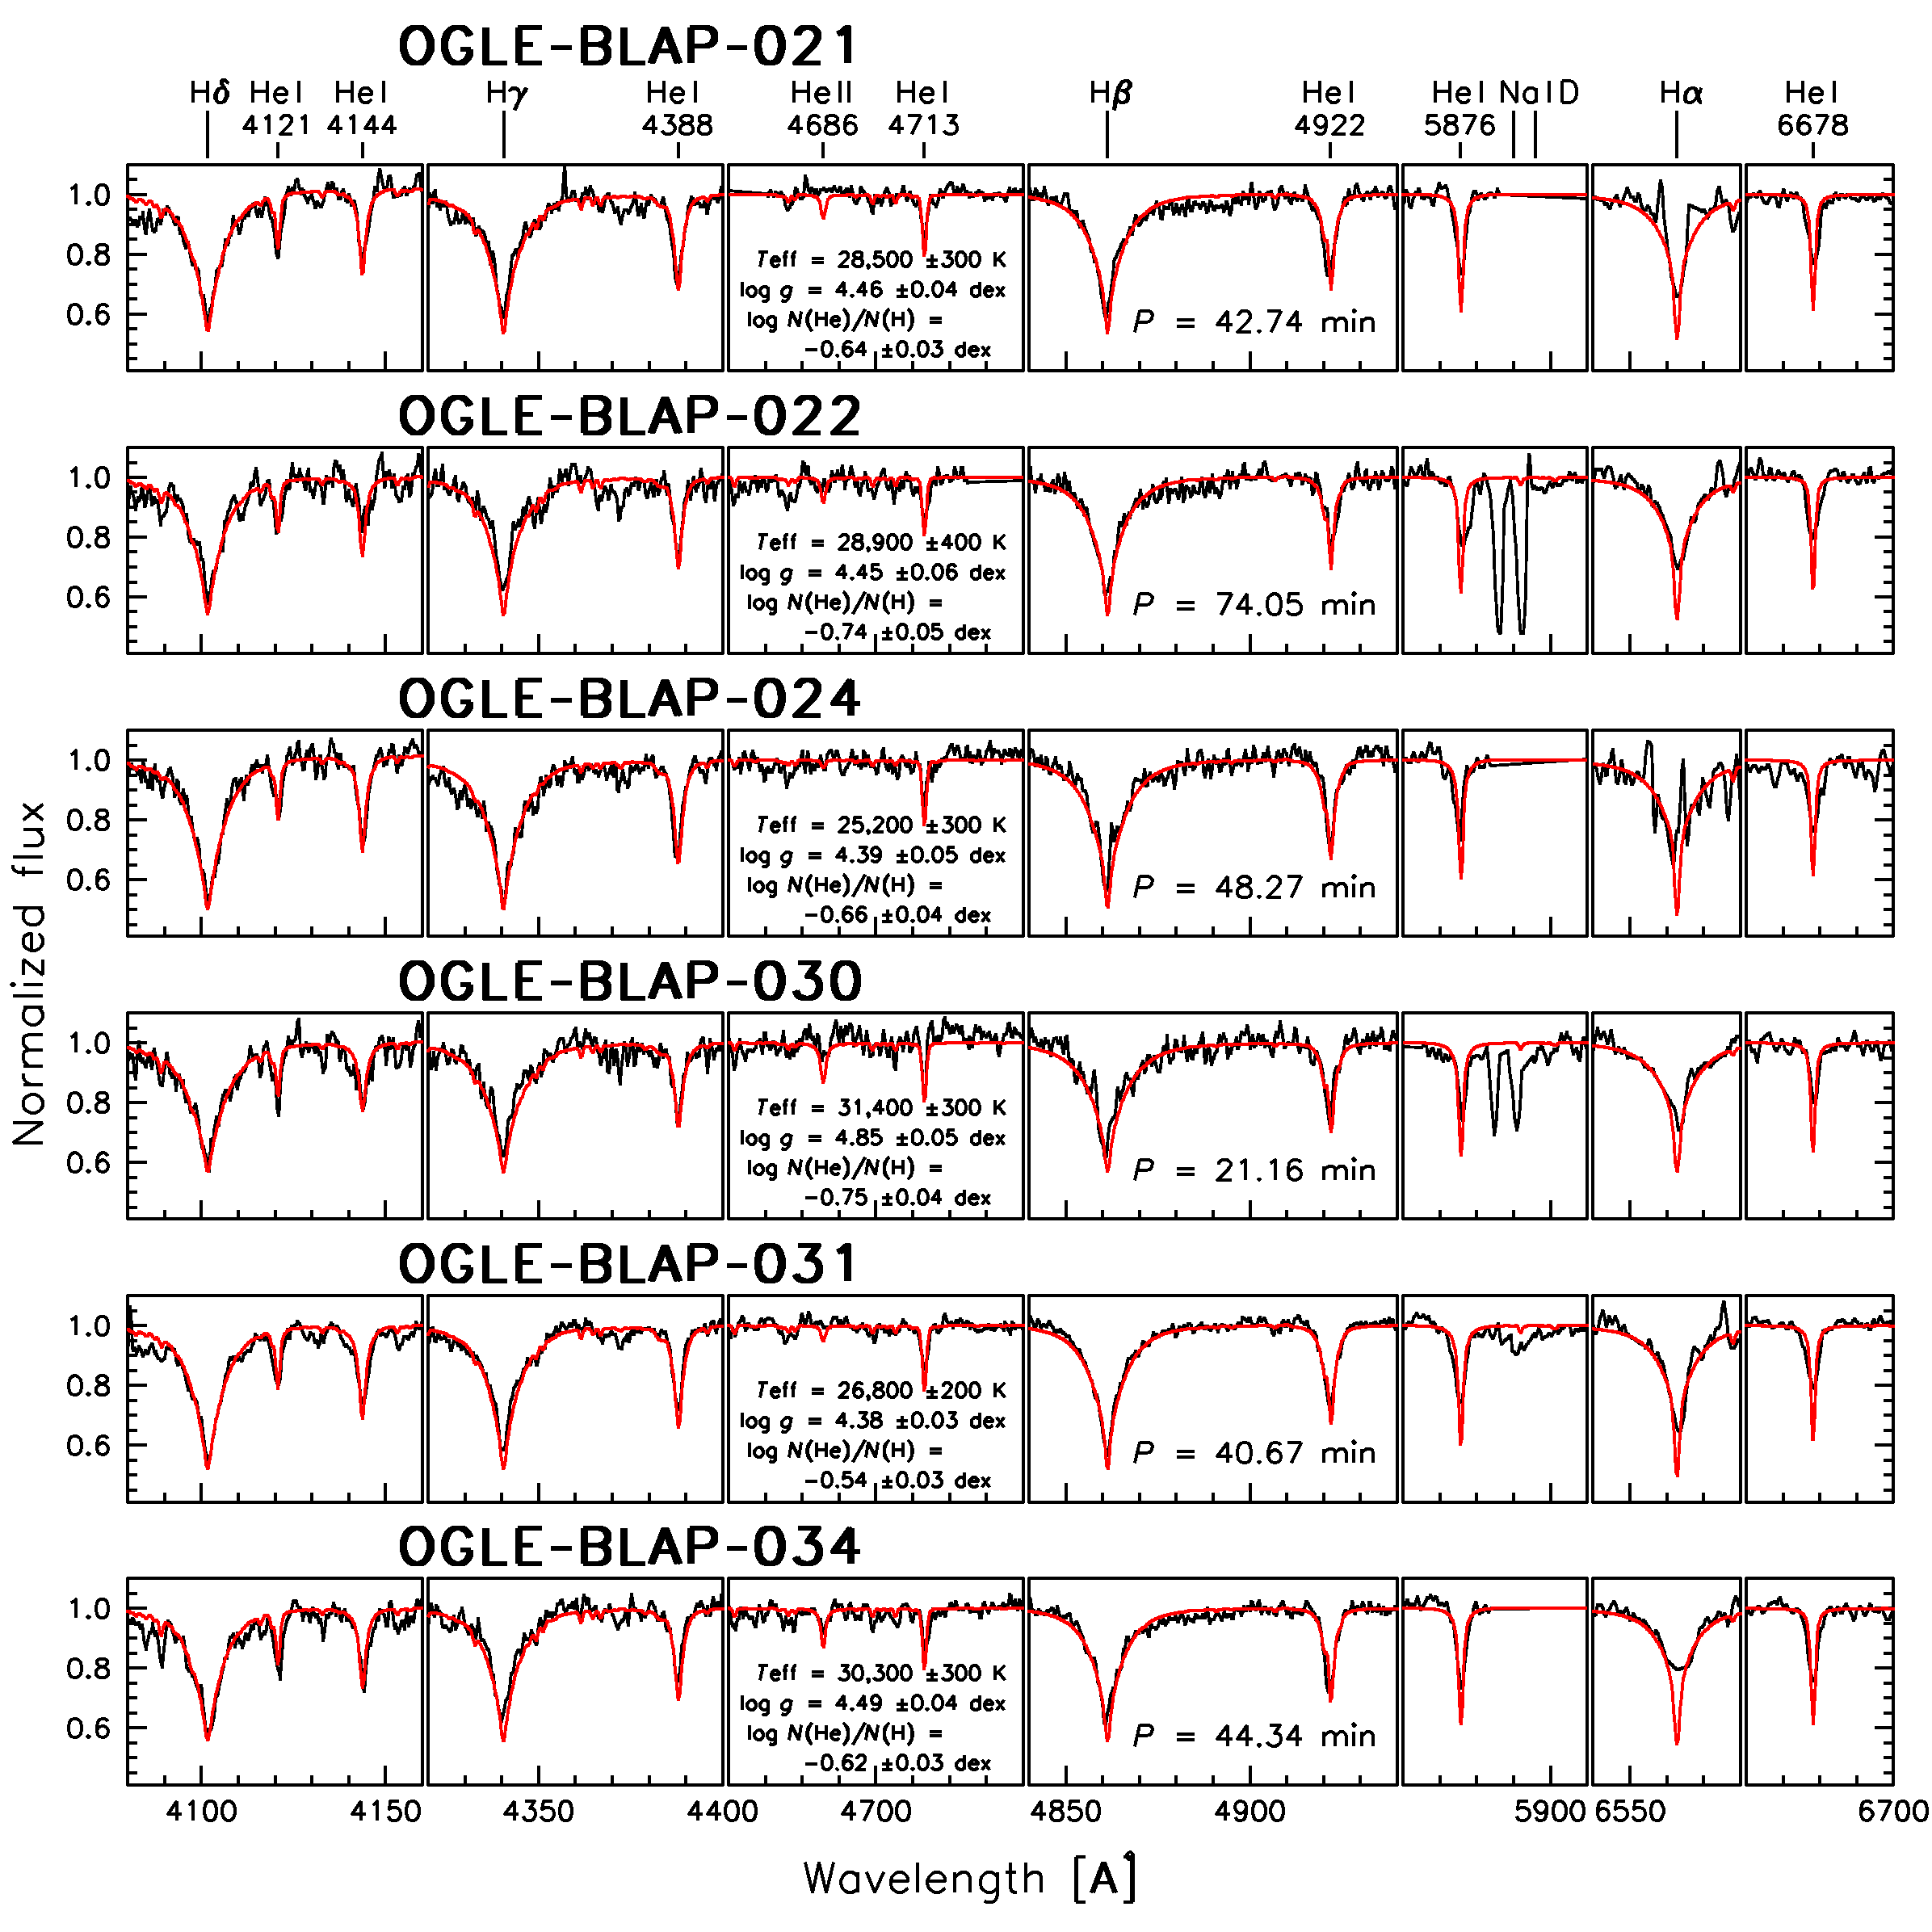
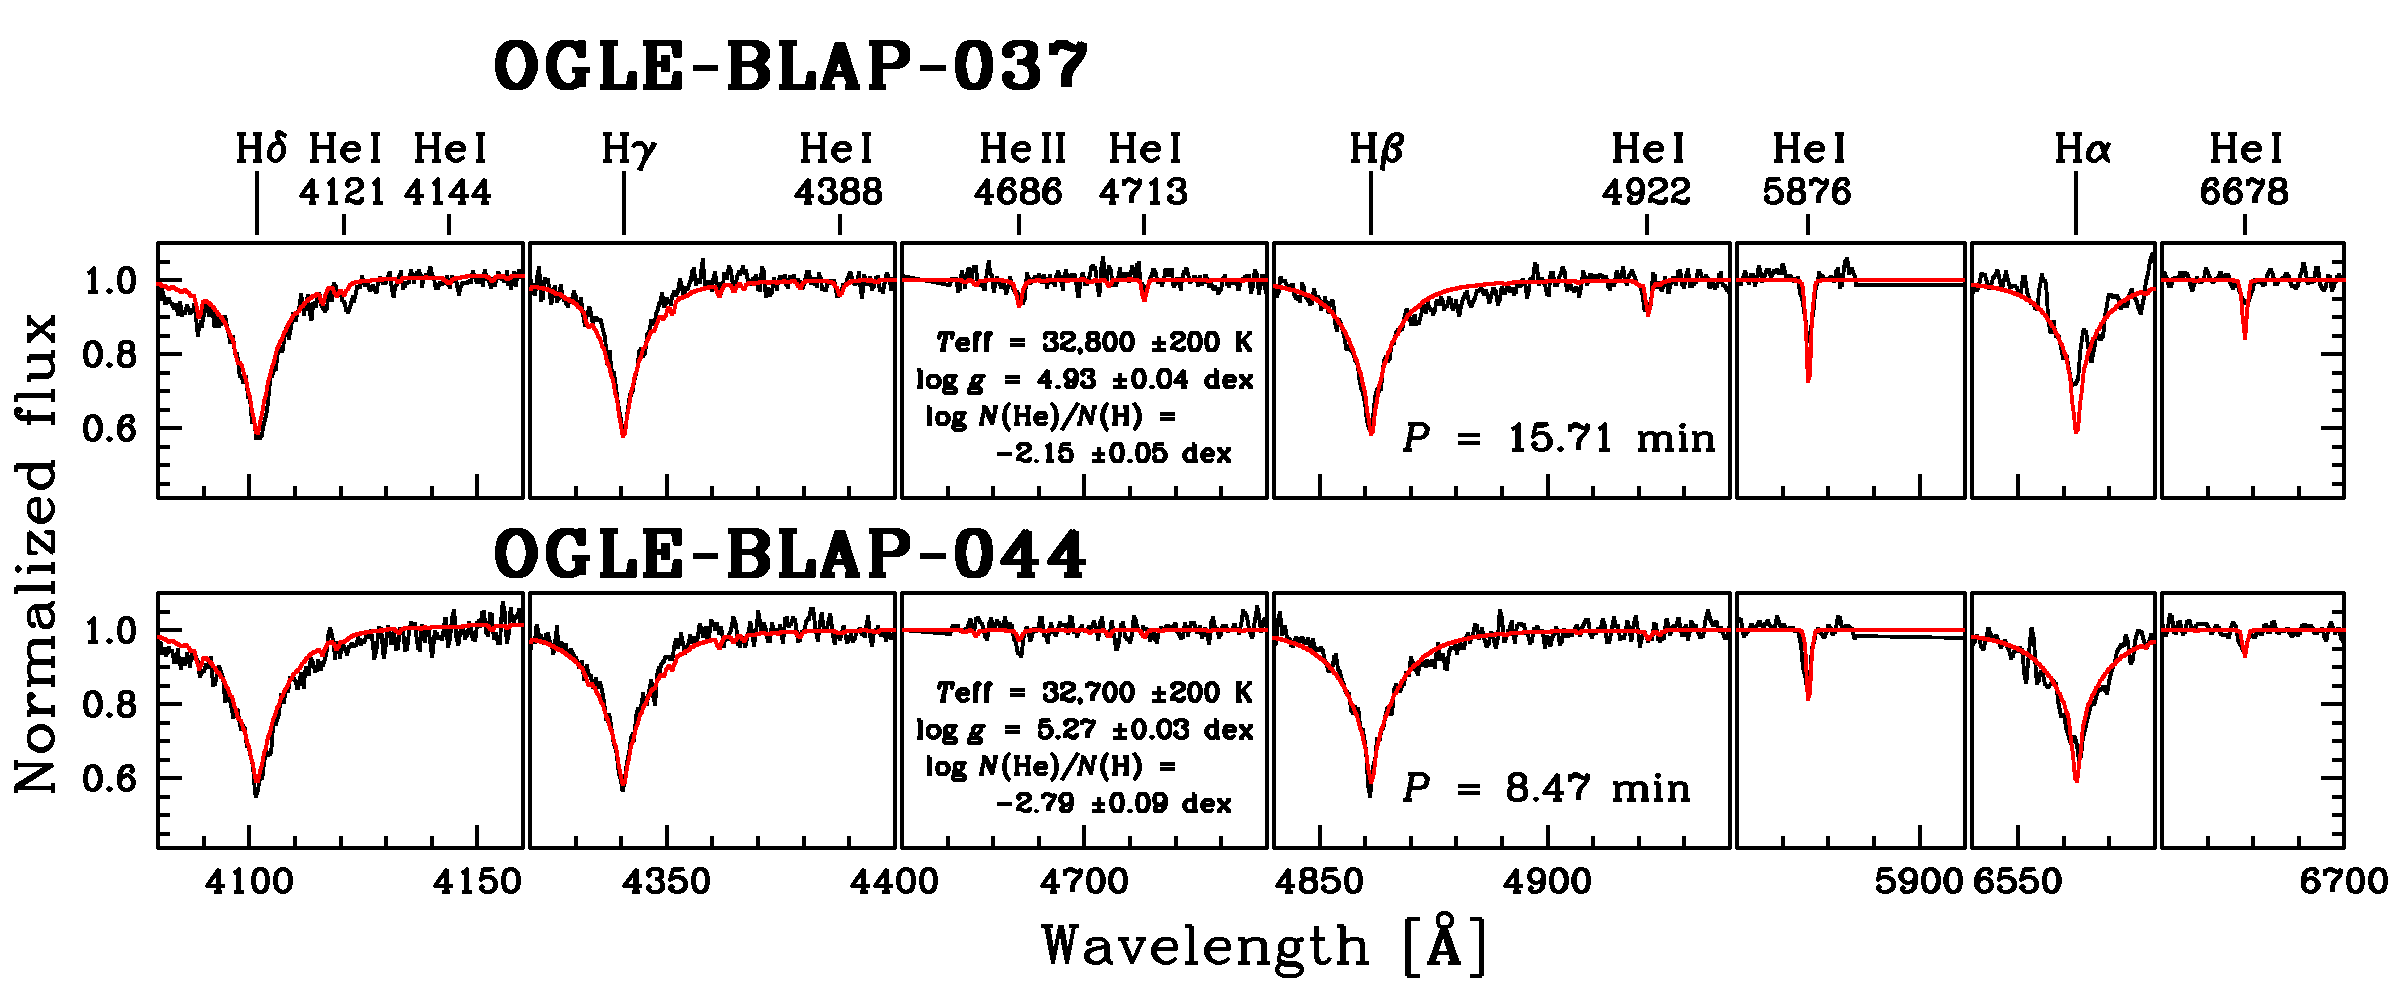
The atmospheric parameters of the 15 BLAPs observed with the MagE spectrograph are listed in Table 2 and our best fits for eight selected BLAPs are shown in Figs. 7–8. As explained in Sect. 3, the quoted uncertainties on the atmospheric parameters are the formal errors of the fitting procedure and the RV uncertainties are from the standard deviation of the RV values of single lines. The uncertainties do not include variations from the pulsations.
Among the 15 BLAPs observed with MagE, 13 stars have an atmosphere that is moderately enriched in helium. The helium abundance in these objects varies from to dex. They have effective temperatures between 25,000 K and 34,000 K and surface gravities between and 5.0. The two remaining stars, OGLE-BLAP-037 and OGLE-BLAP-044, have an atmosphere depleted in helium, with dex (see Fig. 8). In fact, with a pulsation period of only 8.47 min, OGLE-BLAP-044 has properties similar to the known high-gravity (and also He-poor) BLAPs that have periods between 3 and 8 min. On the other hand, OGLE-BLAP-037 has a significantly longer period (15.71 min). Incidentally, the variable nature of this object was reported by Ramsay et al. (2022) who identified it in the OmegaWhite survey and referred to it as OW J1819-2729. However, the authors classified it as a much cooler object (with =12,000 K) based on follow-up spectroscopy with a lower resolving power (). Our spectrum, shown in Fig. 8, indicates a high , notably due to the presence of the He ii 4686 line. In addition, the RV of the Ca ii K line visible in the spectrum is not consistent with the stellar RV, indicating that the Ca line does not originate from the stellar photosphere.
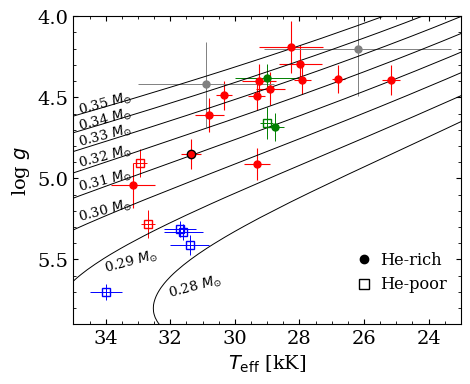
Figures 9 present the atmospheric parameters of BLAPs in the – and –helium abundance planes. In this figure, we included the 15 BLAPs observed with MagE, two BLAPs for which low-resolution spectra were analyzed in Pietrukowicz et al. (2017), the four high-gravity BLAPs from Kupfer et al. (2019), and TMTS-BLAP-1, SMSS-BLAP-1, and OGLE-BLAP-009 (Lin et al., 2023; Chang et al., 2024; Bradshaw et al., 2024). In the – diagram (left panel in Fig. 9), the BLAPs loosely follow a sequence where the surface gravity increases with the effective temperature. If they are He-core pre-WDs, they would have masses between 0.3 and 0.35 according to the evolutionary sequences of Kupfer et al. (2019). The four high-gravity BLAPs appear to follow a similar sequence but shifted to larger gravities.
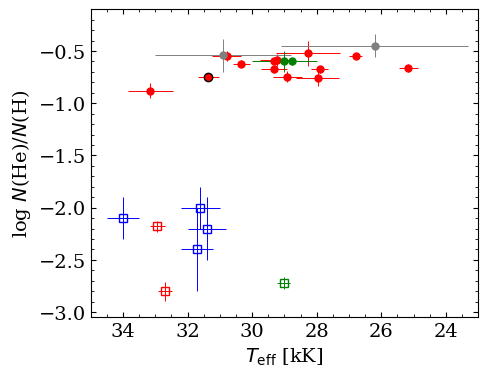
The second diagram presents the –helium abundance plane (right panel in Fig. 9), where the BLAPs split up into two distinct groups: those, like the prototype, having a He-rich atmosphere, and those, like the high-gravity BLAPs, having a He-poor atmosphere. Although both groups overlap in , the He-poor stars are mainly found at the hot end ( 31,000 K) of the temperature range covered by the BLAPs (i.e., 25,000–34,000 K).
4.4 Metallicity
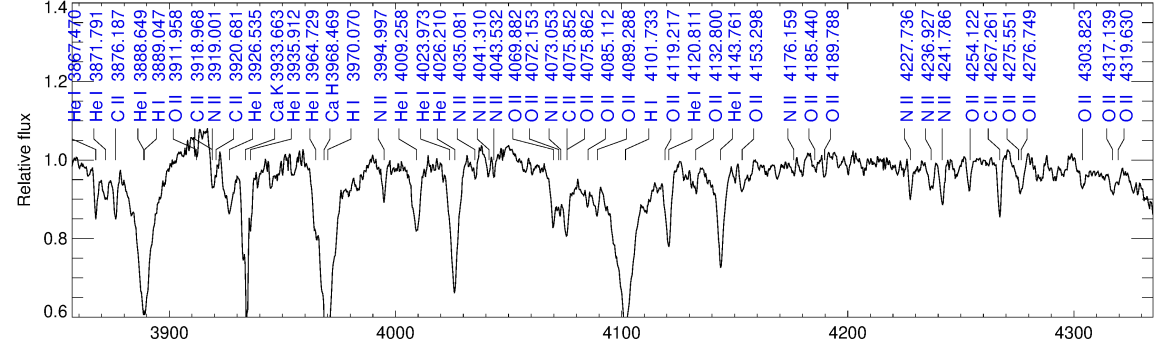
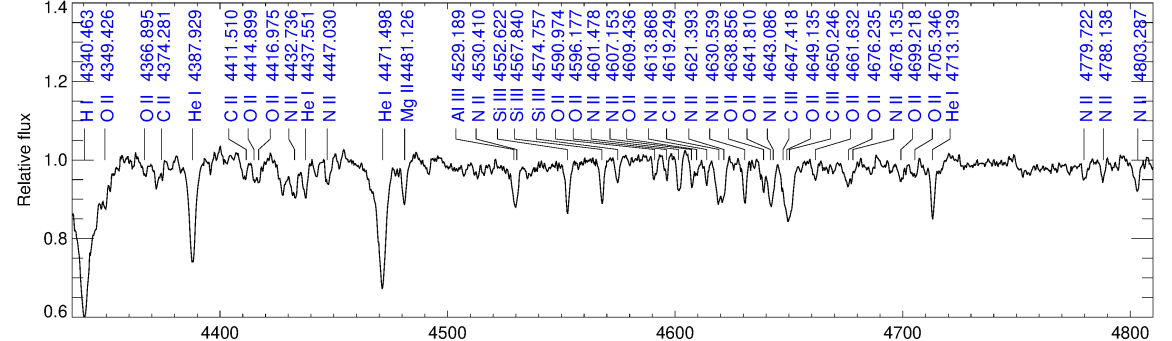
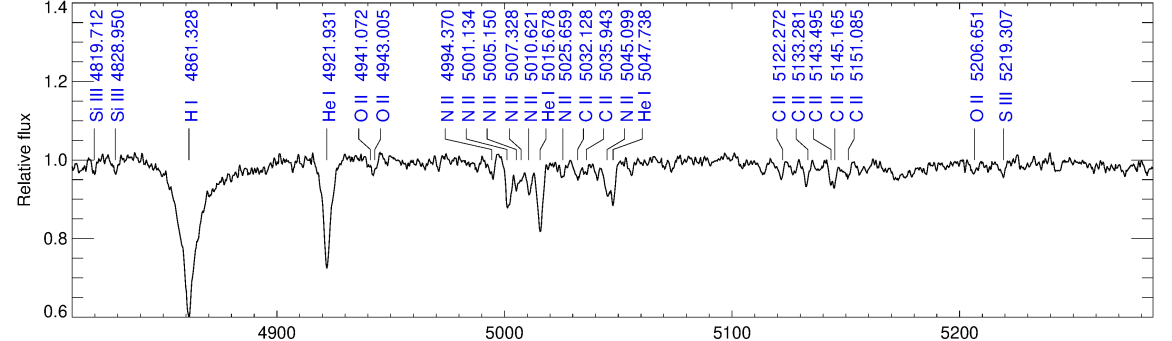
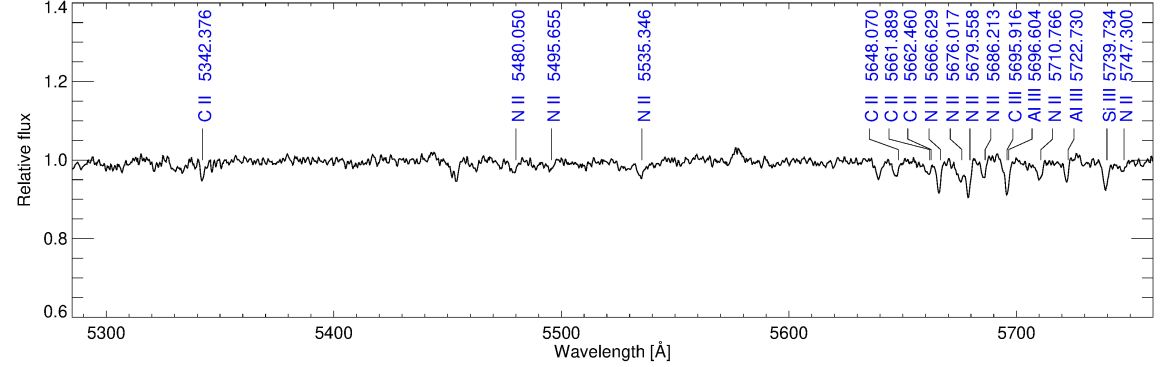
Besides the hydrogen and helium lines, many additional absorption features are visible in the spectra of the He-rich BLAPs. The majority of these spectral lines are present with a similar strength in the spectra of all He-rich BLAPs (at least in those having a sufficiently high ), indicating that they share a similar atmospheric composition. To identify metal lines, we combined the RV-corrected spectra of five BLAPs having good and between 25,000 and 30,000 K, namely OGLE-BLAP-010, 019, 021, 031, and 034. The resulting spectrum is shown in Fig 10. We were able to identify all prominent features. The majority of the metal lines originates from C ii, C iii, N ii, and O ii. A few additional features are from Mg ii, Al iii, and Si iii.
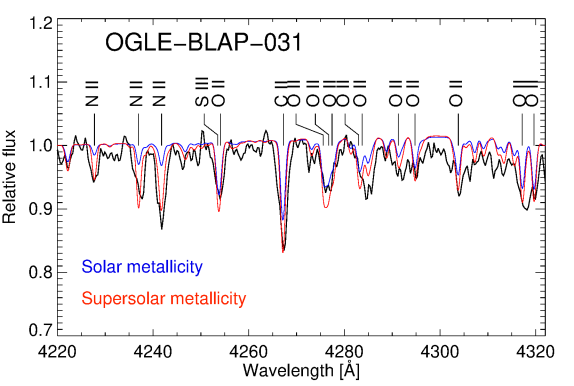
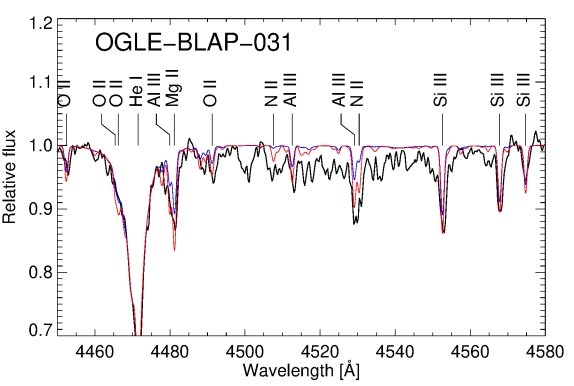
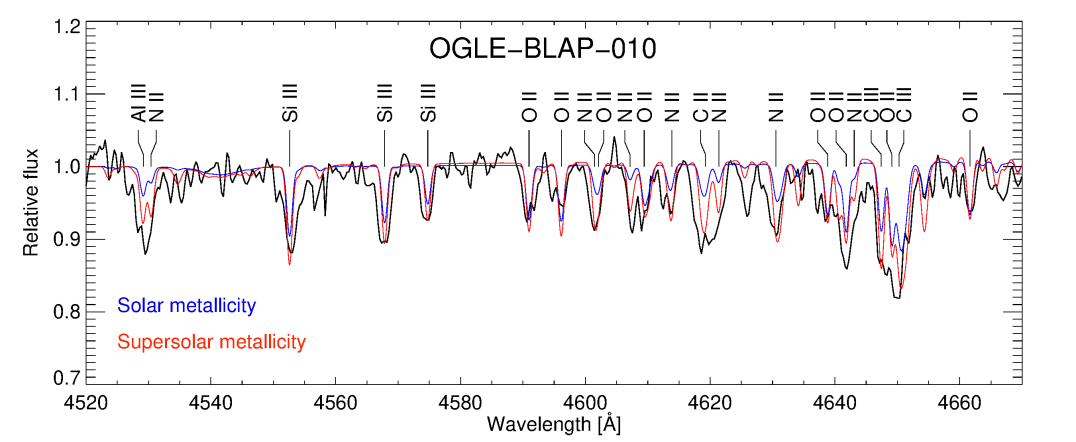
To provide an estimate of the elemental abundances of the He-rich BLAPs, we computed model atmospheres and synthetic spectra with varying abundances for two selected stars with good , OGLE-BLAP-010 and OGLE-BLAP-031. We first computed model atmospheres and spectra having the specific parameters of each star and included a solar abundance composition. The resulting spectra, compared to the observations, are displayed in Fig. 11 for three selected wavelength ranges. A solar composition results in many lines being weaker than in the observations, notably those of nitrogen. We proceeded into incrementally increasing the individual abundances of the elements mentioned above. For these two stars, we estimated the following abundances: carbon, magnesium, and aluminum 5 solar, nitrogen 10 solar, and oxygen 2 solar. Silicon appeared to be enhanced by up to 5 solar in OGLE-BLAP-010 but only up to 2 solar in OGLE-BLAP-031.
It is not uncommon for evolved stars with an atmosphere enriched in helium to also show enhancement in nitrogen and, or, carbon. For example, the He-rich subluminous O and B stars are typically enriched in either N or C, and sometimes both (Naslim et al., 2010; Stroeer et al., 2007; Hirsch & Heber, 2009). The BLAPs seem to share these characteristics as well, with an enhancement in nitrogen more pronounced than that of carbon.
4.5 Period-gravity relationship
The final parameter space we explore is the period–gravity plane. The period of a radial fundamental mode is determined by the mean stellar density so that:
| (2) |
where is the mass of the star and its radius. Since the gravity , after transformations we obtain
| (3) |
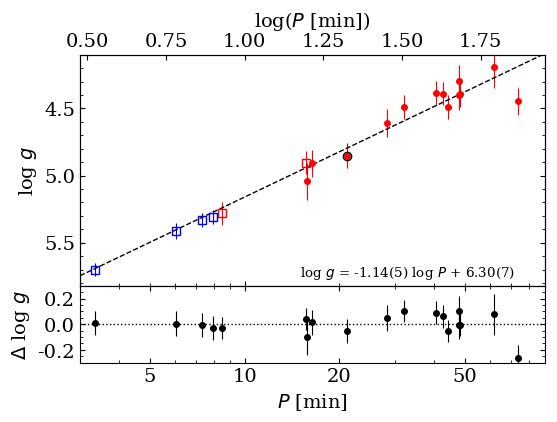
In Fig. 12, we plot the surface gravity and period on logarithmic scales and find that they follow a linear relationship as expected from Eq. 3. We fitted a linear regression in the vs. plane presented in Fig. 12 using the 15 stars from this paper (those listed in Table 2), and the four high-gravity BLAPs of Kupfer et al. (2019). For the He-rich BLAPs, we restricted ourselves to the BLAPs observed with the MagE spectrograph because they form a homogeneous sample. We fitted the following equation:
| (4) |
with the slope of , the intercept of , and where is expressed in minutes. The bottom panel of Fig. 12 shows the residuals in log between the measured value and that predicted by the regression. Only the longest period object, OGLE-BLAP-022, deviates significantly from the relation, that is by about . The mean residual, in absolute value, when removing this star, is 0.05 dex in , which is very reasonable given the limited accuracy of the surface gravity measurements.
An interesting feature visible in the period–gravity plane of Fig. 12 is the separation, in terms of period length, between the He-poor BLAPs at short periods and the He-rich objects having longer periods. This separation happens between the He-rich star OGLE-BLAP-033 (P=15.82 min) and the He-poor star OGLE-BLAP-037 (P=15.71 min). The two stars have very close periods, and a similar location in the – diagram, but OGLE-BLAP-037 has a He-poor atmosphere like that of the high-gravity BLAPs. It is also worth noting that among the four BLAPs identified by Ramsay et al. (2022), OW-BLAP-1 has a period of 10.85 min and a He-poor atmosphere, while the other three objects have min and He-rich atmospheres666They are not included Fig. 12.. However, the latest addition to the BLAPs family, SMSS-BLAP-1, is a He-poor object with a period of 19.52 min (Chang et al., 2024).
4.6 Period-luminosity relation
Since the luminosity of the star is inversely proportional to its surface gravity ,
| (5) |
and assuming that the masses and effective temperatures are similar, we expect that radially pulsating BLAPs obey a linear period-luminosity (P-L) relation like classical pulsators, Cepheids, for instance. The P-L relation can be written in the form
| (6) |
where is the bolometric absolute brightness of the star. To find the coefficients of the relation, and , we can use the information on the brightest BLAP, OGLE-BLAP-009, recently investigated in Bradshaw et al. (2024). The star has an average effective temperature of K and surface gravity of dex. The estimated parallax is mas after zero-point correction (Lindegren et al., 2021) of the value provided in Gaia EDR3 (Gaia Collaboration et al., 2021). This gives a geometric distance of pc with a deviation at pc and pc. At such distance and galactic latitude of , OGLE-BLAP-009 is located in moderately obscured regions of the thin Galactic disk. According to stellar models prepared by Pecaut & Mamajek (2013), such a hot object has the intrinsic color of mag and bolometric correction mag. The observed mean color of OGLE-BLAP-009 is mag, which implies a reddening of mag. We can calculate the -band extinction to the star as mag, where is the total-to-selective extinction ratio in this direction derived from the reddening map prepared by Nataf et al. (2013) based on OGLE-III observations of bulge red clump stars. Hence, we get the unreddened brightness values of mag and mag, and further the absolute magnitude in , mag, and bolometric brightness of the star mag. Assuming the bolometric brightness of the Sun mag, we find the luminosity of OGLE-BLAP-009 in solar units as or . This result is in perfect agreement with the value of obtained through the fitting of spectral energy distribution in Bradshaw et al. (2024). Finally, we calculate the slope of the P-L relation as and the intercept as mag for the pulsation period min. The obtained P-L relation with uncertainties is the following:
| (7) |
4.7 Kinematics and location of the BLAPs in the Milky Way
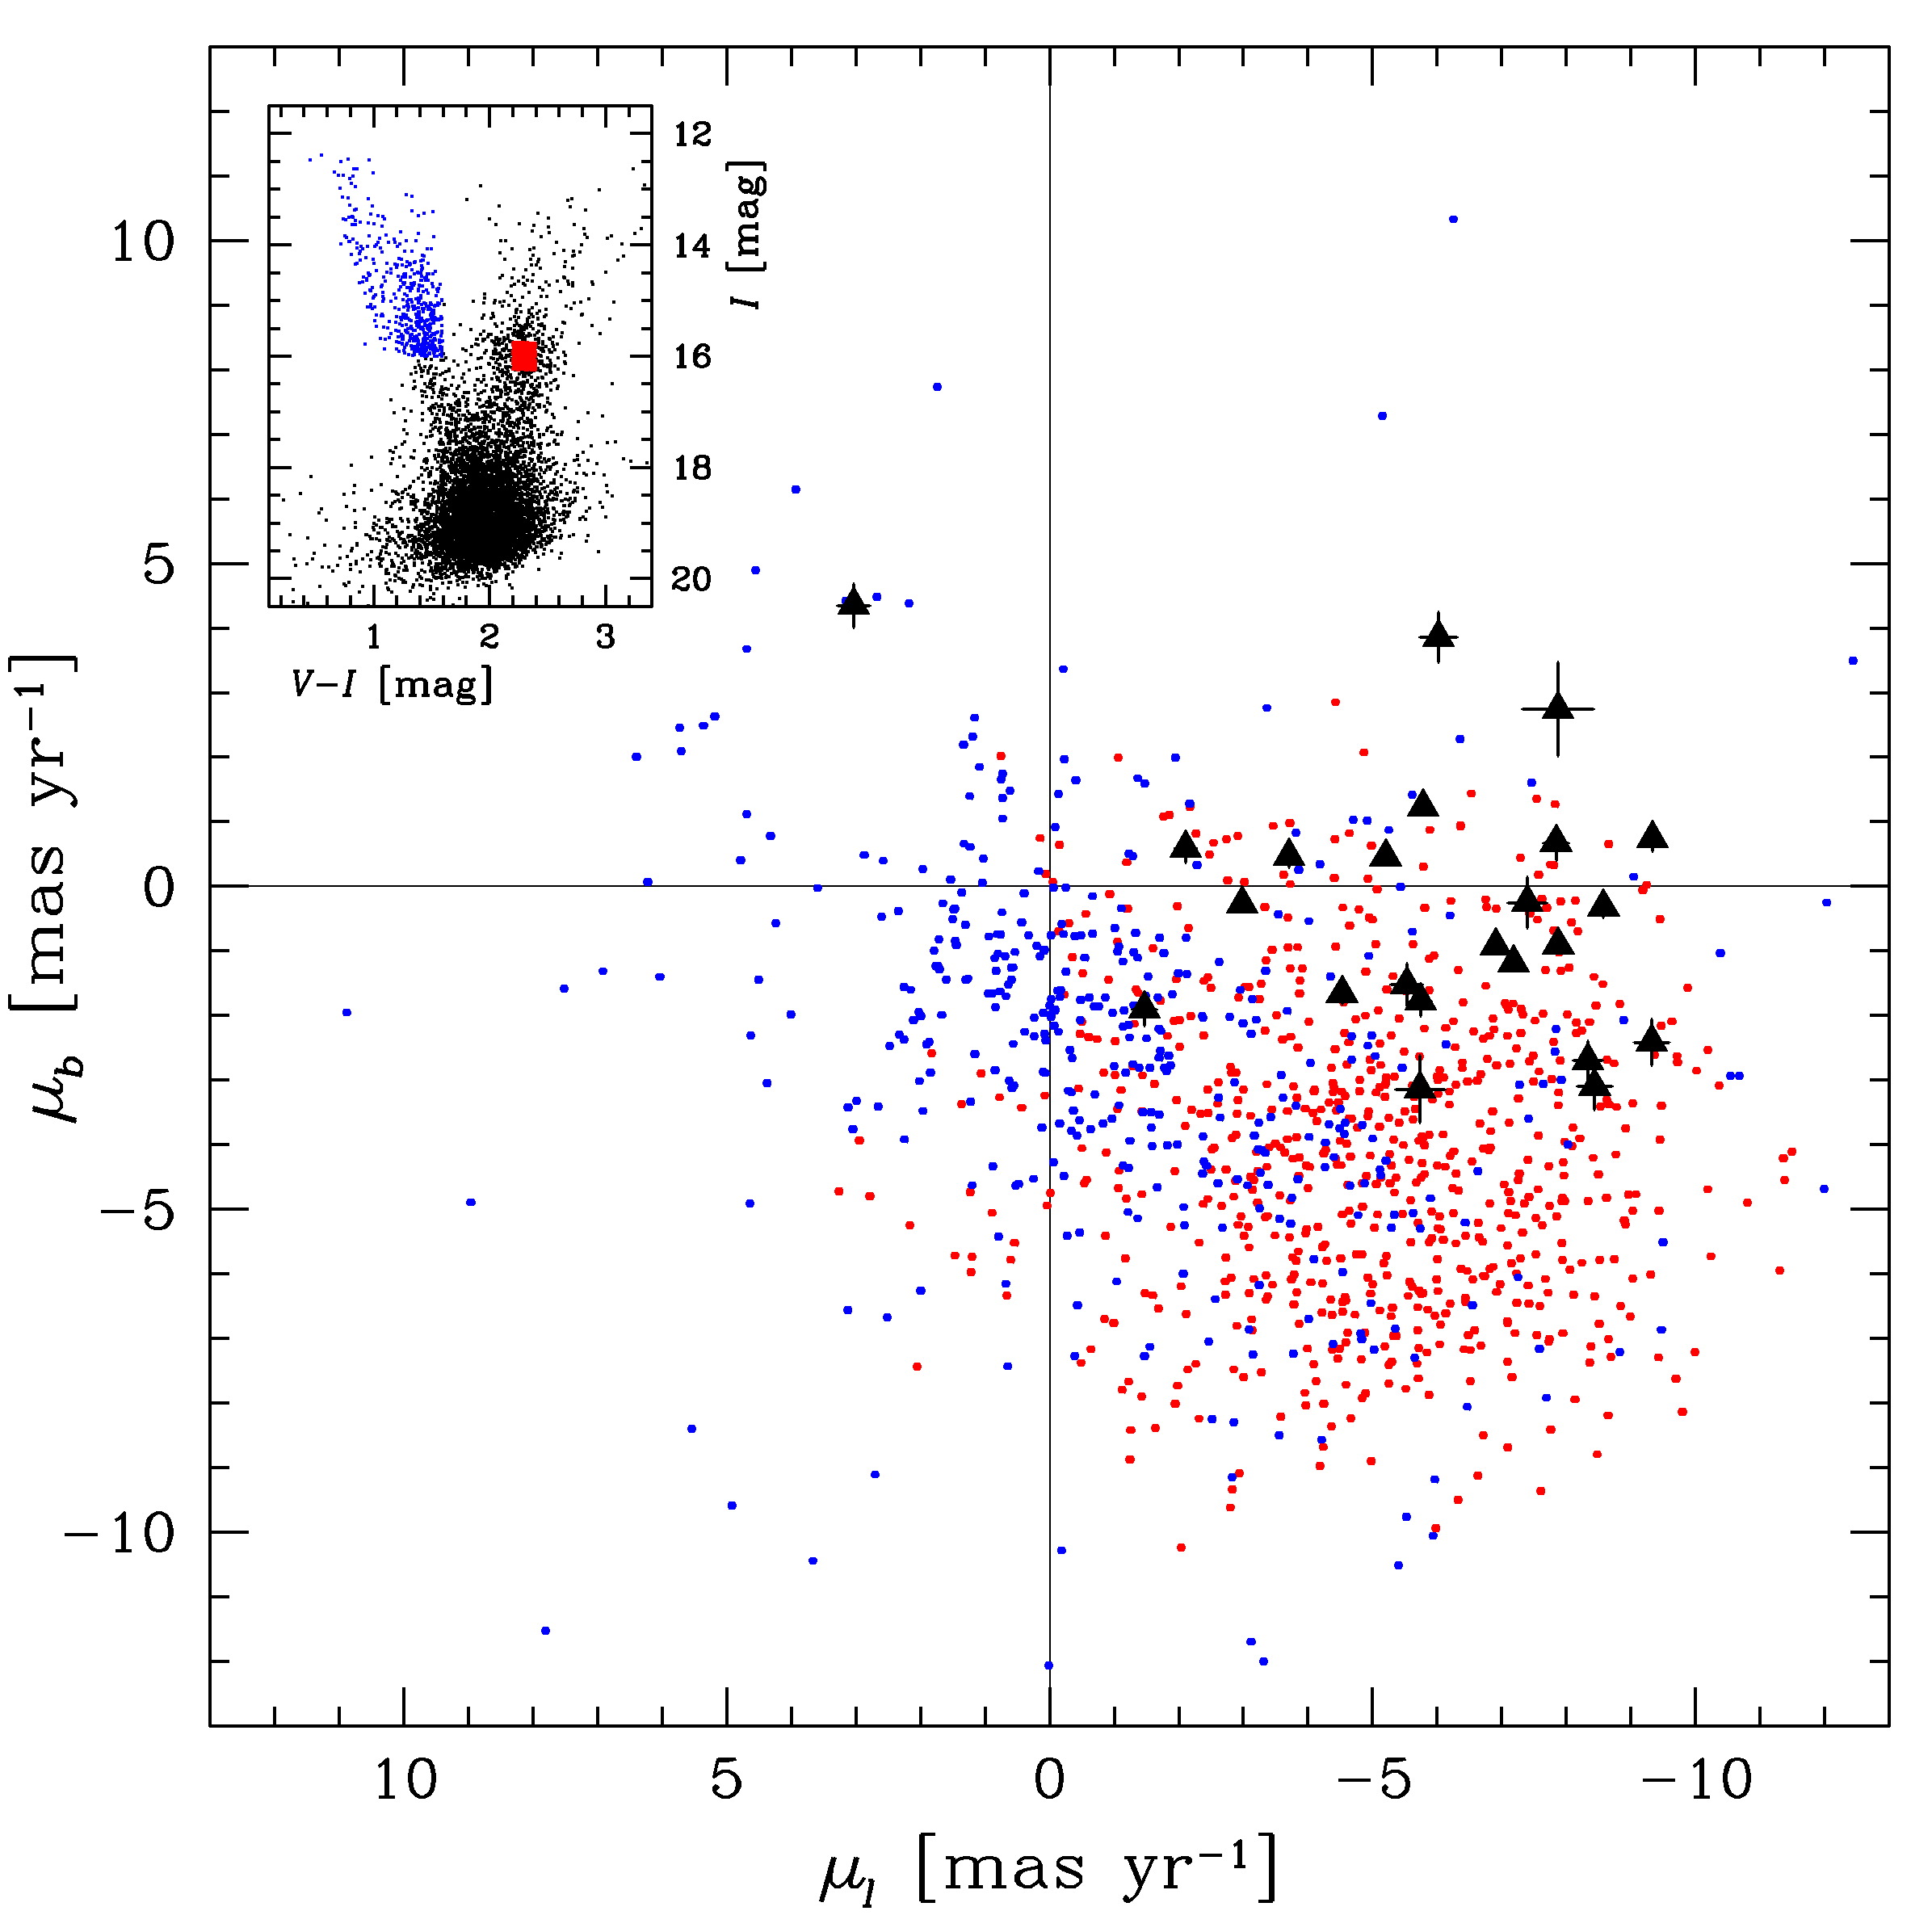
In Table 3, we list parallaxes and proper motions derived from Gaia EDR3 (Gaia Collaboration et al., 2021) for 23 BLAPs observed toward the Galactic bulge with reliable astrometric solution (the Renormalised Unit Weight Error RUWE )777The given parallaxes are not corrected for the zero point.. The proper motions were transformed from equatorial to galactic systems using equations given in Poleski (2013). The OGLE BLAPs are distant objects located at several kpc from the Sun. Unfortunately, their parallaxes have large uncertainties. Only the brightest object in the sample, OGLE-BLAP-009, has a parallax determined better than . In Fig. 13, we overlaid the positions of the BLAPs in the proper motion plane onto the positions of red clump giants from the Galactic bulge and foreground main-sequence stars from the Galactic disk. The selected stars are indicated in the attached color-magnitude diagram constructed for a OGLE-IV subfield at (,)=(,). The disk stars are not completely separated from the bulge stars in the proper motion plane, but the BLAPs group mainly around the area occupied by the latter objects. Certainly, the following two objects are in the disk: OGLE-BLAP-009 (based on the parallax) and OGLE-BLAP-013 (based on the proper motion).
| Name | |||
|---|---|---|---|
| [mas] | [mas yr-1] | [mas yr-1] | |
| OGLE-BLAP-002 | 0.30(22) | -5.53(24) | -1.52(33) |
| OGLE-BLAP-003 | 0.03(27) | -8.44(27) | -3.10(36) |
| OGLE-BLAP-004 | 0.02(20) | -2.10(16) | 0.59(22) |
| OGLE-BLAP-005 | 2.03(93) | -7.87(55) | 2.74(73) |
| OGLE-BLAP-006 | 0.21(24) | -9.32(28) | -2.41(36) |
| OGLE-BLAP-009 | 0.41(4) | -5.20(4) | 0.45(5) |
| OGLE-BLAP-010 | 0.21(10) | -6.91(8) | -0.92(11) |
| OGLE-BLAP-011 | 0.00(11) | -5.78(9) | 1.23(13) |
| OGLE-BLAP-013 | 0.52(29) | 3.04(25) | 4.35(34) |
| OGLE-BLAP-014 | 0.54(8) | -7.88(6) | -0.91(9) |
| OGLE-BLAP-016 | 1.12(23) | -7.84(20) | 0.67(27) |
| OGLE-BLAP-020 | 0.00(14) | -9.34(14) | 0.74(19) |
| OGLE-BLAP-021 | 0.26(15) | -8.58(12) | -0.32(16) |
| OGLE-BLAP-023 | 0.38(22) | -5.74(17) | -1.78(22) |
| OGLE-BLAP-026 | 0.32(24) | -8.34(23) | -2.70(31) |
| OGLE-BLAP-027 | 0.34(27) | -6.02(28) | 3.85(39) |
| OGLE-BLAP-029 | 0.34(16) | -3.71(13) | 0.47(17) |
| OGLE-BLAP-031 | 0.09(8) | -7.18(7) | -1.18(10) |
| OGLE-BLAP-032 | 0.06(22) | -1.47(19) | -1.90(25) |
| OGLE-BLAP-033 | 0.26(59) | -5.73(38) | -3.14(52) |
| OGLE-BLAP-034 | 0.54(14) | -4.53(12) | -1.66(16) |
| OGLE-BLAP-035 | 0.97(38) | -7.40(30) | -0.25(39) |
| OGLE-BLAP-036 | 0.25(6) | -2.98(6) | -0.27(9) |
5 Discussion
5.1 Period-gravity relationship: comparison with models
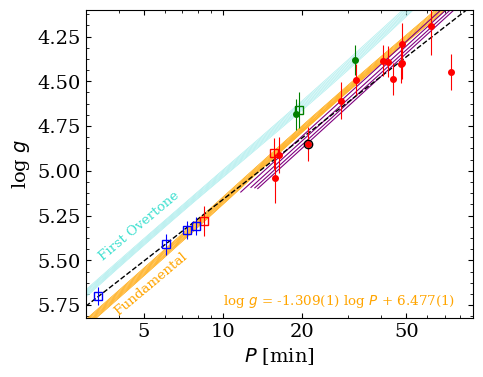
The period–luminosity (or period–gravity) relationship obtained from 19 BLAPs can be used to compare predicted and observed periods for the sample as a whole, not only on a star-to-star basis. From the theoretical relationship between and of Eq. 3, we would expect a slope of in Eq. 4. Our observations, however, return a less steep relationship with . In Fig. 14, we compare our measurements with the periods predicted for the low-mass pre-WD evolutionary models of Kupfer et al. (2019) shown in Fig. 9. The orange lines, one for each mass from 0.28 to 0.35 , form a stripe defining the predicted periods of the fundamental mode. We also show the predicted periods for the first overtone with turquoise lines. Although the stellar mass affects the period, essentially by changing the intercept of the curve, for the range of masses involved in the low-mass pre-WD models, this effect is smaller than the typical error on . The linear relation fitted to the theoretical periods, all masses included, for the fundamental mode is also indicated in Fig 14. The slope obtained, , is very close to the value expected from the approximated analytical equation. Even though the predicted and observed slopes are different, our observations are nevertheless well reproduced by the models. We also included in Fig. 14 the fundamental periods predicted for stellar models with higher masses ( ; Lin et al. 2023). In heavier objects, the fundamental periods are shifted to longer values for a given surface gravity and they are also consistent with our measurements. As mentioned in Sect. 4.5, only the longest-period object, OGLE-BLAP-022 significantly deviates from the theoretical expectations. We noted that this star also has a different light curve shape in comparison to the remaining BLAPs (see Sec. 4.1 and Fig. 1). The higher than expected from the relation indicates that it cannot be an overtone pulsator. The detection and spectroscopic observations of other long-period ( min) BLAPs would help to verify the presence of a possible break in the linear relation.
The comparison between observations and the theoretical models suggests that the majority of BLAPs pulsate in the fundamental mode. We note here that the precision of the observed period–gravity relationship is strongly limited by our uncertainties on the measurements. As shown in previous works (Pietrukowicz et al., 2017; Lin et al., 2023) and mentioned in Sec. 4.3, the surface gravity is changing during the pulsation cycle. The use of spectra averaged over one cycle, as opposed to time-resolved spectroscopy, as done by Kupfer et al. (2019) for the high-gravity BLAPs and Bradshaw et al. (2024) for OGLE-BLAP-009, brings an extra uncertainty on the value derived from the spectral fits. It is not clear yet how the surface gravity value that we derive from average spectra would compare to that estimated with time-resolved spectroscopy.
5.2 Evolutionary status
From their position in the log diagram, and the P-L relation, the majority of BLAPs could be low-mass pre-WDs. However, the peculiar pulsation properties of OGLE-BLAP-030 ( min) point toward a different evolutionary origin. We recall that this object is a multi-mode pulsator with a relatively large period change rate ( yr-1). This last characteristic is reminiscent of TMTS-BLAP-1 (Lin et al., 2023) that has a similarly large value and an intermediate period ( min). The authors found that the large of TMTS-BLAP-1 is not compatible with the predictions from low-mass pre-WDs models and instead favored a different evolutionary channel, that of a more massive object (0.7 ) in a He-shell burning phase. With its large value of , OGLE-BLAP-0512625857130 could be a similarly massive object.
The period–gravity relations for the fundamental mode of the heavier ( ) models from Lin et al. (2023) are essentially parallel and slightly below that of the fundamental mode of the pre-ELM models (see Fig. 14). Given the uncertainties on the of our BLAPs, both types of models, low-mass pre-WDs or higher-mass He-shell burning objects, reproduce similarly well the observed periods for the BLAPs with min.
Although the low-mass pre-WDs models reproduce well some characteristics of the BLAPs, they predict larger period change rates than what is observed (Romero et al., 2018). In addition, pre-WDs are contracting along their evolutionary tracks, which produces a negative value as the period decreases with time (see Eq. 1). However, three-fourths of the BLAPs have a positive value which is difficult to reconcile with the low-mass pre-WD evolution. Both positive and negative were predicted by the models of Xiong et al. (2022). The authors computed helium-burning evolutionary models for a variety of masses (0.45–1.0 ) that would reach parameters similar to those of the BLAPs (in terms of and ) during their He-shell burning, post horizontal branch, evolutionary phase.
Another evolutionary channel worth discussing is that of Zhang et al. (2023) who put forward that BLAPs can be explained by the merger of a He-core WD with a low-mass (0.6 ) main sequence star. When the resulting object undergoes He-shell flashes, before settling into full helium-core burning, it has properties typical of BLAPs (in terms of , log , and helium abundances). The pulsational properties of BLAPs are also reproduced by these post-merger models, especially the rates of period change () that can be negative or positive following the cyclic expansion and contraction of He-shell burning stars. This formation scenario also naturally explains the He-enrichment observed in the low-gravity (i.e., long-period) BLAPs and predicts the stars with a surface gravity higher than log 5.2 to be He-depleted. Their post-merger stars have masses in the range of 0.48–0.54 and the pulsation periods of the fundamental radial mode predicted by these models also agree with our observations.
Finally, we can compare some observed properties of BLAPs with the properties predicted by the evolutionary scenario in which these stars are possible surviving companions of single-degenerate Type Ia supernovae (Meng et al., 2020). In this scenario, the rates of period changes are of the order of yr-1 and they can be positive as well as negative. This is observed. The modeled companion stars have space velocities between 100 and 200 km s-1 relative to the center of mass of the binary systems. The measured RV values seem to reflect this range.
5.3 Galactic membership
A Galactic bulge membership for the majority of the He-rich BLAPs discussed in Sec. 4.7 is consistent with the large scatter in RVs that we measured in our spectroscopic sample. The values scatter from 200 to 200 km s-1, which is much larger than our typical uncertainties (1020 km s-1). This is consistent with the RV dispersion of bulge members (about 140 km s-1) versus that of foreground Galactic disk stars ( km s-1, Valenti et al., 2018).
Although we could not measure directly the metallicity of the He-rich BLAPs from iron lines, we found numerous lines of singly- or doubly-ionized elements such as carbon, nitrogen, oxygen, magnesium, aluminum, and silicon. Nitrogen is the most enhanced element, with an abundance of about 10 times the solar value. The abundances of the other elements are 2–5 times higher than in the Sun. It is thus very likely that the overall metallicity of the He-rich BLAPs is supersolar. Such an enhanced metallicity was also recently determined for OGLE-BLAP-009 (Bradshaw et al., 2024). The authors used medium-resolution time-resolved spectroscopic observations of this bright star to derive elemental abundances for ten metallic species, including Fe, and found them to be enhanced by factors between two and five compared to the solar abundances. Interestingly, nitrogen is also the most enhanced species in OGLE-BLAP-009 with an abundance of about 25 solar. If an enhanced metallicity is key in their formation process, or for their pulsational instability, this would explain the absence of BLAPs in low-metallicity environments such as globular clusters, the Galactic halo, and in the Magellanic Clouds (Pietrukowicz, 2018).
6 Summary
We reported the detection of 23 additional BLAPs to the first such pulsators found in the OGLE fields toward the inner Galactic bulge. We obtained moderate-resolution spectra of 11 BLAPs from the inner Galactic bulge fields and 3 BLAPs from the Galactic disk fields. Our analysis of the available data showed that the BLAPs form a slightly more complex class of objects than originally thought. Here, we summarize the observational facts on BLAPs.
BLAPs were discovered thanks to: (1) observations of a huge number of stars (400 million objects) toward the Milky Way’s bulge, (2) large amplitude of brightness variations ( mag), and (3) slow period changes (of an order of to yr-1). Spectroscopically confirmed BLAPs cover pulsation periods between 3.3 and 75 min. All but two stars show only one periodicity in their power spectrum, thus they are evident single-mode pulsators. Our analysis suggests that the BLAPs pulsate in the fundamental radial mode. One of the two unusual stars is the prototype, OGLE-BLAP-001, which exhibits a symmetric triplet likely due to rotational splitting with a frequency of d-1. The other star, OGLE-BLAP-030, is a triple-mode pulsator with significant amplitude and period changes. This star very likely pulsates in the fundamental mode, first overtone, and a non-radial mode. Typically, BLAPs have period change rates of few times yr-1. The rate is one order of magnitude higher in two objects: yr-1 in OGLE-BLAP-030 and yr-1 in TMTS-BLAP-1. Only a quarter of the sample has a negative period change rate. In general, the changes are irregular on timescales of months to years, but in some objects, such as OGLE-BLAP-006, 019, and 029, secular trends seem to emerge.
A characteristic feature of a BLAP light curve is the sharp maximum. BLAPs with periods of 20–40 min have light curve shapes similar to RRab-type stars, while those with periods below 20 min are more symmetric and rounded. In about half of the stars with periods longer than 40 min, an additional sinusoidal bump appears. Light curves of all objects but the mentioned OGLE-BLAP-030 are stable over years or even decades. No eclipses are seen in the 37 stars monitored by OGLE. This result practically rules out the possibility that an important fraction of BLAPs are in close binary systems.
The measured effective temperatures () of BLAPs are between 25,000 and 34,000 K, and their surface gravities () are between 4.2 and 5.7. This places the objects between the hot subdwarfs and upper main-sequence stars in the Hertzsprung-Russell diagram. We noticed a dichotomy in the helium-to-hydrogen content. Most of the analyzed stars group around dex, but the remaining stars group at dex. There appears to be a transition in the atmospheric composition of the stars, such that the shortest-period BLAPs ( min), including the high-gravity BLAPs, have a He-poor atmosphere. These He-poor BLAPs are mostly found on the hottest end ( K) of the temperature range, except for the newly discovered SMSS-BLAP-1 (Chang et al., 2024).
We showed that BLAPs follow a linear relationship between their pulsation period and surface gravity. For the first time in the case of Z-bump pulsators, we derived a period–luminosity relation. Such a relation is a powerful tool in estimating distances to the stars and verifying their membership status to stellar structures like clusters or nearby galaxies.
The majority of BLAPs observed in the OGLE Galactic bulge fields seem to reside in the bulge, while the remaining stars are in the Galactic disk. The closest object in our sample, OGLE-BLAP-009, is located at a distance of kpc, but the closest of all known BLAPs forms a binary system (HD 133729) with a main-sequence B-type star located at only about pc from the Sun. Detection of other Galactic BLAPs and more accurate distance determination should provide us the answer to the question of the true distribution of these stars in the Milky Way, whether they concentrate around the Galactic center or rather along the Galactic disk. This should also bring a hint to the origin and evolutionary status of the stars.
There is a need for further spectroscopic observations and characterization of BLAPs to measure accurately their metallicity, to understand the transition in the helium abundance, and to verify if long-period BLAPs (with min) obey the same period–gravity relationship as short-period pulsators. More accurate distance measurements to OGLE-BLAP-009 and other objects of this type are expected from future Gaia data releases and will make it possible to improve the period-luminosity relation.
References
- Bellm et al. (2019) Bellm, E. C., Kulkarni, S. R., Graham, M. J., et al. 2019, PASP, 131, 018002, doi: 10.1088/1538-3873/aaecbe
- Borowicz et al. (2023) Borowicz, J., Pietrukowicz, P., Mróz, P., et al. 2023, Acta Astron., 73, 1, doi: 10.32023/0001-5237/73.1.1
- Bradshaw et al. (2024) Bradshaw, C. W., Dorsch, M., Kupfer, T., et al. 2024, MNRAS, 527, 10239, doi: 10.1093/mnras/stad3845
- Brassard et al. (2010) Brassard, P., Fontaine, G., Chayer, P., & Green, E. M. 2010, in American Institute of Physics Conference Series, Vol. 1273, 17th European White Dwarf Workshop, ed. K. Werner & T. Rauch, 259–262, doi: 10.1063/1.3527817
- Byrne & Jeffery (2018) Byrne, C. M., & Jeffery, C. S. 2018, MNRAS, 481, 3810, doi: 10.1093/mnras/sty2545
- Byrne & Jeffery (2020) —. 2020, MNRAS, 492, 232, doi: 10.1093/mnras/stz3486
- Byrne et al. (2021) Byrne, C. M., Stanway, E. R., & Eldridge, J. J. 2021, MNRAS, 507, 621, doi: 10.1093/mnras/stab2115
- Chang et al. (2024) Chang, S.-W., Wolf, C., Onken, C. A., & Bessell, M. S. 2024, MNRAS, 529, 1414, doi: 10.1093/mnras/stae637
- Córsico et al. (2018) Córsico, A. H., Romero, A. D., Althaus, L. G., Pelisoli, I., & Kepler, S. O. 2018, arXiv e-prints, arXiv:1809.07451, doi: 10.48550/arXiv.1809.07451
- Dziembowski (1977) Dziembowski, W. 1977, Acta Astron., 27, 95
- Gaia Collaboration et al. (2018) Gaia Collaboration, Brown, A. G. A., Vallenari, A., et al. 2018, A&A, 616, A1, doi: 10.1051/0004-6361/201833051
- Gaia Collaboration et al. (2021) —. 2021, A&A, 649, A1, doi: 10.1051/0004-6361/202039657
- Hirsch & Heber (2009) Hirsch, H., & Heber, U. 2009, in Journal of Physics Conference Series, Vol. 172, Journal of Physics Conference Series, 012015, doi: 10.1088/1742-6596/172/1/012015
- Hubeny & Lanz (2011a) Hubeny, I., & Lanz, T. 2011a, TLUSTY: Stellar Atmospheres, Accretion Disks, and Spectroscopic Diagnostics, Astrophysics Source Code Library, record ascl:1109.021. http://ascl.net/1109.021
- Hubeny & Lanz (2011b) —. 2011b, Synspec: General Spectrum Synthesis Program, Astrophysics Source Code Library, record ascl:1109.022. http://ascl.net/1109.022
- Iwanek et al. (2019) Iwanek, P., Soszyński, I., Skowron, J., et al. 2019, ApJ, 879, 114, doi: 10.3847/1538-4357/ab23f6
- Kilkenny et al. (1999) Kilkenny, D., Koen, C., Jeffery, C. S., Hill, N. C., & O’Donoghue, D. 1999, MNRAS, 310, 1119, doi: 10.1046/j.1365-8711.1999.03012.x
- Kupfer et al. (2019) Kupfer, T., Bauer, E. B., Burdge, K. B., et al. 2019, ApJ, 878, L35, doi: 10.3847/2041-8213/ab263c
- Lin et al. (2023) Lin, J., Wu, C., Wang, X., et al. 2023, Nature Astronomy, 7, 223, doi: 10.1038/s41550-022-01783-z
- Lindegren et al. (2021) Lindegren, L., Bastian, U., Biermann, M., et al. 2021, A&A, 649, A4, doi: 10.1051/0004-6361/202039653
- Macfarlane et al. (2015) Macfarlane, S. A., Toma, R., Ramsay, G., et al. 2015, MNRAS, 454, 507, doi: 10.1093/mnras/stv1989
- McWhirter & Lam (2022) McWhirter, P. R., & Lam, M. C. 2022, MNRAS, 511, 4971, doi: 10.1093/mnras/stac291
- Meng et al. (2020) Meng, X.-C., Han, Z.-W., Podsiadlowski, P., & Li, J. 2020, ApJ, 903, 100, doi: 10.3847/1538-4357/abbb8e
- Mróz et al. (2015) Mróz, P., Udalski, A., Poleski, R., et al. 2015, Acta Astron., 65, 313, doi: 10.48550/arXiv.1601.02617
- Naslim et al. (2010) Naslim, N., Jeffery, C. S., Ahmad, A., Behara, N. T., & Şahìn, T. 2010, MNRAS, 409, 582, doi: 10.1111/j.1365-2966.2010.17324.x
- Nataf et al. (2013) Nataf, D. M., Gould, A., Fouqué, P., et al. 2013, ApJ, 769, 88, doi: 10.1088/0004-637X/769/2/88
- Netzel et al. (2022) Netzel, H., Pietrukowicz, P., Soszyński, I., & Wrona, M. 2022, MNRAS, 510, 1748, doi: 10.1093/mnras/stab3555
- Pecaut & Mamajek (2013) Pecaut, M. J., & Mamajek, E. E. 2013, ApJS, 208, 9, doi: 10.1088/0067-0049/208/1/9
- Pietrukowicz (2018) Pietrukowicz, P. 2018, in The RR Lyrae 2017 Conference. Revival of the Classical Pulsators: from Galactic Structure to Stellar Interior Diagnostics, ed. R. Smolec, K. Kinemuchi, & R. I. Anderson, Vol. 6, 258–262, doi: 10.48550/arXiv.1802.04405
- Pietrukowicz et al. (2015) Pietrukowicz, P., Latour, M., Angeloni, R., et al. 2015, Acta Astron., 65, 63, doi: 10.48550/arXiv.1503.03499
- Pietrukowicz et al. (2013) Pietrukowicz, P., Dziembowski, W. A., Mróz, P., et al. 2013, Acta Astron., 63, 379, doi: 10.48550/arXiv.1311.5894
- Pietrukowicz et al. (2017) Pietrukowicz, P., Dziembowski, W. A., Latour, M., et al. 2017, Nature Astronomy, 1, 0166, doi: 10.1038/s41550-017-0166
- Pigulski et al. (2022) Pigulski, A., Kotysz, K., & Kołaczek-Szymański, P. A. 2022, A&A, 663, A62, doi: 10.1051/0004-6361/202243293
- Poleski (2013) Poleski, R. 2013, arXiv e-prints, arXiv:1306.2945, doi: 10.48550/arXiv.1306.2945
- Ramsay et al. (2022) Ramsay, G., Woudt, P. A., Kupfer, T., et al. 2022, MNRAS, 513, 2215, doi: 10.1093/mnras/stac1000
- Romero et al. (2018) Romero, A. D., Córsico, A. H., Althaus, L. G., Pelisoli, I., & Kepler, S. O. 2018, MNRAS, 477, L30, doi: 10.1093/mnrasl/sly051
- Schwarzenberg-Czerny (1996) Schwarzenberg-Czerny, A. 1996, ApJ, 460, L107, doi: 10.1086/309985
- Soszyński et al. (2016) Soszyński, I., Pawlak, M., Pietrukowicz, P., et al. 2016, Acta Astron., 66, 405, doi: 10.48550/arXiv.1701.03105
- Soszyński et al. (2019) Soszyński, I., Udalski, A., Wrona, M., et al. 2019, Acta Astron., 69, 321, doi: 10.32023/0001-5237/69.4.2
- Stroeer et al. (2007) Stroeer, A., Heber, U., Lisker, T., et al. 2007, A&A, 462, 269, doi: 10.1051/0004-6361:20065564
- Tody (1986) Tody, D. 1986, in Society of Photo-Optical Instrumentation Engineers (SPIE) Conference Series, Vol. 627, Instrumentation in astronomy VI, ed. D. L. Crawford, 733, doi: 10.1117/12.968154
- Tody (1993) Tody, D. 1993, in Astronomical Society of the Pacific Conference Series, Vol. 52, Astronomical Data Analysis Software and Systems II, ed. R. J. Hanisch, R. J. V. Brissenden, & J. Barnes, 173
- Udalski et al. (1997) Udalski, A., Kubiak, M., & Szymanski, M. 1997, Acta Astron., 47, 319, doi: 10.48550/arXiv.astro-ph/9710091
- Udalski et al. (2002) Udalski, A., Szewczyk, O., Zebrun, K., et al. 2002, Acta Astron., 52, 317, doi: 10.48550/arXiv.astro-ph/0301210
- Udalski et al. (2004) Udalski, A., Szymanski, M. K., Kubiak, M., et al. 2004, Acta Astron., 54, 313, doi: 10.48550/arXiv.astro-ph/0411543
- Udalski et al. (2008) Udalski, A., Szymanski, M. K., Soszynski, I., & Poleski, R. 2008, Acta Astron., 58, 69, doi: 10.48550/arXiv.0807.3884
- Udalski et al. (2015) Udalski, A., Szymański, M. K., & Szymański, G. 2015, Acta Astron., 65, 1, doi: 10.48550/arXiv.1504.05966
- Valenti et al. (2018) Valenti, E., Zoccali, M., Mucciarelli, A., et al. 2018, A&A, 616, A83, doi: 10.1051/0004-6361/201832905
- Wozniak (2000) Wozniak, P. R. 2000, Acta Astron., 50, 421, doi: 10.48550/arXiv.astro-ph/0012143
- Wrona et al. (2022) Wrona, M., Ratajczak, M., Kołaczek-Szymański, P. A., et al. 2022, ApJS, 259, 16, doi: 10.3847/1538-4365/ac4018
- Wu & Li (2018) Wu, T., & Li, Y. 2018, MNRAS, 478, 3871, doi: 10.1093/mnras/sty1347
- Xiong et al. (2022) Xiong, H., Casagrande, L., Chen, X., et al. 2022, A&A, 668, A112, doi: 10.1051/0004-6361/202244571
- Zhang et al. (2023) Zhang, X., Jeffery, C. S., Su, J., & Bi, S. 2023, ApJ, 959, 24, doi: 10.3847/1538-4357/ad0a65