Validating Traces of Distributed Programs
Against \tlaplusSpecifications††thanks: This work was partly supported by a grant from Oracle Corporation.
Abstract
\tlaplusis a formal language for specifying systems, including distributed algorithms, that is supported by powerful verification tools. In this work we present a framework for relating traces of distributed programs to high-level specifications written in \tlaplus. The problem is reduced to a constrained model checking problem, realized using the TLC model checker. Our framework consists of an API for instrumenting Java programs in order to record traces of executions, of a collection of \tlaplusoperators that are used for relating those traces to specifications, and of scripts for running the model checker. Crucially, traces only contain updates to specification variables rather than full values, and it is not necessary to provide values for all variables. We have applied our approach to several distributed programs, detecting discrepancies between the specifications and the implementations in all cases. We discuss reasons for these discrepancies, how to interpret the verdict produced by TLC, and how to take into account the results of trace validation for implementation development.
1 Introduction
Distributed systems are at the heart of modern cloud services and they are known to be error-prone, due to phenomena such as delays or failures of nodes and communication networks. Applying formal methods in the design and development of these systems can help increase the confidence in their correctness and resilience. For example, the \tlaplus[16] specification language and verification tools have been successfully used in industry [20, 24] for designing distributed algorithms underlying modern cloud systems. \tlaplusand similar specification formalisms are most useful for describing and analyzing systems at high levels of abstraction, but do not provide support for checking that actual implementations of these systems are correct. Although \tlaplussupports a notion of refinement, formally proving a chain of refinements from a high-level design of a distributed algorithm to an actual implementation would be a daunting task, complicated by the fact that standard programming languages do not provide explicit control of the grain of atomicity of the running program. In this work, we present a lightweight approach to validating distributed programs against high-level specifications that relies on recording finite traces of program executions and leveraging the \tlaplusmodel checker TLC [28] for comparing those traces to the state machine described in the \tlaplusspecification. Although this approach does not provide formal correctness guarantees, even when the \tlaplusspecification has been extensively verified, we have found it very useful for discovering and analyzing discrepancies between the runs of distributed programs and their high-level specifications, including serious bugs that had gone undetected by more traditional quality assurance techniques.
The collection of program traces relies on an instrumentation of the program in order to record information on how program operations correspond to updates of the variables representing the state of the \tlaplusspecification, and potentially indicating the corresponding transition in the specification. We have designed a Java library that facilitates this instrumentation and can be used to produce traces in JSON format. Because the traces record the evolution of the state of the \tlaplusspecification, our approach is easiest to apply when the specification exists prior to building the implementation, the implementor is familar with it, and uses it as a blueprint when writing the code. However, we have also used the approach in order to “reverse engineer” a \tlaplusspecification from an existing distributed program and better understand its operation. Trace validation can also help ensure that the specification and implementation remain in sync over time because it is easy to apply it again when the specification or the implementation changes.
The main problem when instrumenting a program is to identify suitable “linearization points” at which the program completes a step that corresponds to an atomic transition of the high-level state machine. Basic guiding principles are to log an event when shared state has been updated, such as when sending or receiving messages, performing operations on locks or on stable data storage. We discuss how to account for different grain of atomicity between the specification and the implementation based on feedback from trace validation. Because data representation generally differs between the \tlaplusspecification and the actual program, it may be difficult or impractical to compute the value of a high-level variable (or its update) corresponding to the data manipulated by the implementation. We therefore allow traces to be incomplete and only record some information about the corresponding abstract state. We reduce the problem of trace validation to one of constrained model checking and show how TLC can reconstruct missing information. This leads to a tradeoff between the precision of information recorded in the trace (and potentially of the verdict of validation) and the amount of search that TLC must perform during model checking.
The paper is organized as follows: Section 2 provides some background on \tlaplusand introduces our running example, both in \tlaplusand as a Java program. Our approach to instrumentation is described in Section 3. In Section 4 we formalize the trace validation problem, describe how we realized the approach using TLC, and discuss our experience with it. Section 5 discusses related work, and Section 6 concludes the paper and presents some perspectives for future work.
2 Background
2.1 \tlaplusSpecifications
[16] is a specification language based on Zermelo-Fraenkel set theory and linear-time temporal logic that has found wide use for writing high-level specifications of concurrent and distributed algorithms. It emphasizes the use of mathematical descriptions based on sets and functions for specifying data structures. \tlaplusis a state-based specification formalism: the state space of a system is represented using variables, and \tlaplusformulas are evaluated over behaviors, i.e., sequences of states that assign values to variables. Algorithms are described as state machines whose specifications are written in the canonical form
In this formula, is a state predicate describing the possible initial states of the system, represents the next-state relation, usually written as the disjunction of actions describing the possible state transitions, is a tuple containing all state variables that appear in the specification, and is a temporal formula asserting liveness and fairness assumptions. A state predicate is a formula of first-order logic containing state variables, and it is evaluated over single states. A transition predicate (or, synonymously, action) is a first-order formula that may contain unprimed and primed occurrences of state variables. Such a formula is evaluated over a pair of states, with unprimed variables referring to the values before the transition and primed variables to the values after the transition. The formula holds of any pair of states if either holds of (and therefore the pair represents an actual step of the system) or all variables in evaluate to the same values in the two states (and the pair represents a stuttering step). Systematically allowing for stuttering steps enables the implementation of a system specification by a lower-level specification to be represented as validity of implication between the \tlaplusformulas expressing the specifications. The complementary property is used to express fairness assumptions and is at the basis of verifying liveness properties of algorithms. Since in this work we only analyze finite traces of programs, we ignore liveness properties and are interested in finite behaviors, i.e., sequences of states such that holds of and holds for all pairs for .
3 Instrumenting Distributed Programs
Our objective in this work is to check traces of program executions against a \tlaplusspecification of the algorithm the program is expected to implement. In order to obtain such traces (in JSON format), we instrument implementations so that events that correspond to actions of the \tlaplusspecification are recorded. Each entry in the trace contains information about updates of state variables, and optionally about the \tlaplus action the updates correspond to.
The approach is applicable to programs written in any imperative language, here we focus on Java. We designed a Java library that provides primitives for tracing the events in the implementation. Section 4 will describe the structure of \tlaplustemplate (trace) specifications used to process the traces generated in this way and check if they correspond to the high-level specification.
The main class of the library, TLATracer, provides the methods for logging events and state variable updates.
The method getTracer creates a tracer that logs events into a file specified by the tracePath parameter. Each tracer records the time of each event using a shared clock, ensuring that events are recorded in chronological order both locally (within individual components) and globally (across all components). While each component uses a unique tracePath for its tracer, all tracers synchronize their timing using the same type of clock. The library offers various types of clocks suitable for different scenarios: an in-memory clock is used when components are threads within the same process; a file-based clock is used for processes on the same machine; and a server-based clock is appropriate for distributed components. Additionally, a logical clock, which provides a mechanism for ordering events without synchronizing actual time, can also be used to order events across different tracers.
Updates to variables are tracked using the method notifyChange, which records operations that have been applied to a given variable. The variable name varName refers to a variable from the \tlaplus specification but reflects the operations executed at the implementation level and thus, notifyChange implicitly links the variables from the implementation to the ones in the specification. Our library supports standard operators such as updating the variable by a new value, adding or removing a value to or from a set or bag (multi-set), overriding the value of individual fields (identified using the path argument) of functions or records, etc. The list of arguments for the respective operator is specified with args.111The library (available at https://github.com/lbinria/trace_validation_tools/) offers primitives to log such operations in a more compact way, but these are just convenient syntactic sugar for the notifyChange method.
The log method is used to produce one log entry in the trace file that reflects all the variable changes recorded with notifyChange since the last call to log (or since the start of the process if log was never called before). In its general form, the log method records the variable changes as well as the event name and its parameters, provided as arguments of the log method. Variants of the log method ignore the event or its parameters. The time when the log has been performed is used as a timestamp for the corresponding entry; this value is returned by the method.
For example, in the sendPrepared method, an RM sets its state to "prepared" and sends a corresponding message to the TM (lines and , respectively).
The remaining lines are used for tracing purposes. Line records the change of the entry corresponding to the RM executing sendPrepared of the \tlaplusvariable rmState to the new value "prepared". Similarly, line indicates that a message of type "Prepared" from the current RM is added to the set msgs. Finally, in line these changes are logged as corresponding to the \tlaplusaction RMPrepare with the current RM as parameter.
For an RM named "rm-0", the above listing produce the following log entry in JSON format:222The JSON schema of a trace entry is given in the appendix.
{ "clock": , "rmState": [ { "op": "Update", "path": ["rm-0"], "args": ["prepared"] } ], "msgs": [ { "op": "AddElement", "path": [], "args": ["type":"Prepared","rm":"rm-0"] } ], "event": "RMPrepare", "event_args": ["rm-0"] }
It should be noted that neither all updates to specification variables nor the name or the parameters of the corresponding \tlaplusaction need to be traced. For example, the size of the value of a variable might be prohibitively large, or the value might simply be unknown, for example because the implementation handles encrypted values. In the above example, either or both calls to notifyChange could have been omitted. As discussed in Section 4, the model checker will fill in suitable values for variables omitted from tracing. However, providing more detailed information can lead to more efficient validation and strengthen confidence in the results.
The library also provides a Python script that merges the trace files of the different traced processes by sorting the entries according to the timestamp and stripping off the clock values from the entries in the resulting file as well as a script that can be used to validate the obtained trace with TLC.
4 Checking Program Traces Against \tlaplusSpecifications
Having obtained a log from an execution of the distributed Java program, we must check if this log matches some behavior of the \tlaplusspecification that the program is claimed to implement. We first define the problem more formally, then explain how we realize trace validation using the TLC model checker, report our experience with applying this approach to several case studies, and finally discuss some technical aspects of trace validation.
4.1 The trace validation problem
Trace of implementation
State space of \tlaplusspecification
Formally, our problem can be stated as follows. Let be the set of finite behaviors that satisfy the specification , and let be the set of finite behaviors that are compatible with the trace when assigning arbitrary values to the state variables whose values are not fixed. The trace matches the specification if .
Figure 1 illustrates the idea. On the left-hand side, the chain of nodes labeled 1 to 7 represents the trace obtained from the instrumented program. The graph on the right-hand side represents the state space of the \tlaplusspecification, and we must check if the trace can be matched to some path in the state space. The first state of the trace must correspond to some initial state of the graph: in our example, we assume that this is the case for the state in the lower left-hand corner. Then, we try to match at least one successor of an already matched state with the corresponding successor in the trace. Because the trace need not indicate values for all state variables, there may be several matching states: in the example, we assume that two successors of the state labeled 1 match the second state of the trace. On the other hand, the state labeled 3 in the left-hand column of the state space does not have a successor matching the state labeled 4 in the trace. Overall, the trace of the example is valid since there is at least one (in fact, two) matching paths up to the last state (labeled 7) of the trace.
The problem is actually a little more subtle: the grain of atomicity of the implementation need not be perfectly aligned with that of the specification, and an implementation step may correspond to zero or several steps of the \tlaplusspecification. We explain how we reduce the problem to one of constrained model checking and how we realize it using the TLC model checker.
4.2 Realizing trace validation using the TLC model checker
The set of finite behaviors satisfying the high-level specification is defined by the \tlaplusformula . In order to characterize the intersection of finite behaviors that also correspond to the trace obtained from the execution, we add constraints to that require the values of variables after the transition to agree with those indicated in the trace. Concretely, our framework provides a module TraceSpec that contains operators that are instrumental for defining the constrained specification.
The module declares a variable l that will denote the current line of the trace. The definition of the operator Trace causes the JSON representation of the trace to be internalized as a sequence of records whose fields correspond to the entries of the log file. The operator IsEvent(e) encapsulates processing the trace and generating the constraints imposed by it. It requires that l is a valid index into the trace. The trace may explicitly indicate the event corresponding to the current transition by including an "event" field, in which case the operator checks for the expected value. (Any event parameters indicated by the entry are taken into account below.) It then increments the variable l and adds constraints based on the informations given in the current line of the trace, by evaluating the operator UpdateVariables:
* similar lines for variables tmState, tmPrepared, msgs
That operator is defined as a conjunction that checks for each variable of the original specification if a corresponding entry exists in the current line of the trace and, if so, determines the new value of the variable from that entry. The operator UpdateVariable is predefined in our framework and computes the new value from the value of the first argument (i.e., the unprimed variable) and the operator to be applied according to the trace. For example, the JSON entry
"rmState": [ { "op": "Update", "path": ["rm-0"], "args": ["prepared"] } ]
will give rise to the \tlaplusvalue
that denotes the function rmState for which the value at argument rmState["rm-0"] is replaced by "prepared". A single update in the JSON trace may correspond to changes to several parts of a complex value such as a function or a record. Predefined \tlaplusoperators exist for the different operators that our framework currently supports, and this can be smoothly extended, both in the instrumentation library and at the \tlapluslevel, should additional operators be desirable.
For every action of the original specification, we then construct an action of the trace specification by conjoining the predicate IsEvent. For example, the action of the trace specification corresponding to the TMCommit action of the specification of the two-phase commit protocol is defined as
For actions that take arguments, the IsEvent predicate is conjoined with a check if the trace provides such arguments, in which case the corresponding instance of the action should occur:
The overall next-state relation TraceNext is defined as the disjunction of these actions. Because TLC evaluates formulas from left to right, the effect of these definitions is to first update state variables based on the information in the log and then evaluate the action predicate of the underlying specification, checking that the predicate is satisfied and non-deterministically generating suitable values for any variables that are left open in the trace.
If the next-state relation does not evaluate to true, no behavior of the base specification matching the trace exists from the current state. However, there may still exist another matching behavior elsewhere in the state space: in the example of Fig. 1, no suitable successor state can be found from the state labeled 3 in the leftmost column, but the behavior can be continued from the state labeled 3 in the bottom row of the state space. Therefore, we should not use TLC to check for deadlocks of the constrained specification, or for violations of a liveness property such as (l>=Len(Trace)), but rather for the existence of some path matching the length of the trace. The length of the longest path in the constrained state space corresponds to the diameter of the graph,333Observe that the presence of the line counter l excludes cycles in the constrained state space. which suggests defining the predicate
as the postcondition to check for determining success of trace validation.
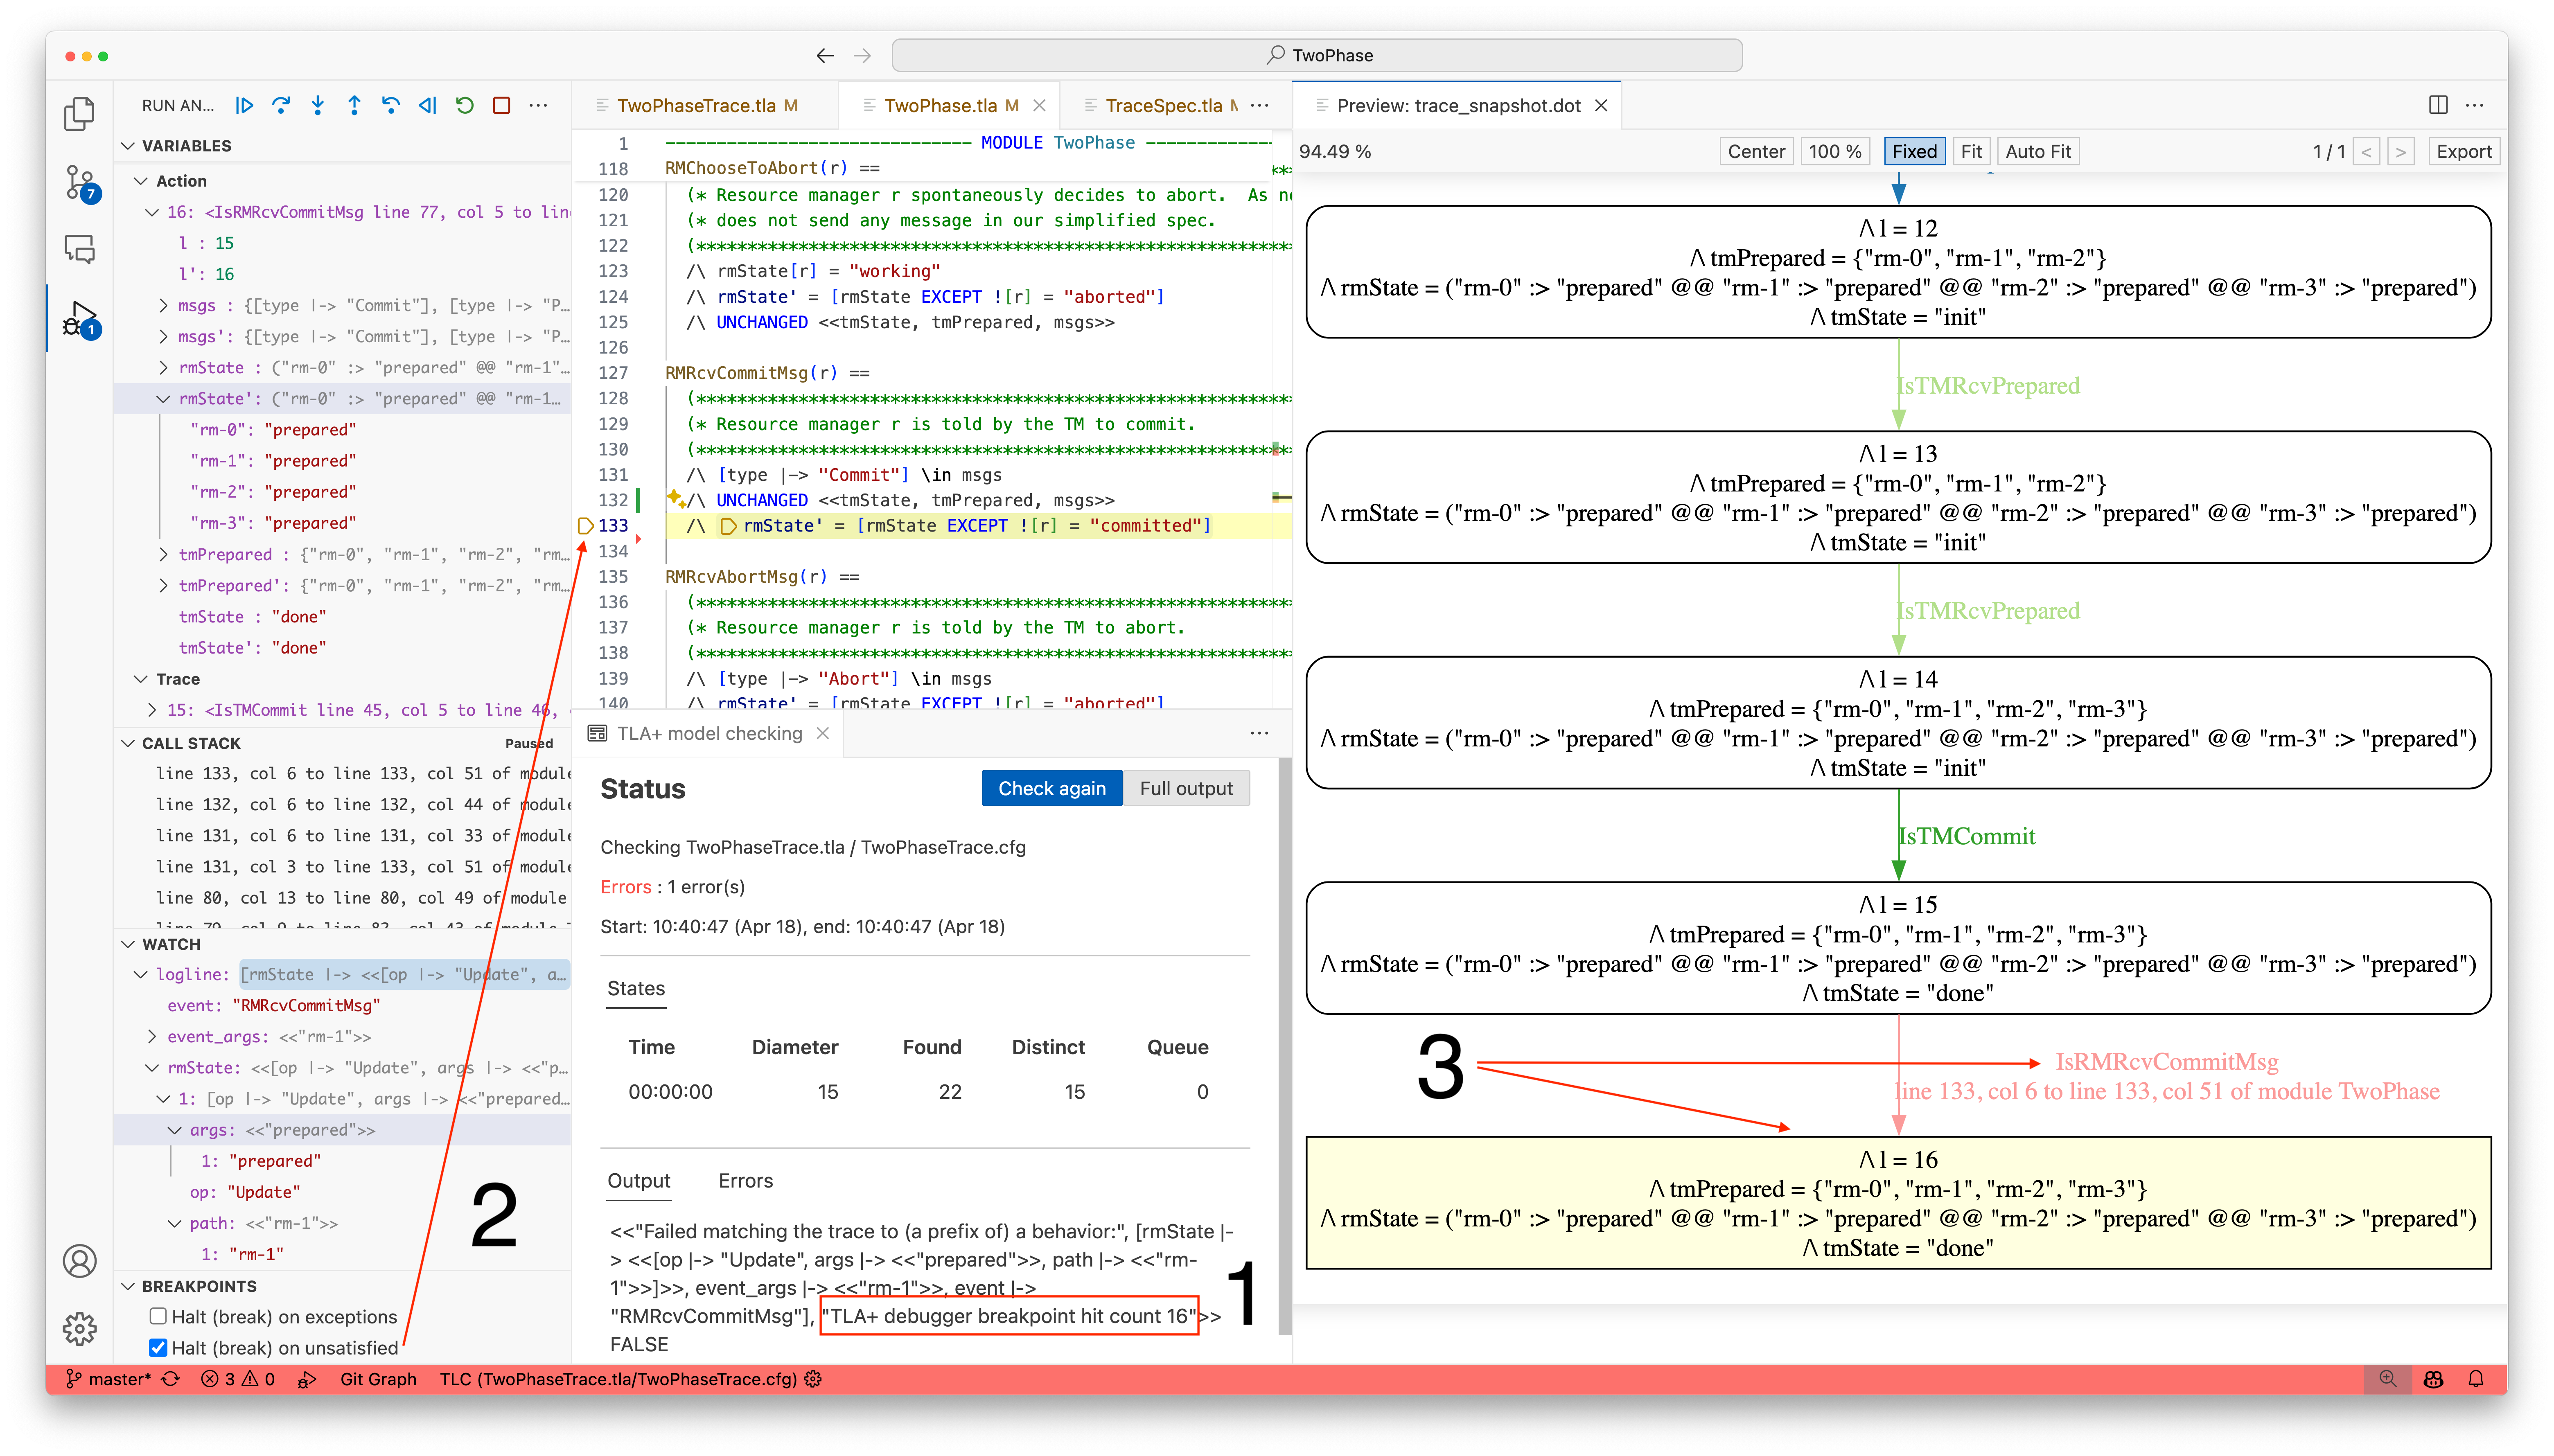
Contrary to ordinary model checking, a violation of the condition , corrresponding to , does not produce a counterexample. However, the behaviors within help explain why an implementation trace fails to conform to the specification. In instances of zero non-determinism in the constrained specification, where , it is advisable to examine the final state of the behavior and the corresponding line in the trace to identify the source of the mismatch. For more complex specifications involving multiple variables and actions, the hit-based breakpoint feature of the \tlaplusdebugger [15] can be used to halt state-space exploration when the diameter reported by TLC matches the value of a reported violation. Once halted, the debugger allows the user to step back and forth through the evaluation of action formulas to pinpoint the discrepancy. Additionally, the \tlaplusdebugger displays the values of variables at both the current and successor states, facilitating a comparison with the trace values. With , we provide a new unsatisfied breakpoint that activates for each state in that is found to be unreachable. Furthermore, can be visualized as a graph that not only includes all unreachable states but also references the subformula responsible for the state being unreachable (see Fig. 2).
4.3 Experience with Trace Validation
We have used trace validation for several case studies: besides the two-phase commit protocol presented here, we experimented with a distributed key-value store ensuring snapshot isolation [5] whose specification was taken from the standard collection of \tlaplusspecifications (see [17]), the distributed termination detection algorithm EWD 998 [3, 13] from the same collection, two existing implementations of the Raft consensus algorithm [22], and the Microsoft Confidential Consortium Framework [10]. In all cases, trace validation quickly identified executions of the distributed implementations that could not be matched to the high-level specification. Such mismatches may indicate that the implementation does not adhere to the state machine described in the high-level specification – either because of an error in the implementation, a mismatch in the grain of atomicity, or because the specification is too strict.
Assume for example that the implementation of the Two-Phase Commit protocol used Java Lists to store the set of resource managers prepared to carry out the transaction, corresponding to the variable tmPrepared of the \tlaplusspecification, and implemented method checkAllPrepared by comparing the length of that list to the number of resource managers. Such an implementation would work correctly if no messages are lost. However, if some RM resends the "Prepared" message due to a timeout, the TM could add it twice to the list of prepared RMs and then commit prematurely. We found this kind of implementation error to be reliably detected using trace validation.
The key-value store specification describes operations such as adding a key-value pair or updating the value of an existing key to be performed transactionally. At the beginning of a transaction, a snapshot of the global store is copied locally, and at the end of the transaction the operations performed to the local store are copied back to the global store if no other agent committed some operations on the same keys in the meantime. Operations have preconditions: for example, the key has to already exist (in the local copy) when performing an update. Instead of making a local copy of the store (which could be prohibitively large), our implementation444The implementation is available at https://github.com/lbinria/KeyValueStore/. only stores the operations performed during the transaction. Preconditions are checked against the values contained in the operations performed during the transaction and against the store if no operations were performed locally. With such an implementation, a precondition could be false at the beginning of the transaction and thus, the corresponding operation not possible w.r.t. to the specification, but it could be true later on, if another agent committed an appropriate value for the corresponding key in the meantime. This discrepancy was detected when we performed trace validation on the implementation, and the debugger helped us understand the problem.
In some cases, trace validation indicates problems that are due to the fact that the grains of atomicity of the implementation and the specification do not agree. Programming languages typically do not provide atomic transactions encapsulating several updates, so the choice of when to log an action corresponding to the \tlaplusspecification requires consideration. Transitions that modify shared state such as sending and receiving network messages, acquiring or releasing global locks or committing state to stable storage are natural candidates. Some care must be taken in order not to break the causal ordering of such events, for example by logging a state update before the corresponding message is received, due to the internal structure of the implementation. Overall, we and the engineers we worked with found it not too difficult to identify suitable points in the code for instrumentation, but the choices are important for trace validation to be meaningful.
It frequently happens that the implementation may take steps that are invisible for the abstract state space. In our running example, sent messages are (permanently) stored in a set, so resending a message due to a timeout simply corresponds to a stuttering step of the specification. However, the trace may indicate that an RMPrepare step took place whenever a "Prepared" message was sent, even in the case of a resend. Trace validation will then fail because RMPrepare steps cannot be stuttering steps (observe that such steps require the variable rmState to change). A simple fix in such cases is not to indicate the corresponding action of the \tlaplusspecification: TLC will then correctly map the step in the trace to a stuttering step of the abstract specification. The fact that \tlaplusspecifications are insensitive to stuttering steps is helpful in such situations.
Less frequently, an implementation may combine two or more steps of the high-level specification into a single transition. For example, in Raft implementations, nodes may update their term upon receiving an AppendEntries request for a higher term, whereas the two actions of updating the term and appending entries are distinguished in the Raft specification. In such cases, an explicit decision must be taken if such behavior is deemed acceptable. If it is (as in the Raft example), the next-state relation of the \tlaplusspecification used for trace validation may contain an explicit disjunct allowing the actions to be combined, making use of the \tlaplusaction composition operator , support for which has recently been added to TLC. In this way, such “deviations” of the implementation from the specification that are typically optimizations are explicitly documented.
We applied trace validation to complete the reverse engineering of a specification from an existing implementation of a Raft-inspired consensus algorithm, which is part of the Confidential Consortium Framework (CCF). We started off from a spec that was manually reverse engineered by analyzing the source code, and discussions of the implementation with the engineering team. This preliminary specification was extensively corrected and amended through trace validation by validating around 15 traces from an existing test suite that exercises non-trivial system behavior. Extensive verification of the updated spec revealed serious violations of key safety properties of the consensus algorithm. Manually translating TLC’s counterexamples into new tests confirmed that the implementation was also vulnerable. After addressing these issues at the spec level, corresponding updates to the implementation were made. To ensure ongoing consistency between the spec and its implementation as the project progresses, trace validation has been added into CCF’s continuous integration pipeline. A detailed analysis of our experiences with formally verifying CCF, including trace validation, will be discussed in a forthcoming paper [11].
Contrary to the experience reports discussed thus far, where we checked the consistency between an independently written specification and its implementation, we also leveraged trace validation early in the development process when implementing the distributed termination detection algorithm EWD 998 (see [14]). The implementation of the algorithm consists of about 500 lines of code (LOC). The algorithm is based on a token-passing scheme to detect when global termination has occurred. Its specification introduces several actions, including an action corresponding to the local termination of a node and another one for passing of the token from one node to its neighbor. The latter was modeled atomically, i.e., the token is sent and received in a single transition. Initially, trace validation failed because communication is asynchronous in the implementation, and therefore sending and receiving the token was logged as two separate transitions. Moreover, the implementation sends the token as soon as local termination occurs rather than separating local termination and token passing. Both problems are instances of differences in the grains of atomicity between the specification and the implementation. The first problem was solved by logging only the sending of the token, the second one initially by adding a disjunct to the trace specification that composes the two actions of local termination and of token passing, and later by directly logging local termination in the implementation. After these changes yielded some non-trivial traces that could be validated, it was found that the implementation allowed a node to send ordinary (i.e., non-token) messages to itself, which was not permitted in the specification. We addressed this by blocking a node from messaging itself; another possible fix would have been to change the specification. Trace validation then revealed that nodes continued to pass the token even after all but the initiating node had terminated, which corresponded to an implementation error. Moreover, it immediately identified an ad-hoc bugfix as flawed, prompting its replacement with a true bugfix. Since then, thousands of traces have been successfully validated, making us confident that the implementation is now correct.
4.4 Implementation aspects
As we indicated previously, our approach to instrumentation is flexible with regard to the detail of information recorded in the trace. In particular, not all variables need to be included in the trace, and names and parameters of corresponding \tlaplusactions may be given or not. Less information in the trace increases the potential degree of non-determinism in the trace specification, potentially leading to combinatorial explosion during model checking. To some extent, this problem can be alleviated using different exploration strategies. TLC’s default breadth-first search (BFS) ensures shortest-length counter-examples and is most informative for debugging. However, depth-first search (DFS) constrained by the length of the trace can be more efficient because checking can be stopped as soon as some behavior of the expected length has been found.
| Problem instance | length | VEA | V | VpEA | EA | E |
| TP, RMs | 17 | 19 | 211/35 | 19 | 48/22 | 246/58 |
| TP, RMs | 33 | 35 | 8k/73 | 35 | 640/42 | 22k/695 |
| TP, RMs | 73 | 74 | /209 | 74 | 11k/86 | 2.5M/27k |
| TP, RMs | 90 | 91 | /270 | 91 | 205k/107 | /557k |
| KV, 4a, 10/20k/v | 109 | 111 | /158 | 13k/149 | 111 | /35k |
| KV, 8a, 10/20k/v | 229 | 231 | /317 | 18k/307 | 231 | /176k |
| KV, 12a, 10/20k/v | 295 | 297 | /423 | 678k/411 | 297 | /300k |
| KV, 4a, 20/40k/v | 131 | 133 | /298 | /285 | 133 | /9.9M |
| KV, 8a, 20/40k/v | 249 | 251 | /1164 | /1146 | 251 | |
| KV, 12a, 20/40k/v | 308 | 310 | /552 | /538 | 310 |
We report in Fig. 3 the number of distinct states explored of states explored with BFS/DFS by TLC for several valid traces that contain more or less information; a single figure indicates that BFS and DFS generate the same number of states. We consider traces for the Two-Phase Commit protocol for , , , and RMs. For the Key-Value Store we consider a store with a maximum of keys and values as well as a store with a maximum of keys and values; for both stores we generate traces for , or agents. The column headings indicate the kind of information that was recorded in the traces: variables and events with their arguments (VEA), just the variables (V), the variables and some events (VpEA), only the events with their arguments (EA) or only event names (E). For Two-Phase Commit, VpEA records only the events of the TM, for Key-Value Store, only the start and end of transactions are logged.
As expected, tracing full information for variables and the events corresponds to the exploration of the least number of states by TLC. Logging only the variables or only the event names quickly leads to state-state explosion that makes trace validation infeasible. However, recording well-chosen partial information is sufficient for limiting the state space. What information needs to be recorded depends on the specification. For the Key-Value Store, logging events and their arguments is enough because they uniquely determine the corresponding variable values. For Two-Phase Commit, logging the events of the RMs is unnecessary. Moreover, although not shown in the table, we found that for this specification, the same numbers of states are obtained when the messages sent during the execution and the arguments of the events are omitted.
Besides an exponential growth of the number of states, too imprecise logs may even lead to erroneous traces being accepted because the values inferred by the model checker may be different from the actual ones. Nevertheless, such traces can be useful at early stages of validation, when issues are more likely to occur. For instance, validating a trace containing only the event names for RMs takes a considerable amount of time but the bug for the implementation using Lists could still be detected with such a trace in less than a minute.
To sum up, the best results in terms of confidence and efficiency are obtained when as many variables and events as possible are logged by the implementation. Recording only event names without arguments is least intrusive, and although it can be useful initially for finding potential issues, it does not provide high confidence and may incur state-space explosion. Validating variable-only traces may be problematic in terms of efficiency, in particular for BFS. We found it really helpful to record at least partial information on the events.
5 Related Work
The verification of execution traces against high-level properties or specifications has a long history in formal methods. Havelund [9] introduced runtime verification as a lightweight method for checking that a system’s execution trace conforms to its high-level specification. Runtime verification typically involves the generation of a monitor from the specification, which consumes the trace events to check conformance (see [4]). Howard et al. [12] verified execution traces directly against the system’s high-level specification. Their work also demonstrated the feasibility of using standard model checkers (ProB and Spin) to check execution traces against these specifications, a technique that we also employ. However, they did not consider distributed programs that require the use of (centralized or distributed) clocks for preserving causality, and they did not consider traces with incomplete information.
The first to explore techniques to align a \tlaplusspecification with an implementation were Lamport et al. [18], who used model-based testing to execute behaviors obtained from model checking a \tlaplusspecification against concurrent protocols implemented in hardware. Concurrently, Tasiran et al. [26] extracted and validated implementation traces obtained from a hardware simulator against a \tlaplusspecification, demonstrating the practical applicability of trace validation in verifying system behaviors as specified in \tlaplus.
The adoption of \tlaplusamong distributed system practitioners, spurred by Newcombe et al. [20], led to renewed interest in trace validation. Pressler [23] formalized trace validation as a refinement check within the \tlaplusframework, outlining a concept that was soon applied to real-world systems. For instance, Davis et al. [2] applied the technique in an industrial context, discovering a non-trivial implementation bug. However, they faced challenges in mapping the specification to its implementation and consistently logging implementation states, shedding light on the complexities of applying trace validation in practical settings. Focusing on refinement rather than the weaker concept of nonemptiness of intersection as we do, they did not leverage \tlaplus’s non-determinism to infer implementation state when direct logging was infeasible, nor did they explore action composition to simplify the mapping between specification and implementation. Haltermann [8] demonstrated the practicality of trace validation for monitoring the conformance of production systems with \tlaplusspecifications, identifying key challenges such as establishing happens-before relationships in distributed logs and addressing scalability issues arising from extremely long execution traces. Extending the practical applications of trace validation, Niu et al. [21] validated traces from the distributed execution of a Zookeeper system, illustrating the viability of the technique as a lightweight method for ensuring that a distributed system’s implementation corresponds to its specification. Similarly, Wang et al. [27] revisited model-based testing, revealing several bugs at the implementation level by extracting behaviors from model checking and replaying these against instrumented implementations. This approach highlighted the challenges of directly mapping specification actions to implementation steps. This was illustrated by the authors identifying two bugs in a widely used and well-established specification [22]. We contend that these are, in fact, common \tlaplusmodeling patterns and were mistakenly labeled as bugs.
To facilitate a closer alignment between high-level specifications and their actual implementations, Hackett et al. [7] and Foo et al. [6] proposed extensions to PlusCal, an algorithmic language whose translator serves as a front-end to \tlaplus. These aim at adding sufficient detail to specifications for code generation and enabling the generation of runtime monitors, respectively. Despite these advancements, the requirement for implementation-level shims may impede widespread industry adoption. Moreover, the projection from a global state machine, which is a common \tlaplusmodeling pattern, to node-local state machines prevent the verification of global properties by monitors. Yet, both approaches still translate specifications written in their Pluscal extensions into \tlaplus, allowing users to leverage all of the existing \tlaplusverification tools.
Among others, Nadal [19] and Springmeyer [25] attempt to render trace validation obsolete by integrating state-based modeling and model checking into general-purpose programming languages like Rust and Haskell. While promising, these efforts confront the idiosyncrasies of programming languages and lack robust support for the rigorous formal methods enabled by \tlaplusspecifications.
6 Conclusion
Formal verification techniques are known to be most effective for specifications written at high levels of abstraction where the size of state spaces (for model checking) and the complexity of invariants (for deductive verification) are manageable. High-level specifications can serve as guidelines to programmers when implementing an algorithm, and in some cases it may even be possible to generate code from a sufficiently detailed specification. Model-based testing is a collection of techniques that rely on formal specifications for generating test cases, aiming at coverage guarantees or exploring parts of the state space deemed interesting based on an analysis of the specification.
In this paper we described our approach for gaining confidence in the correctness of an implementation by collecting traces of its executions and validating them against the state machine described by a high-level specification written in \tlaplus. Our purpose with this approach is to identify discrepancies that can be analyzed using the TLC model checker in order to determine if they are due to an error in the implementation, a restrictive specification, or an artefact due to a mismatch in the grains of atomicity. Although the technique does not provide formal correctness guarantees, we have found it to be surprisingly effective for finding serious bugs in implementations that had undergone traditional quality assurance techniques.
We are certainly not the first to suggest that trace validation can be worthwhile for relating high-level specifications and programs. Original aspects, to the best of our knowledge, are our ability to handle different grains of atomicity, and that we do not require all specification variables or events to be traced in the log; instead, we use the model checker to reconstruct missing information. This leads to a tradeoff between the amount of detail included in the trace, the increase of the search space for model checking, and the reliability of the verdict, but our experiments suggest that it is enough to trace a suitably chosen subset of variables and/or events. We implemented a library of Java methods and \tlaplusoperators to support collecting traces but their use is not strictly essential for applying our technique. In fact, the EWD 998 and CCF case studies used ad-hoc code instrumentations for generating the logs. Additionally, we implemented support for action composition and depth-first search in the TLC model checker, and enhanced debugging of trace validation in the \tlaplusdebugger.
At the moment, we exploit random variations in implementation parameters such as message delays or failures in order to generate different traces of the program to be analyzed. In future work, we intend to use the \tlaplusspecification in order to be able to steer executions towards “interesting” parts of the state space. We also intend to study the feasibility of applying trace validation online during the execution of the program or even of using the technique as a run-time monitor to block unsafe transitions of the implementation. However, online validation will certainly be restricted to trace specifications with low degrees of non-determinism.
References
- [1] D. Cousineau, D. Doligez, L. Lamport, S. Merz, D. Ricketts, and H. Vanzetto. TLA+ Proofs. In D. Giannakopoulou and D. Méry, editors, FM 2012: Formal Methods, volume 7436 of LNCS, pages 147–154, Paris, France, 2012. Springer.
- [2] A. J. J. Davis, M. Hirschhorn, and J. Schvimer. eXtreme Modelling in Practice. Proceedings of the VLDB Endowment, 13(9):1346–1358, May 2020.
- [3] E. W. Dijkstra. EWD 998: Shmuel Safra’s version of termination detection. http://www.cs.utexas.edu/users/EWD/ewd09xx/EWD998.PDF, Jan. 1987.
- [4] Y. Falcone, K. Havelund, and G. Reger. A tutorial on runtime verification. Engineering Dependable Software Systems, 34:141–175, 01 2013.
- [5] A. Fekete. Snapshot isolation. In L. Liu and M. T. Özsu, editors, Encyclopedia of Database Systems, pages 2659–2664. Springer, 2009.
- [6] D. Foo, A. Costea, and W.-N. Chin. Protocol Conformance with Choreographic PlusCal. In C. David and M. Sun, editors, Theoretical Aspects of Software Engineering, volume 13931, pages 126–145. 2023.
- [7] F. Hackett, S. Hosseini, R. Costa, M. Do, and I. Beschastnikh. Compiling distributed system models with PGo. In Proceedings of the 28th ACM International Conference on Architectural Support for Programming Languages and Operating Systems, Volume 2, pages 159–175, Vancouver BC Canada, Jan. 2023. ACM.
- [8] J. Haltermann. Bridging the verifiability gap: Why we need more from our specs and how we get it. https://conf.tlapl.us/2020/, Oct. 2020.
- [9] K. Havelund. Using runtime analysis to guide model checking of Java programs. In G. Goos, J. Hartmanis, J. Van Leeuwen, K. Havelund, J. Penix, and W. Visser, editors, SPIN Model Checking and Software Verification, volume 1885, pages 245–264. Springer, 2000.
- [10] H. Howard, F. Alder, E. Ashton, A. Chamayou, S. Clebsch, M. Costa, A. Delignat-Lavaud, C. Fournet, A. Jeffery, M. Kerner, F. Kounelis, M. A. Kuppe, J. Maffre, M. Russinovich, and C. M. Wintersteiger. Confidential Consortium Framework: Secure multiparty applications with confidentiality, integrity, and high availability. Proceedings of the VLDB Endowment, 17(2):225–240, Oct. 2023.
- [11] H. Howard, E. Ashton, A. Chamayou, M. A. Kuppe, and N. Crooks. Towards smart casual verification of the Confidential Consortium Framework’s distributed protocols. In preparation, 2024.
- [12] Y. Howard, S. Gruner, A. Gravell, C. Ferreira, and J. C. Augusto. Model-based trace-checking. arXiv:1111.2825 [cs], Nov. 2011.
- [13] I. Konnov, M. Kuppe, and S. Merz. Specification and verification with the TLA+ trifecta: TLC, Apalache, and TLAPS. In T. Margaria and B. Steffen, editors, Leveraging Applications of Formal Methods, Verification and Validation. Verification Principles, volume 13701, pages 88–105. Springer, 2022.
- [14] M. A. Kuppe. Implementing a TLA+ specification: EWD998Chan. https://github.com/tlaplus/Examples/pull/75, Apr. 2023.
- [15] M. A. Kuppe. The TLA+ debugger. In P. Masci, C. Bernardeschi, P. Graziani, M. Koddenbrock, and M. Palmieri, editors, Software Engineering and Formal Methods. SEFM 2022 Collocated Workshops, volume 13765, pages 174–180. Springer, 2023.
- [16] L. Lamport. Specifying Systems. Addison-Wesley, Boston, Mass., 2002.
- [17] L. Lamport, M. A. Kuppe, S. Merz, A. Helwer, W. Schultz, J. Hemphill, M. Ryndzionek, I. Konnov, T. H. Tran, J. Widder, J. Gray, M. Demirbas, G. Hu, G. Losa, R. Pressler, Y. Akhouayri, L. Dong, Z. Niu, L. N. X. Terry, G. Gandhi, I. DeFrain, M. Harrison, S. Raju, C. G. Mathew, F. Andriani, and L. Yvoz. TLA+ examples.
- [18] L. Lamport, J. Matthews, M. Tuttle, and Y. Yu. Specifying and verifying systems with TLA+. In Proceedings of the 10th Workshop on ACM SIGOPS European Workshop: Beyond the PC - EW10, page 45, Saint-Emilion, France, 2002. ACM Press.
- [19] J. Nadal. Stateright. https://github.com/stateright/stateright, 2018.
- [20] C. Newcombe, T. Rath, F. Zhang, B. Munteanu, M. Brooker, and M. Deardeuff. How Amazon Web Services uses formal methods. Communications of the ACM, 58(4):66–73, Mar. 2015.
- [21] Z. Niu, L. Dong, Y. Zhu, and L. Chen. Verifying Zookeeper based on model-based runtime trace-checking using TLA+. In Proceedings of the 7th International Conference on Cyber Security and Information Engineering, pages 13–18, Brisbane QLD Australia, Sept. 2022. ACM.
- [22] D. Ongaro and J. Ousterhout. In search of an understandable consensus algorithm. In 2014 USENIX Annual Technical Conference, pages 305–319, Philadelphia, PA, June 2014. USENIX Association.
- [23] R. Pressler. Conjunction Capers: A TLA+ Truffle. https://conf.tlapl.us/2020/, Sept. 2020.
- [24] W. Schultz, S. Zhou, I. Dardik, and S. Tripakis. Design and analysis of a logless dynamic reconfiguration protocol. In Q. Bramas, V. Gramoli, and A. Milani, editors, 25th Intl. Conf. Principles of Distributed Systems (OPODIS 2021), volume 217 of LIPIcs, pages 26:1–26:16, Strasbourg, France, 2021. Schloss Dagstuhl - Leibniz-Zentrum für Informatik.
- [25] P. Springmeyer. Spectacle. https://github.com/awakesecurity/spectacle, 2021.
- [26] S. Tasiran, Y. Yu, B. Batson, and S. Kreider. Using formal specifications to monitor and guide simulation: Verifying the cache coherence engine of the Alpha 21364 microprocessor. In In Proceedings of the 3rd IEEE Workshop on Microprocessor Test and Verification, Common Challenges and Solutions, 2002.
- [27] D. Wang, W. Dou, Y. Gao, C. Wu, J. Wei, and T. Huang. Model checking guided testing for distributed systems. In Proceedings of the Eighteenth European Conference on Computer Systems, pages 127–143, Rome Italy, May 2023. ACM.
- [28] Y. Yu, P. Manolios, and L. Lamport. Model checking TLA+ specifications. In L. Pierre and T. Kropf, editors, 10th IFIP WG 10.5 Conf. Correct Hardware Design and Verification Methods (CHARME’99), volume 1703 of LNCS, pages 54–66, Bad Herrenalb, Germany, 1999. Springer.
Appendix 0.A JSON Schema for a trace entry
Fig. 4 presents the JSON Schema for an entry in the trace file. The additionalProperties stands for names of variables logged in the entry.