Social Media Use is Predictable from App Sequences: Using LSTM and Transformer Neural Networks to Model Habitual Behavior
Abstract
The present paper introduces a novel approach to studying social media habits through predictive modeling of sequential smartphone user behaviors. While much of the literature on media and technology habits has relied on self-report questionnaires and simple behavioral frequency measures, we examine an important yet understudied aspect of media and technology habits: their embeddedness in repetitive behavioral sequences. Leveraging Long Short-Term Memory (LSTM) and transformer neural networks, we show that (i) social media use is predictable at the within and between-person level and that (ii) there are robust individual differences in the predictability of social media use. We examine the performance of several modeling approaches, including (i) global models trained on the pooled data from all participants, (ii) idiographic person-specific models, and (iii) global models fine-tuned on person-specific data. Neither person-specific modeling nor fine-tuning on person-specific data substantially outperformed the global models, indicating that the global models were able to represent a variety of idiosyncratic behavioral patterns. Additionally, our analyses reveal that the person-level predictability of social media use is not substantially related to the frequency of smartphone use in general or the frequency of social media use, indicating that our approach captures an aspect of habits that is distinct from behavioral frequency. Implications for habit modeling and theoretical development are discussed.
Keywords Social Media, Habits, User Modeling, LSTM, Transformer, Neural Networks
1 Introduction
Mobile app use is ubiquitous in our daily lives. On average, US smartphone users spend 4.5 hours per day on their phones [1], maintaining relationships, conducting business, and seeking information or entertainment. Among the long list of technology-mediated behaviors, social media use deserves special attention, not only because social media platforms are used by billions of people every day but also because they have been shown to impact almost every aspect of our lives. For example, social media use has revolutionized social interaction [2, 3, 4, 5], changed the consumption of information and news [6, 7, 8, 9], and been linked to a wide range of indicators of well-being [10, 11, 12, 13, 14, 15, 16, 17].
Here, we investigate the predictability of social media use through the theoretical lens of media and technology habits. Habits are commonly defined as repeated behaviors that are automatically initiated by contextual cues, such as locations, situational elements, and preceding actions or activities [18, 19, 20, 21, 22, 23, 24]. Thus, habitual behaviors are performed in a semi-conscious manner in which individuals follow a rehearsed script once triggered by the contextual cue [25].
Past research indicates that social media use is, in large part, habitual behavior [18, 11]. For instance, one might habitually check one’s phone while waiting for a bus on the way to work, respond to messages on Facebook before going to bed, or check Instagram by default when unlocking one’s phone. Consequently, sequences of people’s interactions with their devices tend to exhibit regularities over time. For example, social interaction and content consumption [26], instant messaging [27], and in-app action sequences [28], follow predictable patterns that have been characterized as habitual in nature. Moreover, there is a growing body of predictive work in human-computer interaction and user modeling, suggesting that smartphone user behaviors, including app engagement, are predictable to varying degrees from factors like device states, temporal context, location, and preceding actions [29, 30, 31, 32, 33, 34].
While these findings demonstrate regularities in smartphone user behaviors that can be interpreted as habitual, the behavioral science literature has taken a different approach, often relying on relatively simple behavioral measures (e.g., behavioral frequency, reward devaluation [35, 36]) or self-report measures to assess habits (e.g., Self-Report Habit Index [37], Self-Report Behavioral Automaticity Index [38], Unified Theory of Acceptance and Use of Technology questionnaire [39], Response Frequency Measure of Media Habit [40]). These methods have proven useful in past research, but they are also limited in at least two important ways. First, people tend to be inaccurate in reporting past behavior, especially social media use [41]. Notably, such recall biases might be especially pronounced in the case of mobile and social media habits, as they often occur automatically and without conscious engagement in the midst of daily life [42, 25, 43]. Second, questionnaire-based methods are ill-equipped to detect more granular behavioral patterns, such as sequences of device interactions. Significantly, the same limitation applies to simple behavioral measures, which ignore the embeddedness of behaviors in preceding and subsequent activities along with surrounding contextual factors. Integrating more objective, granular, and context-sensitive methods grounded in digital trace data could provide a more holistic and accurate representation of media habits.
Here, we shift focus from self-report measures to tracking behavioral sequences via smartphone logs. Specifically, we build on recent research positing that repetitive behavioral sequences constitute an important, yet understudied, aspect of media and technology habits [44]. Under this scope, we can capture media habits as the extent to which a focal behavior (e.g. the use of a particular social media app) can be predicted from the history of preceding behaviors (e.g., the use of other applications). Hence, recurring sequences can indicate the extent to which an app (or combination of apps) acts as a contextual trigger for other app selections, aligning with past habit research on the role of preceding actions as contextual cues [see][][45]. This operationalization of media habits offers several important advantages compared to traditional approaches to measuring habit processes. First, we are able to directly extract habits from objectively trackable smartphone user behaviors in the real world, thereby circumventing the previously outlined response biases and artificial scenarios. Second, the reliance on sequences of behavior allows us to paint a more nuanced picture of habitual behaviors than merely focusing on behavioral frequencies.
The modeling of person-specific behavioral processes has a long tradition in the behavioral sciences [[, e.g.,]]hamaker_idiographic_2009, haslbeck_recovering_2022, lally_how_2010, molenaar_manifesto_2004, molenaar_new_2009, ram_binding_2023, but much of this work has relied on autoregressive models [47] or classic machine learning techniques [52]. While these approaches can offer insights into the structure of behavioral sequences, the increasing adoption of deep learning approaches that are specifically designed to represent complex time series, such as Long-Short-Term-Memory (LSTM) [53, 54] or transformer neural networks [55], opens the door for more sophisticated modeling approaches [51].
Given the fact that habits are - by definition - repetitive, the present paper examines the predictability of social media habits using LSTM and transformer neural network models to represent recurrent patterns in time series. First, we examine the extent to which social media use is predictable from intensive longitudinal app log data at the between and within-person levels and the extent to which the predictability of social media use varies across individuals. Second, we explore how the predictability of social media use relates to behavioral frequency measures and other properties of the underlying training data. Third, we examine the size of the relevant behavioral context window by analyzing the relationship between predictive performance and the length of the behavioral sequences available to the models. Our analyses are based on the predictive performance of (i) global models trained on pooled data from all users, (ii) person-specific models trained from scratch on person-level data, and (iii) global models fine-tuned on person-level data. The present study thus employs state-of-the-art machine learning approaches to explore a new operationalization of habits that is rooted in the predictability of objectively trackable behavior.
2 Method
2.1 Participants and Procedure
We collected data from a sample of N=182 adults (final N=99 after data cleaning; see below) between mid-January and early March 2021. Participants were recruited through Prolific, and all were located in the US. All participants were Android phone users. The current study focuses on Android app logs (time-stamped records of interactions with various smartphone apps), collected through the Screenomics app [56]. The app logs were recorded through event-based sampling each time an app was used. Each app was identified by its associated Android package name, a unique identifier used by the Android operating system and Google Play Store. All participants gave informed consent. The study received approval under the Stanford University IRB (Protocol #48234).
2.2 Data Preprocessing
In order to standardize the observation period per user, we discarded users with less than 14 full days of participation, and we truncated the participation period to 14 days for those who had participated for more than 14 days. From the app log sequences, we discarded instances of the Screenomics app, which was used for data collection (0.56% of observations), as well as empty events for which no app was logged (1.65% of observations). We also discarded logs associated with navigational (e.g., Launcher) and system UI processes (37.06% of observations), as these events represent engagement with the Android operating system rather than direct usage of apps. Finally, in order to guarantee sufficient training data at the person level, we removed users with less than 1,000 logged app sessions over the course of the observation period and users with minimal social media use (<5% of observations). Through this process, we reduced the participant sample size from N=182 to N=99, and the number of observations from 585,576 to 282,639.
The target variable, social media use, was derived directly from the app logs using a list of social media apps (e.g., Facebook, Instagram, TikTok, Snapchat; the full list can be found in SI A), based on the conceptualization of social media proposed by Bayer et al. [57]. Stand-alone messaging apps like WhatsApp or Telegram were not considered social media apps for the purpose of the study.
2.3 Modeling
We utilized two neural network architectures that are specifically designed to capture patterns in sequential data: LSTM [53, 54] and transformer neural networks [55]. LSTM neural networks are a type of recurrent neural network designed to represent long-term dependencies in sequential data, making them particularly effective for tasks like language processing or time series analysis [58, 59, 60]. Transformer neural networks are a type of architecture that relies on self-attention mechanisms [55], enabling the processing of entire sequences of data simultaneously, making them highly efficient and effective for tasks like natural language understanding and generation [61, 62]. In addition, they also excel at learning from other types of sequential data, such as health records [63] or life events [64].
In order to standardize the prediction task across individuals, we framed it as a binary classification task, predicting whether the next app opened by the user would be a social media app or not. For the main analyses, we constructed a sequence of the 20 preceding actions for each logged app use event, irrespective of the temporal distance between events or whether they were separated by a period of inactivity. This was done separately within each of the training, validation, and testing sets in order to prevent information leakage across the splits. For the small subset of actions that did not have a sufficient number of preceding data points, we pre-padded the sequences with zeros. The app logs were fed into an embedding layer, which – in turn – fed into one or more LSTM or transformer layers and a single fully connected layer before the output layer. The output layer was a single neuron with a sigmoid activation function.
We first trained general, global models on the combined data of all participants. Second, following an idiographic modeling approach, we trained person-specific models for each individual in the dataset. Third, we implemented a hybrid strategy by fine-tuning the global model with person-specific data for each participant. With the exception of the fine-tuning stage, we tuned the neural network architecture and regularization parameters for each model in order to avoid spurious differences in model performance as a result of a mismatch between model hyperparameter settings and idiosyncratic properties of each person’s data. The tuned hyperparameters include architectural hyperparameters such as the dimensionality of the embedding layer ([5, 50]), the number ([1, 3]) and dimensionalities ([4, 64]) of the LSTM, transformer layers, and dense layers. In order to combat overfitting, we also tuned various regularization parameters such as dropout rate ([0.2, 0.5]) and recurrent dropout rate ([0.2, 0.5]), as well as L1 ([1e-5, 1e-3]) and L2 ([1e-4, 1e-2]) norms tuned separately for recurrent, transformer, and dense layers. Finally, we tuned the learning rate ([1e-4, 1e-2]) that was applied to the Adam optimizer [65]. Hyperparameter search was performed using Bayesian Optimization [66] with 20 iterations and five random starting points. The optimization target was the area under the receiver operating characteristic curve (AUC). The AUC was used as the optimization target because it is insensitive to changes in the class distribution. This characteristic makes it especially useful in imbalanced datasets where one class outnumbers the other. A detailed description of the hyperparameter spaces can be found in SI B.
A temporal train-validation-test split was performed for each individual, such that the first section of the data was allocated to the training set (50% of observations), the second section was allocated to the validation set (25% of observations), and the final section was allocated to the testing set (25% of observations). The training set was used to fit the model, the validation set was used for hyperparameter tuning, and the testing set was used to evaluate model performance. For the global model, the splits were comprised of the union of person-level splits across participants. In other words, we maintained the same splits that were used at the person level and combined all individual training/validation/test sets to create overall training/validation/test sets. Each model was trained for up to 1,000 epochs with a batch size of 1,024 and early stopping with a patience parameter value of 5 epochs. We chose the relatively low patience value to avoid overfitting. The stopping criterion was the binary cross-entropy loss computed on the validation set. In order to account for class imbalances in the testing set, we employed the area under the receiver-operating characteristic curve (AUC) as the main evaluation metric. Other commonly used binary classification metrics can be found in SI C.
All analyses were conducted using the Tensorflow Python library [67] and the Kerastuner Python library [68]. The code used to generate the results is available on this paper’s OSF page (https://osf.io/rkswe/).
3 Results
3.1 Descriptive Statistics
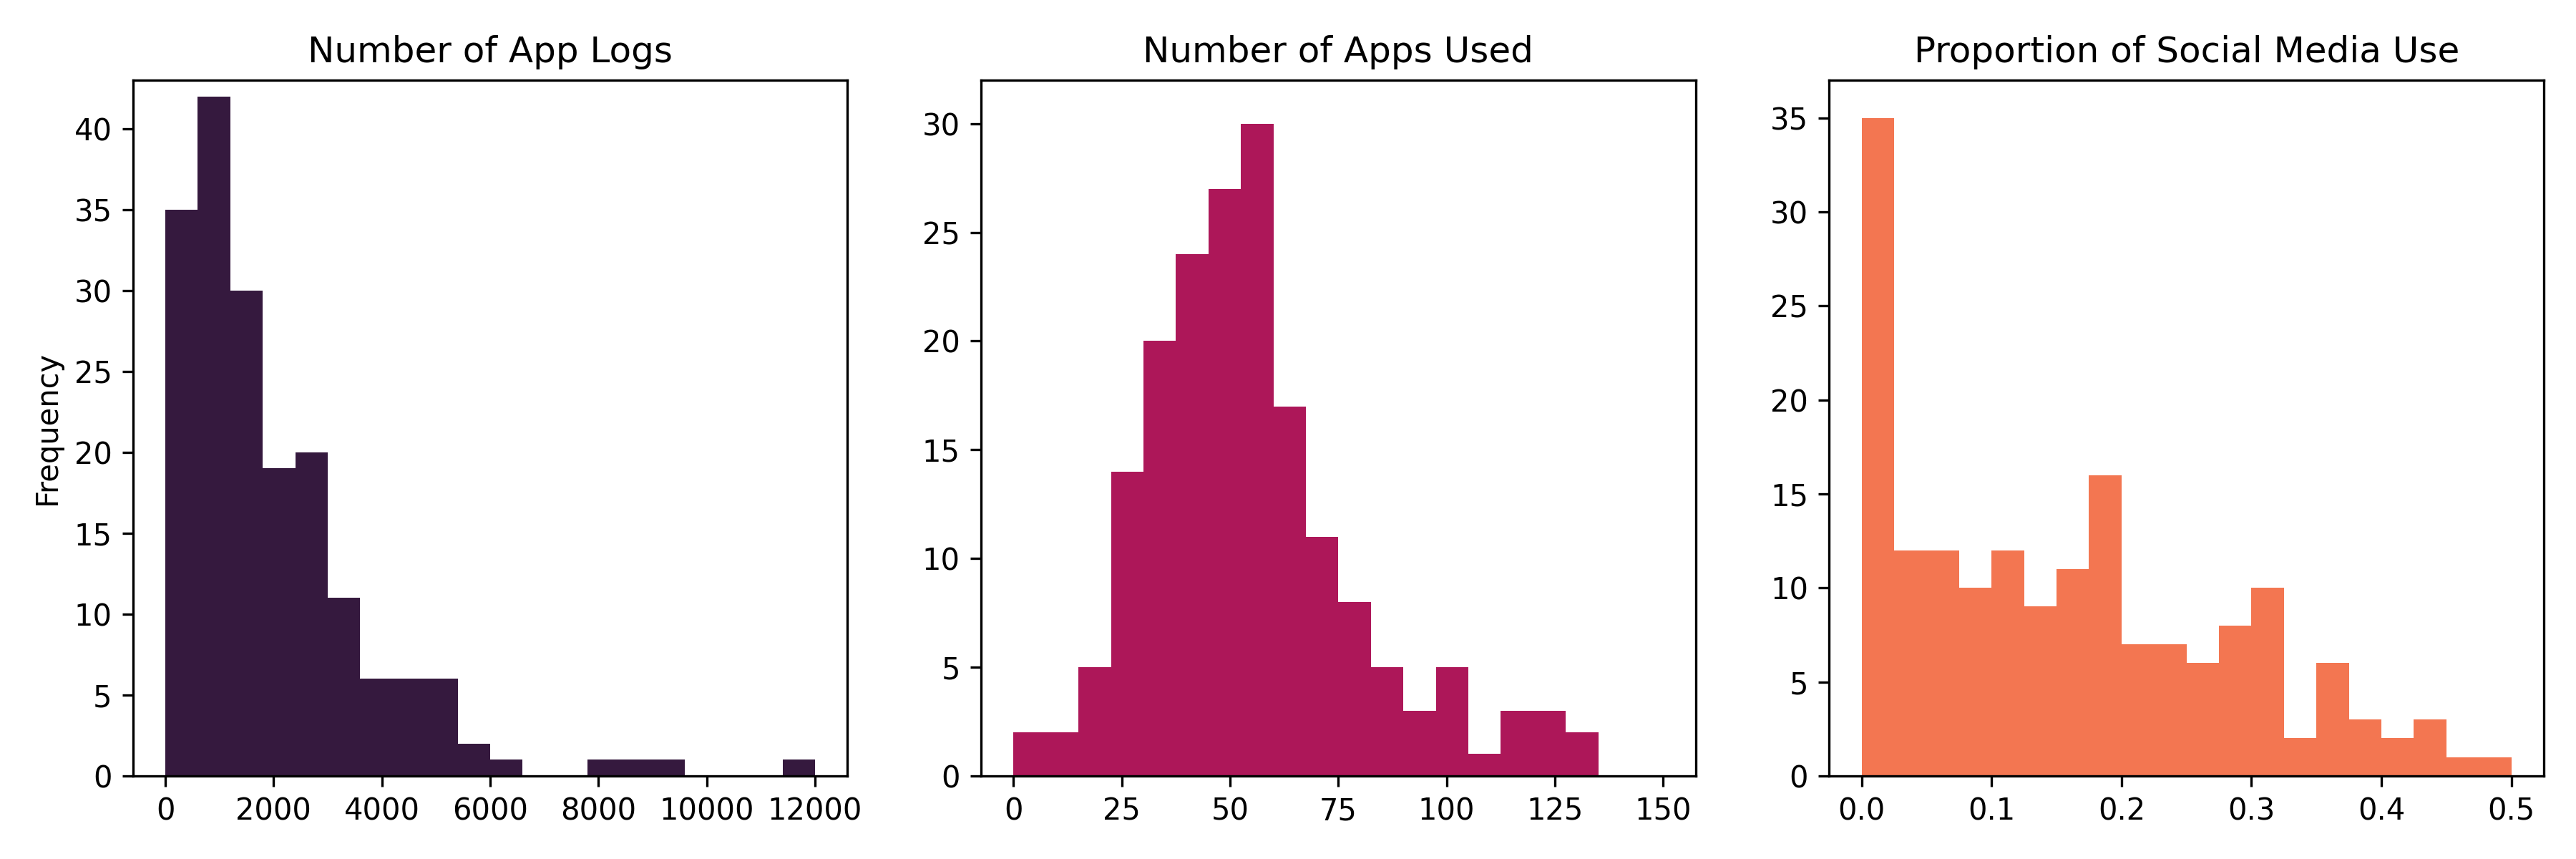
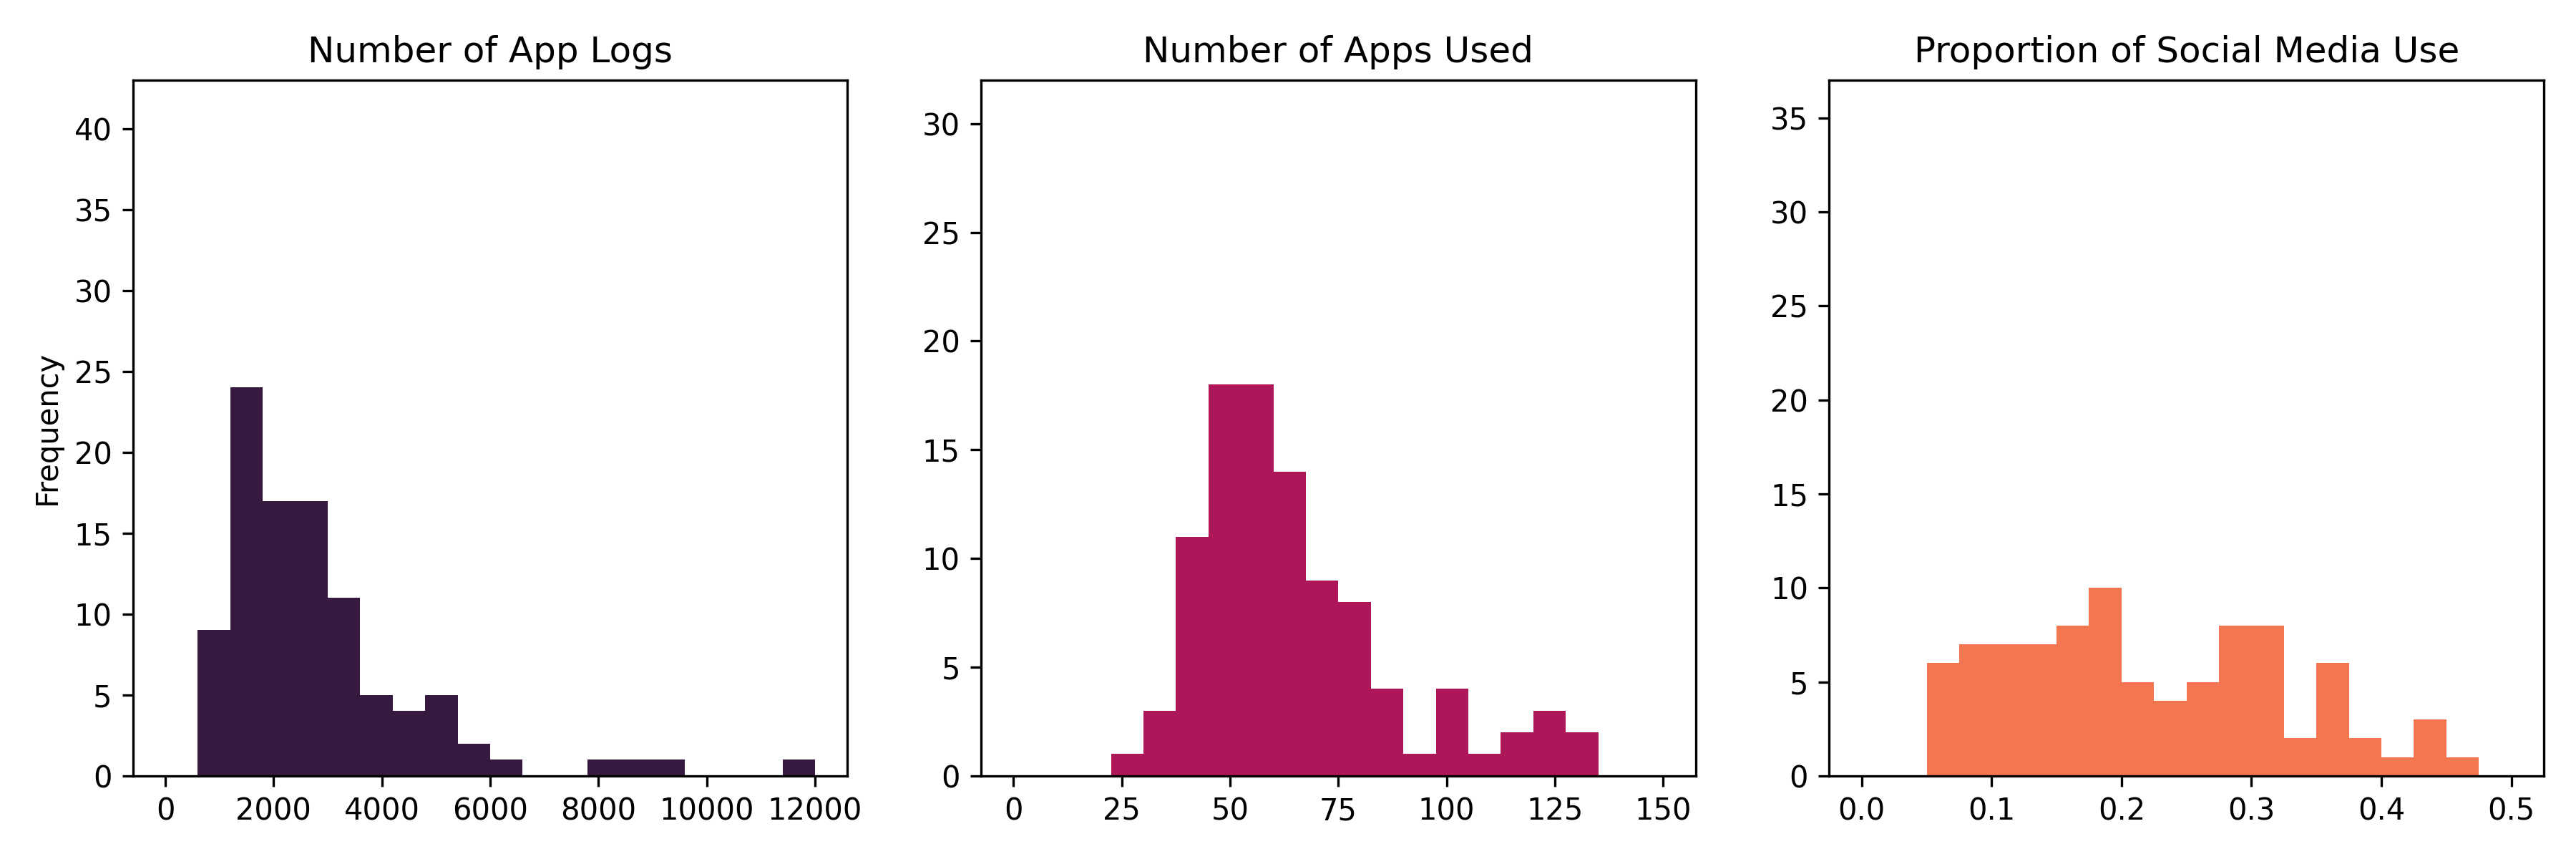
On average, before excluding individuals from the analysis given cleaning criteria, each participant had 1980 logged app sessions (Median=1456.5, SD=1804.2). The average number of distinct apps (Android packages) used per person was 54.4 (Median=50.5, SD=24.5). The average proportion of app sessions that were social media sessions was 17.68% (Median=15.31, SD=15.29). After cleaning, the average number of app sessions was 2856 (Median=2374, SD=1875.5), the average number of distinct apps (Android packages) used per person was 64.8 (Median=59, SD=23.1), and the average proportion of social media sessions was 25.33% (Median=22.09, SD=14.43). A visual representation of the distributions can be found in Figure 1.
The most commonly used apps were Google Chrome (10.07% of observations, 9.34% after cleaning), Facebook (5.04% of observations, 6.17% after cleaning), Google Mail (4.71% of observations, 4.58% after cleaning), Saumsung’s messaging app (4.64% of observations, 4.63% after cleaning), Google Quick Search Box (3.76% of observations, 3.65% after cleaning), Facebook Messenger (3.51% of observations, 3.97% after cleaning), Google’s messaging app (3.47%, 2.91 after cleaning), Snapchat (3.13% of observations, 3.88% after cleaning), Instagram (3.07% of observations, 3.77% after cleaning), and Reddit (2.82% of observations, 3.33% after cleaning). A detailed list can be found in Table 1.
| App | Proportion of Sessions | Proportion of Users | Proportion of Sessions | Proportion of Users |
|---|---|---|---|---|
| Pre-Cleaning | Pre-Cleaning | Post-Cleaning | Post-Cleaning | |
| Google Chrome | 10.07 | 92.86 | 9.34 | 95.96 |
| 5.04 | 52.20 | 6.17 | 68.69 | |
| Google Mail | 4.71 | 84.62 | 4.58 | 88.89 |
| Samsung Messaging | 4.64 | 39.56 | 4.63 | 44.44 |
| Google Search | 3.76 | 87.36 | 3.65 | 91.92 |
| Facebook Messenger | 3.51 | 53.30 | 3.97 | 66.67 |
| Google Messaging | 3.47 | 39.56 | 2.91 | 36.36 |
| Snapchat | 3.13 | 34.62 | 3.88 | 49.49 |
| 3.07 | 47.80 | 3.77 | 70.71 | |
| 2.82 | 40.11 | 3.33 | 54.55 | |
| Discord | 2.34 | 28.02 | 2.81 | 35.35 |
| 1.89 | 31.87 | 2.32 | 44.44 | |
| Samsung Browser | 1.82 | 18.13 | 1.80 | 25.25 |
| Youtube | 1.49 | 73.08 | 1.58 | 85.86 |
| TikTok | 1.36 | 25.27 | 1.62 | 34.34 |
| Settings | 1.17 | 95.05 | 0.92 | 96.97 |
| Samsung Call UI | 0.98 | 47.80 | 1.00 | 56.57 |
| Gallery | 0.96 | 47.25 | 1.03 | 57.58 |
| Google Play Store | 0.96 | 92.31 | 0.81 | 96.97 |
| Spotify | 0.69 | 31.87 | 0.83 | 42.42 |
3.2 Predictability of Social Media Use
Global Pre-Trained Models.
We first trained a global model on the combined training sets of all individuals and performed a hyperparameter search using the combined validation sets of all individuals. Both the LSTM and the transformer model performed well on the combined test sets (=0.782, =0.773), suggesting that social media app use is moderately to highly predictable at the between-person level (for additional evaluation metrics, please refer to SI C).
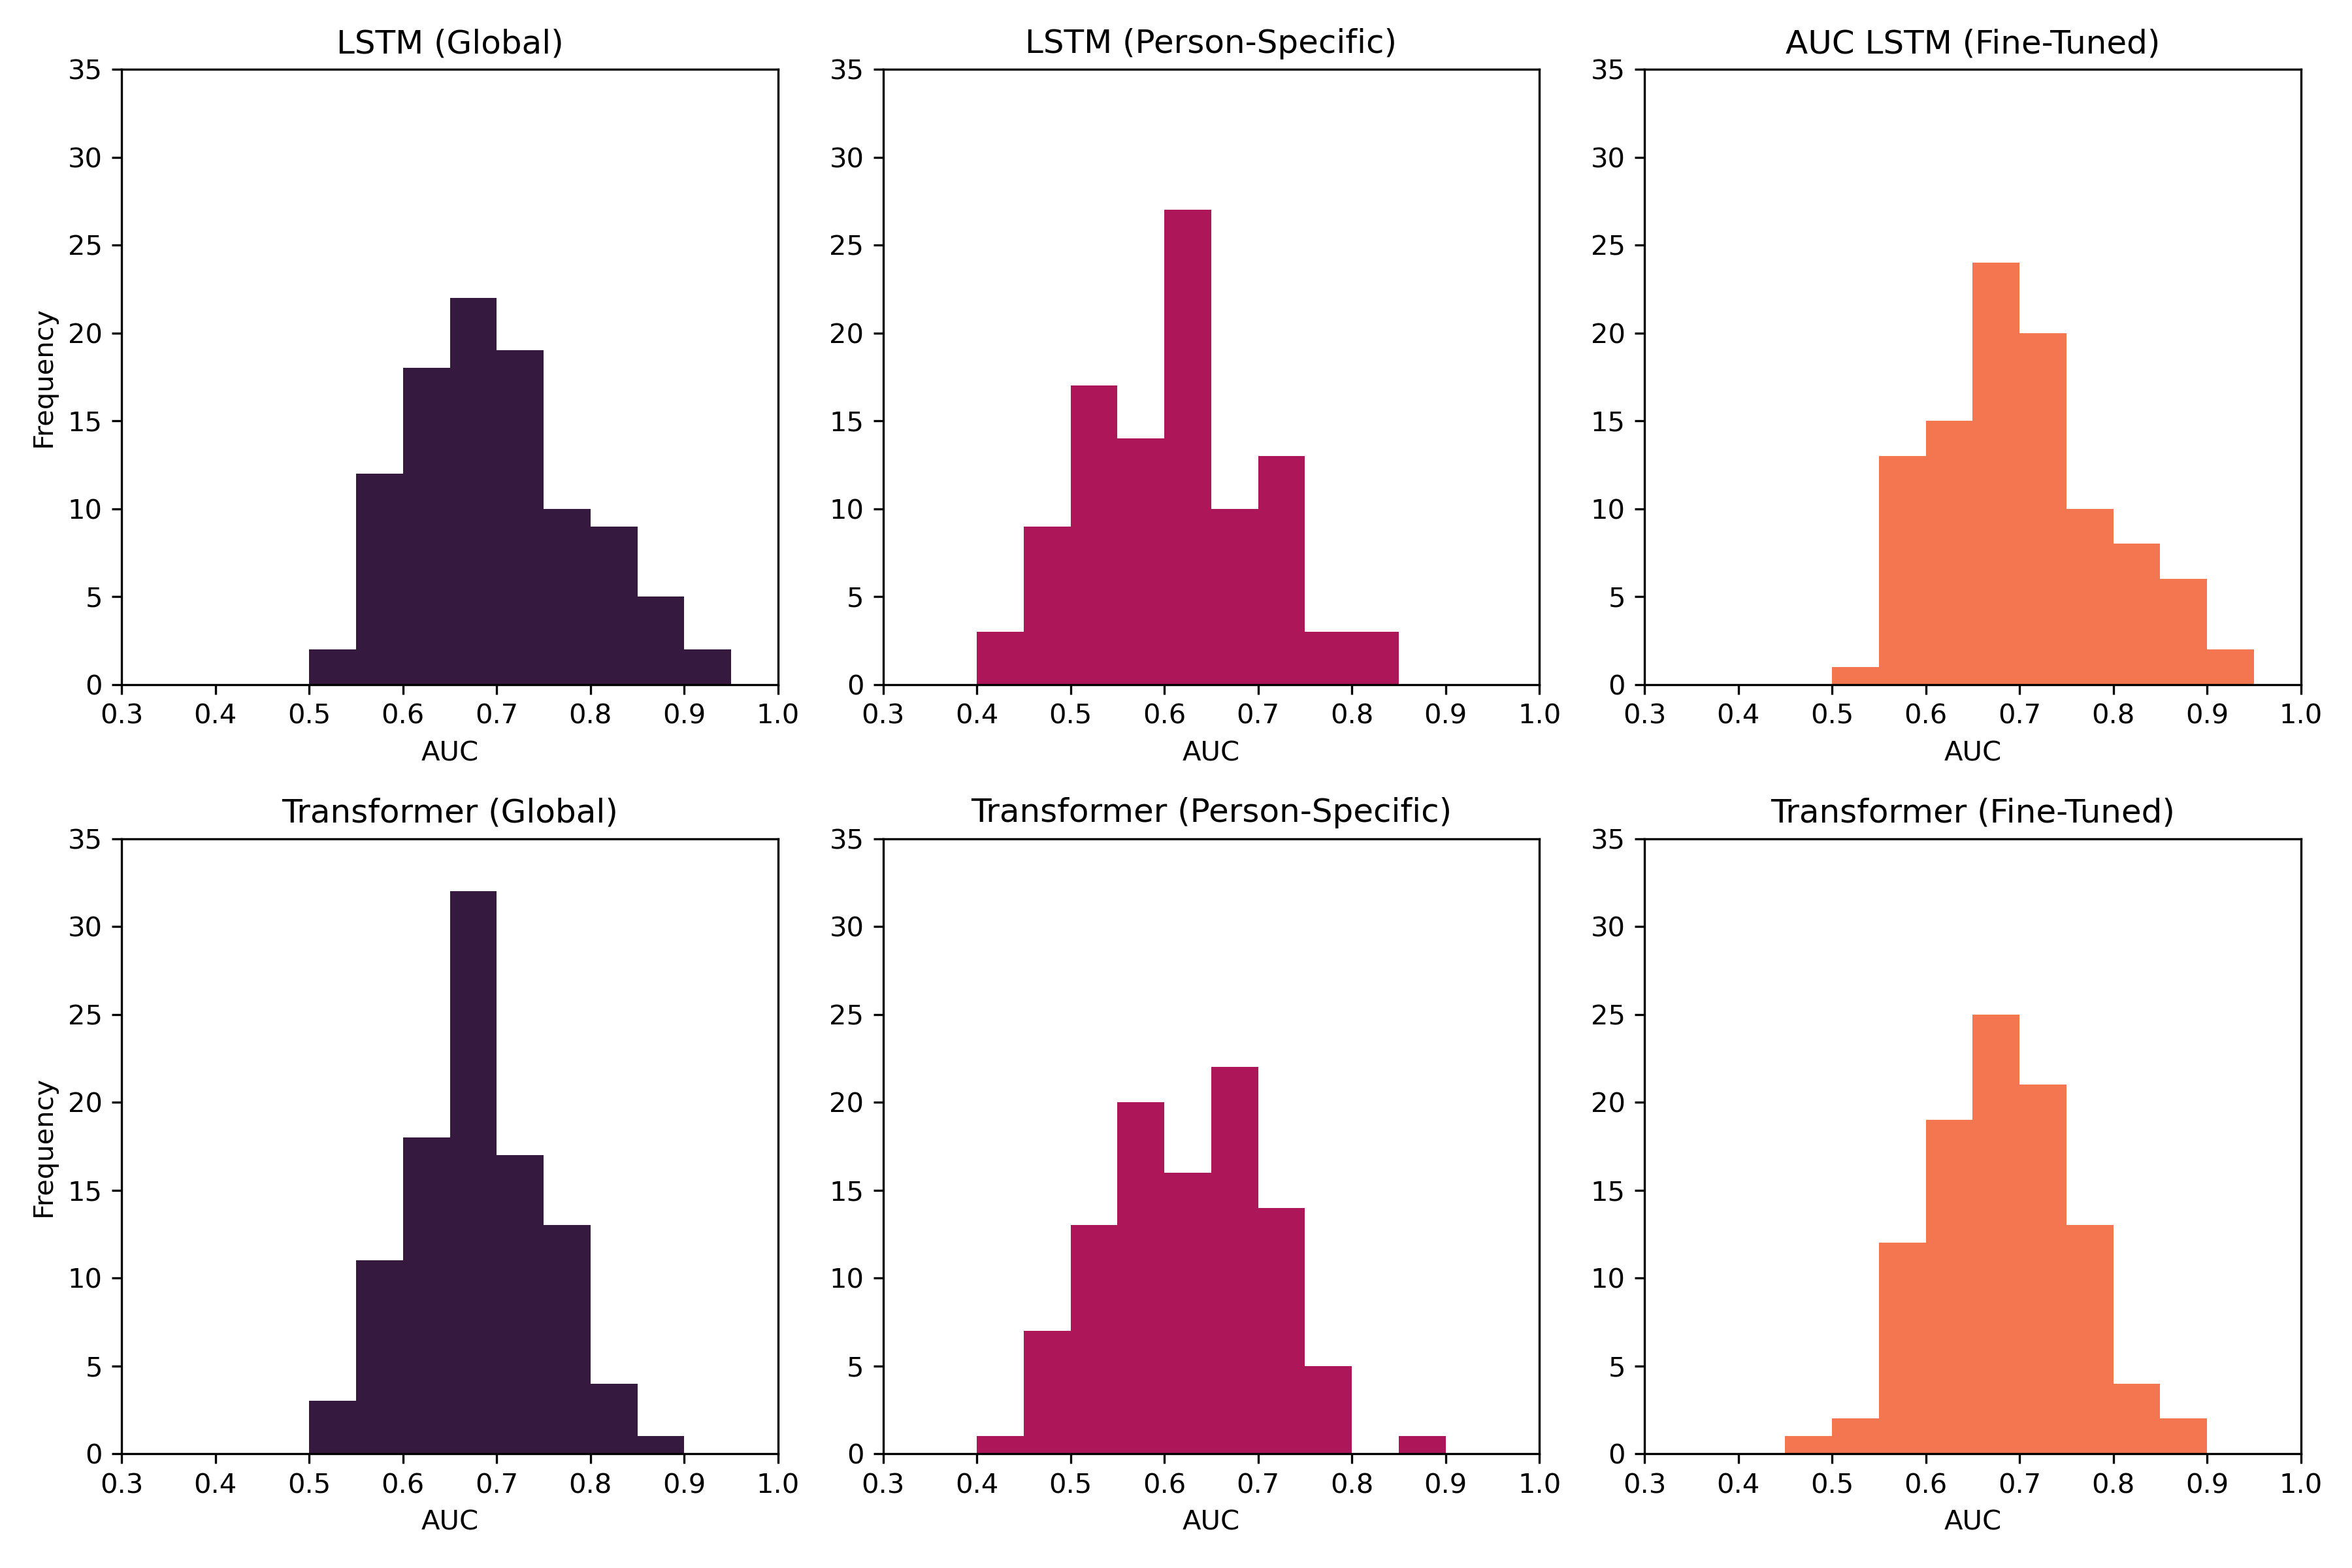
We then evaluated the global model on the individual test set of each participant to analyze the distribution of model performance scores across individuals. For this purpose, we computed separate AUC scores for each individual test set based on the predicted probability scores of the global models. We found considerable variance in the predictability of social media use across individuals for the global model. On average, the LSTM models yielded an AUC of 0.699 (SD=0.088, Min=0.515, Max=0.908), and the transformer models yielded an AUC of 0.679 (SD=0.072, Min=0.507, Max=0.853). The difference between global and person-level AUC scores indicates that the global model picks up on between-person variation in addition to within-person variation. A graphical representation of the distributions can be found in Figure 2.
To determine the sensitivity of the results to data cleaning decisions, we also evaluated an additional set of models trained on a less conservatively cleaned data set (i.e., including launcher and other system UI processes). While the predictive performance in these alternative models was generally higher than in the ones presented here (navigational events can be highly predictive of subsequent app use), the overall pattern of results was almost identical (see SI D). Additionally, we evaluated a set of models accounting for class imbalances in training by weighting the loss for each class with a value inverse to its frequency. The class weights were computed for each individual model based on the relative frequencies observed in its training set. While this approach led to slightly lower predictive performance in the case of transformer models, the overall pattern of results was almost identical to those of the main analysis as well (see SI F).
Person-Specific Modeling.
Next, we trained a series of models for each participant to test whether idiosyncratic patterns of social media use would be better represented in person-specific models. Hyperparameter search was performed on person-level validation data, and model performance was evaluated on person-level test data. The splits were held constant with respect to those used for the global model. Similar to the global model, the person-specific models showed varying predictive performance across individuals. On average, the LSTM models yielded an AUC of 0.609 (SD=0.092, Min=0.414, Max=0.817), and the transformer models yielded an AUC of 0.627 (SD=0.087, Min=0.447, Max=0.861). The models did not outperform the global model on average, but for a small subset of participants (LSTM: 13.13% of participants; transformer: 26.26% of participants), the individual models showed improved model performance. A graphical representation of the distributions can be found in Figure 2.
To test whether the relative strength of the global models compared to person-specific models was based on its ability to represent diverse behavioral patterns or simply because individuals exhibited very similar behavioral patterns in the first place, we examined the generalizability of person-specific models across participants. If the person-specific models were to generalize well across participants, this would indicate that their patterns of social media use were indeed similar. If the person-specific models did not generalize across individuals, we would conclude the inverse. This would suggest that the global models, too, were able to represent a multitude of idiosyncratic behavioral patterns.
We evaluated each person-specific model on the testing sets of all other individuals across the whole sample and then compared the average performance to the original results. We found that person-specific models did not generalize well across individuals with an average performance of AUC=0.526 for LSTM and AUC=0.538 for transformer models, both of which are considerably lower than their performance on within-person testing data and marginally beat the chance baseline of AUC=0.5. These results indicate that the person-specific models do not pick up on general behavioral patterns that are common across individuals. Instead, the strength of the models, including the pre-trained global models, seems to be driven by their ability to capture a multitude of individual behavioral patterns.
Fine-Tuning Global Models on Person-Specific Data.
We fine-tuned the pre-trained global model to test whether personalized models could benefit from general representations of patterns of social media use and vice versa. For this purpose, we continued to train the pre-trained global models for up to 1000 additional epochs on the training data of each individual and performed early stopping using the binary cross-entropy loss on the individual’s validation set as the stopping criterion. In order to avoid overriding previously learned relationships, a low learning rate of 0.0001 was applied. This procedure resulted in a fine-tuned LSTM and a fine-tuned transformer model for each individual. On average, the fine-tuned LSTM models yielded an AUC of 0.702 (SD=0.089, Min=0.522, Max=0.908), and the fine-tuned transformer models yielded an AUC of 0.683 (SD=0.077, Min=0.497, Max=0.858). While the fine-tuned models outperformed the global model in most cases (LSTM: 68.68% of participants; transformer: 63.63% of participants), the fine-tuning only resulted in a very minor improvement over and above the global pre-trained model. A graphical representation of the distributions can be found in Figure 2.
In order to incorporate hyperparameter tuning into the fine-tuning approach, an alternative set of fine-tuned models was trained by freezing the model weights of the embedding layers, LSTM layers, and transformer layers while retraining the dense layers and output layers from scratch with another round of hyperparameter search (i.e., adjusting layer dimensions, regularization, and learning rate). This approach places a higher emphasis on finding appropriate hyperparameters at the cost of discarding the model weights of layers for which hyperparameters are tuned. The procedure did not result in improved model performance (see SI E). Taken together, the results show that the pre-trained global models already captured the vast majority of explainable within-person variation in social media use and that fine-tuning provided only limited value.
3.3 Relationships Between Predictability and Behavioral Frequency
To gain a better understanding of the factors driving individual differences in the predictability of social media use, we analyzed its associations with properties of the underlying training data. Specifically, we analyzed the association between predictability scores and frequency measures as indicators of habitual behavior. We found that predictability scores were weakly correlated with the overall volume of data (number of app logs) per person in the global (=-0.014; =0.058) and fine-tuned models (=-0.017; =0.029). As would be expected, the correlation was higher for person-specific models trained on person-level data (=0.273, =0.322). Similarly, predictive performance scores were not related to the absolute number of social media sessions for global models (=-0.049, =0.004) and fine-tuned models (=0.035, =0.003) but were somewhat related for person-specific models (=0.247; =0.258). The proportion of social media sessions relative to the total number of app sessions was weakly negatively related to model performance in global models (=-0.082; =-0.118) and fine-tuned models (=-0.052; =-0.092) but weakly positively related for person-specific models (=0.178; =0.124). These findings indicate that (i) differences in the predictability of social media use are not primarily driven by the availability of training data, even in the case of person-specific models, and (ii) they support the proposition that the predictability of social media use is indeed distinct from behavioral frequency.
3.4 Relationships Between Predictability and Context Size
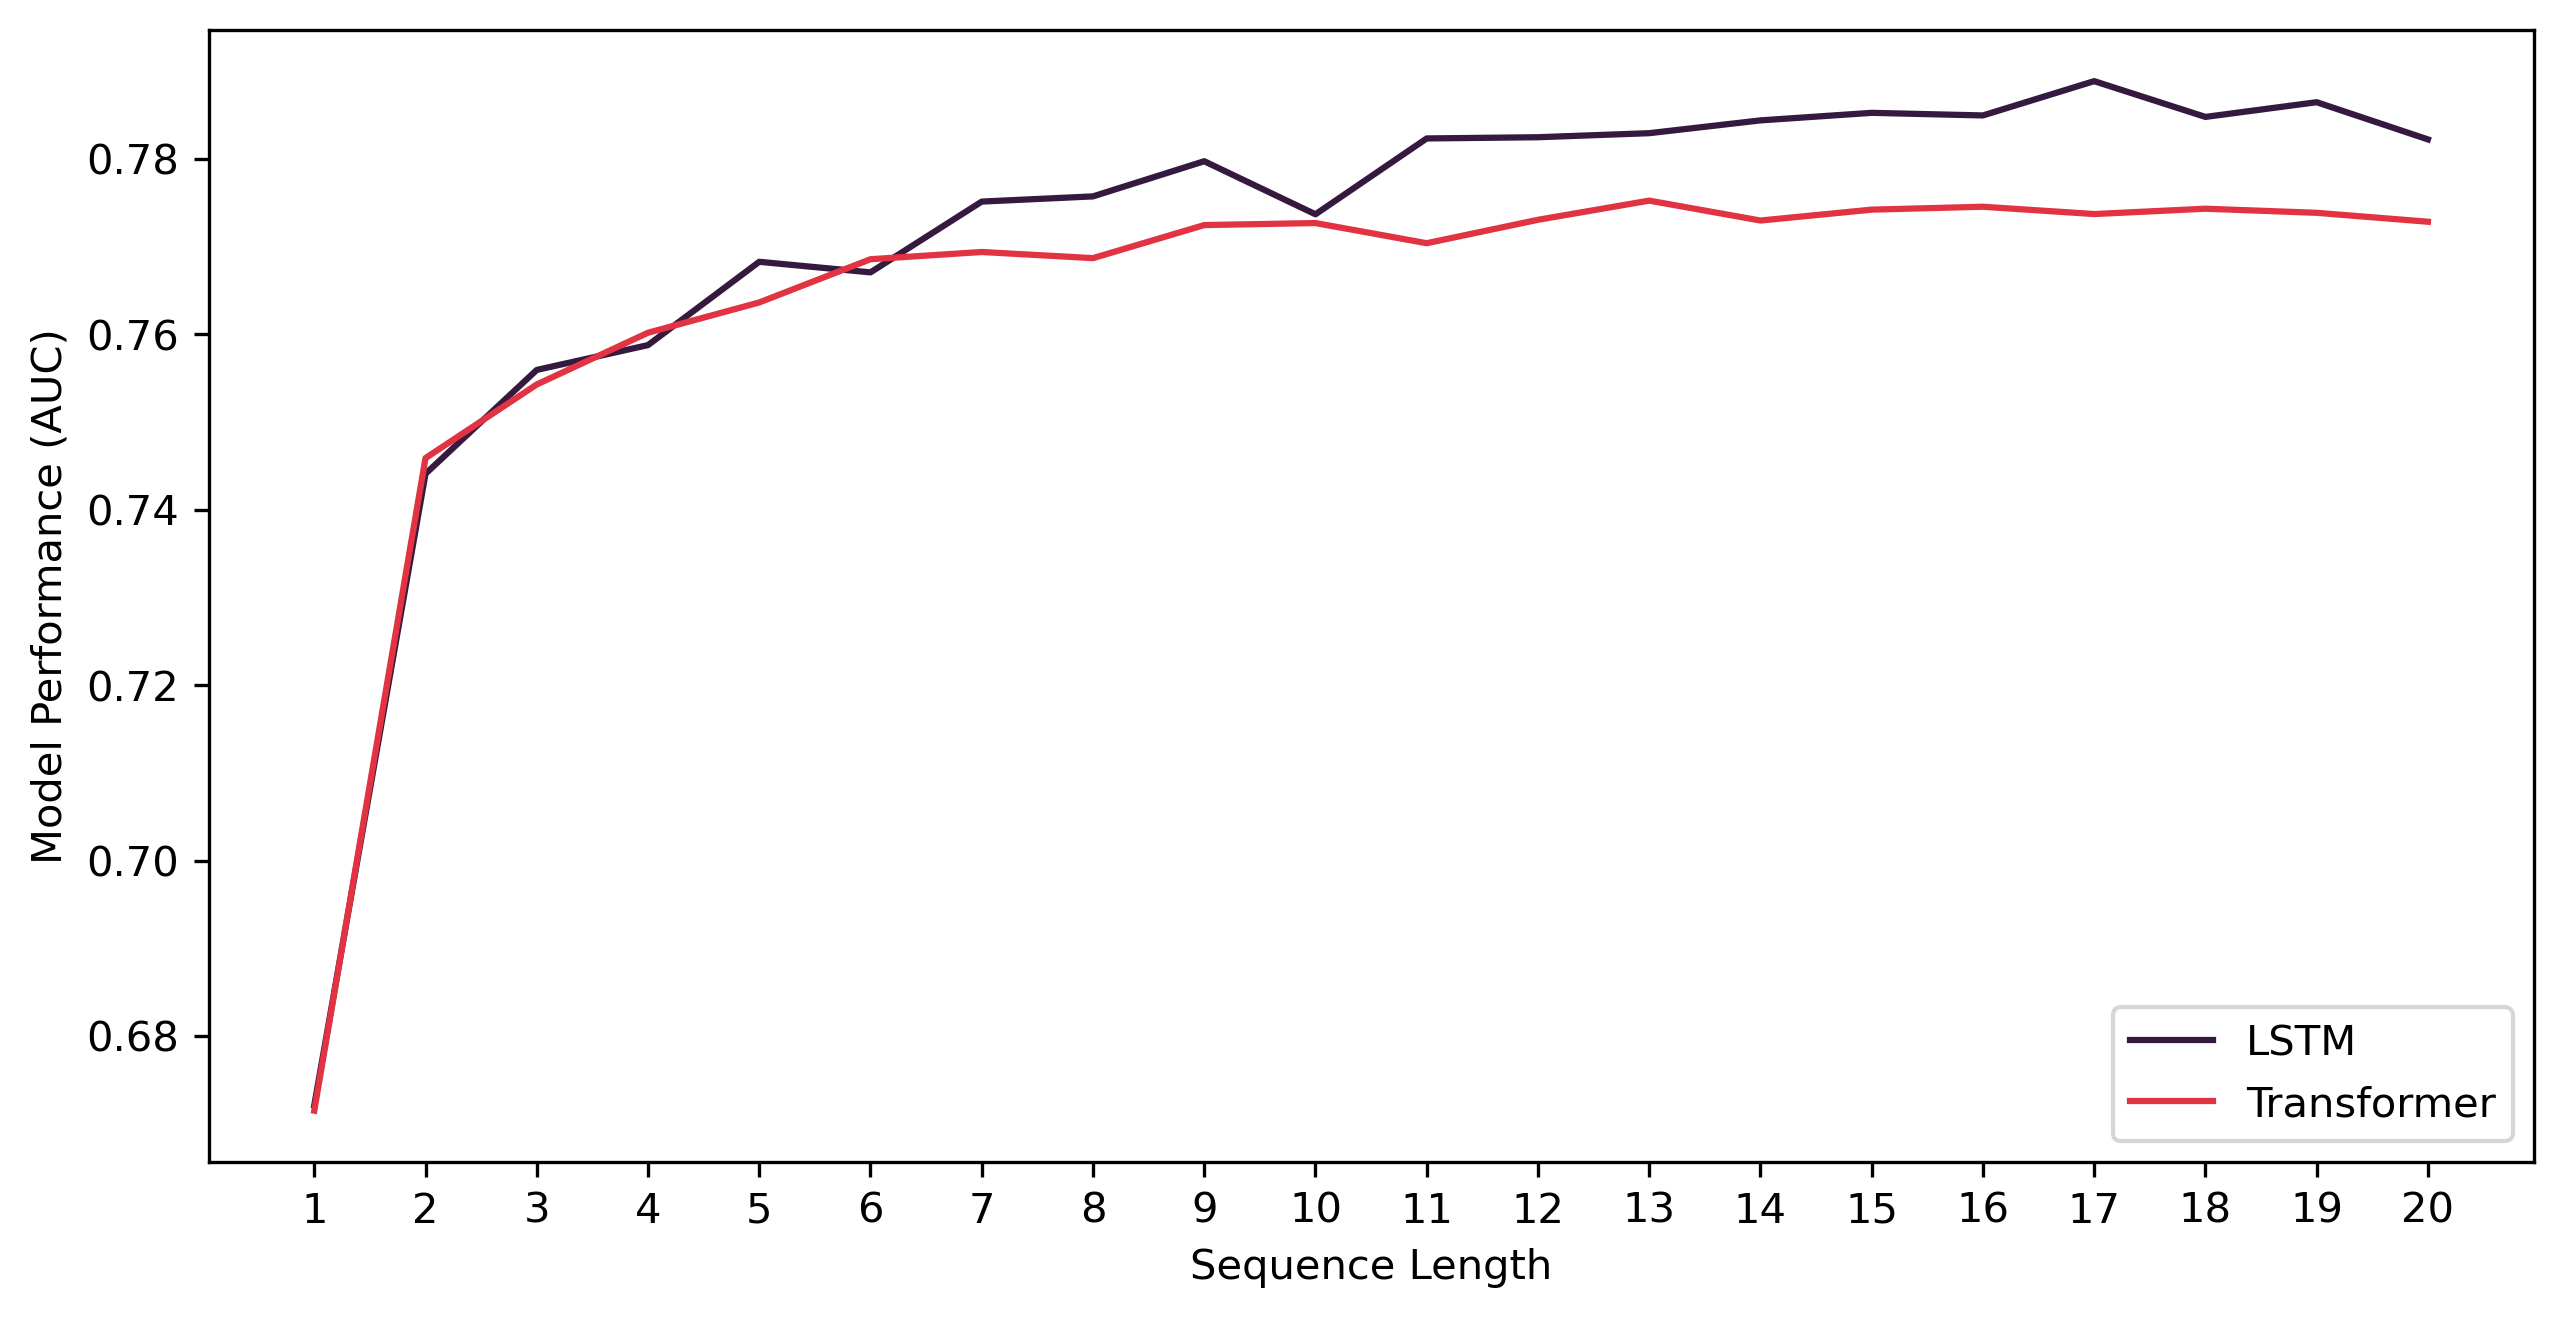
In order to examine the boundaries of the relevant behavioral context, we analyzed model performance as a function of input sequence length (i.e., the number of preceding app sessions available to the model). For this purpose, we re-trained the global model for sequence lengths between one and twenty time steps and another model with 50 preceding app sessions, accounting for the possibility that far-removed behaviors would still contain useful information. The results show that longer sequences are generally associated with higher model performance, with diminishing incremental contributions of each additional time step. The LSTM model reached its best test performance at a sequence length of 17 with an AUC of 0.789, while the transformer model reached its best test performance at a sequence length of 13 with an AUC of 0.775. Models trained on sequences of 50 time steps did not perform better (=0.787; =0.775). The results also reveal that even extremely short sequences are predictive of subsequent social media use. For example, both models performed considerably above chance based on information about only the last preceding app session (=0.672; =0.671). Generally, the incremental performance improvement for each additional unit in sequence length leveled off dramatically for models trained on sequences of more than three to ten app sessions. For a visual presentation of the results, please refer to Figure 3.
4 Discussion
The present paper is among the first to examine the predictability of social media use through the lens of media and technology habits. The results demonstrate that social media use is moderately to highly predictable from preceding smartphone user behaviors. This finding highlights the repetitive, predictable nature of social media habits and is aligned with past research on the predictability of more fine-grained online social behaviors such as active and passive social media use [26], instant messaging [27] or in-app action sequences [28], as well as app usage in general [29, 30, 31, 32, 33, 34].
Contributing specifically to the habits literature, our study highlights the importance and predictive validity of preceding action cues [45], which have not been examined at this level of granularity in previous work. The results indicate that objectively captured preceding action cues contain considerable information about momentary social media use and that the sequential structure of app use matters above and beyond more general behavioral tendencies that have been studied in most previous work [[, see]]bayer_building_2022). Relatedly, our analysis of the relationship between sequence lengths and predictive performance indicates that the relevant context window spans sequences of between roughly three and ten apps, as predictive performance did not increase substantially for longer sequences. While this finding is highly specific to the research setting and the predictive task at hand, it provides an intuitive way to distinguish between longer-term behavioral tendencies and preceding action cues. Behavioral tendencies are captured by the consistency of behavioral frequencies over time, whereas preceding action cues can be defined by their incremental predictive contribution with respect to a focal behavior.
Our results also address the question of the generalizability of social media habits across individuals. As the person-specific models did not generalize well across individuals, our results indicate that the models pick up on idiosyncratic habits [69, 70, 48]. At the same time, the fact that person-specific models did not systematically outperform global models indicates that the global models not only represent general behavioral trends but simultaneously learn a broad range of idiosyncratic patterns, given sufficient training data. These findings raise the question as to whether individual differences in the predictability of social media use can be interpreted as an objective measure of habit strength, focusing on the predictably recurrent nature of habit. The fact that predictive performance scores were not highly correlated with frequency measures of social media use indicates that they capture a fundamentally different aspect of social media habits. While the interpretation of predictability as habit strength still needs to be substantiated by dedicated psychometric analyses, it could open up new opportunities for studying habits based on the wealth of objective behavioral data that is available through consumer electronics and online social platforms [71, 72].
More broadly, the current research represents a novel approach to the study of media and technology habits and affirms the potential of modeling sequential behavior for the future of habit research. By utilizing objective records of smartphone use, our study circumvents these limitations of self-report methods [41] while retaining the ecological validity of studying individuals’ own real-world habits. Moreover, the focus on predictive models designed to represent temporal dependencies presents a new step in the identification of media and technology habits. This approach aligns with the broader shift in behavioral science research towards leveraging objectively trackable data and machine learning to uncover patterns that are not readily apparent through traditional methods [73, 72, 74].
Notably, our analytical framework can be extended to generate a wide range of features related to the predictability of behavior that are not examined in the current research. Aside from analyzing predictive performance purely based on preceding actions, it would be possible to analyze predictive performance with regard to other theoretically relevant constructs. For example, the per-person uptick in predictive performance after adding location data to the model could be interpreted as a “context-contingency score”, indicating the varying degrees to which people’s behaviors are determined by their environments. Similarly, the degree of generalizability of person-specific models could be interpreted as an “idiosyncrasy score”, indicating the extent to which individuals exhibit unique behavioral associations. Relatedly, measures of model complexity (in the absence of regularization) in person-specific models could serve as a measure of habit complexity. Future research should investigate the viability of these suggestions and perform dedicated psychometric analyses.
Finally, our approach may not be limited to the study of social media habits but could also be applied to other behavioral phenomena and theoretical perspectives, such as personality and person-situation transactions. For example, the Cognitive-Affective Personality System (CAPS) [75, 76] defines personality not as a set of static traits but rather as a collection of individual differences in how people respond to varying situations. According to this theory, personality is understood through the distinctive patterns of thoughts, feelings, and behaviors that emerge as individuals interact with specific situational contexts. Our modeling approach would lend itself to examining this notion of personality based on extensive behavioral records. Finding a large predictive contribution of context features and relatively low generalizability across person-specific models would indicate the validity of CAPS with regard to online behaviors and would extend prior work on the behavioral consistency of smartphone use [77].
4.1 Limitations and Directions for Future Research
Our work has several limitations that need to be addressed in future research. Firstly, while the overall volume of data was sufficient to train complex machine learning models, we faced data limitations for the person-specific models. The lack of training data per person is one potential explanation for the finding that person-specific models were outperformed by global models. The relatively low correlation between person-level AUC scores and the number of data points per person, however, suggests that differences in predictability are not merely an artifact introduced by varying degrees of data availability across individuals. Nonetheless, additional research is needed in order to fully rule out concerns related to data coverage. Mirroring the concerns about data coverage for training person-specific models, insufficient fine-tuning data could have decreased the effectiveness of the fine-tuning stage. Importantly, the limited effectiveness of person-specific modeling and fine-tuning could also be related to the decision to frame the predictive task as a binary classification task (i.e., collapsing various social media apps into the single category of “social media use”). This approach likely attenuated some of the idiosyncratic patterns that person-specific or fine-tuned models might have otherwise picked up on. Future research should therefore consider examining a more granular range of target behaviors.
Second, by condensing all social media use into a single category, our approach does not distinguish between different platforms, their unique affordances [78], or the nature of the engagement (e.g., active versus passive use) [79, 80, 81]. While this decision was necessary to standardize the target variable across models, it leaves room for further exploration, as different social media platforms have distinct features and may engender different patterns of usage. For instance, the usage patterns on a visually oriented platform like Instagram may differ from text-based platforms like X or Reddit. Additionally, active use (such as posting or commenting) likely follows different habitual patterns compared to passive use (such as browsing without interacting) – and these differences may have implications for well-being [16]. Future research should take these distinctions into account and examine how different types of social media engagement impact user behavior and experience. This could lead to a more nuanced understanding of social media habits and their effects on individuals, potentially offering more targeted insights for the development of interventions for healthier technology use.
Third, we did not analyze the relationships between person-level predictive performance and self-reported habit measures. Future research should alleviate this concern and also analyze the relationships between predictability scores and other variables known to be related to habitual social media use. However, as we maintain that the predictability of behavior captures an aspect of habits not sufficiently represented in self-report measures, we would not necessarily expect a high correlation. A better empirical test of criterion validity would be whether individual differences in the predictability of social media use show incremental explanatory power above and beyond existing self-report measures. Additionally, future work can compare how preceding sequences relate to other indirect indicators of habitual behavior (e.g., devaluation insensitivity).
Finally, we exclusively focused on preceding user behaviors as input features without incorporating other contextual features that could provide a more complete picture of social media usage patterns. In future research, including other contextual data such as time of day or location could allow for a more explicit examination of the context-contingent nature of social media habits. Similarly, examining the effects of technical cues (e.g., notifications) and data from other smartphone sensors could add nuance to our research. This approach could potentially improve the predictive performance of our models by identifying contextual conditions under which certain behaviors are more or less likely to occur.
4.2 Practical Implications
Aside from its theoretical implications, our work lays the foundations for more habit-centered approaches to user modeling. This shift could, in turn, lead to the development of new technologies and user experiences that are more aligned with users’ needs and preferences. For example, the ability to predict when and what type of app a user is likely to engage with can be utilized for prefetching content [32]. This means that apps could preload content before a user is likely to engage. This not only enhances the user experience by reducing loading times but can also help to manage network traffic more effectively by spreading content download over time.
Another potential opportunity lies in adaptive user interfaces and notifications. Interfaces could adjust their layout and content to align with the user’s predicted preferences and habits at different times. For example, apps that are likely to be used could be presented on the home screen for easy access. Similarly, knowing when users are most likely to engage with social media could help time notifications and alerts more effectively. As smartphone use can have negative effects on productivity [82, 83, 84], predictions of social media engagement could also be used to optimize the delivery timing of messages and avoid unwanted interruptions. A similar idea has been discussed as “bounded deferral” [85, 86], where messages are held back while a user is busy, but only up to a maximum amount of time. For users who wish to balance their social media exposure, predictive models can make interventions more personalized and effective. For example, it has been shown that introducing friction (e.g., a short wait period before opening a social media app) can be highly effective in reducing social media use [87]. Such interventions could be dynamically adjusted based on ongoing or preceding user behavior, making them more relevant and effective. For instance, users might want to intervene in habit-driven use but not goal-directed use.
Finally, a better understanding of social media habits can help policymakers develop user-centric policies to protect young users from the potential harms of excessive media consumption and promote digital well-being [88].
4.3 Conclusion
Taken together, our results indicate that social media use is predictable within and across individuals and that global models are capable of making accurate predictions, even at the within-person level. By utilizing objective behavioral time series data, employing advanced predictive models, and examining the predictability of social media use at both the within and between-person level, our work highlights a new direction in habit research. Our findings shed light on the predictive validity of preceding action cues and the value of sequential information in predicting social media habits. In addition, our findings reveal individual differences in the predictability of social media use and raise the question as to whether they can be interpreted as a novel indicator of habit strength. Finally, our study not only enhances our understanding of media consumption behaviors but also paves the way for more data-driven strategies to manage everyday media and technology habits.
Ethics approval
The study was approved by the Stanford University IRB (Protocol #48234). All methods were carried out in accordance with relevant guidelines and regulations.
Availability of data and materials
The code used to generate the results is available on this paper’s OSF page (https://osf.io/rkswe/). The data needed to reproduce the analyses will be made available after peer review of the manuscript is complete.
Competing interests
The authors declare no potential conflicts of interest.
Author contributions
HP: Conceptualization, Methodology, Software, Formal analysis, Visualization, Writing - Original Draft; JBB: Conceptualization, Writing - Review & Editing; SCM: Conceptualization, Writing - Review & Editing; YC: Data Curation, Software; SSV: Writing - Review & Editing; GMH: Conceptualization, Resources, Writing - Review & Editing, Supervision, Project administration, Funding acquisition
Acknowledgments
This research was supported in part by the Stanford Institute for Human-Centered Artificial Intelligence (HAI) with a Google Cloud Credit Award and a Stanford HAI Seed Grant. The authors would like to thank Katherine Roehrick and Serena Soh for their research assistance with this study and their role in data collection.
References
- [1] Statista “U.S.: mobile phone daily usage time 2024” In Statista, 2024 URL: https://www.statista.com/statistics/1045353/mobile-device-daily-usage-time-in-the-us/
- [2] Cheryl L. Coyle and Heather Vaughn “Social networking: Communication revolution or evolution?” Conference Name: Bell Labs Technical Journal In Bell Labs Technical Journal 13.2, 2008, pp. 13–17 DOI: 10.1002/bltj.20298
- [3] Trevor Diehl, Brian E Weeks and Homero Gil de Zúñiga “Political persuasion on social media: Tracing direct and indirect effects of news use and social interaction” Publisher: SAGE Publications In New Media & Society 18.9, 2016, pp. 1875–1895 DOI: 10.1177/1461444815616224
- [4] Christian Licoppe and Zbigniew Smoreda “Are social networks technologically embedded?: How networks are changing today with changes in communication technology” In Social Networks 27.4, The Dynamics of Personal Networks, 2005, pp. 317–335 DOI: 10.1016/j.socnet.2004.11.001
- [5] Thomas Zeitzoff “How Social Media Is Changing Conflict” Publisher: SAGE Publications Inc In Journal of Conflict Resolution 61.9, 2017, pp. 1970–1991 DOI: 10.1177/0022002717721392
- [6] Homero Gil de Zúñiga, Brian Weeks and Alberto Ardèvol-Abreu “Effects of the News-Finds-Me Perception in Communication: Social Media Use Implications for News Seeking and Learning About Politics” In Journal of Computer-Mediated Communication 22.3, 2017, pp. 105–123 DOI: 10.1111/jcc4.12185
- [7] Sun Kyong Lee, Nathan J. Lindsey and Kyun Soo Kim “The effects of news consumption via social media and news information overload on perceptions of journalistic norms and practices” In Computers in Human Behavior 75, 2017, pp. 254–263 DOI: 10.1016/j.chb.2017.05.007
- [8] Susan Vermeer, Damian Trilling, Sanne Kruikemeier and Claes Vreese “Online News User Journeys: The Role of Social Media, News Websites, and Topics” Publisher: Routledge _eprint: https://doi.org/10.1080/21670811.2020.1767509 In Digital Journalism 8.9, 2020, pp. 1114–1141 DOI: 10.1080/21670811.2020.1767509
- [9] Mason Walker and Katerina Eva Matsa “News Consumption Across Social Media in 2021” In Pew Research Center’s Journalism Project, 2021 URL: https://www.pewresearch.org/journalism/2021/09/20/news-consumption-across-social-media-in-2021/
- [10] Hunt Allcott, Luca Braghieri, Sarah Eichmeyer and Matthew Gentzkow “The Welfare Effects of Social Media” In American Economic Review 110.3, 2020, pp. 629–676 DOI: 10.1257/aer.20190658
- [11] Joseph B. Bayer, Ian A. Anderson and Robert S. Tokunaga “Building and breaking social media habits” In Current Opinion in Psychology 45, 2022, pp. 279–288 DOI: 10.1016/j.copsyc.2022.101303
- [12] Julia Brailovskaia, Fabienne Ströse, Holger Schillack and Jürgen Margraf “Less Facebook use – More well-being and a healthier lifestyle? An experimental intervention study” In Computers in Human Behavior 108, 2020, pp. 106332 DOI: 10.1016/j.chb.2020.106332
- [13] Jesse Fox and Jennifer J. Moreland “The dark side of social networking sites: An exploration of the relational and psychological stressors associated with Facebook use and affordances” In Computers in Human Behavior 45, 2015, pp. 168–176 DOI: 10.1016/j.chb.2014.11.083
- [14] Melissa G. Hunt, Rachel Marx, Courtney Lipson and Jordyn Young “No More FOMO: Limiting Social Media Decreases Loneliness and Depression” Publisher: Guilford Publications Inc. In Journal of Social and Clinical Psychology 37.10, 2018, pp. 751–768 DOI: 10.1521/jscp.2018.37.10.751
- [15] Brian A. Primack et al. “Social Media Use and Perceived Social Isolation Among Young Adults in the U.S.” In American Journal of Preventive Medicine 53.1, 2017, pp. 1–8 DOI: 10.1016/j.amepre.2017.01.010
- [16] Philippe Verduyn et al. “Passive Facebook usage undermines affective well-being: Experimental and longitudinal evidence” Place: US Publisher: American Psychological Association In Journal of Experimental Psychology: General 144.2, 2015, pp. 480–488 DOI: 10.1037/xge0000057
- [17] Sumer S. Vaid et al. “Variation in social media sensitivity across people and contexts” In Scientific Reports 14.1, 2024, pp. 6571 DOI: 10.1038/s41598-024-55064-y
- [18] Ian A. Anderson and Wendy Wood “Habits and the electronic herd: The psychology behind social media’s successes and failures” In Consumer Psychology Review 4.1, 2021, pp. 83–99 DOI: 10.1002/arcp.1063
- [19] Joseph B. Bayer and Robert LaRose “Technology Habits: Progress, Problems, and Prospects” In The Psychology of Habit Cham: Springer International Publishing, 2018, pp. 111–130 URL: http://link.springer.com/10.1007/978-3-319-97529-0_7
- [20] Benjamin Gardner and Amanda L. Rebar “Habit Formation and Behavior Change” In Oxford Research Encyclopedia of Psychology Oxford University Press, 2019 DOI: 10.1093/acrefore/9780190236557.013.129
- [21] Anna Schnauber-Stockmann and Teresa K. Naab “The process of forming a mobile media habit: results of a longitudinal study in a real-world setting” In Media Psychology 22.5, 2019, pp. 714–742 DOI: 10.1080/15213269.2018.1513850
- [22] Robert S. Tokunaga “Media Use as Habit” _eprint: https://onlinelibrary.wiley.com/doi/pdf/10.1002/9781119011071.iemp0102 In The International Encyclopedia of Media Psychology Hoboken, Nj: John Wiley & Sons, Ltd, 2020, pp. 1–5 DOI: 10.1002/9781119011071.iemp0102
- [23] Bas Verplanken “Beyond frequency: Habit as mental construct” _eprint: https://onlinelibrary.wiley.com/doi/pdf/10.1348/014466605X49122 In British Journal of Social Psychology 45.3, 2006, pp. 639–656 DOI: 10.1348/014466605X49122
- [24] Wendy Wood and Dennis Rünger “Psychology of Habit” _eprint: https://doi.org/10.1146/annurev-psych-122414-033417 In Annual Review of Psychology 67.1, 2016, pp. 289–314 DOI: 10.1146/annurev-psych-122414-033417
- [25] Joseph B. Bayer, Sonya Dal Cin, Scott W. Campbell and Elliot Panek “Consciousness and Self-Regulation in Mobile Communication” In Human Communication Research 42.1, 2016, pp. 71–97 DOI: 10.1111/hcre.12067
- [26] Heinrich Peters et al. “Context-Aware Prediction of User Engagement on Online Social Platforms” arXiv:2310.14533 [cs] In arXiv:2310.14533 [cs], 2023 URL: http://arxiv.org/abs/2310.14533
- [27] Heinrich Peters et al. “Predicting Attentiveness and Responsiveness in Instant Messaging - Evidence from a Large Online Social Platform” In 6th-annual Psychology of Technology Conference, 2022
- [28] Yozen Liu, Xiaolin Shi, Lucas Pierce and Xiang Ren “Characterizing and Forecasting User Engagement with In-App Action Graph: A Case Study of Snapchat” In Proceedings of the 25th ACM SIGKDD International Conference on Knowledge Discovery & Data Mining, KDD ’19 New York, USA: ACM, 2019, pp. 2023–2031 DOI: 10.1145/3292500.3330750
- [29] Ricardo Baeza-Yates, Di Jiang, Fabrizio Silvestri and Beverly Harrison “Predicting The Next App That You Are Going To Use” In Proceedings of the Eighth ACM International Conference on Web Search and Data Mining, WSDM ’15 New York, NY, USA: ACM, 2015, pp. 285–294 DOI: 10.1145/2684822.2685302
- [30] Ke Huang, Chunhui Zhang, Xiaoxiao Ma and Guanling Chen “Predicting mobile application usage using contextual information” In Proceedings of the 2012 ACM Conference on Ubiquitous Computing, UbiComp ’12 New York, NY, USA: ACM, 2012, pp. 1059–1065 DOI: 10.1145/2370216.2370442
- [31] Nagarajan Natarajan, Donghyuk Shin and Inderjit S. Dhillon “Which app will you use next? collaborative filtering with interactional context” In Proceedings of the 7th ACM conference on Recommender systems, RecSys ’13 New York, NY, USA: ACM, 2013, pp. 201–208 DOI: 10.1145/2507157.2507186
- [32] Abhinav Parate et al. “Practical prediction and prefetch for faster access to applications on mobile phones” In Proceedings of the 2013 ACM international joint conference on Pervasive and ubiquitous computing, UbiComp ’13 New York, NY, USA: ACM, 2013, pp. 275–284 DOI: 10.1145/2493432.2493490
- [33] Tong Xia et al. “DeepApp: Predicting Personalized Smartphone App Usage via Context-Aware Multi-Task Learning” In ACM Transactions on Intelligent Systems and Technology 11.6, 2020, pp. 1–12 DOI: 10.1145/3408325
- [34] Shijian Xu et al. “Predicting and Recommending the next Smartphone Apps based on Recurrent Neural Network” In CCF Transactions on Pervasive Computing and Interaction 2.4, 2020, pp. 314–328 DOI: 10.1007/s42486-020-00045-z
- [35] Stephan Nebe, André Kretzschmar, Maike C. Brandt and Philippe N. Tobler “Characterizing Human Habits in the Lab” In Collabra: Psychology 10.1, 2024, pp. 92949 DOI: 10.1525/collabra.92949
- [36] Alana I. Mendelsohn “Creatures of Habit: The Neuroscience of Habit and Purposeful Behavior” In Biological psychiatry 85.11, 2019, pp. e49–e51 DOI: 10.1016/j.biopsych.2019.03.978
- [37] Bas Verplanken and Sheina Orbell “Reflections on Past Behavior: A Self-Report Index of Habit Strength” _eprint: https://onlinelibrary.wiley.com/doi/pdf/10.1111/j.1559-1816.2003.tb01951.x In Journal of Applied Social Psychology 33.6, 2003, pp. 1313–1330 DOI: 10.1111/j.1559-1816.2003.tb01951.x
- [38] Benjamin Gardner, Charles Abraham, Phillippa Lally and Gert-Jan Bruijn “Towards parsimony in habit measurement: Testing the convergent and predictive validity of an automaticity subscale of the Self-Report Habit Index” In International Journal of Behavioral Nutrition and Physical Activity 9.1, 2012, pp. 102 DOI: 10.1186/1479-5868-9-102
- [39] Viswanath Venkatesh, James Y.. Thong and Xin Xu “Consumer Acceptance and Use of Information Technology: Extending the Unified Theory of Acceptance and Use of Technology” Publisher: Management Information Systems Research Center, University of Minnesota In MIS Quarterly 36.1, 2012, pp. 157–178 DOI: 10.2307/41410412
- [40] Teresa K. Naab and Anna Schnauber “Habitual Initiation of Media Use and a Response-Frequency Measure for Its Examination” In Media Psychology 19.1, 2016, pp. 126–155 DOI: 10.1080/15213269.2014.951055
- [41] Sarah C. Boyle, Sebastian Baez, Bradley M. Trager and Joseph W. LaBrie “Systematic Bias in Self-Reported Social Media Use in the Age of Platform Swinging: Implications for Studying Social Media Use in Relation to Adolescent Health Behavior” In International Journal of Environmental Research and Public Health 19.16, 2022, pp. 9847 DOI: 10.3390/ijerph19169847
- [42] Joseph B. Bayer, Scott W. Campbell and Rich Ling “Connection Cues: Activating the Norms and Habits of Social Connectedness” In Communication Theory 26.2, 2016, pp. 128–149 DOI: 10.1111/comt.12090
- [43] Joseph B. Bayer and Scott W. Campbell “Texting while driving on automatic: Considering the frequency-independent side of habit” Publisher: Elsevier In Computers in Human Behavior 28.6, 2012, pp. 2083–2090 URL: https://www.sciencedirect.com/science/article/pii/S0747563212001628
- [44] Alberto Roffarello and Luigi Russis “Understanding and Streamlining App Switching Experiences in Mobile Interaction” In International Journal of Human-Computer Studies 158.2, 2021, pp. 102735 DOI: 10.1016/j.ijhcs.2021.102735
- [45] Wendy Wood “Habit in Personality and Social Psychology” Publisher: SAGE Publications Inc In Personality and Social Psychology Review 21.4, 2017, pp. 389–403 DOI: 10.1177/1088868317720362
- [46] Ellen L. Hamaker and Conor V. Dolan “Idiographic data analysis: Quantitative methods—from simple to advanced” In Dynamic process methodology in the social and developmental sciences New York, NY, US: Springer Science + Business Media, 2009, pp. 191–216 DOI: 10.1007/978-0-387-95922-1_9
- [47] Jonas M.. Haslbeck and Oisín Ryan “Recovering Within-Person Dynamics from Psychological Time Series” Publisher: Routledge _eprint: https://doi.org/10.1080/00273171.2021.1896353 In Multivariate Behavioral Research 57.5, 2022, pp. 735–766 DOI: 10.1080/00273171.2021.1896353
- [48] Phillippa Lally, Cornelia H.. Van Jaarsveld, Henry W.. Potts and Jane Wardle “How are habits formed: Modelling habit formation in the real world” In European Journal of Social Psychology 40.6, 2010, pp. 998–1009 DOI: 10.1002/ejsp.674
- [49] Peter Molenaar “A Manifesto on Psychology as Idiographic Science: Bringing the Person Back Into Scientific Psychology, This Time Forever” In Measurement: Interdisciplinary Research & Perspective 2, 2004, pp. 201–218 DOI: 10.1207/s15366359mea0204_1
- [50] Peter C.M. Molenaar and Cynthia G. Campbell “The New Person-Specific Paradigm in Psychology” Publisher: [Association for Psychological Science, Sage Publications, Inc.] In Current Directions in Psychological Science 18.2, 2009, pp. 112–117 URL: https://www.jstor.org/stable/20696008
- [51] Nilam Ram, Nick Haber, Thomas N. Robinson and Byron Reeves “Binding the Person-Specific Approach to Modern AI in the Human Screenome Project: Moving past Generalizability to Transferability” Publisher: Routledge _eprint: https://doi.org/10.1080/00273171.2023.2229305 In Multivariate Behavioral Research, 2023, pp. 1–9 DOI: 10.1080/00273171.2023.2229305
- [52] Emorie D. Beck and Joshua J. Jackson “Personalized Prediction of Behaviors and Experiences: An Idiographic Person–Situation Test” Publisher: SAGE Publications Inc In Psychological Science 33.10, 2022, pp. 1767–1782 DOI: 10.1177/09567976221093307
- [53] Sepp Hochreiter and Jürgen Schmidhuber “Long Short-Term Memory” In Neural Computation 9.8, 1997, pp. 1735–1780 DOI: 10.1162/neco.1997.9.8.1735
- [54] Jürgen Schmidhuber “Deep learning in neural networks: An overview” In Neural Networks 61, 2015, pp. 85–117 DOI: 10.1016/j.neunet.2014.09.003
- [55] Ashish Vaswani et al. “Attention is all you need” In Proceedings of the 31st International Conference on Neural Information Processing Systems, NIPS’17 Red Hook, NY: Curran Associates, 2017, pp. 6000–6010
- [56] Byron Reeves et al. “Screenomics: A Framework to Capture and Analyze Personal Life Experiences and the Ways that Technology Shapes Them” Publisher: Taylor & Francis _eprint: https://doi.org/10.1080/07370024.2019.1578652 In Human–Computer Interaction 36.2, 2021, pp. 150–201 DOI: 10.1080/07370024.2019.1578652
- [57] Joseph B. Bayer, Penny Trieu and Nicole B. Ellison “Social Media Elements, Ecologies, and Effects” In Annual Review of Psychology 71.1, 2020, pp. 471–497 DOI: 10.1146/annurev-psych-010419-050944
- [58] Alex Graves, Navdeep Jaitly and Abdel-rahman Mohamed “Hybrid speech recognition with Deep Bidirectional LSTM” In 2013 IEEE Workshop on Automatic Speech Recognition and Understanding, 2013, pp. 273–278 DOI: 10.1109/ASRU.2013.6707742
- [59] Song Han et al. “ESE: Efficient Speech Recognition Engine with Sparse LSTM on FPGA” In Proceedings of the 2017 ACM/SIGDA International Symposium on Field-Programmable Gate Arrays, FPGA ’17 New York, NY, USA: ACM, 2017, pp. 75–84 DOI: 10.1145/3020078.3021745
- [60] Sima Siami-Namini, Neda Tavakoli and Akbar Siami Namin “The Performance of LSTM and BiLSTM in Forecasting Time Series” In 2019 IEEE International Conference on Big Data (Big Data), 2019, pp. 3285–3292 DOI: 10.1109/BigData47090.2019.9005997
- [61] Jacob Devlin, Ming-Wei Chang, Kenton Lee and Kristina Toutanova “BERT: Pre-training of Deep Bidirectional Transformers for Language Understanding” In Proceedings of the 2019 Conference of the North American Chapter of the Association for Computational Linguistics: Human Language Technologies, Volume 1 (Long and Short Papers) Minneapolis, Minnesota: Association for Computational Linguistics, 2019, pp. 4171–4186 DOI: 10.18653/v1/N19-1423
- [62] OpenAI “GPT-4 Technical Report”, 2023 URL: https://cdn.openai.com/papers/gpt-4.pdf
- [63] Yikuan Li et al. “BEHRT: Transformer for Electronic Health Records” Number: 1 Publisher: Nature Publishing Group In Scientific Reports 10.1, 2020, pp. 7155 DOI: 10.1038/s41598-020-62922-y
- [64] Germans Savcisens et al. “Using sequences of life-events to predict human lives” Number: 1 Publisher: Nature Publishing Group In Nature Computational Science 4.1, 2024, pp. 43–56 DOI: 10.1038/s43588-023-00573-5
- [65] Diederik P. Kingma and Jimmy Ba “Adam: A Method for Stochastic Optimization” arXiv:1412.6980 [cs] In arXiv:1412.6980 [cs], 2017 DOI: 10.48550/arXiv.1412.6980
- [66] Stefan Falkner, Aaron Klein and Frank Hutter “BOHB: Robust and Efficient Hyperparameter Optimization at Scale” ISSN: 2640-3498 In Proceedings of the 35th International Conference on Machine Learning Stockholm, Sweden: PMLR, 2018, pp. 1437–1446 URL: https://proceedings.mlr.press/v80/falkner18a.html
- [67] Martín Abadi et al. “TensorFlow: a system for large-scale machine learning” In Proceedings of the 12th USENIX conference on Operating Systems Design and Implementation, OSDI’16 Savannah, GA: USENIX Association, 2016, pp. 265–283
- [68] Tom O’Malley et al. “Keras Tuner” original-date: 2019-06-06T22:38:21Z Keras, 2019 URL: https://github.com/keras-team/keras-tuner
- [69] Benjamin Gardner “A review and analysis of the use of ‘habit’ in understanding, predicting and influencing health-related behaviour” In Health Psychology Review 9.3, 2015, pp. 277–295 DOI: 10.1080/17437199.2013.876238
- [70] Benjamin Gardner and Phillippa Lally “Modelling Habit Formation and Its Determinants” In The Psychology of Habit: Theory, Mechanisms, Change, and Contexts Cham: Springer International Publishing, 2018, pp. 207–229 DOI: 10.1007/978-3-319-97529-0_12
- [71] Gabriella M. Harari et al. “Using Smartphones to Collect Behavioral Data in Psychological Science: Opportunities, Practical Considerations, and Challenges” Publisher: SAGE Publications Inc In Perspectives on Psychological Science 11.6, 2016, pp. 838–854 DOI: 10.1177/1745691616650285
- [72] Heinrich Peters, Zachariah Marrero and Samuel D. Gosling “The Big Data toolkit for psychologists: Data sources and methodologies” In The psychology of technology: Social science research in the age of Big Data Washington, DC, US: American Psychological Association, 2022, pp. 87–124 DOI: 10.1037/0000290-004
- [73] David M.. Lazer et al. “Computational social science: Obstacles and opportunities” Publisher: American Association for the Advancement of Science In Science 369.6507, 2020, pp. 1060–1062 DOI: 10.1126/science.aaz8170
- [74] Clemens Stachl et al. “Personality Research and Assessment in the Era of Machine Learning” _eprint: https://onlinelibrary.wiley.com/doi/pdf/10.1002/per.2257 In European Journal of Personality 34.5, 2020, pp. 613–631 DOI: https://doi.org/10.1002/per.2257
- [75] Walter Mischel “Toward a cognitive social learning reconceptualization of personality.” In Psychological Review 80.4, 1974, pp. 252 DOI: 10.1037/h0035002
- [76] Walter Mischel and Yuichi Shoda “A cognitive-affective system theory of personality: Reconceptualizing situations, dispositions, dynamics, and invariance in personality structure” Place: US Publisher: American Psychological Association In Psychological Review 102.2, 1995, pp. 246–268 DOI: 10.1037/0033-295X.102.2.246
- [77] Heather Shaw, Paul J. Taylor, David A. Ellis and Stacey M. Conchie “Behavioral Consistency in the Digital Age” Publisher: SAGE Publications Inc In Psychological Science 33.3, 2022, pp. 364–370 DOI: 10.1177/09567976211040491
- [78] Taina Bucher and Anne Helmond “The Affordances of Social Media Platforms” In The SAGE Handbook of Social Media Thousand Oaks, CA: Sage Publications, 2018, pp. 233–253 DOI: 10.4135/9781473984066
- [79] César G. Escobar-Viera et al. “Passive and Active Social Media Use and Depressive Symptoms Among United States Adults” In Cyberpsychology, Behavior, and Social Networking 21.7, 2018, pp. 437–443 DOI: 10.1089/cyber.2017.0668
- [80] Kimberley Hemmings-Jarrett, Julian Jarrett and M. Blake “Evaluation of User Engagement on Social Media to Leverage Active and Passive Communication” In 2017 IEEE International Conference on Cognitive Computing (ICCC), 2017, pp. 132–135 DOI: 10.1109/IEEE.ICCC.2017.24
- [81] M. Khan “Social media engagement: What motivates user participation and consumption on YouTube?” In Computers in Human Behavior 66, 2017, pp. 236–247 DOI: 10.1016/j.chb.2016.09.024
- [82] Daantje Derks, Arnold B. Bakker and Marjan Gorgievski “Private smartphone use during worktime: A diary study on the unexplored costs of integrating the work and family domains” In Computers in Human Behavior 114, 2021, pp. 106530 DOI: 10.1016/j.chb.2020.106530
- [83] Éilish Duke and Christian Montag “Smartphone addiction, daily interruptions and self-reported productivity” In Addictive Behaviors Reports 6, 2017, pp. 90–95 DOI: 10.1016/j.abrep.2017.07.002
- [84] Adrian F. Ward, Kristen Duke, Ayelet Gneezy and Maarten W. Bos “Brain Drain: The Mere Presence of One’s Own Smartphone Reduces Available Cognitive Capacity” Publisher: The University of Chicago Press In Journal of the Association for Consumer Research 2.2, 2017, pp. 140–154 DOI: 10.1086/691462
- [85] Tilman Dingler and Martin Pielot “I’ll be there for you: Quantifying Attentiveness towards Mobile Messaging” In Proceedings of the 17th International Conference on Human-Computer Interaction with Mobile Devices and Services, MobileHCI ’15 New York, NY: ACM, 2015, pp. 1–5 DOI: 10.1145/2785830.2785840
- [86] Mary Bazire and Patrick Brézillon “Understanding Context Before Using It” Series Title: Lecture Notes in Computer Science In Modeling and Using Context Berlin, Heidelberg: Springer Berlin Heidelberg, 2005, pp. 29–40 DOI: 10.1007/11508373_3
- [87] David J. Grüning, Frederik Riedel and Philipp Lorenz-Spreen “Directing smartphone use through the self-nudge app one sec” Publisher: Proceedings of the National Academy of Sciences In Proceedings of the National Academy of Sciences 120.8, 2023, pp. e2213114120 DOI: 10.1073/pnas.2213114120
- [88] Mariek M P Vanden Abeele “Digital Wellbeing as a Dynamic Construct” In Communication Theory 31.4, 2021, pp. 932–955 DOI: 10.1093/ct/qtaa024
Supplementary Information
Appendix A List of Social Media Apps
-
•
Discord
-
•
Facebook
-
•
Facebook Lite
-
•
Facebook Local
-
•
Facebook Messenger
-
•
Instagram
-
•
Kik
-
•
LinkedIn
-
•
Pinterest
-
•
Reddit
-
•
Snapchat
-
•
TikTok
-
•
Tumblr
-
•
Twitter
-
•
Youtube
Appendix B Hyperparameter Spaces
B.1 LSTM Models
| Hyperparameter Name | Min | Max | Step Size |
| Embedding Dimensions | 5 | 50 | 5 |
| Number of LSTM Layers | 1 | 3 | 1 |
| LSTM Units | 4 | 64 | 4 |
| Recurrent Dropout | 0.2 | 0.5 | 0.1 |
| LSTM L1 Regularization | Continuous (log) | ||
| LSTM L2 Regularization | Continuous (log) | ||
| Dense Layer Units | 4 | 64 | 4 |
| Dense Layer L1 Regularization | Continuous (log) | ||
| Dense Layer L2 Regularization | Continuous (log) | ||
| Dropout Rate Top Layer | 0.2 | 0.5 | 0.1 |
| Learning Rate | Continuous (log) |
B.2 Transformer Models
| Hyperparameter Name | Min | Max | Step Size |
| Embedding Dimensions | 5 | 50 | 5 |
| Number of Transformer Layers* | 1 | 3 | 1 |
| Transformer Units | 4 | 64 | 4 |
| Recurrent Dropout* | 0.2 | 0.5 | 0.1 |
| Transformer L1 Regularization | Continuous (log) | ||
| Transformer L2 Regularization | Continuous (log) | ||
| Dense Layer Units | 4 | 64 | 4 |
| Dense Layer L1 Regularization | Continuous (log) | ||
| Dense Layer L2 Regularization | Continuous (log) | ||
| Dropout Rate Top Layer | 0.2 | 0.5 | 0.1 |
| Learning Rate | Continuous (log) |
B.3 Fine-Tuned Models
| Hyperparameter Name | Min | Max | Step Size |
|---|---|---|---|
| Dense Layer Units | 4 | 64 | 4 |
| Dense Layer L1 Regularization | Continuous (log) | ||
| Dense Layer L2 Regularization | Continuous (log) | ||
| Dropout Rate Top Layer | 0.2 | 0.5 | 0.1 |
| Learning Rate | Continuous (log) |
Appendix C Additional Model Evaluation Metrics
C.1 Performance of Global LSTM Model Across 20 Rounds of Hyperparameter Search
| rank | acc | pre | rec | f1 | auc |
|---|---|---|---|---|---|
| 1 | 0.779 | 0.713 | 0.651 | 0.668 | 0.782 |
| 2 | 0.781 | 0.728 | 0.631 | 0.648 | 0.780 |
| 3 | 0.780 | 0.716 | 0.652 | 0.669 | 0.778 |
| 4 | 0.769 | 0.700 | 0.615 | 0.628 | 0.764 |
| 5 | 0.771 | 0.705 | 0.618 | 0.632 | 0.763 |
| 6 | 0.765 | 0.728 | 0.571 | 0.566 | 0.761 |
| 7 | 0.770 | 0.707 | 0.607 | 0.618 | 0.761 |
| 8 | 0.768 | 0.705 | 0.605 | 0.615 | 0.760 |
| 9 | 0.769 | 0.706 | 0.605 | 0.616 | 0.759 |
| 10 | 0.767 | 0.695 | 0.617 | 0.629 | 0.758 |
| 11 | 0.768 | 0.695 | 0.625 | 0.639 | 0.759 |
| 12 | 0.769 | 0.705 | 0.604 | 0.615 | 0.758 |
| 13 | 0.769 | 0.701 | 0.613 | 0.626 | 0.757 |
| 14 | 0.768 | 0.703 | 0.604 | 0.614 | 0.755 |
| 15 | 0.768 | 0.702 | 0.608 | 0.620 | 0.754 |
| 16 | 0.769 | 0.704 | 0.608 | 0.620 | 0.753 |
| 17 | 0.767 | 0.702 | 0.598 | 0.607 | 0.749 |
| 18 | 0.741 | 0.371 | 0.500 | 0.426 | 0.507 |
| 19 | 0.741 | 0.371 | 0.500 | 0.426 | 0.500 |
| 20 | 0.741 | 0.371 | 0.500 | 0.426 | 0.568 |
C.2 Performance of Global Transformer Model Across 20 Rounds of Hyperparameter Search
| rank | acc | pre | rec | f1 | auc |
|---|---|---|---|---|---|
| 1 | 0.775 | 0.706 | 0.643 | 0.659 | 0.773 |
| 2 | 0.777 | 0.716 | 0.628 | 0.644 | 0.775 |
| 3 | 0.771 | 0.697 | 0.659 | 0.672 | 0.774 |
| 4 | 0.776 | 0.712 | 0.636 | 0.652 | 0.774 |
| 5 | 0.774 | 0.709 | 0.630 | 0.645 | 0.773 |
| 6 | 0.776 | 0.716 | 0.626 | 0.641 | 0.773 |
| 7 | 0.775 | 0.707 | 0.645 | 0.661 | 0.774 |
| 8 | 0.775 | 0.717 | 0.621 | 0.635 | 0.773 |
| 9 | 0.775 | 0.709 | 0.636 | 0.651 | 0.771 |
| 10 | 0.776 | 0.715 | 0.626 | 0.641 | 0.774 |
| 11 | 0.773 | 0.701 | 0.646 | 0.661 | 0.772 |
| 12 | 0.775 | 0.712 | 0.626 | 0.641 | 0.772 |
| 13 | 0.773 | 0.703 | 0.642 | 0.658 | 0.772 |
| 14 | 0.775 | 0.708 | 0.636 | 0.651 | 0.773 |
| 15 | 0.775 | 0.710 | 0.634 | 0.649 | 0.773 |
| 16 | 0.775 | 0.710 | 0.633 | 0.649 | 0.773 |
| 17 | 0.772 | 0.707 | 0.620 | 0.634 | 0.767 |
| 18 | 0.774 | 0.711 | 0.621 | 0.635 | 0.769 |
| 19 | 0.774 | 0.716 | 0.614 | 0.627 | 0.771 |
| 20 | 0.771 | 0.709 | 0.613 | 0.625 | 0.766 |
C.3 Distributions of Model Performance Scores (LSTM, Global Model)
| auc | acc | pre | rec | f1 | |
|---|---|---|---|---|---|
| mean | 0.699 | 0.785 | 0.627 | 0.580 | 0.578 |
| std | 0.088 | 0.100 | 0.106 | 0.075 | 0.092 |
| min | 0.515 | 0.552 | 0.386 | 0.486 | 0.432 |
| 25% | 0.635 | 0.714 | 0.570 | 0.522 | 0.508 |
| 50% | 0.690 | 0.795 | 0.621 | 0.556 | 0.554 |
| 75% | 0.752 | 0.875 | 0.691 | 0.631 | 0.645 |
| max | 0.908 | 0.978 | 0.886 | 0.798 | 0.806 |
C.4 Distributions of Model Performance Scores (Transformer, Global Model)
| auc | acc | pre | rec | f1 | |
|---|---|---|---|---|---|
| mean | 0.679 | 0.779 | 0.620 | 0.560 | 0.554 |
| std | 0.072 | 0.103 | 0.089 | 0.054 | 0.068 |
| min | 0.507 | 0.566 | 0.408 | 0.494 | 0.447 |
| 25% | 0.630 | 0.701 | 0.579 | 0.515 | 0.493 |
| 50% | 0.677 | 0.768 | 0.629 | 0.546 | 0.543 |
| 75% | 0.724 | 0.855 | 0.669 | 0.592 | 0.597 |
| max | 0.853 | 0.981 | 0.823 | 0.703 | 0.728 |
C.5 Distributions of Model Performance Scores (LSTM, Person-Specific Models)
| auc | acc | pre | rec | f1 | |
|---|---|---|---|---|---|
| mean | 0.609 | 0.772 | 0.451 | 0.520 | 0.469 |
| std | 0.092 | 0.114 | 0.114 | 0.051 | 0.080 |
| min | 0.414 | 0.422 | 0.287 | 0.483 | 0.320 |
| 25% | 0.544 | 0.689 | 0.374 | 0.500 | 0.425 |
| 50% | 0.611 | 0.776 | 0.415 | 0.500 | 0.451 |
| 75% | 0.681 | 0.857 | 0.468 | 0.500 | 0.479 |
| max | 0.817 | 0.981 | 0.829 | 0.724 | 0.740 |
C.6 Distributions of Model Performance Scores (Transformer, Person-Specific Models)
| auc | acc | pre | rec | f1 | |
|---|---|---|---|---|---|
| std | 0.087 | 0.105 | 0.136 | 0.059 | 0.083 |
| min | 0.447 | 0.523 | 0.295 | 0.455 | 0.371 |
| 25% | 0.560 | 0.691 | 0.432 | 0.500 | 0.452 |
| 50% | 0.635 | 0.769 | 0.501 | 0.500 | 0.479 |
| 75% | 0.685 | 0.841 | 0.643 | 0.569 | 0.570 |
| max | 0.861 | 0.981 | 0.915 | 0.752 | 0.757 |
C.7 Distributions of Model Performance Scores (LSTM, Fine-Tuned Models)
| auc | acc | pre | rec | f1 | |
|---|---|---|---|---|---|
| mean | 0.702 | 0.791 | 0.626 | 0.577 | 0.569 |
| std | 0.089 | 0.098 | 0.136 | 0.080 | 0.102 |
| min | 0.522 | 0.605 | 0.372 | 0.492 | 0.426 |
| 25% | 0.640 | 0.720 | 0.541 | 0.503 | 0.480 |
| 50% | 0.689 | 0.796 | 0.625 | 0.556 | 0.553 |
| 75% | 0.754 | 0.877 | 0.700 | 0.627 | 0.627 |
| max | 0.908 | 0.978 | 0.972 | 0.800 | 0.807 |
C.8 Distributions of Model Performance Scores (Transformer, Fine-Tuned Models)
| auc | acc | pre | rec | f1 | |
|---|---|---|---|---|---|
| mean | 0.683 | 0.783 | 0.625 | 0.568 | 0.560 |
| std | 0.077 | 0.102 | 0.100 | 0.068 | 0.085 |
| min | 0.497 | 0.552 | 0.388 | 0.489 | 0.437 |
| 25% | 0.635 | 0.707 | 0.572 | 0.513 | 0.486 |
| 50% | 0.681 | 0.788 | 0.630 | 0.548 | 0.552 |
| 75% | 0.731 | 0.859 | 0.688 | 0.609 | 0.616 |
| max | 0.858 | 0.981 | 0.823 | 0.753 | 0.766 |
The full set of results is available for download in CSV format on this project’s OSF page (https://osf.io/rkswe/).
Appendix D Models Trained on Data Including Launcher and SystemUI Events
D.1 Visualization of Model Performance Scores
D.2 Performance of Global LSTM Model Across 20 Rounds of Hyperparameter Search
| rank | acc | pre | rec | f1 | auc |
|---|---|---|---|---|---|
| 1 | 0.847 | 0.737 | 0.622 | 0.649 | 0.826 |
| 2 | 0.847 | 0.737 | 0.626 | 0.653 | 0.827 |
| 3 | 0.848 | 0.747 | 0.608 | 0.634 | 0.827 |
| 4 | 0.847 | 0.737 | 0.620 | 0.646 | 0.826 |
| 5 | 0.847 | 0.758 | 0.590 | 0.611 | 0.826 |
| 6 | 0.847 | 0.735 | 0.624 | 0.651 | 0.827 |
| 7 | 0.845 | 0.734 | 0.607 | 0.632 | 0.818 |
| 8 | 0.842 | 0.716 | 0.652 | 0.674 | 0.823 |
| 9 | 0.845 | 0.729 | 0.616 | 0.641 | 0.822 |
| 10 | 0.846 | 0.734 | 0.623 | 0.649 | 0.823 |
| 11 | 0.846 | 0.737 | 0.612 | 0.637 | 0.821 |
| 12 | 0.846 | 0.733 | 0.614 | 0.639 | 0.819 |
| 13 | 0.838 | 0.733 | 0.551 | 0.553 | 0.793 |
| 14 | 0.839 | 0.728 | 0.562 | 0.570 | 0.792 |
| 15 | 0.830 | 0.415 | 0.500 | 0.454 | 0.704 |
| 16 | 0.830 | 0.415 | 0.500 | 0.454 | 0.701 |
| 17 | 0.830 | 0.415 | 0.500 | 0.454 | 0.692 |
| 18 | 0.830 | 0.415 | 0.500 | 0.454 | 0.495 |
| 19 | 0.830 | 0.415 | 0.500 | 0.454 | 0.500 |
| 20 | 0.830 | 0.415 | 0.500 | 0.454 | 0.501 |
D.3 Performance of Global Transformer Model Across 20 Rounds of Hyperparameter Search
| rank | acc | pre | rec | f1 | auc |
|---|---|---|---|---|---|
| 1 | 0.846 | 0.730 | 0.636 | 0.662 | 0.825 |
| 2 | 0.848 | 0.752 | 0.602 | 0.627 | 0.824 |
| 3 | 0.847 | 0.741 | 0.613 | 0.639 | 0.824 |
| 4 | 0.847 | 0.740 | 0.613 | 0.639 | 0.823 |
| 5 | 0.847 | 0.736 | 0.621 | 0.647 | 0.823 |
| 6 | 0.849 | 0.757 | 0.606 | 0.632 | 0.824 |
| 7 | 0.848 | 0.743 | 0.618 | 0.644 | 0.822 |
| 8 | 0.848 | 0.740 | 0.618 | 0.644 | 0.822 |
| 9 | 0.849 | 0.746 | 0.622 | 0.650 | 0.823 |
| 10 | 0.847 | 0.744 | 0.610 | 0.636 | 0.821 |
| 11 | 0.847 | 0.745 | 0.608 | 0.634 | 0.821 |
| 12 | 0.846 | 0.748 | 0.593 | 0.615 | 0.820 |
| 13 | 0.847 | 0.740 | 0.610 | 0.636 | 0.817 |
| 14 | 0.844 | 0.728 | 0.616 | 0.641 | 0.818 |
| 15 | 0.846 | 0.735 | 0.612 | 0.638 | 0.816 |
| 16 | 0.844 | 0.725 | 0.616 | 0.641 | 0.813 |
| 17 | 0.839 | 0.733 | 0.557 | 0.562 | 0.802 |
| 18 | 0.841 | 0.726 | 0.585 | 0.603 | 0.805 |
| 19 | 0.840 | 0.719 | 0.589 | 0.609 | 0.801 |
| 20 | 0.837 | 0.710 | 0.564 | 0.575 | 0.787 |
Appendix E Fine-Tuned Models (Top Layers Only)
E.1 Distributions of Model Performance Scores (LSTM)
| auc | acc | pre | rec | f1 | |
|---|---|---|---|---|---|
| mean | 0.678 | 0.771 | 0.532 | 0.554 | 0.521 |
| std | 0.090 | 0.118 | 0.147 | 0.081 | 0.109 |
| min | 0.394 | 0.251 | 0.285 | 0.483 | 0.251 |
| 25% | 0.626 | 0.689 | 0.410 | 0.500 | 0.447 |
| 50% | 0.678 | 0.782 | 0.496 | 0.500 | 0.481 |
| 75% | 0.723 | 0.856 | 0.638 | 0.601 | 0.599 |
| max | 0.902 | 0.978 | 0.906 | 0.801 | 0.805 |
E.2 Distributions of Model Performance Scores (Transformer)
| auc | acc | pre | rec | f1 | |
|---|---|---|---|---|---|
| mean | 0.654 | 0.766 | 0.585 | 0.554 | 0.538 |
| std | 0.083 | 0.111 | 0.116 | 0.065 | 0.085 |
| min | 0.384 | 0.517 | 0.369 | 0.406 | 0.405 |
| 25% | 0.599 | 0.681 | 0.496 | 0.500 | 0.475 |
| 50% | 0.655 | 0.766 | 0.589 | 0.532 | 0.524 |
| 75% | 0.703 | 0.846 | 0.650 | 0.592 | 0.590 |
| max | 0.819 | 0.981 | 0.915 | 0.767 | 0.776 |
Appendix F Models Trained with Weighted Loss to Adjust for Class-Imbalances
F.1 Performance of Global LSTM Model Across 20 Rounds of Hyperparameter Search
| rank | acc | pre | rec | f1 | auc |
|---|---|---|---|---|---|
| 1 | 0.728 | 0.481 | 0.658 | 0.556 | 0.781 |
| 2 | 0.719 | 0.471 | 0.697 | 0.562 | 0.785 |
| 3 | 0.715 | 0.466 | 0.698 | 0.559 | 0.783 |
| 4 | 0.714 | 0.465 | 0.699 | 0.559 | 0.783 |
| 5 | 0.720 | 0.471 | 0.690 | 0.560 | 0.784 |
| 6 | 0.703 | 0.451 | 0.682 | 0.543 | 0.767 |
| 7 | 0.681 | 0.429 | 0.711 | 0.535 | 0.761 |
| 8 | 0.677 | 0.428 | 0.733 | 0.540 | 0.766 |
| 9 | 0.685 | 0.434 | 0.719 | 0.541 | 0.765 |
| 10 | 0.645 | 0.404 | 0.786 | 0.534 | 0.763 |
| 11 | 0.682 | 0.430 | 0.711 | 0.536 | 0.760 |
| 12 | 0.683 | 0.432 | 0.716 | 0.539 | 0.762 |
| 13 | 0.697 | 0.444 | 0.680 | 0.537 | 0.760 |
| 14 | 0.711 | 0.457 | 0.625 | 0.528 | 0.757 |
| 15 | 0.679 | 0.428 | 0.718 | 0.536 | 0.761 |
| 16 | 0.695 | 0.441 | 0.668 | 0.531 | 0.755 |
| 17 | 0.680 | 0.428 | 0.711 | 0.534 | 0.758 |
| 18 | 0.687 | 0.434 | 0.691 | 0.533 | 0.757 |
| 19 | 0.674 | 0.413 | 0.616 | 0.494 | 0.714 |
| 20 | 0.741 | 0.000 | 0.000 | 0.000 | 0.500 |
F.2 Performance of Global Transformer Model Across 20 Rounds of Hyperparameter Search
| rank | acc | pre | rec | f1 | auc |
|---|---|---|---|---|---|
| 1 | 0.702 | 0.451 | 0.707 | 0.550 | 0.775 |
| 2 | 0.726 | 0.477 | 0.644 | 0.548 | 0.774 |
| 3 | 0.700 | 0.449 | 0.702 | 0.548 | 0.773 |
| 4 | 0.710 | 0.459 | 0.685 | 0.550 | 0.772 |
| 5 | 0.675 | 0.427 | 0.756 | 0.546 | 0.773 |
| 6 | 0.684 | 0.435 | 0.741 | 0.548 | 0.774 |
| 7 | 0.697 | 0.445 | 0.703 | 0.545 | 0.771 |
| 8 | 0.687 | 0.437 | 0.731 | 0.547 | 0.774 |
| 9 | 0.691 | 0.441 | 0.727 | 0.549 | 0.773 |
| 10 | 0.708 | 0.457 | 0.681 | 0.547 | 0.773 |
| 11 | 0.674 | 0.426 | 0.754 | 0.545 | 0.770 |
| 12 | 0.696 | 0.445 | 0.701 | 0.544 | 0.769 |
| 13 | 0.667 | 0.420 | 0.756 | 0.540 | 0.769 |
| 14 | 0.670 | 0.423 | 0.751 | 0.541 | 0.768 |
| 15 | 0.688 | 0.437 | 0.716 | 0.543 | 0.765 |
| 16 | 0.692 | 0.439 | 0.691 | 0.537 | 0.762 |
| 17 | 0.680 | 0.425 | 0.673 | 0.521 | 0.745 |
| 18 | 0.698 | 0.441 | 0.632 | 0.520 | 0.745 |
| 19 | 0.683 | 0.431 | 0.704 | 0.535 | 0.738 |
| 20 | 0.741 | 0.000 | 0.000 | 0.000 | 0.545 |
F.3 Distributions of Model Performance Scores (LSTM, Global Model)
| auc | acc | pre | rec | f1 | |
|---|---|---|---|---|---|
| mean | 0.694 | 0.732 | 0.621 | 0.623 | 0.605 |
| std | 0.088 | 0.113 | 0.060 | 0.075 | 0.066 |
| min | 0.502 | 0.522 | 0.514 | 0.505 | 0.450 |
| 25% | 0.634 | 0.648 | 0.578 | 0.573 | 0.565 |
| 50% | 0.678 | 0.722 | 0.610 | 0.612 | 0.598 |
| 75% | 0.739 | 0.815 | 0.668 | 0.656 | 0.645 |
| max | 0.909 | 0.969 | 0.776 | 0.828 | 0.774 |
F.4 Distributions of Model Performance Scores (Transformer, Global Model)
| auc | acc | pre | rec | f1 | |
|---|---|---|---|---|---|
| mean | 0.681 | 0.705 | 0.611 | 0.612 | 0.583 |
| std | 0.076 | 0.124 | 0.058 | 0.064 | 0.064 |
| min | 0.519 | 0.479 | 0.490 | 0.492 | 0.457 |
| 25% | 0.626 | 0.605 | 0.567 | 0.561 | 0.534 |
| 50% | 0.679 | 0.682 | 0.605 | 0.616 | 0.585 |
| 75% | 0.730 | 0.803 | 0.649 | 0.649 | 0.618 |
| max | 0.848 | 0.964 | 0.810 | 0.773 | 0.724 |
F.5 Distributions of Model Performance Scores (LSTM, Person-Specific Models)
| auc | acc | pre | rec | f1 | |
|---|---|---|---|---|---|
| mean | 0.630 | 0.595 | 0.568 | 0.586 | 0.507 |
| std | 0.087 | 0.166 | 0.082 | 0.066 | 0.120 |
| min | 0.375 | 0.157 | 0.113 | 0.447 | 0.152 |
| 25% | 0.580 | 0.504 | 0.535 | 0.541 | 0.459 |
| 50% | 0.633 | 0.609 | 0.566 | 0.579 | 0.528 |
| 75% | 0.688 | 0.688 | 0.612 | 0.632 | 0.582 |
| max | 0.834 | 0.945 | 0.787 | 0.774 | 0.765 |
F.6 Distributions of Model Performance Scores (Transformer, Person-Specific Models)
| auc | acc | pre | rec | f1 | |
|---|---|---|---|---|---|
| mean | 0.554 | 0.580 | 0.419 | 0.518 | 0.398 |
| std | 0.075 | 0.251 | 0.173 | 0.044 | 0.145 |
| min | 0.411 | 0.083 | 0.041 | 0.442 | 0.076 |
| 25% | 0.500 | 0.357 | 0.330 | 0.500 | 0.297 |
| 50% | 0.546 | 0.646 | 0.459 | 0.500 | 0.447 |
| 75% | 0.592 | 0.792 | 0.536 | 0.514 | 0.487 |
| max | 0.770 | 0.953 | 0.866 | 0.731 | 0.681 |
F.7 Distributions of Model Performance Scores (LSTM, Fine-Tuned Models)
| auc | acc | pre | rec | f1 | |
|---|---|---|---|---|---|
| mean | 0.696 | 0.739 | 0.622 | 0.629 | 0.616 |
| std | 0.088 | 0.106 | 0.059 | 0.075 | 0.063 |
| min | 0.501 | 0.544 | 0.517 | 0.516 | 0.503 |
| 25% | 0.636 | 0.658 | 0.581 | 0.574 | 0.571 |
| 50% | 0.686 | 0.728 | 0.612 | 0.616 | 0.606 |
| 75% | 0.743 | 0.813 | 0.666 | 0.661 | 0.658 |
| max | 0.909 | 0.970 | 0.776 | 0.826 | 0.774 |
F.8 Distributions of Model Performance Scores (Transformer, Fine-Tuned Models)
| auc | acc | pre | rec | f1 | |
|---|---|---|---|---|---|
| mean | 0.682 | 0.720 | 0.608 | 0.623 | 0.605 |
| std | 0.076 | 0.104 | 0.056 | 0.064 | 0.057 |
| min | 0.520 | 0.529 | 0.499 | 0.499 | 0.495 |
| 25% | 0.635 | 0.653 | 0.574 | 0.576 | 0.566 |
| 50% | 0.679 | 0.693 | 0.601 | 0.625 | 0.604 |
| 75% | 0.731 | 0.785 | 0.643 | 0.656 | 0.641 |
| max | 0.849 | 0.966 | 0.748 | 0.779 | 0.730 |
The full set of results is available for download in CSV format on this project’s OSF page (https://osf.io/rkswe/).