From “AI” to Probabilistic Automation: How Does Anthropomorphization of Technical Systems Descriptions Influence Trust?
Abstract.
This paper investigates the influence of anthropomorphized descriptions of so-called “AI” (artificial intelligence) systems on people’s self-assessment of trust in the system. Building on prior work, we define four categories of anthropomorphization (1. Properties of a cognizer, 2. Agency, 3. Biological metaphors, and 4. Properties of a communicator). We use a survey-based approach (=954) to investigate whether participants are likely to trust one of two (fictitious) “AI” systems by randomly assigning people to see either an anthropomorphized or a de-anthropomorphized description of the systems. We find that participants are no more likely to trust anthropomorphized over de-anthropmorphized product descriptions overall. The type of product or system in combination with different anthropomorphic categories appears to exert greater influence on trust than anthropomorphizing language alone, and age is the only demographic factor that significantly correlates with people’s preference for anthropomorphized or de-anthropomorphized descriptions. When elaborating on their choices, participants highlight factors such as lesser of two evils, lower or higher stakes contexts, and human favoritism as driving motivations when choosing between product A and B, irrespective of whether they saw an anthropomorphized or a de-anthropomorphized description of the product. Our results suggest that “anthropomorphism” in “AI” descriptions is an aggregate concept that may influence different groups differently, and provide nuance to the discussion of whether anthropomorphization leads to higher trust and over-reliance by the general public in systems sold as “AI”.
1. Introduction
Anthropomorphism, or the attribution of human characteristics or behavior to inanimate objects, is a common sense-making practice for people. With the advent of more advanced technical systems, anthropomorphism is often used to describe technical products (i.e. “A.I. Shows Signs of Human Reasoning” (Metz, 2023)), and it appears a rising trend in news coverage (Bunz and Braghieri, 2022). This phenomenon — anthropomorphizing111In this paper, we use the term anthropomorphization when describing the intentional act of ‘putting anthropomorphic features into a product’ or ‘using anthropomorphic words to describe a product’. The creator of the product or the writer of the text is responsible for the anthropomorphization, whereas anthropomorphism denotes the process internal for the perceiver or user when human qualities are attributed to the system (Seeger et al., 2021). technical systems — has been criticized for setting the wrong expectations and causing over-reliance in technology (Shanahan, 2022; Shardlow and Przybyła, 2022; Hunger, 2023).
Emily Tucker, the Executive Director at the Center on Privacy & Technology at Georgetown Law, wrote in her 2022 Medium post Artifice and Intelligence a declaration of intention to stop using the words “Artificial intelligence”, “AI”, and “machine learning” for the purpose of exposing and mitigating harms of digital technologies to individuals and communities, based on the underlying risk that the public will assume that “AI” technologies are more capable than they are (on Privacy and Technology, 2022). Francis Hunger (Hunger, 2023) also argues that “the use of anthropomorphising language is fueling AI hype. [It]] is problematic since it covers up the negative consequences of AI use.” The argument here is that by using personified language when referring to AI systems, we also implicitly attribute human-like properties to them, which both makes them seem more powerful than they are while obscuring their potential negative effects.
Prior studies investigated how conceptual metaphors influenced people’s perception of algorithmic decision-making systems more broadly (Langer et al., 2022), as well as how anthropomorphic cues influence people’s trust in robots (Christoforakos et al., 2021), voice-assistants (Fetterolf and Hertog, 2022), and websites (Sah and Peng, 2015). To our knowledge, no study has yet investigated anthropomorphic descriptions of products and systems powered by “AI”, which we will refer to as probabilistic automation systems,222The denomination “artificial intelligence” is poorly defined, and does not refer to a coherent set of technologies. In general, we find that discussions of technologies called “AI” become more lucid and thus productive when we speak about the automation of specific tasks. In the case of this research, the fictitious systems presented to our participants vary in their task domain, but they are all imagined to be built on statistical analysis of large datasets. Therefore, we will refer to these systems collectively as “probabilistic automation”. influence people’s trust and desire to use such systems. This motivated us to explore the overall research question: “What are the effects on trust of anthropomorphization of probabilistic automation systems?”
We are specifically concerned with what we will call “anthropomorphization by description”, rather than anthropomorphization by design — meaning we investigate the language used to describe systems, rather than the language (and other attributes) built into the systems themselves. Whereas both types could have negative consequences, anthropomorphization by description is especially relevant in public discourse, where journalists, politicians, and copy-editors carry a significant responsibility for the use and spread of metaphors and analogies that will shape the public perception.
We use a survey-based approach (=954) to investigate whether participants believe themselves to be more likely to trust one of two (fictitious) probabilistic automation systems. Our investigation makes three contributions: First, we provide empirical evidence that people are not more likely to choose anthropomorphized descriptions of products over de-anthropomorphized descriptions. Second, we find that some product types in combination with different categories of anthropomorphizing language appear to have more influence on trust than anthropomorphizing language alone. Finally, we find that age is the only variable that seems to have a dependent association with preferences for anthropomorphized/de-anthropomorphized product descriptions.
2. Background and related work
2.1. Metaphors, anthropomorphism, and technology
Language shapes our interactions with technology. Even short textual descriptions can influence how humans meet and evaluate digital systems (Hartmann et al., 2008; Strait et al., 2018; Khadpe et al., 2020; Langer et al., 2022; Kim and Song, 2023, 2020). In the context of probabilistic automation systems, the conceptual metaphor (McGlone, 1996; Crawford, 2009) or “pitch” of the system’s functionality might play an especially compelling role, given the complexity of such systems (Langer et al., 2022). Accurately priming the user and adjusting their expectations to the system is difficult, and simply providing performance metrics is not meaningful to the average user, given their lack of familiarity with the inner workings of the technologies that they interact with (Kocielnik et al., 2019; Khadpe et al., 2020). In the absence of technical understanding, humans develop their own simplified mental models of how a system works — models that are not always consistent with the actual functionalities of the system, and of which inaccurate versions can lead to consequences from mundanely inconvenient to more severe (Norman, 2013).
Research on human interactions with technological devices shows a clear tendency of anthropomorphism. For example, humans are capable of engaging socially with machines (Isbister and Nass, 2000; Nass and Moon, 2000; Reeves and Nass, 1996). This is especially true of robots and embodied assistants (Fong et al., 2003; Kanda et al., 2004; Tanaka et al., 2007). The more life-like a probabilistic automation application is in terms of embodiment (the physical form of the system), physical presence, social presence, and appearance, the more persuasive it can become (Bainbridge et al., 2008; Roubroeks et al., 2011). For example, Vollmer et al. showed that robots could even exert peer pressure over children (Vollmer et al., 2018). In their experiment, 7- to 9-year-old children had a tendency to echo the incorrect, but unanimous, responses of a group of robots to a simple visual task (Vollmer et al., 2018). Smart voice assistants also lead children to overestimate the intelligence of these devices, trusting them, and deferring to them when making decisions (Druga et al., 2017).
2.2. Risks associated with anthropomorphization
With the blight of publicly-available Large Language Models (LLMs) and generative probabilistic automation technology, numerous academic papers have appeared which warn about the risks of overusing anthropomorphic language to describe such technology (Salles et al., 2020; Shardlow and Przybyła, 2022; Shanahan, 2022; Abercrombie et al., 2023; Hunger, 2023; Deroy, 2023). Previous research has raised several categories of (interrelated) risks of anthropomorphization, detailed briefly below.
2.2.1. Misplaced trust and over-reliance
One direct consequence of anthropomorphization is misplaced trust, which in turn can lead to over-reliance on probabilistic automation systems (Salles et al., 2020; Hunger, 2023; Desai and Twidale, 2023; Abercrombie et al., 2023; Deroy, 2023). While anthropomorphism may enhance user experience and trust (in fact, much of the literature on anthropomorphism and technology concerns using anthropomorphization to increase trust, e.g., (Chen and Park, 2021; Kim and Song, 2021; Chi and Hoang Vu, 2023)),333It should go without saying, but we note for good measure nonetheless that to seek to increase trust rather than trust-worthiness is to court risk. it also risks creating a false sense of the system’s capabilities. Such misplaced trust can be particularly problematic in high-stakes scenarios, such as medical diagnosis or financial decision-making, where over-reliance on probabilistic automation can lead to significant consequences.
2.2.2. Spillover effect of cognitive overestimation
When probabilistic automation is perceived as having advanced cognitive properties, users may overestimate its capabilities in areas not directly demonstrated (Desai and Twidale, 2023; Abercrombie et al., 2023). For instance, if an probabilistic automation system is adept at data processing and pattern recognition, users might erroneously assume it is equally proficient in complex decision-making or ethical judgments. This cognitive overestimation can result in the inappropriate application of probabilistic automation advice, potentially leading to harmful outcomes.
2.2.3. Transparency and accountability
When probabilistic automation systems are perceived as autonomous agents, it raises complex questions about accountability (Hunger, 2023; Bigman et al., 2019; Stuart and Kneer, 2021). In cases of error or malfunction, determining responsibility can be challenging, especially when users have been led to view these systems as ‘intelligent’ entities. Some research has shown that people are aware of the dangers of overattributing accountability to technology ‘when harm comes to pass’ (Stuart and Kneer, 2021), but the dynamics are not well understood.
Though there are many good arguments for not anthropomorphizing probabilistic automation systems and not many good arguments for doing so, there are few scientific explorations of the details of anthropomorphic language and its specific impact. Our goal with this research was to take a first step towards understanding the phenomenon of anthropomorphization better.
3. Methodology
We designed our experiment to address the following research questions:
-
(1)
Are people more likely to trust products that are described in anthropomorphizing language than products which are not described in anthropomorphizing language?
-
(a)
Are people more likely to trust anthropomorphized products if imagining themselves as a user (personal trust) than to trust them in use for the general population (general trust)?
-
(a)
-
(2)
Are people more likely to trust products when the products are described in different kinds of anthropomorphizing language?
-
(3)
Are different groups of people more likely to trust products that are described in anthropomorphizing language? (We investigated the groups gender, age, socio-economic status, level of education, and level of computer knowledge444Abercrombie et al. suggested that negative impacts of anthropomorphization could be exacerbated in “vulnerable populations” (Abercrombie et al., 2023).).
3.1. Defining anthropomorphic language
To investigate the influence of anthropomorphic language, we need to create a working definition of what that language is. In general, anthropomorphization is the assigning of human characteristics to non-human entities. Examining previous literature, we identified four general classes of anthropomorphizing language:
-
(1)
Using predicates that portray the machine as a cognizer (Desai and Twidale, 2023; Deroy, 2023; Abercrombie et al., 2023; on Privacy and Technology, 2022; Salles et al., 2020; Isaeva et al., 2022). The human characteristic that seems most salient in the context of probabilistic automation is cognition: the ability to perceive, think, reflect, and experience things — often expressed with the word ‘intelligent’ or ‘intelligence’. Algorithms being anthropomorphized with Properties of a cognizer might know, believe or decide.
-
(2)
Describing the machine as an agent (Hunger, 2023; Isaeva et al., 2022) of an action. Hunger (Hunger, 2023) posed anthropomorphization of a category she called ‘Active verbs’, but we specify this slightly to include some degree of intention or independence, since machines can actively process many things without being attributed human capabilities. We therefore called this category Agency. Those being anthorpomorphized in this category collect, monitor, or choose.
- (3)
- (4)
These boundaries overlap somewhat: A computer being described as deciding is both being cast in an agentive role and as a cognizer. Similarly, if a machine is said to see something, that is both a biological metaphor and an attribution of cognition, and so on. We also don’t expect these categories to fully cover all the ways that we use language to anthropomorphize algorithms. To get a sense of whether they cover a significant amount, however, we selected a text to annotate for anthropomorphizing language. Three of the authors independently annotated these texts, and used them as source of discussion before writing our own product descriptions (which all authors contributed to).
As one means of defining whether language is anthropomorphizing or not, we accessed the FrameNet database (Baker et al., 1998). This resource describes words in terms of the frames they describe and the frame elements that participate in the frames. For example, the word imagine expresses the Awareness frame, with frame elements Cognizer, Content, Topic and Element. We used the notion of the Cognizer frame element to look up words in the FrameNet resource which portray one of their arguments as a Cognizer. If the computational system is filling this role, then it is being anthropomorphized by having cognition attributed to it. Similarly, to assess words used of the Communication-category, we looked up words related to the frame Communicator.
3.2. Participants and recruitment
Participants were recruited via the data collection platform Prolific, and compensated between £9-£15/h555As suggested by Prolific’s standards for “Good hourly rate”. (depending on their average time to completion) for their participation. This database allowed us to create pre-screening criteria such as country of residence, self-assessed socio-economic status, and ethnicity, to reach as diverse a group as possible (see Section E in the appendix for demographics). All participants signed a consent form that their (anonymous) answers could be used for research purposes.
3.3. Experiment design
We imagined eight pairs of fictional products based on some form of (relatively vague) probabilistic automation technology, giving 16 products total. For each product, we wrote a short “pitch” (less than 80 words), briefly describing the features of the product (the descriptions can be found in the appendix, Tables 4- 7). The goal of these pitches was to give a sense of the functionality of the product without being more technical than one would expect in a news article or popular literature description of a product. The products were paired in genres, so they would be somewhat comparable (for instance, “recommender systems” or “online health diagnostics”), to enable apples-to-apples comparisons. The participant would always be asked to choose between product A and product B in one of the genres, and never between, e.g., an autonomous vehicle and a tutoring app. An overview of the products is shown in Table 1. For each product, we wrote an anthropomorphized short pitch, and a de-anthropomorphized short pitch. The participants were randomly shown a combination of either:
[Product A: Anthropomorphized description] + [Product B: De-anthropomorphized description] or [Product A: De-anthropomorphized description] + [Product B: Anthropomorphized description]
and asked to choose between the two with one of the following questions:
-
•
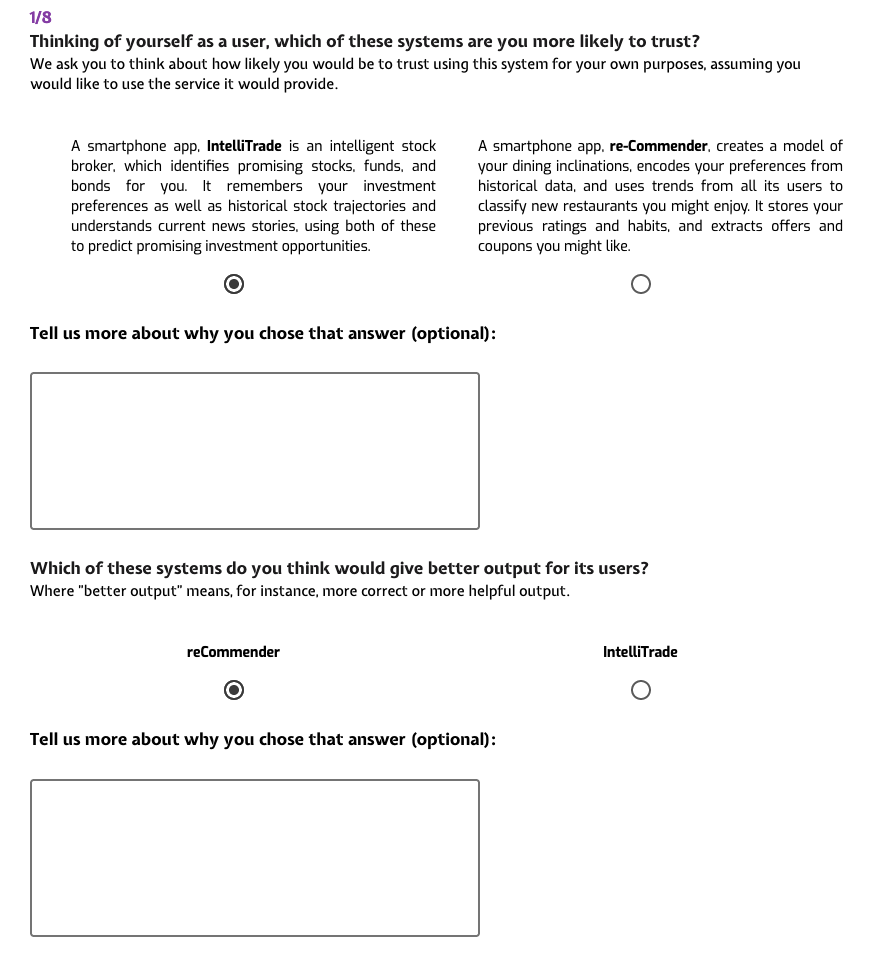
Thinking of yourself as a user, which of these systems are you more likely to trust? We ask you to think about how likely you would be to trust using this system for your own purposes, assuming you would like to use the service it would provide (personal trust).
-
•
Which of these systems do you think would give better output for its users? Where “better output” means, for instance, more correct or more helpful output (general trust/reliance).
“Trust” is inherently difficult to evaluate independent of context, but giving participants two options to choose between (‘joint evaluation’) has been shown to make it easier for people to evaluate “difficult-to-evaluate attributes” (Hsee et al., 1999; Hsee and Leclerc, 1998). The questions were designed to reflect two essential questions for measuring trust identified by Hoffman et al. (Hoffman et al., 2018) with two modifications: (1) We could not ask the user to evaluate the system’s output (question 2 in (Hoffman et al., 2018) addresses reliance of output), given that the system does not exist in reality. We therefore created a distinction between personal trust and general trust. (2) To make it more likely that participants would understand trust in a somewhat similar way, an introductory text as well as a short definition of trust was provided with each product pair (see appendix, Section A).
For each presentation of a product pair to a participant, we randomized which product of the pair would be presented in its anthropomorphize guise, and which de-anthropomorphized, but there was always one of each, and all participants were presented with all eight product pairs. Under each choice of product pair, we included an optional open answer text field where the participant could elaborate on their answer if they wanted to. A screenshot of the survey as it was presented to a participant is included in Section A, Figure 1 in the appendix.
| Product genre | Product A | Product B | Category, Study 1 | Category, Study 2 |
| Recommender systems | re-Commender | IntelliTrade | Cognizer | Agency |
| Personal assistant | MonAI Maker | Cameron | Cognizer | Agency |
| Autonomous vehicles | HaulIT | Commuter | Agency | Biological metaphors |
| Drones | AquaSentinel | AI Scan Guards | Agency | Biological metaphors |
| Legal recommendations | Judy | JurisDecide | Biological metaphors | Communicator |
| Online health diagnoses | MindHealth | DermAI Scan | Biological metaphors | Communicator |
| AI Tutor | Lingua | MentorMe | Communicator | Cognizer |
| Assisted shopping | WardrobEase | Shoppr | Communicator | Cognizer |
3.4. Survey design
The survey was created in the software SurveyXact. For the initial development of the pitches (as used in the Pilot and Study 1), we arbitrarily assigned the product pairs to one of the anthropomorphic language categories defined in section 3.1. In Study 2, we arbitrarily “swapped” anthropomorphization categories between the product pairs, to avoid overinterpretation of results based on one study alone — see Table 1.
3.4.1. Pilot study
We ran a pilot study with 37 participants recruited through personal networks. Only minor edits to the product descriptions were made to clarify misunderstandings as a result of the pilot study.
3.4.2. Study 1
For Study 1, 333 participants signed the consent form, and 313 participants completed the survey fully, while 20 participants partially completed the survey. We have included all partially completed survey responses in the analyses, as they provide valid answers to the questions. Excluding these participants has no statistically significant impact on the results. Participants were asked about both personal trust and general trust, meaning that for each product pair, they were asked to evaluate which product they would be more likely to trust for themselves as a user, and subsequently (but visible on the same page), which product they believed would be more likely to produce better output for most of its users.
3.4.3. Study 2
In Study 2, participants were only asked about either personal trust or general trust. The purpose of this was to avoid a potential confounding factor of seeing the combination of two questions and deliberately being asked to reflect on both oneself as a user and users more general. Group A, who were asked only about personal trust, consisted of 307 participants, of which 304 fully completed the survey. Group B, who were asked only about general trust/reliance, consisted of 314 participants, of which 300 fully completed the survey.
3.5. Data analysis
For the research questions about whether the proportion of people that chose a product in an anthropomorphic description (RQ1, RQ1a, and RQ2) is higher than a hypothetical 50/50 split, we used the Chi-squared goodness-of-fit test with the following hypotheses:
-
•
H0: People are equally likely to choose a product when it is described in anthropomorphized language as when it is described in de-anthropomorphized language.
-
•
H1: People are not equally likely to choose a product when it is described in anthropomorphized language as when it is described in de-anthropomorphized language.
In practice, this means we expect the proportion that chooses re-Commender to be the same no matter if they see the anthropomorphized or de-anthropomorphized re-Commender (but not assuming that the preference for re-Commender would necessarily be 50%). Because all participants have been asked to choose one of the products, we calculate this with the Chi goodness of fit-test.
For the research questions that investigate if there is an association between different groups of people and preference for anthropomorphized/de-anthropomorphized descriptions (RQ3), we used the Chi-squared test of independence, with variables of, e.g., gender, socio-economic status, or education level, on one axis and anthropomorphized/de-anthropomorphized as the variables on the other. For all statistical tests we adopt a confidence level of 95%. For the open text-answers, we performed a thematic analysis (Clarke et al., 2015). This process is further described in the appendix, section C.
4. Results
4.1. RQ1: Are people more likely to trust products that are described in anthropomorphizing language than products which are not described in anthropomorphizing language?
The results of Study 1 and Study 2 per product pair are shown in Table 2.
| Study 1 | ||||||
| Personal trust / General trust | ||||||
| Category | Ant. | De-ant. | % ant. | |||
| Cognizer
(=.001/ .012) |
reC | 114/110 | 98/95 | 53.8/53.7 | ||
| IntelliT | 71/74 | 40/44 | 64/62.7 | 6.84/6.27 | .009/.012 | |
| MonAI | 97/102 | 80/94 | 54.8/52 | |||
| Cameron | 81/67 | 61/56 | 57/54.5 | 4.29/1.13 | .04/.29 | |
| Agency | HaulIT | 94/92 | 81/76 | 53.7/54.8 | ||
| Commuter | 68/73 | 71/73 | 48.9/50 | 0.32/0.82 | .57/.37 | |
| AquaS | 64/74 | 77/72 | 45.4/50.7 | |||
| AI Scan | 71/76 | 102/92 | 41/45.2 | 6.17/0.62 | .013/.43 | |
| Biological metaphors | Judy | 60/62 | 89/89 | 40.3/41.1 | ||
| JurisD | 88/88 | 78/76 | 53/53.7 | 1.15/0.71 | .28/.40 | |
| MindH | 68/69 | 78/81 | 46.6/46 | |||
| DermAI | 85/82 | 87/86 | 49.4/48.8 | 0.45/0.81 | .50/.37 | |
| Commu-
nicator |
Lingua | 86/74 | 83/86 | 50.9/46.3 | ||
| MentorMe | 82/79 | 70/82 | 53.9/49.1 | 0.70/0.70 | .40/.40 | |
| WardrobE | 30/35 | 32/27 | 48.4/56.5 | |||
| Shoppr | 133/138 | 125/120 | 51.6/53.5 | 0.11/2.11 | .74/.15 | |
| = 29.75/23.23; = 2544/2544; = .013/.079 | ||||||
| Study 2 | ||||||
| Personal trust / General trust | ||||||
| Category | Ant. | De-ant. | % ant. | |||
| Cognizer | Lingua | 72/77 | 80/66 | 47.4/53.8 | ||
| MentorMe | 71/87 | 82/74 | 46.4/54 | 0.03/1.89 | .87/.17 | |
| WardrobE | 33/28 | 30/27 | 52.4/50.9 | |||
| Shoppr | 128/117 | 114/131 | 52.9/47.2 | 0.005/0.56 | .94/.46 | |
| Agency
(=.015/ .97) |
reC | 102/94 | 88/88 | 53.7/51.6 | ||
| IntelliT | 64/63 | 52/62 | 55.2/50.4 | 2.21/0.16 | .14/.69 | |
| MonAI | 110/85 | 89/92 | 55.3/48 | |||
| Cameron | 60/62 | 46/63 | 56.6/49.6 | 4.02/0.21 | .045/.65 | |
| Biological metaphors | HaulIT | 92/84 | 92/93 | 50/47.5 | ||
| Commuter | 57/64 | 64/61 | 47.1/51.2 | 0.24/0.12 | .62/.73 | |
| AquaS | 80/80 | 69/62 | 53.7/56.3 | |||
| AI Scan | 71/79 | 85/81 | 45.5/49.4 | 2.04/0.85 | .15/.36 | |
| Commu-
nicator |
Judy | 68/86 | 84/76 | 44.7/53.1 | ||
| JurisD | 85/68 | 68/72 | 55.6/48.6 | 0.003/0.12 | .96/.73 | |
| MindH | 80/85 | 75/64 | 51.6/57 | |||
| DermAI | 79/75 | 71/78 | 52.7/49 | 0.03/1.07 | .96/.30 | |
| = 1.57/0.80; = 2441/2424; = 2.1/.37 | ||||||
4.1.1. Study 1, personal trust
1292 choices were made of the anthropomorphized product description, and 1252 choices were made of de-anthropomorphized product descriptions. The Chi-squared goodness-of-fit test showed that the distribution of preferences for anthropomorphized descriptions was consistent with the H0 distribution ( = 0.63; df = 14; = .43), meaning there was no statistically significant preference for neither anthropomorphized nor de-anthropomorphized descriptions overall. A Chi-squared test of independence shows a statistically significant association between the products as a variable and the anthropomorphized/de-anthropomorphized descriptions ( = 29.74; = 2544; = .01).
Between individual product pairs, we see that the preference changes per product, sometimes leaning towards a preference for the anthropomorphized description, and sometimes leaning against it. The re-Commender/IntelliTrade (recmmender systems) pair shows a significant preference for the anthropomorphized descriptions for both products ( = 6.84; df = 1; ¿ .001). Similarly, in the MonAI Maker/Cameron (personal assistant) pair, there is a significant preference for the anthropomorphized descriptions for both products ( = 4.29; df = 1; ¿ .04). In the AquaSentinel/AI Scan Guards (drones) pair, there is a significant preference for the de-anthropomorphized descriptions for both products ( = 6.17; df = 1; ¿ .01). Interestingly, for the Judy/JurisDecide (legal recommendations) pair, there was a significant preference for the de-anthropomorphized description of the Judy system, and a preference for the anthropomorphized version of the JurisDecide system ( = 5.12; = 315; = .02).
4.1.2. Study 1, general trust
1295 choices were made of the anthropomorphized product description, and 1249 choices were made of de-anthropomorphized product descriptions. The distribution of anthropomorphized descriptions was consistent with the H0 distribution ( = 0.70; df = 14; = .40), meaning there was no statistically significant preference for neither anthropomorphized nor de-anthropomorphized descriptions overall. A Chi-squared test of independence shows no statistically significant association between the products as a variable and the anthropomorphized/de-anthropomorphized descriptions ( = 23.23; = 2544; = .08).
Between individual product pairs, only the re-Commender/IntelliTrade pair shows a statistically significant preference for the anthropomorphized descriptions of both products ( = 6.27; df = 1; = .01), and the Judy/JurisDecide pair reveals a preference for the anthropomorphized description of JurisDecide, but a preference for the de-anthropomorphized description of Judy with the product as a dependent variable ( = 5.00; = 315; = .02).
4.1.3. Study 2, personal trust
1252 choices were made of the anthropomorphized product description, and 1189 choices were made of de-anthropomorphized product descriptions. The distribution of preferences for anthropomorphized descriptions was consistent with the H0 distribution ( = 1.57; df = 14; = .56), meaning there was no statistically significant preference for neither anthropomorphized nor de-anthropomorphized descriptions overall. A Chi-squared test of independence shows no statistically significant association between the products as a variable and the anthropomorphized/de-anthropomorphized descriptions ( = 13.52; = 2441; = .56).
Between individual product pairs, the only statistically significant result is a preference for the anthropomorphized descriptions of both the MonAI/Cameron products (personal assistant) pair ( = 4.02; df = 1; = .04).
4.1.4. Study 2, general trust
1234 choices were made of the anthropomorphized product descriptions, and 1190 choices were made of de-anthropomorphized product descriptions. The distribution was consistent with the H0 distribution ( = 0.80; df = 14; = .37), meaning there was no statistically significant preference for neither anthropomorphized nor de-anthropomorphized descriptions overall. A Chi-squared test of independence shows no statistically significant association between the products as a variable and the anthropomorphized/de-anthropomorphized descriptions ( = 8.99; = 2424; = .88).
Within the individual product pairs, we see no statistically significant preferences for neither anthropomorphized nor de-anthropomorphized descriptions.
4.1.5. Aggregate results (Study 1 + Study 2), personal trust
Across both studies, 2544 choices were made of the anthropomorphized product description, and 2441 choices were made of de-anthropomorphized product descriptions. The general distribution does not differ significantly from the null hypothesis, meaning we find no statistically significant preference for neither anthropomorphized nor de-anthropomorphized product descriptions overall ( = 2.13; df = 14; = .14). The Chi-squared statistic for the accumulated numbers shows a significant association between the product type as a variable and preference for either anthropomorphized or de-anthropomorphized description ( = 34.06; = 4985; = .003). Between individual product pairs, we see a significant preference for the re-Commender/IntelliTrade ( = 8.47; df = 1; = .004) and MonAI/Cameron ( = 8.31; df = 1; = .004) pairs, and a preference for the de-anthropomorphized description of Judy, but for the anthropomorphized description of JurisDecide with the product as a significant dependent variable ( = 8.50; = 620; = .003).
4.1.6. Aggregate results (Study 1 + Study 2), general trust
2529 choices were made of the anthropomorphized product description, and 2439 choices were made of de-anthropomorphized product descriptions. The distribution is consistent with the H0 distribution ( = 1.63; df = 14; = .09), meaning there was no statistically significant preference for neither anthropomorphized nor de-anthropomorphized descriptions overall. The Chi-squared test shows no significant association between the variable product type and preference for neither anthropomorphized nor de-anthropomorphized description ( = 9.02; = 4968; = .20). The only product pair that shows a signficant difference from the H0 distribution is the re-Commender/IntelliTrade pair, where there is a preference for the anthropomorphized description of both products ( = 4.29; df = 1; = .04).
4.2. RQ1a: Are people more likely to trust anthropomorphized products for themselves (personal trust) as a user than for the general population (general trust)?
A Chi-squared test with anthropomorphization/de-anthropomorphization as the first variable and personal vs. general trust as the second variable shows no significant relationship between the variables personal and general trust and preference for anthropomorphized/de-anthropomorphized descriptions, neither in Study 1 ( = 0.007; = 2544; = .93), nor in Study 2 ( = 0.16; = 4841; = .68), nor in aggregate results ( = 0.07; = 4865; = .79).
4.3. RQ2: Are people more likely to trust products when the products are described in different kinds of anthropomorphizing language?
Personal trust
The choices of anthropomorphized/de-anthropomorphized descriptions per category are shown in the appendix, section 3.1, Tables 9, 10, and 11.
For Study 1, a Chi-squared test of independence shows a statistically significant association between the categories as a variable and the preference for anthropomorphized/de-anthropomorphized descriptions ( = 14.41; = 2544; = .002). The Properties of a cognizer-category is the only category with a distribution that differs significantly from the H0 distribution ( = 10.99; df = 1; ¡ .001). For Study 2, a Chi-squared test of independence shows no statistically significant association between the categories and the anthropomorphized/de-anthropomorphized descriptions ( = 4.96; = 2441; = .17), but it did show a significant preference for the anthropomorphized descriptions in the Agency-category ( = 5.89; df = 1; ¡ .01). It is worth noting that the product pairs in the Cognizer-category in Study 1 (recommender systems and personal assistants) were the same products as had been assigned the Agency-category in Study 2 (as shown in Table 2). Hence, those specific products or product categories may be especially prone to preference in anthropomorphized descriptions (no matter the type of anthropomorphizing language).
If we aggregate the numbers from both studies, there is no statistically significant association between the language categories and the preference for anthropomorphized/de-anthropomorphized descriptions ( = 6.16; = 2441; = .10), but there is a significant preference for the anthropomorphized descriptions in the Cognizer-category alone ( = 5.37; df = 1; = .02). This is a spillover effect: in Study 1, the preference for anthropomorphized descriptions in the Cognizer-category is so strong (56.5% and 55% for personal and general trust, respectively), that despite a very slight negative preference in personal trust in Study 2 (49.8%) and a weaker preference in general trust (50.9%) the preference carries over.
General trust
In Study 1, there is no statistically significant association between the categories and the preference for anthropomorphized/de-anthropomorphized descriptions ( = 7.26; = 2544; = .06), but there is a significant preference for the anthropomorphized descriptions in the Cognizer-category ( = 6.38; df = 1; = .01). In Study 2, there was no statistically significant association between the categories and the preference for anthropomorphized/de-anthropomorphized descriptions ( = 0.52; = 2424; = .91), and no significant difference from the H0 distribution in either of the categories. Aggregating the numbers, a Chi-squared test of independence shows no association between the categories and the preference for anthropomorphized/de-anthropomorphized descriptions ( = 4.21; = 4968; = .24), but there is a significant association in the Cognizer-category ( = 4.50; df = 1; = .03).
4.4. RQ3: Are different groups of people more likely to trust products when the products are described in anthropomorphizing language?
The values from the statistical tests are shown in Table 3. We refer to the appendix, Tables 12-26 for detailed results per study. We highlight that we focus on Chi-squared statistics for the entire variable, i.e., the association between a variable and proportion of choices of anthropomorphized/de-anthromoporphized descriptions. There can be significant preferences within each subgroup (e.g., female vs. male, but due to space restrictions we only discuss the variables where the entire chi-squared statistic is significant)
| Variable | Personal Trust | General Trust | ||||
| Study 1 | Study 2 | Aggregate | Study 1 | Study 2 | Aggregate | |
| Gender | = 4.00 = 2505 = .13 | = 0.5 = 2416 = .48 | = 1.00 = 4921 = .60 | = 4.44 = 2505 = .10 | = 0.12 = 2400 = .94 | = 2.43 = 4905 = .30 |
| Age | = 12.99 = 2512 = .22 | = 21.06 = 2432 = .02 | = 18.45 = 4944 = .048 | = 10.07 = 2512 = .43 | = 10.50 = 2400 = .40 | = 14.51 = 4912 = .20 |
| Socio-economic status | = 6.09 = 2493 = .19 | = 2.23 = 2424 = .69 | = 2.64 = 4917 = .62 | = 3.40 = 2493 = .49 | = 6.46 = 2392 = .17 | = 7.08 = 4885 = .13 |
| Level of education | = 7.63 = 2513 = .11 | = 4.17 = 2432 = .24 | = 6.99 = 4888 = .07 | = 4.87 = 2513 = .30 | = 1.96 = 2400 = .74 | = 1.78 = 4816 = .62 |
| Level of computer knowledge | = 1.49 = 2504 = .68 | = 1.85 = 2432 = .60 | = 2.30 = 4928 = .51 | = 0.35 = 2504 = .95 | = 0.47 = 2400 = .93 | = 0.73 = 4896 = .87 |
4.4.1. Self-described gender
The proportion of choices of anthropomorphized/de-anthropomorphized product descriptions did not differ significantly by gender in either study, neither in personal trust, nor in general trust.
4.4.2. Age
In Study 1, a Chi-test of independence showed no significant relationship between the two variables age and proportion of choices of anthropomorphized/de-anthropomorphized descriptions. In Study 2, the same test showed a significant relationship between the variables, and this repeated for the aggregate results, meaning there was an overall significant association between different age groups and their preference for anthropomorphized or de-anthropomorphized product descriptions in personal trust.
Looking closer at the age groups individually, only the 61-65 year group shows a strong, statistically significant preference for anthropomorphized descriptions ( = 14.70; df = 1; ¡ .001). In some of the age groups, is too small to draw meaningful conclusions within different categories, but we highlight a significant preference for the anthropomorphized descriptions for groups 31-35 and 51-55 in the Cognizer-category ( = 4.40; df = 1; = .04 and = 3.88; df = 1; = .05, respectively), in the 36-40 age group, there was a significant preference for the anthropomorphized descriptions in the Communicator-category ( = 6.92; df = 1; = .01), and in the 41-45 age group, there was a strong preference for the de-anthropomorphized descriptions in the Biological metaphors-category ( = 3.97; df = 1; = .05). No statistically significant association between age and preference for anthropomorphized/de-anthropomorphized product descriptions could be found in general trust in either study.
4.4.3. Socio-economic status
A chi-squared test showed that the proportion of choices of anthropomorphized/de-anthropomorphized product descriptions did not differ significantly by socio-economic status in either study, neither in personal trust, nor in general trust.
4.4.4. Level of education
No significant association was found between level of education and preference for anthropomorphized or de-anthropomorphized descriptions in either study, neither for personal trust, nor for general trust.
4.4.5. Level of computer knowledge
The proportion of choices of anthropomorphized/de-anthropomorphized product descriptions did not differ significantly by level of computer knowledge in either study, neither in personal trust, nor in general trust.
5. Discussion
The qualitative responses from the surveys circumstantiate and add detail to the quantitative results. Because the open answers were optional, we do not attempt to quantify their importance or weight in any way, and that would be meaningless: since some product pairs had 30 elaborations, while some had maybe 100, some insights might be unfairly under- or over-represented. We use the open answers to shed light on a complex topic and study, and to provide insights that hopefully lead to fair and purposeful future investigation in the subject.
5.1. Observation 1: Overall, people are no more likely to choose anthropomorphized descriptions of products over de-anthropomorphized descriptions of probabilistic automation products.
Across categories, we do not see a clear preference for anthropomorphized descriptions of products over de-anthropomorphized descriptions of products. This is a conclusion that come with numerous addenda, the most important one being “it depends” — within some product descriptions there was a significant preference for the anthropomorphized description, and for some systems there was a clear preference for the de-anthropomorphized description. The preference proportions changed between the two studies, after anthropomorphization categories were swapped. This points to the conclusion that both product genre and type of anthropomorphization influence how people immediately perceive a product based on its description. A few participants even highlighted linguistic differences in product descriptions as motivating their choice, albeit using different words than anthropomorphization: “Option B provides a more engaging and descriptive presentation ” (Study 1, de-ant. AquaSentinel666The parentheses after quotes are in the form [Study #, anthropomorphized/de-anthropomorphized description, product], in this case indicating that the participant was part of Study 1, the participant chose the de-anthropomorphized description of AquaSentinel (therefore comparing it to the anthropomorphized AI Scan Guards).). We find the following main themes or clusters when looking for how participants motivate their rationale:
Lesser of two evils-motivation
A prevalent theme in the open text answers is that the participant has chosen “the lesser of two evils”; meaning they are expressing deep skepticism of both products, but was forced, through the survey design, to choose one. In this case, the motivation appears to be identifying which product has lower stakes, or less impact if the system somehow fails: “Lower stakes - only deals with hobbies/past times as opposed to finances” (Study 1, ant. re-Commender), and “I would trust AI more to transport goods than people” (Study 1, de-ant. HaulIt).
People attempt to evaluate shortcomings and strengths of using probabilistic automation for the particular context
A lot of responses express that probabilistic automation is more appropriate for some tasks than for others. For instance, most responses in favor of the MonAI system in favor of the Cameron system highlight that “Computers are better with numbers than texts. I would trust more an app with numbers than one who manage texts.” (Study 1, ant. MonAI Maker). However, many of these assumptions are exactly that; assumptions of the system’s functionality: “It will be more correct because it works with photos for comparison, so the chance of error is smaller” (Study 2, de-ant. DermAI Scan). This is hardly an objective truth, and broad assumptions like this emphasize the importance of conveying accurate expectations of the system’s functionality, because people are prone to form beliefs even based on short descriptions. The logic appears to be, of course, that the perceived benefits should outweigh the potential risks.
Human favoritism
A common theme in the responses was human favoritism, perceiving an output as higher quality if a human expert has been involved in the process of creating it (Zhang and Gosline, 2023). This was visible as expressions of preference for the products where a human was assumed in control of the probabilistic automation product, even when this was not actually described in the product pitch, e.g., “There is both a person driving it and an AI in it” (Study 1, de-ant. Commuter). The potential of biased probabilistic automation training data was mentioned many times as rationale for distrusting the system (e.g., “I dislike the idea of AI in the justice system when it is prone to making up information. How do we know that Judy would be free from bias?” (Study 2, de-ant. JurisDecide). Human favoritism is an interesting notion, in that it could potentially introduce issues of over-reliance on human judgments and under-estimation of human bias and error-proneness.
Overall, our results show that people do not unequivocally trust technology just because it is linguistically anthropomorphized. People are critical about use context, risks, impacts, and human involvement, and although we confirm earlier research that demonstrate some influence of anthropomorphization on attitude (e.g., (Langer et al., 2022; Kim and Song, 2023)), there is not a binary or simple relationship between anthropomorphization and trust.
De-anthropomorphization carries a risk of misunderstandings
A very interesting finding was that a few users simply did not understand the de-anthropomorphized (but more technically accurate) descriptions as examples of probabilistic automation products, e.g. “I’m not sure I would entirely trust Cameron not to miss any important/urgent emails. However when it came to my data I’d trust it more than any AI.” (Study 1, de-ant. Cameron777In the de-antropomorphized version, Cameron was described as “powered by automatic pattern matching” instead of “powered by artificial intelligence”.). This person appears to express a general aversion to the concept “AI”, and has not picked up that “automatic pattern matching” is actually the same as “AI”. The de-anthropomorphized description leads to a misunderstanding. Other examples are “I prefer this to AI” (Study 2, ant. MindHealth) and “this one doesn’t use neural networks so it’s most likely to be more accurate” (Study 1, de-ant. JurisDecide888“Neural networks” was swapped for “weighted networks” in the de-anthropomorphized description). This is a significant risk that we need to consider when describing probabilistic automation systems: how do we balance the advantages of using language and metaphors that people are familiar with, with the risks of those analogies and metaphors leading to incorrect assumptions?
5.2. Observation 1a: Across the two studies, people are no more likely to trust anthropomorphized product descriptions when imagining themselves as a user than to trust them for the general population
In both studies, several trends in preference under personal trust were not present when asked about general trust. This was the case both in Study 1, where participants were asked about both personal and general trust per product, and in Study 2, where each participant was only asked about either personal or general trust. For Study 1, we suspected there could be an ordering effect of the survey; the first question might elicit an immediate response, and the immediate invitation to reflect again on the product in relation to general trust could urge the participant to feel they should choose something different for the second option. This, however, does not explain the differences in Study 2, where the participant groups were different for the personal trust and for the general trust questions.
In fact, we see for Study 2 that preferences (see Table 2) lean in different directions for several product pairs, and overall for the different categories (Cognizer, Agency, and Biological metaphors all elicit different preferences between personal and general trust in Study 2). The differences are small, however (e.g., 48.9% preference for anthropomorphized descriptions for personal trust vs. 50.8% preference for anthropomorphized descriptions in general trust for the Cognizer-category), and none of them are statistically significant in the overall comparison, except for the Agency-category, which elicited 55% and 49.9% preference for the anthropomorphized descriptions in personal and general trust, respectively. We could not identify any obvious differences in the qualitative responses between participants’ rationale for choosing products for themselves and evaluating their output in general.
5.3. Observation 2: The type of product or system in combination with different kinds of anthropomorphizing language appears to exert a greater influence on trust than anthropomorphizing language alone.
Since we saw a statistically significant association between product type as a variable and preference for anthropomorphized/de-anthropomorphized descriptions in personal trust in Study 1, we decided to change the categories of anthropomorphizing language between products and conduct the second study to explore this potentially confounding variable. The fact that the products in the recommender systems and personal assistants resulted in a preference for anthropomorphized descriptions in the Cognizer category in Study 1, and in the Agency category in Study 2 (at least in personal trust), indicates that certain products or systems might be more sensitive to anthropomorphized language than others. Interestingly, this goes in both ‘directions’: the ‘Judy’ and the ‘AI Scan Guards’ systems were generally more trusted in the de-anthropomorphized descriptions. We note, that these systems were both in the Biological metaphors category in Study 1 and Study 2, respectively — we hypothesize that this category of language may yield particularly contrived analogies which approach the uncanny valley (Mori et al., 2012) and, consequently, mistrust. This, however, does not explain the general preference for anthropomorphized descriptions of ‘JurisDecide’ and ‘AquaSentinel’ — the two products that ‘Judy’ and ‘AI Scan Guards’ were compared to, and which were in the same language categories (Biological metaphors).
Our findings advocate for a nuanced conclusion that the individual product or system is an important variable for people’s preferences and attribution of trustworthiness. Some products might be more susceptible to anthropomorphization of one type, and certain types of anthropomorphization might highlight or obfuscate specific qualities in specific system genres. Our studies thus support the findings of (Langer et al., 2022).
5.4. Observation 3: Age is the only variable that seems to have a dependent association with preferences for anthropomorphized/de-anthropomorphized product descriptions.
When dividing participants into subgroups by age, some patterns emerge per category as well as overall. Interestingly, we see a strong preference for anthropomorphized descriptions in the 61-65 group, and a strong preference for de-anthropomorphized descriptions in the 66+ group. The subgroups are small, however, (26 participants total for the 61-65 group, and 37 for the 66+ group), so we refrain from making general conclusions on the basis of this study. The groups 31-35 and 36-40 compose a larger proportion of participants, and these groups both show a strong preference for anthropomorphized descriptions, particularly in the Cognizer-category. When looking at the open answers, these age groups do not seem to provide different rationales from other age groups; they (also) highlight factors such as personal usefulness (“I can grocery shop weekly […] but I am always surprised by the fact that ALL my basics become [worn] out at the same time”(Study 1, ant. WardrobEase)), privacy (“I would never use my voice online” (Study 2, de-ant. DermAI Scan)) risk of failure (“I trust AI Scan Guards to give better output, due to its systems having less of a chance to be disrupted by enemy counter electronics warfare” (Study 2, ant. AI Scan Guards)) and impact in case of failure (“[AI] dealing with the jury can skew what their outcomes would be.” (Study 2, de-ant. JurisDecide)) as the main motivations behind their choices. One hypothesis to explain these differences across age groups is that there could be age-related factors influencing computing literacy for different groups . A recent survey has indicated a generation gap in probabilistic automation-acceptance (Tsai, 2023), and potentially, using more familiar language to describe such systems (playing on anthropomorphizing metaphors and analogies) may make the systems more appealing to these groups.
6. Limitations
We acknowledge study only explores a small part of the overarching question “What are the effects of anthropomorphization of probabilistic automation systems?” This question could be explored in many ways that are likely to provide other results. Some of the most important limitations to the approach used in this study are listed below:
Contrived study setup rather than organic choice. Any controlled experiment can impose confounding factors. “Trust” based on momentary, immediate choices, rather than long-term, more organic exposure to descriptions of a system. Conversely, one could argue that based on the qualitative answers, participants have relied heavily on their existing knowledge about probabilistic automation systems, so we are not exposing them to completely novel technology descriptions. Participants were also asked to choose based on only a short description and no examples of the system’s output. We do not believe this was a confounding factor for the results, but it could mean that the results will not generalize to contexts where more information is given.
Contrived language. To emphasize the anthropomorphic language as a variable, we have loaded a lot of ‘anthropomorphisms’ into very little text. A few participants highlighted linguistic or semantic features of the descriptions as determining factors for their choice (see section 5.1), so it is possible that this would have impacted the results to some degree. We have tried to mitigate this factor by creating descriptions that are directly comparable to actual products found “in the wild”.
Not all categories were tested on all products. We only swapped the categories between two different products. Ideally, we could have tried all categories of anthropomorphization on all product types, however, this would have required an untenable amount of different studies (and no page restrictions). The results provide enough insight for us to conclude that the matter is not straightforward, and that further investigation is needed.
Order effects bias. In the survey, product pairs were always presented in the same order, which could could induce order effects bias. This should not have any effect on the primary variable (anthropomorphized versus de-anthropomorphized), as these choices were always randomized.
7. Conclusions
In this paper, we explored an overall question of the influence of anthropomorphized short descriptions of probabilistic automation systems on trust. We made three observations based on the results: 1. Across both studies, people were no more likely to prefer anthropomorphized products over de-anthropomorphized products. 2. The product type in combination with anthropomorphizing language appears to exert higher influence on trust than anthropomorphizing language alone, and 3. Age was the only variable (of those measured) which had a statistically significant association with preference for anthropomorphized vs. de-anthropomorphized products.
Our results show that anthropomorphized descriptions of systems do not automatically lead to favoritism or increased trust. It appears to depend on product category and type of anthropomorphization, as well as the reader of the text. We highlight that this was an exploratory study which hopefully provides inspiration for further investigation by other researchers. We hope that the results are useful to those who write about probabilistic automation systems, whether they be scholars, policy makers, or journalists. Our future work will include further exploration of empirically founded taxonomies of anthropomorphization, as well as more detailed studies of the risks of “trust”, investigating different impact of anthropomorphized descriptions of probabilistic automation systems.
8. Impact Statement
In designing our online survey we adhered to the ethical guidelines in HCI methodology (Bruckman, 2014) to ensure participant anonymity and data privacy. Participants were recruited via the Prolific platform, and compensated for their participation. To ensure that we reached a representative group we created pre-screening criteria such as country of residence, self-assessed socio-economic status, ethnicity, and geographic location. We did not collect any identifiable information and all the survey responses were stored temporarily on a secure server. To avoid confusion about the fictitious products, we added a statement at the end of the survey asserting that all products are 100% imagined, although some of them have been loosely based on existing products or services. We also stated that the goal of the research was to investigate whether the description of the product influenced the way its trustworthiness and functionality is perceived, as well as contact info for the lead author.
8.1. Positionality statement for the study authors.
The expertise and lived experiences of our research team were an important part of the judgments and discussions in our analysis. We present our research team positionality according to the guidelines proposed by Liang et al..
The first author has a background in digital design and positions themselves as an enthusiast of (mixed methods) research methodology. Their research career has focused on understanding how people interact with technology, and how technology impacts human cognition. Their background shapes the work by increasing their attention to qualitative data as a primary resource for understanding quantitative results.
The second author positions themselves primarily as an activist for better and more inclusive AI education. They worked for more than eight years on hands-on STEAM education in different communities worldwide as part of the organization they created called [Anonymized]. In the past four years, they have led multiple co-design sessions with families focused on AI literacy and created [Anonymized], one of the first platforms for AI education, which is free and open-source. This experience influenced their focus on critical understanding and use of probabilistic automation systems and informed their understanding of how the perception of technology can shape people’s trust and use of it.
The third author is a natural language processing scientist with a background in low-resource NLP and the digital documentation of resources for low-resource language communities. Their work also encompasses the field of human-computer interaction and the intersection between NLP and psycholinguistics. Their previous work in human-computer interaction and AI provides insights into how users perceive and interact with technology, contributing to a deeper understanding of trust dynamics in AI systems.
The fourth author is a computational linguist, with expertise in syntax, semantics and sociolinguistics. They have long worked at the intersection of linguistics and natural language processing, specifically on how linguistic knowledge can inform the development and study of language technology. They have been doing public scholarship around the way that probabilistic automation technologies are sold and perceived and advocating for more accurate and less aspirational descriptions of this technology.
We acknowledge that while our study addresses a timely question of how people’s trust in automation driven systems can be influenced by different forms of anthropomorphism it could also lead to a potential dual use. For example, bad actors could use our findings to elicit unearned trust from people, in particular by describing technical systems functionality in cognitive terms and by emphasizing their “intelligence”. Bad actors could also use the observations from our study to target specific age groups that seem to be more susceptible to trust systems with anthropomorphized descriptions.
Acknowledgements.
Thank you to Sasha Luccioni, Leon Derczynski, and Alexander Koller for the discussions that helped frame this study. This research was supported by the VILLUM Foundation, grant 37176 (ATTiKA: Adaptive Tools for Technical Knowledge Acquisition).References
- (1)
- Abercrombie et al. (2023) Gavin Abercrombie, Amanda Cercas Curry, Tanvi Dinkar, and Zeerak Talat. 2023. Mirages: On anthropomorphism in dialogue systems. arXiv preprint arXiv:2305.09800 (2023).
- Bainbridge et al. (2008) Wilma A Bainbridge, Justin Hart, Elizabeth S Kim, and Brian Scassellati. 2008. The effect of presence on human-robot interaction. In Robot and Human Interactive Communication, 2008. RO-MAN 2008. The 17th IEEE International Symposium on. IEEE, 701–706.
- Baker et al. (1998) Collin F Baker, Charles J Fillmore, and John B Lowe. 1998. The berkeley framenet project. In COLING 1998 Volume 1: The 17th International Conference on Computational Linguistics.
- Bigman et al. (2019) Yochanan E Bigman, Adam Waytz, Ron Alterovitz, and Kurt Gray. 2019. Holding robots responsible: The elements of machine morality. Trends in cognitive sciences 23, 5 (2019), 365–368.
- Bruckman (2014) Amy Bruckman. 2014. Research ethics and HCI. Ways of Knowing in HCI (2014), 449–468.
- Bunz and Braghieri (2022) Mercedes Bunz and Marco Braghieri. 2022. The AI doctor will see you now: assessing the framing of AI in news coverage. AI & society 37, 1 (2022), 9–22.
- Chen and Park (2021) Qian Qian Chen and Hyun Jung Park. 2021. How anthropomorphism affects trust in intelligent personal assistants. Industrial Management & Data Systems 121, 12 (2021), 2722–2737.
- Chi and Hoang Vu (2023) Nguyen Thi Khanh Chi and Nam Hoang Vu. 2023. Investigating the customer trust in artificial intelligence: The role of anthropomorphism, empathy response, and interaction. CAAI Transactions on Intelligence Technology 8, 1 (2023), 260–273.
- Christoforakos et al. (2021) Lara Christoforakos, Alessio Gallucci, Tinatini Surmava-Große, Daniel Ullrich, and Sarah Diefenbach. 2021. Can robots earn our trust the same way humans do? A systematic exploration of competence, warmth, and anthropomorphism as determinants of trust development in HRI. Frontiers in Robotics and AI 8 (2021), 640444.
- Clarke et al. (2015) Victoria Clarke, Virginia Braun, and Nikki Hayfield. 2015. Thematic analysis. Qualitative psychology: A practical guide to research methods 222 (2015), 248.
- Crawford (2009) L Elizabeth Crawford. 2009. Conceptual metaphors of affect. Emotion review 1, 2 (2009), 129–139.
- Deroy (2023) Ophelia Deroy. 2023. The Ethics of Terminology: Can We Use Human Terms to Describe AI? Topoi (2023), 1–9.
- Desai and Twidale (2023) Smit Desai and Michael Twidale. 2023. Metaphors in voice user interfaces: a slippery fish. ACM Transactions on Computer-Human Interaction 30, 6 (2023), 1–37.
- Druga et al. (2017) Stefania Druga, Randi Williams, Cynthia Breazeal, and Mitchel Resnick. 2017. Hey Google is it OK if I eat you?: Initial Explorations in Child-Agent Interaction. In Proceedings of the 2017 Conference on Interaction Design and Children. ACM, 595–600.
- Fetterolf and Hertog (2022) Elizabeth Fetterolf and Ekaterina Hertog. 2022. It’s Not Her Fault: Trust through Anthropomorphism among Young Adult Amazon Alexa Users. (2022).
- Fong et al. (2003) Terrence Fong, Illah Nourbakhsh, and Kerstin Dautenhahn. 2003. A survey of socially interactive robots. Robotics and autonomous systems 42, 3 (2003), 143–166.
- Hartmann et al. (2008) Jan Hartmann, Antonella De Angeli, and Alistair Sutcliffe. 2008. Framing the user experience: information biases on website quality judgement. In Proceedings of the SIGCHI conference on human factors in computing systems. 855–864.
- Hoffman et al. (2018) Robert R Hoffman, Shane T Mueller, Gary Klein, and Jordan Litman. 2018. Metrics for explainable AI: Challenges and prospects. arXiv preprint arXiv:1812.04608 (2018).
- Hsee and Leclerc (1998) Christopher K Hsee and France Leclerc. 1998. Will products look more attractive when presented separately or together? Journal of Consumer Research 25, 2 (1998), 175–186.
- Hsee et al. (1999) Chrisopher K Hsee, George F Loewenstein, Sally Blount, and Max H Bazerman. 1999. Preference reversals between joint and separate evaluations of options: A review and theoretical analysis. Psychological bulletin 125, 5 (1999), 576.
- Hunger (2023) Francis Hunger. 2023. Unhype Artificial ’Intelligence’! A proposal to replace the deceiving terminology of AI. (2023). https://doi.org/10.5281/ZENODO.7524492
- Inie (2024) Nanna Inie. 2024. What Motivates People to Trust’AI’Systems? arXiv preprint arXiv:2403.05957 (2024).
- Isaeva et al. (2022) Ekaterina Isaeva, Olga Baiburova, and Oksana Manzhula. 2022. Anthropomorphism in Computer Security Terminology Through the Prizm of Smart Cognitive Framing. In Science and Global Challenges of the 21st Century-Science and Technology: Proceedings of the International Perm Forum “Science and Global Challenges of the 21st Century”. Springer, 460–474.
- Isbister and Nass (2000) Katherine Isbister and Clifford Nass. 2000. Consistency of personality in interactive characters: verbal cues, non-verbal cues, and user characteristics. International journal of human-computer studies 53, 2 (2000), 251–267.
- Kanda et al. (2004) Takayuki Kanda, Takayuki Hirano, Daniel Eaton, and Hiroshi Ishiguro. 2004. Interactive robots as social partners and peer tutors for children: A field trial. Human-computer interaction 19, 1 (2004), 61–84.
- Khadpe et al. (2020) Pranav Khadpe, Ranjay Krishna, Li Fei-Fei, Jeffrey T Hancock, and Michael S Bernstein. 2020. Conceptual metaphors impact perceptions of human-AI collaboration. Proceedings of the ACM on Human-Computer Interaction 4, CSCW2 (2020), 1–26.
- Kim and Song (2020) Taenyun Kim and Hayeon Song. 2020. The Effect of Message Framing and Timing on the Acceptance of Artificial Intelligence’s Suggestion. In Extended Abstracts of the 2020 CHI Conference on Human Factors in Computing Systems. 1–8.
- Kim and Song (2021) Taenyun Kim and Hayeon Song. 2021. How should intelligent agents apologize to restore trust? Interaction effects between anthropomorphism and apology attribution on trust repair. Telematics and Informatics 61 (2021), 101595.
- Kim and Song (2023) Taenyun Kim and Hayeon Song. 2023. Communicating the limitations of AI: the effect of message framing and ownership on trust in artificial intelligence. International Journal of Human–Computer Interaction 39, 4 (2023), 790–800.
- Kocielnik et al. (2019) Rafal Kocielnik, Saleema Amershi, and Paul N Bennett. 2019. Will you accept an imperfect ai? exploring designs for adjusting end-user expectations of ai systems. In Proceedings of the 2019 CHI Conference on Human Factors in Computing Systems. 1–14.
- Langer et al. (2022) Markus Langer, Tim Hunsicker, Tina Feldkamp, Cornelius J König, and Nina Grgić-Hlača. 2022. “Look! It’sa computer program! It’s an algorithm! It’s AI!”: Does terminology affect human perceptions and evaluations of algorithmic decision-making systems?. In Proceedings of the 2022 CHI Conference on Human Factors in Computing Systems. 1–28.
- Liang et al. (2021) Calvin A Liang, Sean A Munson, and Julie A Kientz. 2021. Embracing four tensions in human-computer interaction research with marginalized people. ACM Transactions on Computer-Human Interaction (TOCHI) 28, 2 (2021), 1–47.
- McGlone (1996) Matthew S McGlone. 1996. Conceptual metaphors and figurative language interpretation: Food for thought? Journal of memory and language 35, 4 (1996), 544–565.
- Metz (2023) Cade Metz. 2023. Microsoft Says New AI Shows Signs of Human Reasoning - The New York Times. https://www.nytimes.com/2023/05/16/technology/microsoft-ai-human-reasoning.html. (Accessed on 01/19/2024).
- Mori et al. (2012) Masahiro Mori, Karl F MacDorman, and Norri Kageki. 2012. The uncanny valley [from the field]. IEEE Robotics & automation magazine 19, 2 (2012), 98–100.
- Nass and Moon (2000) Clifford Nass and Youngme Moon. 2000. Machines and mindlessness: Social responses to computers. Journal of social issues 56, 1 (2000), 81–103.
- Norman (2013) Don Norman. 2013. The design of everyday things: Revised and expanded edition. Basic books.
- Nowell et al. (2017) Lorelli S Nowell, Jill M Norris, Deborah E White, and Nancy J Moules. 2017. Thematic analysis: Striving to meet the trustworthiness criteria. International journal of qualitative methods 16, 1 (2017), 1609406917733847.
- on Privacy and Technology (2022) Center on Privacy and Technology. 2022. Artifice and Intelligence. medium.com/center-on-privacy-technology/artifice-and-intelligence%C2%B9-f00da128d3cd (Accessed on 01/19/2024).
- Reeves and Nass (1996) Byron Reeves and Clifford Nass. 1996. How people treat computers, television, and new media like real people and places. CSLI Publications and Cambridge university press.
- Roubroeks et al. (2011) Maaike Roubroeks, Jaap Ham, and Cees Midden. 2011. When artificial social agents try to persuade people: The role of social agency on the occurrence of psychological reactance. International Journal of Social Robotics 3 (2011), 155–165.
- Sah and Peng (2015) Young June Sah and Wei Peng. 2015. Effects of visual and linguistic anthropomorphic cues on social perception, self-awareness, and information disclosure in a health website. Computers in Human Behavior 45 (2015), 392–401.
- Salles et al. (2020) Arleen Salles, Kathinka Evers, and Michele Farisco. 2020. Anthropomorphism in AI. AJOB neuroscience 11, 2 (2020), 88–95.
- Seeger et al. (2021) Anna-Maria Seeger, Jella Pfeiffer, and Armin Heinzl. 2021. Texting with humanlike conversational agents: Designing for anthropomorphism. Journal of the Association for Information Systems 22, 4 (2021), 8.
- Shanahan (2022) Murray Shanahan. 2022. Talking about large language models. arXiv preprint arXiv:2212.03551 (2022).
- Shardlow and Przybyła (2022) Matthew Shardlow and Piotr Przybyła. 2022. Deanthropomorphising NLP: Can a Language Model Be Conscious? arXiv preprint arXiv:2211.11483 (2022).
- Strait et al. (2018) Megan Strait, Ana Sánchez Ramos, Virginia Contreras, and Noemi Garcia. 2018. Robots racialized in the likeness of marginalized social identities are subject to greater dehumanization than those racialized as white. In 2018 27th IEEE International Symposium on Robot and Human Interactive Communication (RO-MAN). IEEE, 452–457.
- Stuart and Kneer (2021) Michael T Stuart and Markus Kneer. 2021. Guilty artificial minds: Folk attributions of mens rea and culpability to artificially intelligent agents. Proceedings of the ACM on Human-Computer Interaction 5, CSCW2 (2021), 1–27.
- Tanaka et al. (2007) Fumihide Tanaka, Aaron Cicourel, and Javier R Movellan. 2007. Socialization between toddlers and robots at an early childhood education center. Proceedings of the National Academy of Sciences 104, 46 (2007), 17954–17958.
- Tsai (2023) Peter Tsai. 2023. The AI Generation Gap: Millennials Embrace AI, Boomers Are Skeptical — pcmag.com. https://www.pcmag.com/news/the-ai-generation-gap-millennials-embrace-ai-boomers-are-skeptical. [Accessed 22-01-2024].
- Vollmer et al. (2018) Anna-Lisa Vollmer, Robin Read, Dries Trippas, and Tony Belpaeme. 2018. Children conform, adults resist: A robot group induced peer pressure on normative social conformity. Science Robotics 3, 21 (2018), eaat7111.
- Zhang and Gosline (2023) Yunhao Zhang and Renée Gosline. 2023. Human favoritism, not AI aversion: People’s perceptions (and bias) toward generative AI, human experts, and human–GAI collaboration in persuasive content generation. Judgment and Decision Making 18 (2023), e41.
Appendix A Survey screenshot
To align understandings of trust, the survey was introduced with the following text:
“On the following pages, you will be introduced to a series of technical systems. We ask you to evaluate these systems along the following two dimensions:
How likely you would be to trust the system as a user. We ask you to think about how likely you would be to trust using this system for your own purposes, assuming you would like to use the service it would provide.
Which systems you think would generally give better output for its users. Here, we ask you to think about the general quality of output that this system would produce. So, even if the system didn’t provide a service relevant to you, would it be a good system for its users?
Under each question you can provide further information about your rationale behind your choice – if you wish to do so.”
Appendix B Product descriptions
In each product descriptions, instances of anthropomorphization (4-5 per product) are highlighted to allow for easier comparison to the de-anthropomorphized version. Each of the anthropomorphic short pitches was written to fit in its respective category, and each of the short pitches included 4-5 “instances” of the anthropomorphic category. For each de-anthropomorpized description of the product, the five instances of anthropomorphic language were re-written so they did not reflect the specific category of anthropomorphization, but the rest of the short pitch could include examples of the other categories of anthropomorphization — thus, isolating each anthropomorphization category as the independent variable. We were not strict about avoiding other categories of anthropomorphic language (especially the category of agency) in the pitches. However, we also did not de-anthropomorphize language outside the target anthropomoprhic language type in the corresponding de-anthropomorphized product description. For example, in Study 1, MonAI Maker is described as identifying ways to save money, a cognizer description and de-anthropomorphized as providing suggestions instead. This is still agentive language.
| Cat. | Anthropomorphized | De-anthropomorphized | Anthropomorphized | De-anthropomorphized |
|
Properties of a cognizer |
A smartphone app, re-Commender, understands your dining preferences, knows your preferences from historical data, and uses trends from all its users to predict new restaurants you might enjoy. It remembers your previous ratings and habits, and figures out offers and coupons you might like. | A smartphone app, re-Commender, creates a model of your dining inclinations, encodes your preferences from historical data, and uses trends from all its users to classify new restaurants you might enjoy. It stores your previous ratings and habits, and extracts offers and coupons you might like. | A smartphone app, IntelliTrade is an intelligent stock broker, which identifies promising stocks, funds, and bonds for you. It remembers your investment preferences as well as historical stock trajectories and understands current news stories, using both of these to predict promising investment opportunities. | A smartphone app, IntelliTrade is an automated stock broker, which makes calculations about promising stocks, funds, and bonds for you. It encodes your investment preferences as well as historical stock trajectories and processes current news stories, using both of these to classify promising investment opportunities. |
|
Properties of a cognizer |
MonAIMaker is an intelligent app that helps you plan your personal finances. It learns what you are likely to spend money on by recognizing trends in your bank statements as well as your email correspondences. It uses these to identify ways to save money, and remember when you have bills and expenses due. | MonAIMaker is an automatic pattern matching app that helps you plan your personal finances. It classifies what you are likely to spend money on by mapping trends in your bank statements as well as your email correspondences. It uses these to provide suggestions for ways to save money, and store information about when you have bills and expenses due. | An app, Cameron, is powered by artificial intelligence and machine learning to help you organize and answer your emails. It interprets text from your incoming emails, suggests answers based on your writing style, and recognizes tasks and deadlines to create automated to-do-lists for you. | An app, Cameron, is powered by automatic pattern matching and machine conditioning to help you organize and answer your emails. It classifies text from your incoming emails, synthesizes answers based on your writing style, and assigns labels to tasks and deadlines to create automated to-do-lists for you. |
|
Agency |
A self-driving truck HaulIT handles long haul freight 24/7 without rest stops, and it never gets tired or distracted. The truck is designed for both city and highway, meaning it always chooses the most optimal route for speed and efficiency by analyzing current and projected traffic conditions and self-managing battery charging. | A driverless truck HaulIT is programmed to transport long haul freight 24/7 without rest stops, and it never gets tired or distracted. The truck is designed for both city and highway, meaning it is always sent along the most optimal route for speed and efficiency, based on statistical predictions about current and projected traffic conditions as well as optimal battery charging points. | A sleeper bus, Commuter, drives people from their home to a long-distance destination overnight. The bus avoids other vehicles and obstacles on the road, and adapts to the weather conditions to navigate safely. It monitors traffic live and picks the best and safest routes. | A sleeper bus, Commuter, is used to transport people from their home to a long-distance destination overnight. The bus has algorithms for avoiding other vehicles and obstacles on the road, and the algorithms are adjusted to the weather conditions to navigate safely. Its systems are fed live traffic data for calculations of the best and safest routes. |
|
Agency |
An AI and ML-powered drone, AquaSentinel AI-MAR, monitors enemy seas. Armed with cutting-edge technology, it autonomously patrols waterways, utilizing advanced algorithms to swiftly detect and analyze potential threats in real-time. | An AI and ML-powered drone, AquaSentinel AI-MAR, is programmed to monitor enemy seas. Armed with cutting-edge technology, it is positioned over waterways, equipped with advanced algorithms designed to detect and provide analyses of potential threats in real-time. | The newest unmanned aircraft systems (UAS), AI Scan Guards, monitor a physical territory from the air. They use image recognition to analyze live video streams, seek out enemy targets and alert the defense forces. | The newest unmanned aircraft systems (UAS), AI Scan Guards, are programmed to monitor a physical territory from the air. They are equipped with image recognition algorithms that are used to process live video streams. System outputs may be used to identify enemy targets and provide alerts to defense forces. |
| Cat. | Anthropomorphized | De-anthropomorphized | Anthropomorphized | De-anthropomorpized |
|
Biological metaphors |
A software system for court juries, Judy, uses neural networks to inform jury members in court cases. Thousands of transcripts and outcomes from previous similar trials are fed to Judy’s brain, whose digital neurons digest all data and determinants to provide information about relevant law and precedence in current cases. | A software system for court juries, Judy, uses weighted networks to inform jury members in court cases. Thousands of transcripts and outcomes from previous similar trials are input into Judy’s CPU, whose algorithms process all data and determinants to provide information about relevant law and precedence in current cases. | A software application, JurisDecide uses neural networks to enhance lawyers’ decision-making in trials. Its digital brain continually evolves and rapidly processes extensive legal data, including precedent and case law which JurisDecide’s digests to spit out information for legal professionals. | A software application, JurisDecide uses weighted networks to enhance lawyers’ decision-making in trials. Its algorithms continually self-update and rapidly process extensive legal data, including precedent and case law which JurisDecide’s processes to output information for legal professionals. |
|
Biological metaphors |
A neural network system, MindHealth, is an online digital ear which senses indicators in spoken language that a person may be developing one or more early signs of dementia. Its digital synapses have evolved during thousands of conversations with healthy humans and dementia patients. | A weighted network system, MindHealth, is an online digital recorder which classifies indicators in spoken language that a person may be developing one or more early signs of dementia. Its complex algorithms have been fine-tuned based on thousands of conversations with healthy humans and dementia patients. | A diagnostic tool, DermAI Scan, uses neural networks to diagnose dermatological conditions from your home computer. You feed it a picture and receive a suggestion for a diagnosis. Evolving neural networks means that the system’s neurons can instantly compare your picture to images of millions of previous diagnoses. | A diagnostic tool, DermAI Scan, uses weighted networks to diagnose dermatological conditions from your home computer. You upload a picture and receive a suggestion for a diagnosis. Fine-tuned weighted networks means that the system’s weights can instantly compare your picture to images of millions of previous diagnoses. |
|
Properties of a communicator |
A smartphone app, Lingua, is an interactive language learning tutor. You can talk or write to the app and it will speak back to you in real time. Lingua tells you about the accuracy and complexity of your speech, and it suggests areas of improvement. | A smartphone app, Lingua, is an interactive language learning tutor. You can input speech or text to the app and it will output speech to you in real time. Lingua indicates the accuracy and complexity of your speech, and it produces suggestions for areas of improvement. | MentorMe is an online chatbot, which you can talk to about specific academic topics (each based on different data sets). It speaks like a mentor, and proposes new ways to approach a problem, rather than just answering questions directly. It also asks you questions to enhance your learning about a given topic. | MentorMe is an online chatbot, into which you can input text about specific academic topics (each based on different data sets). It produces text in the style of a mentor, and outputs candidate matches for new ways to approach a problem, rather than just indicating answers for questions directly. It also outputs questions to enhance your learning about a given topic. |
|
Properties of a communicator |
A smartphone app, WardrobEase, is a service for effortlessly restocking essential clothing items such as jeans, socks, and underwear. It discusses your fabric and style preferences with you, you tell it your sizes, and it responds with pictures of choices. You can tell it when your clothes are starting to wear out, and ask it to recurringly order new items from your favorite stores ahead of time. | A smartphone app, WardrobEase, is a service for effortlessly restocking essential clothing items such as jeans, socks, and underwear. It allows you to record and specify your fabric and style preferences, you input your sizes, and it outputs pictures of choices. You can mark when your clothes are starting to wear out, and input automatic, recurring orders of new items from your favorite stores ahead of time. | A smartphone app, Shoppr, lets you create meal plans by discussing your dietary wishes with you. You can tell the system about constraints of health, time, nutrition, budget, and it responds with suggestions for meals, as well as write a meal plan with recipes and order groceries online for you. | A smartphone app, Shoppr, lets you create meal plans based on your dietary wishes. You can input constraints of health, time, nutrition, budget into the system, and it produces suggestions for meals, as well as generates a meal plan with recipes and an option to put in an online order for groceries. |
| Cat. | Anthropomorphized | De-anthropomorphized | Anthropomorphized | De-anthropomorpized |
|
Properties of a cognizer |
A machine learning-based app, Lingua, is an intelligent language learning tutor. It understands both speech and text and it will produce answers to you in real time. Lingua identifies the accuracy and complexity of your speech, and it recognizes areas of potential improvement in your spoken language. | A machine conditioning-based app, Lingua, is an automated language learning tutor. It processes both speech and text and it will produce answers to you in real time. Lingua encodes the accuracy and complexity of your speech, and it classifies areas of potential improvement in your spoken language. | MentorMe is an intelligent online chatbot, with extensive knowledge about specific academic topics (each based on different data sets). It understands topic-specific questions, and imagines new ways to approach a problem, rather than just answering questions directly. It also comes up with questions to enhance your learning about a given topic. | MentorMe is an automated online chatbot, with extensive data about specific academic topics (each based on different data sets). It processes topic-specific questions, and generates text suggesting new ways to approach a problem, rather than just answering questions directly. It also produces questions to enhance your learning about a given topic. |
| Properties of a cognizer | A phone app, WardrobEase, is an artificial intelligence-based service for effortlessly restocking essential clothing items such as jeans, socks, and underwear. It will learn your sizes and fabric preferences, and suggest pictures of style choices. It predicts when clothes are likely to wear out, and can be instructed to remember to order new items from your favorite stores ahead of time. | A phone app, WardrobEase, is an automatic pattern matching service for effortlessly restocking essential clothing items such as jeans, socks, and underwear. It will encode your sizes and fabric preferences, and display pictures of style choices. It makes statistical calculations about when clothes are likely to wear out, and can be instructed to automatically order new items from your favorite stores ahead of time. | A smart app, Shoppr, lets you create meal plans based on your dietary wishes. It can remember constraints about health, time, nutrition, and budget, and identify ideas for meals. It can imagine monthly meal plans with recipes and recognize when to order groceries online. | A phone app, Shoppr, lets you create meal plans based on your dietary wishes. It can encode constraints about health, time, nutrition, and budget, and synthesize ideas for meals. It can produce monthly meal plans with recipes and make statistical predictions about when to order groceries online. |
|
Agency |
A smartphone app, re-Commender, collects data about your dining experiences. It analyzes your preferences from historical data, and uses trends from all of its users to choose new restaurants you might enjoy. It stores your previous ratings and habits, and picks offers and coupons you might like. | A smartphone app, re-Commender, is programmed to collect data about your dining experiences. You can use it to analyze your preferences from historical data, and trends from all of its users to get suggestions for new restaurants you might enjoy. You can save your previous ratings and habits, and find offers and coupons you might like. | A smartphone app, IntelliTrade is a personal stock broker, which identifies promising stocks, funds, and bonds. It collects data about your investment preferences as well as historical stock trajectories. It also analyzes current news stories, using these to select promising investment opportunities. | A smartphone app, IntelliTrade is a personal stock broker, which you can use to identify promising stocks, funds, and bonds. It is programmed to store data about your investment preferences as well as historical stock trajectories. The algorithms are also frequently run over current news stories, so you can use them to find promising investment opportunities. |
|
Agency |
MonAIMaker is an app that helps you plan your personal finances. It monitors what you are likely to spend money on by identifying trends in your bank statements as well as your email correspondences. It uses these to find ways to save money and remind you when you have bills and expenses due. | MonAIMaker is an app that you can use to plan your personal finances. It is programmed to monitor what you are likely to spend money on based on calculations of trends in your bank statements as well as your email correspondences. The data can be used to find ways to save money and to set up reminders when you have bills and expenses due. | An automatic app, Cameron, helps you organize and answer your emails. It classifies text from your incoming emails, and it suggests answers based on your writing style. It also identifies tasks and deadlines to create automated to-do-lists for you. | An automatized app, Cameron, is a system you can use to organize and answer your emails. It is programmed to classify text from your incoming emails, and you can use it to generate answers based on your writing style. You can also use it to identify tasks and deadlines to create automated to-do-lists. |
| Cat. | Anthropomorphized | De-anthropomorphized | Anthropomorphized | De-anthropomorpized |
|
Biological metaphors |
A neural networks-based truck HaulIT is made for long haul freight 24/7 without rest stops. The constantly evolving algorithms use a metabolic principle to minimize their own synaptic activity (cost) while maximizing their impact, meaning the truck uses the most efficient routes in both cities and on highways, based on neural predictions about traffic conditions and optimal battery charging points. | A weighted networks-based truck HaulIT is made for long haul freight 24/7 without rest stops. The constantly updated algorithms use an optimizing principle to minimize their own computing activity (cost) while maximizing their impact, meaning the truck uses the most efficient routes in both cities and on highways, based on weighted node-predictions about traffic conditions and optimal battery charging points. | A driverless sleeper bus, Commuter, is programmed with neural networks to transport people from their home to a long-distance destination overnight. The bus is equipped with swarm intelligence to avoid other vehicles and on the road, and the neural network adjusts to weather conditions to navigate safely. Its artificial synapses are constantly fed live traffic data for calculations of the best and safest routes. | A driverless sleeper bus, Commuter, is programmed with weighted networks to transport people from their home to a long-distance destination overnight. The bus is equipped with optimization algorithms to avoid other vehicles and on the road, and the weighted network adjusts to weather conditions to navigate safely. Its network nodes are constantly input live traffic data for calculations of the best and safest routes. |
|
Biological metaphors |
A neural network-powered drone, AquaSentinel AI-MAR, is programmed to passively monitor enemy seas. Equipped with advanced digital senses, it is watching and listening over waterways. Its neural network has been designed to detect and provide analyses of potential threats in real-time. | A weighted network-powered drone, AquaSentinel AI-MAR, is programmed to passively monitor enemy seas. Equipped with advanced digital sensors, it is recording video and sound over waterways. Its weighted network has been designed to detect and provide analyses of potential threats in real-time. | The newest unmanned aircraft systems (UAS), AI Scan Guards, use neural networks to passively watch a physical territory from the air. Their neural networks are specifically trained on image recognition tasks with live video streams, meaning they see and hear activity instantly. | The newest unmanned aircraft systems (UAS), AI Scan Guards, use weighted networks to passively record video of a physical territory from the air. Their weighted networks are specifically trained on image recognition tasks with live video streams, meaning the predictions identify image and sound activity instantly. |
|
Properties of a communicator |
A conversational software system for court juries, Judy, can be used by jury members to discuss active court cases. Judy is based on thousands of transcripts and outcomes from previous similar trials and can tell the jury about complex law and precedence. The jury can ask Judy to process any kind of data and to suggest further avenues of research. All use of Judy is disclosed openly in court. | A generative software system for court juries, Judy, can be used by jury members to gather information about active court cases. Judy is based on thousands of transcripts and outcomes from previous similar trials and can produce text for the jury about complex law and precedence. The jury can input any kind of data into Judy to process and produce output candidate matches for further avenues of research. All use of Judy is disclosed openly in court. | A generative AI application, JurisDecide can be used by lawyers during trials to speak to and debate their own decision-making processes. JurisDecide is both a source of information and a chatbot: it rapidly processes extensive legal data, including precedent and case law, and can both ask questions of and answer questions from legal professionals. | A generative AI application, JurisDecide can be used by lawyers during trials to input speech and think out loud about their own decision-making processes. JurisDecide is both a source of information and a generative text software: it rapidly processes extensive legal data, including precedent and case law, and can both produce text in the form of questions and answers for legal professionals. |
|
Properties of a communicator |
MindHealth is an online digital conversation partner, which you can talk to via your own computer. It classifies indicators in spoken language and can tell you if you may be developing one or more early signs of dementia. Its complex algorithms have been fine-tuned based on thousands of conversations with healthy humans and dementia patients, and you can ask it questions about its assessment and have it suggest further routes of investigation. | MindHealth is an online digital recorder, which you can input speech to via your own computer. It classifies indicators in spoken language and can output a statistical prediction about whether you may be developing one or more early signs of dementia. Its complex algorithms have been fine-tuned based on thousands of conversations with healthy humans and dementia patients, and you can input questions about its assessment and have it output text about further routes of investigation. | DermAI Scan uses AI to respond to an uploaded picture with suggestions for potential dermatological conditions. Fine-tuned algorithms instantly compare your picture to images of millions of previous diagnoses and tell you the likelihood of different ones. It can discuss different possible diagnoses with you if you tell it more about the history of your condition. | DermAI Scan uses AI to generate statistical predictions about potential dermatological conditions based on an uploaded picture. Fine-tuned algorithms instantly compare your picture to images of millions of previous diagnoses and output the likelihood of different ones. It can generate text about different possible diagnoses if you input more about the history of your condition. |
Appendix C Thematic analysis
A thematic analysis (Clarke et al., 2015) of the open ended text responses was conducted in the software Condens. All authors went over at least 100 responses and added tags (codes) and notes before a shared discussion about what appeared salient for respondents. All survey responses were read several times while initial codes were generated. The goal of the thematic analysis was to identify patterns that reflect the data for this context (Nowell et al., 2017), meaning the goal was to create themes and codes covering all the different responses. The result of the coding was a list of more than 100 different codes at very different levels of abstraction (similarly to the responses, which were also at different level of detail and abstraction). After this, the first author analyzed the remaining responses with codes based on the shared discussions.
The analysis was an open-ended, inductive treatment, and was focused on “identifying and interpreting key, but not necessarily all, features of the data, guided by the research question” (Clarke et al., 2015). In practice, each response was read with the overall question in mind: which reason does the respondent provide for being willing to trust or not willing to trust the system? The codes can therefore be seen as ‘answers’ to the research question, such as ‘accuracy’, ‘reliability’, or ‘risk of bias’. The 30 most prevalent tags are shown in Table 8. For an in-depth analysis of the qualitative responses, see (Inie, 2024).
| perceived usefulness |
| personal relevance |
| aversion for other choice |
| random choice |
| data quality |
| expand knowledge/provide guidance |
| higher accuracy |
| AI well suited for the task |
| utilitarianism |
| volatility of data foundation |
| no reason |
| privacy/surveillance |
| specific product property |
| impact in case of failure |
| data type |
| curiosity/interest/fun/excitement |
| linguistics |
| human favoritism |
| risky, unspecified |
| larger target market |
| lower stakes |
| reliability |
| augmented humanabilities |
| individualized/adaptive |
| AI is unfit for wicked problems |
| conceptual simplicity |
| just summarizes description |
| efficiency |
| monetary value |
Appendix D Results
For all tables, statistically significant -values are indicated in bold and with an -symbol.
D.1. Results per anthropomorphized category
| Study 1 — Categories of anthropomorphization | ||||||||||||
| Category | Personal trust | General trust | ||||||||||
| Total | Ant. | De-ant. | % pref. ant. | Total | Ant. | De-ant. | % pref. ant. | |||||
| Cognizer | 642 | 363 | 279 | 56.5 | 10.99 | ¡.001 | 642 | 353 | 289 | 55.0 | 6.38 | .012 |
| Agency | 628 | 297 | 331 | 47.3 | 1.84 | .17 | 628 | 315 | 313 | 50.2 | 0.01 | 0.94 |
| Bio. metaphors | 633 | 301 | 332 | 47.6 | 1.61 | .20 | 633 | 301 | 332 | 47.6 | 0.23 | .63 |
| Communication | 641 | 331 | 310 | 51.6 | 0.624 | .43 | 641 | 326 | 315 | 50.9 | 0.19 | .66 |
| Personal trust: = 14.41; = 2544; = .002 | ||||||||||||
| General trust: 7.26; = 2493; = .064 | ||||||||||||
| Study 2 — Categories of anthropomorphization | ||||||||||||
| Category | Personal trust | General trust | ||||||||||
| Total | Ant. | De-ant. | % pref. ant. | Total | Ant. | De-ant. | % pref. ant. | |||||
| Cognizer | 610 | 304 | 306 | 49.8 | 0.01 | .94 | 607 | 309 | 298 | 50.9 | 0.20 | .66 |
| Agency | 611 | 336 | 275 | 55.0 | 5.89 | .015 | 609 | 304 | 305 | 49.9 | 0.00 | .97 |
| Bio. metaphors | 610 | 300 | 310 | 49.2 | 0.16 | .69 | 604 | 307 | 297 | 50.8 | 0.17 | .68 |
| Communication | 610 | 312 | 298 | 51.1 | 0.32 | .57 | 604 | 314 | 290 | 52.0 | 0.95 | .33 |
| Personal trust: = 4.96; = 2441; = .17 | ||||||||||||
| General trust: = 0.52; = 2424; = .91 | ||||||||||||
| Aggregate results — Categories of anthropomorphization | ||||||||||||
| Category | Personal trust | General trust | ||||||||||
| Total | Ant. | De-ant. | % pref. ant. | Total | Ant. | De-ant. | % pref. ant. | |||||
| Cognizer | 1252 | 667 | 585 | 52.3 | 5.37 | .020 | 1249 | 662 | 587 | 53.0 | 4.50 | .034 |
| Agency | 1239 | 633 | 606 | 51.1 | 0.59 | .44 | 1237 | 619 | 618 | 50.0 | 0.00 | .98 |
| Bio. metaphors | 1243 | 601 | 642 | 48.4 | 1.35 | .24 | 1237 | 608 | 629 | 49.2 | 0.36 | .55 |
| Communication | 1251 | 643 | 608 | 51.4 | 0.98 | .32 | 1245 | 640 | 605 | 51.4 | 0.98 | .32 |
| Personal trust: = 4.96; = 4985; = .17 | ||||||||||||
| General trust: = 0.52; = 4968; = .91 | ||||||||||||
D.2. Results per demographic group, gender
| Study 1 — Gender | ||||||||||||
| Gender | Personal trust | General trust | ||||||||||
| Total | Ant. | De-ant. | % pref. ant. | Total | Ant. | De-ant. | % pref. ant. | |||||
| Female | 1208 | 592 | 616 | 49.0 | 0.48 | .48 | 1208 | 589 | 616 | 48.8 | 0.60 | .44 |
| Male | 1264 | 670 | 594 | 53.0 | 4.57 | .033 | 1264 | 672 | 594 | 53.2 | 4.81 | .028 |
| Non-binary | 33 | 16 | 17 | 48.5 | 0.03 | .86 | 33 | 16 | 17 | 48.5 | 0.03 | .86 |
| Personal trust: = 4.04; = 2505; = .13 | ||||||||||||
| General trust: = 4.44; = 2505; = .11 | ||||||||||||
| Study 2 — Gender | ||||||||||||
| Gender | Personal trust | General trust | ||||||||||
| Total | Ant. | De-ant. | % pref. ant. | Total | Ant. | De-ant. | % pref. ant. | |||||
| Female | 1200 | 630 | 570 | 52.5 | 3.00 | .08 | 1200 | 609 | 591 | 50.8 | 0.27 | .60 |
| Male | 1216 | 621 | 595 | 51.1 | 0.56 | .46 | 1192 | 604 | 588 | 50.7 | 0.21 | .64 |
| Non-binary | 0 | 0 | 0 | 0 | 0 | 0 | 8 | 4 | 4 | 50.0 | ||
| Personal trust: = 0.49; = 2416; = .48 | ||||||||||||
| General trust: = .12; = 2400; = .94 | ||||||||||||
| Aggregate results — Gender | ||||||||||||
| Gender | Personal trust | General trust | ||||||||||
| Total | Ant. | De-ant. | % pref. ant. | Total | Ant. | De-ant. | % pref. ant. | |||||
| Female | 2408 | 1222 | 1186 | 50.7 | 0.54 | .46 | 2408 | 1198 | 1210 | 49.8 | 0.06 | .81 |
| Male | 2480 | 1291 | 1189 | 52.1 | 4.20 | .041 | 2456 | 1276 | 1180 | 52.0 | 3.75 | .053 |
| Non-binary | 33 | 16 | 17 | 48.5 | 0.03 | .86 | 41 | 20 | 21 | 48.8 | 0.02 | .88 |
| Personal trust: = 1.00; = 4921; = .61 | ||||||||||||
| General trust: = 2.43; = 4905; = .30 | ||||||||||||
D.3. Results per demographic group, age
| Study 1 — Age | ||||||||||||
| Age | Personal trust | General trust | ||||||||||
| Total | Ant. | De-ant. | % pref. ant. | Total | Ant. | De-ant. | % pref. ant. | |||||
| 18-20 | 56 | 27 | 29 | 48.1 | 0.07 | .78 | 56 | 25 | 31 | 44.6 | 0.64 | .42 |
| 21-25 | 584 | 290 | 294 | 49.7 | 0.03 | .87 | 584 | 305 | 279 | 52.2 | 1.16 | .28 |
| 26-30 | 464 | 224 | 240 | 48.3 | 0.55 | .47 | 464 | 227 | 237 | 48.9 | 0.22 | .64 |
| 31-35 | 384 | 212 | 172 | 55.2 | 4.17 | .043 | 384 | 212 | 172 | 55.2 | 4.17 | .041 |
| 36-40 | 232 | 119 | 113 | 51.4 | 0.16 | .67 | 232 | 117 | 115 | 50.4 | 0.02 | .90 |
| 41-45 | 336 | 169 | 167 | 50.3 | 0.01 | .92 | 336 | 165 | 171 | 49.1 | 0.11 | .74 |
| 46-50 | 192 | 94 | 98 | 48.9 | 0.08 | .76 | 192 | 93 | 99 | 48.4 | 0.19 | .66 |
| 51-55 | 112 | 57 | 55 | 51.2 | 0.04 | .81 | 112 | 56 | 56 | 50.0 | 0.00 | 1.00 |
| 56-60 | 64 | 35 | 30 | 54.8 | 0.38 | .52 | 64 | 28 | 36 | 43.8 | 1.00 | .31 |
| 61-65 | 32 | 23 | 9 | 71.9 | 7.26 | .013 | 32 | 21 | 11 | 65.6 | 3.13 | .077 |
| 66+ | 56 | 34 | 22 | 60.7 | 2.57 | .11 | 56 | 30 | 26 | 53.6 | 0.29 | .59 |
| Personal trust: = 12.99; = 2512; = .22 | ||||||||||||
| General trust: = 10.07; = 2512; = .43 | ||||||||||||
| Study 2 — Age | ||||||||||||
| Age | Personal trust | General trust | ||||||||||
| Total | Ant | De-ant | % pref. ant | Total | Ant | De-ant | % pref. ant | |||||
| 18-20 | 48 | 20 | 28 | 41.7 | 1.33 | .25 | 24 | 13 | 11 | 54.2 | 0.17 | .68 |
| 21-25 | 384 | 201 | 183 | 52.3 | 0.84 | .36 | 336 | 172 | 164 | 51.2 | 0.19 | .66 |
| 26-30 | 512 | 274 | 238 | 53.5 | 2.53 | .11 | 416 | 199 | 217 | 47.8 | 0.78 | .38 |
| 31-35 | 328 | 163 | 165 | 49.7 | 0.01 | .91 | 416 | 216 | 200 | 51.9 | 0.62 | .43 |
| 36-40 | 288 | 161 | 127 | 55.9 | 4.01 | .045 | 248 | 138 | 110 | 55.6 | 3.16 | .075 |
| 41-45 | 152 | 71 | 81 | 46.7 | 0.66 | .42 | 104 | 46 | 58 | 44.2 | 1.38 | .24 |
| 46-50 | 224 | 121 | 103 | 54.0 | 1.45 | .23 | 272 | 131 | 141 | 48.2 | 0.37 | .54 |
| 51-55 | 152 | 74 | 78 | 48.7 | 0.11 | .75 | 232 | 112 | 120 | 48.3 | 0.28 | .60 |
| 56-60 | 152 | 73 | 79 | 48.0 | 0.24 | .63 | 128 | 70 | 58 | 54.7 | 1.13 | .29 |
| 61-65 | 88 | 58 | 30 | 65.9 | 8.91 | .003 | 88 | 52 | 36 | 59.1 | 2.91 | .08 |
| 66+ | 104 | 42 | 62 | 40.4 | 3.85 | .050 | 136 | 68 | 68 | 50.0 | 0.00 | 1.00 |
| Personal trust: = 21.06; = 2432; = .021 | ||||||||||||
| General trust: = 10.49; = 2400; = 0.40 | ||||||||||||
| Aggregate results — Age | ||||||||||||
| Age | Personal trust | General trust | ||||||||||
| Total | Ant | De-ant | % pref. ant | Total | Ant | De-ant | % pref. ant. | |||||
| 18-20 | 104 | 47 | 57 | 45.1 | 0.96 | .33 | 80 | 38 | 42 | 47.5 | 0.11 | .74 |
| 21-25 | 968 | 491 | 477 | 50.7 | 0.20 | .65 | 920 | 477 | 443 | 51.8 | 1.41 | .23 |
| 26-30 | 976 | 498 | 478 | 51.0 | 0.41 | .52 | 880 | 426 | 454 | 48.4 | 0.89 | .34 |
| 31-35 | 712 | 375 | 337 | 52.6 | 2.03 | .15 | 800 | 428 | 372 | 53.5 | 3.92 | .048 |
| 36-40 | 520 | 280 | 240 | 53.9 | 3.08 | .08 | 480 | 255 | 225 | 53.1 | 1.88 | .17 |
| 41-45 | 488 | 240 | 248 | 49.2 | .013 | .71 | 440 | 211 | 229 | 48.0 | 0.74 | .39 |
| 46-50 | 416 | 215 | 201 | 51.7 | 0.47 | .49 | 464 | 224 | 240 | 48.3 | 0.55 | .46 |
| 51-55 | 264 | 131 | 133 | 49.7 | 0.02 | .90 | 344 | 168 | 176 | 48.8 | 0.19 | .66 |
| 56-60 | 216 | 108 | 108 | 50.0 | 0.00 | 1.0 | 192 | 98 | 94 | 51.0 | 0.08 | .77 |
| 61-65 | 120 | 81 | 39 | 67.5 | 14.70 | ¡.001 | 120 | 73 | 47 | 60.8 | 5.63 | .018 |
| 66+ | 160 | 76 | 84 | 47.5 | 0.40 | .53 | 192 | 98 | 94 | 51.0 | 0.08 | .77 |
| Personal trust: 18.45; = 4944; = .048 | ||||||||||||
| General trust: = 14.51; = 4912; = .20 | ||||||||||||
D.4. Results per demographic group, socio-economic status
| Study 1 — Socio-economic status | ||||||||||||
| Status | Personal trust | General trust | ||||||||||
| Total | Ant. | De-ant. | % pref. ant. | Total | Ant. | De-ant. | % pref. ant. | |||||
| Low | 93 | 48 | 45 | 51.6 | 0.10 | .76 | 93 | 51 | 42 | 54.8 | 0.87 | .35 |
| Between low/average | 408 | 195 | 213 | 47.8 | 0.79 | .37 | 408 | 199 | 209 | 48.8 | 0.25 | .62 |
| Average | 1216 | 629 | 587 | 51.7 | 1.45 | .23 | 1216 | 624 | 592 | 51.3 | 0.84 | .36 |
| Between average/high | 728 | 337 | 391 | 46.3 | 4.01 | .045 | 728 | 379 | 349 | 52.1 | 1.24 | .27 |
| High | 48 | 23 | 25 | 47.9 | 0.08 | 0.773 | 48 | 20 | 28 | 41.7 | 1.33 | .25 |
| Personal trust: = 6.09; = 2493; = .19 | ||||||||||||
| General trust: = 3.40; = 2493; = .49 | ||||||||||||
| Study 2 — Socio-economic status | ||||||||||||
| Status | Personal trust | General trust | ||||||||||
| Total | Ant. | De-ant. | % pref. ant. | Total | Ant. | De-ant. | % pref. ant. | |||||
| Low | 16 | 11 | 5 | 68.8 | 2.25 | .13 | 32 | 16 | 16 | 50.0 | 0.00 | 1.00 |
| Between low/average | 256 | 131 | 125 | 51.2 | 0.14 | .71 | 296 | 139 | 157 | 47.0 | 1.09 | .29 |
| Average | 1264 | 648 | 616 | 51.3 | 0.81 | .37 | 1152 | 612 | 540 | 53.1 | 4.50 | .034 |
| Between average/high | 848 | 445 | 403 | 52.5 | 2.08 | .15 | 832 | 407 | 425 | 48.9 | 0.39 | .53 |
| High | 40 | 20 | 20 | 50.0 | 0.00 | 1.00 | 80 | 36 | 44 | 45.0 | 0.80 | .37 |
| Personal trust: = 2.23; = 2424; = .69 | ||||||||||||
| General trust: = 6.46; = 2392; = .17 | ||||||||||||
| Aggregate results — Socio-economic status | ||||||||||||
| Status | Personal trust | General trust | ||||||||||
| Total | Ant. | De-ant. | % pref. ant. | Total | Ant. | De-ant. | % pref. ant. | |||||
| Low | 109 | 59 | 50 | 54.1 | 0.74 | .39 | 125 | 67 | 58 | 53.6 | 0.65 | .42 |
| Between low/average | 664 | 326 | 338 | 49.1 | 0.22 | .64 | 704 | 338 | 366 | 48.0 | 1.11 | .29 |
| Average | 2480 | 1277 | 1203 | 51.5 | 2.21 | .14 | 2368 | 1236 | 1132 | 52.2 | 4.57 | .034 |
| Between average/high | 1576 | 782 | 794 | 49.6 | 0.09 | .76 | 1560 | 786 | 774 | 50.4 | 0.09 | .76 |
| High | 88 | 43 | 45 | 48.9 | 0.05 | .83 | 128 | 56 | 72 | 43.8 | 2.00 | .16 |
| Personal trust: = 2.64; = 4917; = .62 | ||||||||||||
| General trust: = 7.08; = 4885; = .13 | ||||||||||||
D.5. Results per demographic group, education
| Study 1 — Educational level | ||||||||||||
| Level | Personal trust | General trust | ||||||||||
| Total | Ant. | De-ant. | % pref. ant. | Total | Ant. | De-ant. | % pref. ant. | |||||
| High school | 584 | 285 | 299 | 48.8 | 0.34 | .56 | 584 | 286 | 298 | 49.0 | 0.25 | .62 |
| Bachelor’s | 1120 | 564 | 556 | 50.4 | 0.06 | .81 | 1120 | 573 | 547 | 51.2 | 0.60 | .44 |
| Master’s | 616 | 337 | 279 | 54.7 | 5.46 | .019 | 616 | 324 | 292 | 52.6 | 1.66 | .20 |
| PhD | 144 | 74 | 70 | 51.4 | 0.11 | .74 | 144 | 77 | 67 | 53.5 | 0.69 | .40 |
| None/No answer | 49 | 19 | 30 | 38.8 | 2.47 | .12 | 49 | 19 | 30 | 38.8 | 2.47 | .12 |
| Personal trust: 7.63; = 2432; = .11 | ||||||||||||
| General trust: = 4.87; = 2400; = .30 | ||||||||||||
| Study 2 — Educational level | ||||||||||||
| Level | Personal trust | General trust | ||||||||||
| Total | Ant. | De-ant. | % pref. ant. | Total | Ant. | De-ant. | % pref. ant. | |||||
| High school | 504 | 247 | 257 | 49.0 | 0.20 | .66 | 504 | 252 | 252 | 50.0 | 0.00 | 1.00 |
| Bachelor’s | 1104 | 579 | 525 | 52.4 | 2.64 | .10 | 960 | 503 | 457 | 52.4 | 2.20 | .14 |
| Master’s Degree | 744 | 398 | 346 | 53.5 | 3.63 | .057 | 456 | 227 | 229 | 49.8 | 0.01 | .92 |
| PhD | 72 | 32 | 40 | 44.4 | 0.89 | .35 | 432 | 211 | 221 | 48.8 | 0.23 | .63 |
| None/No answer | 8 | 2 | 6 | 25.0 | 48 | 24 | 24 | 50.0 | 0.00 | 1.00 | ||
| Personal trust: = 4.17; = 2432; = .24 | ||||||||||||
| General trust: = 1.96; = 2400; = .74 | ||||||||||||
| Aggregate results — Educational level | ||||||||||||
| Level | Personal trust | General trust | ||||||||||
| Total | Ant. | De-ant. | % pref. ant. | Total | Ant. | De-ant. | % pref. ant. | |||||
| High school | 1088 | 532 | 556 | 48.9 | 0.53 | .47 | 1088 | 538 | 550 | 49.4 | 0.13 | .72 |
| Bachelor’s | 2224 | 1173 | 1081 | 51.4 | 3.76 | .053 | 2080 | 1076 | 1007 | 51.7 | 2.29 | .13 |
| Master’s | 1360 | 735 | 625 | 54.0 | 8.90 | .003 | 1072 | 551 | 521 | 51.4 | .084 | .36 |
| PhD | 216 | 106 | 110 | 49.1 | 0.07 | .78 | 576 | 288 | 288 | 50.0 | 0.00 | 1.00 |
| None/No answer | 8 | 2 | 6 | 25.0 | N/A1 | .29 | 48 | 24 | 24 | 50.0 | 0.00 | 1.00 |
| Personal trust: = 6.99; = 4888; = .07, not significant at | ||||||||||||
| General trust: = 1.78; = 4816; = .62, not significant at | ||||||||||||
D.6. Results per demographic group, self-estimated computer knowledge
| Study 1 — Computer knowledge | ||||||||||||
| Knowledge | Personal trust | General trust | ||||||||||
| Total | Ant. | De-ant. | % pref. ant. | Total | Ant. | De-ant. | % pref. ant. | |||||
| Lower than av. | 40 | 22 | 18 | 55.0 | 0.40 | .53 | 40 | 21 | 19 | 52.5 | 0.10 | .75 |
| Average | 952 | 486 | 466 | 51.1 | 0.42 | .52 | 952 | 483 | 469 | 50.7 | 0.21 | .65 |
| Higher than av. | 1256 | 646 | 610 | 51.4 | 1.03 | .31 | 1256 | 646 | 610 | 51.4 | 1.03 | .31 |
| High (can code) | 256 | 122 | 134 | 47.7 | 0.56 | .45 | 256 | 127 | 129 | 49.6 | 0.02 | .90 |
| Personal trust: = 1.4949; = 2504; = .68 | ||||||||||||
| General trust: = 0.35; = 2504; = .95 | ||||||||||||
| Study 2 — Computer knowledge | ||||||||||||
| Knowledge Level | Personal trust | General trust | ||||||||||
| Total | Ant. | De-ant. | % pref. ant. | Total | Ant. | De-ant. | % pref. ant. | |||||
| Lower than av. | 64 | 30 | 34 | 46.9 | 0.25 | .62 | 80 | 40 | 40 | 50.0 | 0.00 | 1.00 |
| Average | 952 | 502 | 450 | 52.7 | 2.84 | .09 | 792 | 396 | 396 | 50.0 | 0.00 | 1.00 |
| Higher than av. | 1144 | 591 | 553 | 51.7 | 1.26 | .26 | 1232 | 632 | 600 | 51.3 | 0.83 | .36 |
| High (can code) | 264 | 129 | 135 | 48.9 | 0.14 | .71 | 288 | 143 | 145 | 49.7 | 0.01 | .91 |
| Personal trust: = 1.85; = 2432; = .60 | ||||||||||||
| General trust: = 0.47; = 2400; = .93 | ||||||||||||
| Aggregate results — Computer knowledge | ||||||||||||
| Knowledge Level | Personal trust | General trust | ||||||||||
| Total | Ant. | De-ant. | % pref. ant. | Total | Ant. | De-ant. | % pref. ant. | |||||
| Lower than av. | 104 | 52 | 52 | 50.0 | 0.00 | 1.00 | 120 | 61 | 59 | 50.8 | 0.03 | .85 |
| Average | 1904 | 988 | 916 | 51.9 | 2.72 | .09 | 1744 | 879 | 865 | 50.4 | 0.11 | .74 |
| Higher than av. | 2400 | 1237 | 1163 | 51.5 | 2.28 | .13 | 2488 | 1278 | 1210 | 51.4 | 1.86 | .17 |
| High (can code) | 520 | 250 | 269 | 48.3 | 0.70 | .40 | 544 | 270 | 274 | 49.6 | 0.03 | .86 |
| Personal trust: = 2.30; = 4928; = .51 | ||||||||||||
| General trust: = 4.72; = 4896; = .32 | ||||||||||||
Appendix E Demographics
E.1. Study 1
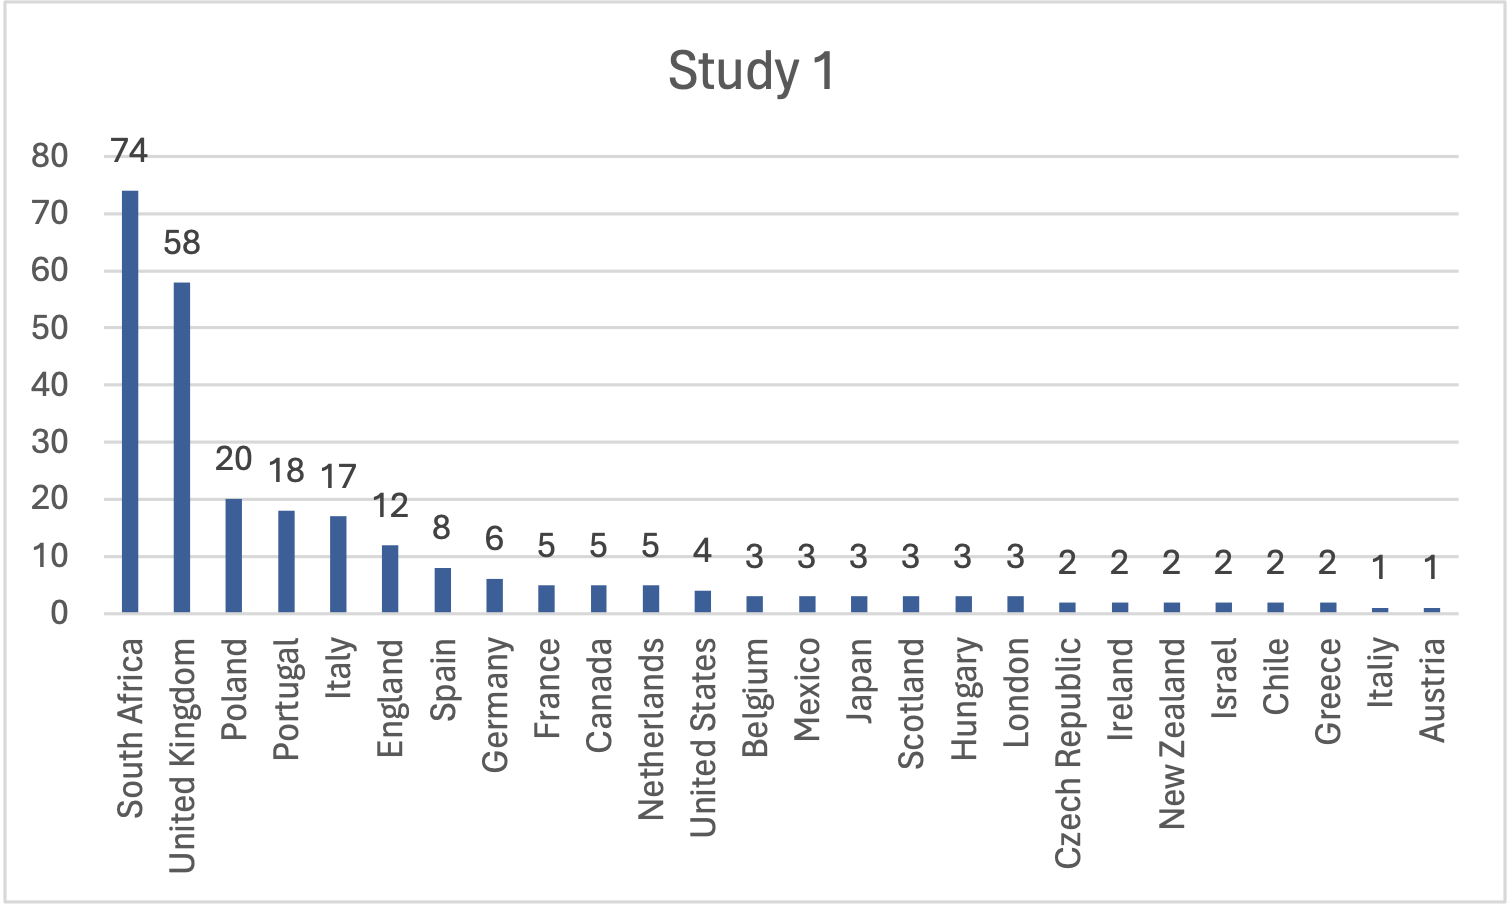
|
||||||||||||||||||||||||||||||||||||||||||||||||||||||||||||||||||||||||||||||||||||
|
|
|
E.2. Study 2
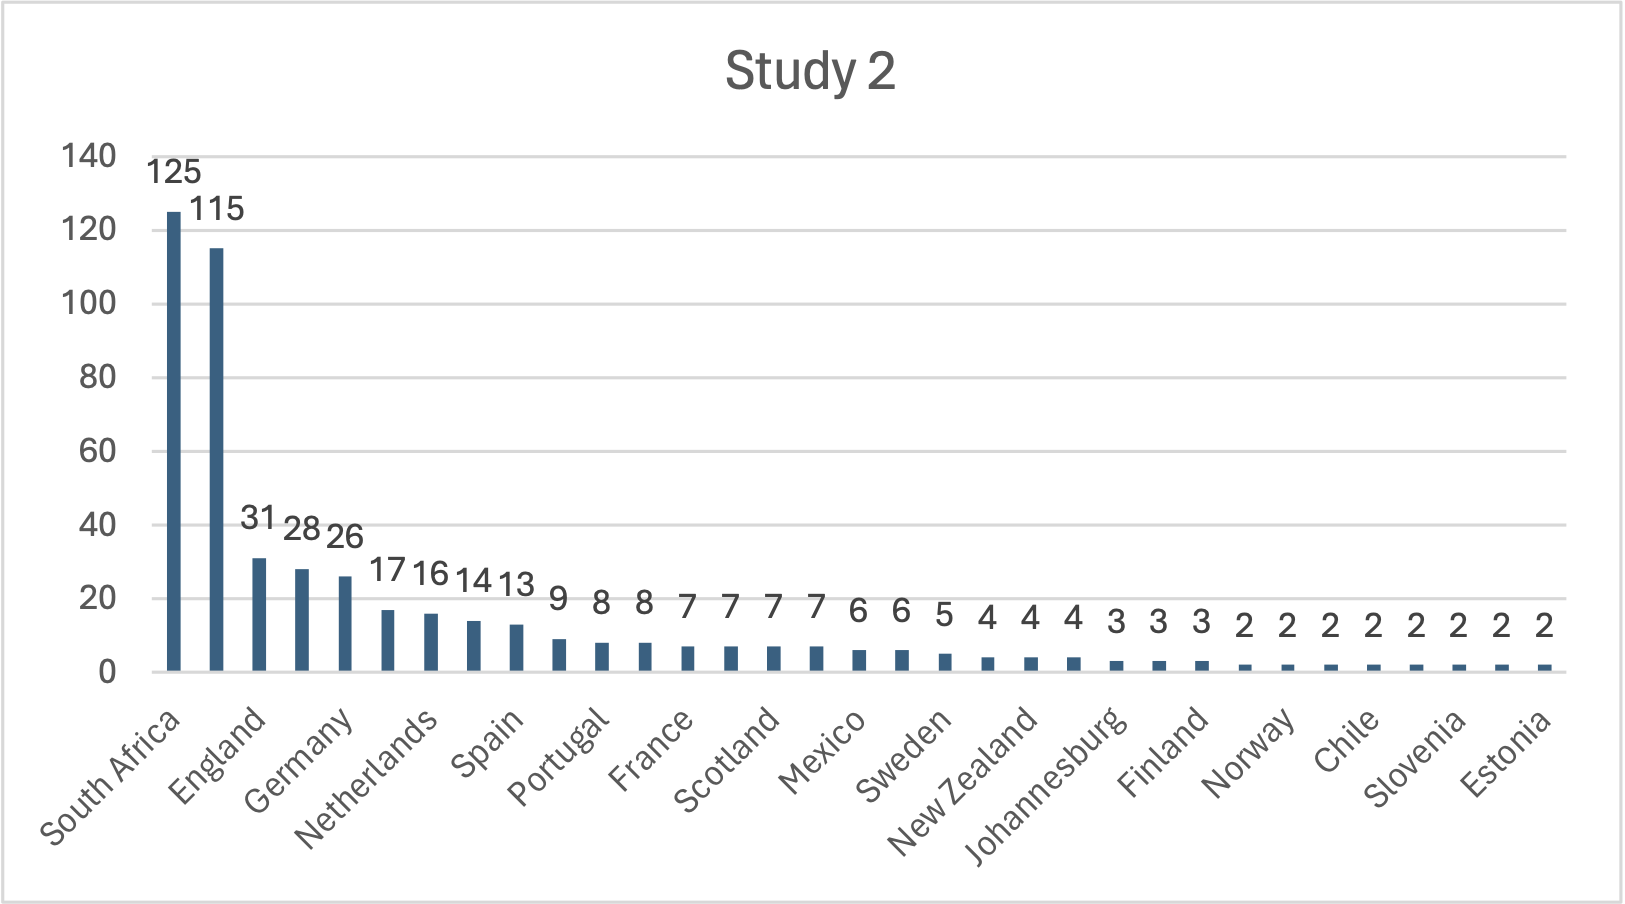
|
||||||||||||||||||||||||||||||||||||||||||||||||||||||||||||||||||||||||||||||||||||
|
|
|