Quasi-equilibrium chemical evolution in starless cores
Abstract
The chemistry of H2O, CO and other small molecular species in an isolated pre-stellar core, L1544, has been assessed in the context of a comprehensive gas-grain chemical model, coupled to an empirically constrained physical/dynamical model. Our main findings are (i) that the chemical network remains in near equilibrium as the core evolves towards star formation and the molecular abundances change in response to the evolving physical conditions. The gas-phase abundances at any time can be calculated accurately with equilibrium chemistry, and the concept of chemical clocks is meaningless in molecular clouds with similar conditions and dynamical time scales, and (ii) A comparison of the results of complex and simple chemical networks indicates that the abundances of the dominant oxygen and carbon species, H2O, CO, C, and C+ are reasonably approximated by simple networks. In chemical equilibrium, the time-dependent differential terms vanish and a simple network reduces to a few algebraic equations. This allows rapid calculation of the abundances most responsible for spectral line radiative cooling in molecular clouds with long dynamical time scales. The dust ice mantles are highly structured and the ice layers retain a memory of the gas-phase abundances at the time of their deposition. A complex (gas-phase and gas-grain) chemical structure therefore exists, with cosmic-ray induced processes dominating in the inner regions. The inferred H2O abundance profiles for L1544 require that the outer parts of the core and also any medium exterior to the core are essentially transparent to the interstellar radiation field.
keywords:
astrochemistry – molecular processes – ISM: clouds – ISM: molecules – stars:formation – stars:protostars1 Introduction
In this paper, we seek to improve our modelling and understanding of the chemistry of quiescent molecular gas with our astrochemistry code, STARCHEM (Rawlings & Williams, 2021; Rawlings, 2022, and described more fully in Appendix B). The STARCHEM code is designed to integrate chemical evolution along Lagrangian streamlines of fluid flow. In this paper, we apply STARCHEM in conjunction with a previously developed dynamical model for the gravitationally contracting molecular cloud L1544 (Keto & Caselli, 2010; Keto, Caselli & Rawlings, 2015, hereafter KC10 and KCR15, respectively). Our goals in this study are twofold.
Firstly, we test the hypothesis that the chemical evolution can be treated as being in quasi-equilibrium, so that the gas-phase abundance distributions are simply determined by the instantaneous physical conditions. As part of this analysis, we pay particular attention to the chemical stratification within the dust grain ice mantles, and so differentiate between the gas-phase chemistry and that of the ices, which record the chemical evolution of the core.
Secondly, we assess the accuracy and applicability of a radically simplified chemical model developed in a series of earlier papers; KC10 and Keto & Caselli (2008); Keto, Rawlings & Caselli (2014) (hereafter KC08 and KRC14, respectively). This model is one of several proposals in the literature for reduced chemical networks that are also useful in rapid computation of molecular gas temperatures (Nelson & Langer, 1997; Glover & Clark, 2012). They directly compute the abundances of the important coolants such as CO, C+, C and O. Abundances of other molecular species can be estimated from those calculated to develop a general cooling function (Goldsmith, 2001; Keto & Field, 2005). Because of their computational speed, these reduced chemical networks are useful in numerical, hydrodynamic simulations of the ISM which are already computationally intensive without the additional burden of a time-dependent complex chemistry with many reactions. An earlier version of our reduced chemical network has been incorporated into one such code (Bate & Keto, 2015).
We choose L1544 as an example because we have an observationally verified model for the dynamics of this cloud that provides specific combinations of gas and dust temperatures, gas density, and UV radiation for our simulations of the astrochemistry. In addition, the different radial zones in the cloud, outer, central, and transition, provide examples where the chemistry operates in very different ways. Whilst L1544 is a particular cloud, its chemistry is representative of quiescent molecular gas in the ISM meaning gas that is not strongly disturbed by shocks, bipolar outflows, intense radiation from nearby stars, or processes in accretion disks.
In the following section we discuss the structure and dynamics of the L1544 pre-stellar core. Our dynamical/chemical model is described in section 3. In section 4 we present the results discussing (a) the chemical structure of the cloud (b) the structure of the ice mantles (c) the chemical time-dependence, and (d) the validity of reduced chemical networks. Our conclusions are summarized in section section 5. A proposed revised form of our reduced chemical network is given in Appendix A and the main results of STARCHEM applicable to starless and pre-stellar cores are described in Appendix B.
2 The physical structure and dynamics of L1544
The pre-stellar core L1544 is located in the Taurus Molecular Cloud, at a distance of 170pc (Galli et al., 2019). Infrared observations show no evidence of an embedded protostar; however, split, self-absorbed spectral line profiles of several molecules that are tracers of dense gas indicate that the central region is in the early stages of gravitational collapse toward star formation. On a larger scale, molecular line observations show patchy emission around the core suggesting that the core is isolated within the Taurus cloud with no evidence for surrounding filamentary structure or other cores overlapping along the line of sight. The overall morphology is roughly elliptical with an aspect ratio of 2:1; however contours of constant density become more spherical with increasing density suggesting that the dynamics can be understood in the context of a spherical model (e.g. Caselli et al., 2022). With these properties, L1544 has become a prototypical example of a small molecular cloud that is just beginning gravitational collapse towards the formation of a solar-mass scale star.
The chemistry within L1544 is both relatively simple and interestingly complex. The absence of a protostar implies the absence of the chemistry associated with shocks, a bipolar outflow, and an accretion disk. The chemistry is consistent with that of quiescent molecular gas. With no embedded protostar or nearby bright stars, the core is illuminated only by the external radiation field from Galactic starlight. This sets up a radial structure within the core of varied chemistry. Photochemistry dominates the outer region, but the inner core is cold (5-10K, Crapsi et al., 2007) and dark, so that the chemistry is mostly restricted to grain surfaces and the gas-grain interactions of freeze-out and desorption. L1544 is in a family of starless cores in which CO has been highly depleted (e.g. Caselli et al., 1999; Bergin & Tafalla, 2007). Indeed, recent high resolution observations have shown almost completele depletion in the central regions of the core (Caselli et al., 2022).
Along with its advantages for theoretical study, L1544 is observationally favorable. At 170 pc distant, the core is extended over arc minute scales and well matched to the angular resolution of single dish radio telescopes at millimeter and submillimeter frequencies. A number of spectral lines has been observed with varying optical depths from molecules with different critical densities for collisional de-excitation which provide information on both the inner and outer regions of the core. While the dynamics and the chemistry can be studied independently, it is not possible to understand the observations without consideration of both. The most obvious effect is that the molecular abundances and gas velocity are both functions of radius resulting in differences in the self-absorbed line profiles of different molecules. Once understood, this effect provides precise estimates of the emission and absorption regions for each molecule.
In a series of earlier papers we developed a model for the chemistry and dynamics of L1544 that has been successful in both matching and predicting the spectral line shapes of several molecules. Originally based on observations of CO and N2H+, the model was able without modification to predict the blue-shifted self-absorbed emission of H2O and match the complex pattern of the self-absorbed hyperfine lines of NH3 (KRC14, Caselli et al., 2017).
The physical model of L1544 is described in KC10, as resulting from the quasi-static contraction of a thermally supercritical 10M⊙ cloud, of radius 0.75pc that is initially configured as a Bonnor-Ebert sphere, in unstable dynamical equilibrium, with a central density of cm-3. After contraction to a central density of cm-3, the structure of the model describes the observed structure of L1544. Subsequent observations suggest minor differences (e.g. Bizzocchi et al., 2014). Chacón-Tanarro et al. (2019) proposed that the ‘flat central region’ is more extended and has a lower density (cm-3) than that of KC10 - based on 1.1mm Large Millimetre Telescope and 3.3mm Green Bank Observatory data. Based on 1.3mm ALMA data, Caselli et al. (2019) found that it is somewhat smaller, elongated, but consistent with a central density of cm-3. Observationally, the density in the center of the core cannot be determined directly, only the column density through the centre. The suggested differences are consistent with observational uncertainty.
Figure 1 shows the temperature (gas and dust), density, velocity and extinction profiles; , , , v and , at several times between 0.30Myr () and 0.61Myr () since the start of the contraction from the initial configuration. The profiles for (which are labelled and indicate the direction of time) correspond to those published as the best fits in Keto, Rawlings & Caselli (2014) (hereafter KRC14) and subsequently used in other studies. The A profiles give the, astrochemically relevant, mean direction-averaged extinction at any particular point and time within the spherical model of the core. 111Since starless cores have no internal sources of radiation, the radiation field at any point in the core is the radiation field exterior to the core diminished by the mean Av averaged over all directions to the boundary of the core. The mathematical definition of the average can be found in Appendix 1 of Zucconi, Walmsley & Galli (2001). This is not the same as the, more observationally relevant, line of sight extinction - which is what is depicted in, for example, figure 3 of KRC14.
From Figure 1 we can see that the density profiles progress towards as the central region of constant density defined by the radius where the crossing time equals the free-fall time decreases in size. For L1544, the profiles for (and, in particular, the density and velocity profiles, and the value of the central density cm-3) are empirically constrained by the observed H2O 576GHz () line profile. This density corresponds to a specific time (0.61Myr) in the dynamical evolution, as can be seen from the time-dependence of the velocity profiles. At this time the dynamical evolution of the cloud is beginning to accelerate, with infall velocities just becoming supersonic in the inner region (r0.01pc, ). It is also evident that the gas and dust temperatures are reasonably well-coupled within 0.15pc (), and are very low throughout most of the cloud. This has significant implications for the chemistry which we discuss in section 4.
Although the core evolves very slowly, the physical model nonetheless implies an important time-dependence, so that the best fit to the observations and the implied conditions representing the present status of a core are defined by a specific dynamical age. In general, there are essentially two possibilities: (i) the timescale for chemical evolution () is less than that for the dynamical evolution (), in which case quasi-equilibrium chemical evolution will hold - with the abundances responding to the changes in the instantaneous physical conditions, or (ii) , in which case the chemistry will depend on both the dynamical evolution and the initial conditions. In either case, a static chemistry is not a realistic representation.
The fastest timescale in which a Bonnor-Ebert configuration in hydrostatic equilibrium can be assembled via sub-sonic quasi-static contraction is of the order of the free-fall collapse timescale:
where is the (assumed molecular) gas density and we have assumed that He/H =0.1. Furthermore, as the core must be in near-hydrostatic equilibrium (KCR15) its age must be greater than the sound-crossing time (). Even if we only consider the inner 0.1pc then, for a core composed of molecular gas, with mean temperature 10K; Myr. Shorter timescales than these could only be obtained as a result of supra-gravitational, supersonic contraction, which would occur only if the core were out of equilibrium everywhere. As shown in KCR15 an increase of the density by % over its equilibrium values along the profile would result in global cloud collapse and a velocity structure that is incompatible with the subsonic spectral line profiles of all observed molecules other than H2O. Moreover, as can be inferred from Fig.1, if the dynamical age were only slightly larger than this, then much higher central densities, together with larger inflow velocities throughout the envelope would result.
It has taken 0.6Myr to construct the existing configuration from an initial state in dynamical equilibrium that was marginally unstable and (from the implied velocity profile) that it is now evolving on a near gravitational free-fall time-scale of Myr. Thus is a fixed parameter. Any model of the chemistry that identifies a nominal ‘chemical age’ that is independent of the physical evolution would be quite inconsistent with this, or any other realistic, dynamical model. The inapplicability of hydrodynamically static chemical evolution was also noted by (Sipilä et al., 2022) in their combined chemical-hydrodynamical study of the velocity structure in L1544.
We should also consider the physical and chemical evolution of the cloud prior to the formation of the initial Bonnor-Ebert sphere, since parts of this cloud will already have relatively high extinctions and low temperatures, implying that they must have previously evolved through a PDR interface. Moreover, in the circumstances where the chemical evolution is slow (), then a larger effective chemical age could be obtained if it is assumed that the core maintains hydrostatic equilibrium for some time before quasi-static contraction starts, so that the chemical evolution occurs at relatively low densities (with correspondingly longer chemical timescales).
3 The chemical model of starless cores
To understand the chemical structure and evolution of isolated starless cores we utilise the STARCHEM dynamical/chemical model as described in Appendix B.
When modelling the astrochemistry of pre- and proto-stellar cores, the usual approach is to study the time-dependent chemical evolution, but freezing the physical conditions at , with the inclusion of some chemical pre-evolution at constant density. As is clear from the discussion in the previous section, this is quite arbitrary and incompatible with our understanding of how the source has evolved. This has been noted in previous studies (KC10, KRC14) in the context of the time-dependences of the abundance profiles for CO and H2O in L1544, this important fact has not been considered in most subsequent modelling efforts.
Moreover, even if we make the assumption that chemical quasi-equilibrium holds (i.e. in response to the changing physical conditions), then the abundances will be determined by the equilibrium balance between the gas-phase chemistry and the chemistry in the surface layers of the ice mantles on dust grains. In conditions where significant freeze-out is occurring then the sub-surface layers of the ices - which are effectively chemically inert - will be determined by the entire evolutionary history of the cloud/core.
We go some way towards addressing these inconsistencies and assumptions by following the combined dynamical and chemical evolution between and , although we also make the simplification that the core ‘instantly assembles’ in the configuration specified at . Indeed, even if the initial configuration is taken to be a sphere of uniform density, that sphere will itself have position-dependent temperature and extinction profiles that will result in significant, and time-dependent, chemical structure. A fully self-consistent approach would involve a knowledge of the density, temperature and extinction profiles from the very earliest stages.
STARCHEM considers a full multi-point description of the time-dependent chemistry and is configured to co-integrate the chemical and physical evolution in Lagrangian streamlines of 100 grid points. These are (initially) equally spaced between 1000au () and 0.3pc () with an assumed spherical (1D) symmetry (corresponding to ). The value of is chosen so that at the end of the simulation, whilst corresponds to the physical size of the core.
The physical conditions are defined according to the hydrodynmic model of KC10 and consist of the density , inflow velocity , gas temperature , dust temperature and the mean visual extinction to the surface of the cloud . The look-up tables give data as functions of positions and time for 1000 radial points (defined in the range , corresponding to ) at 62 times (in the range years).
For times prior to years the core evolves very slowly and, we take it to be dynamically static so that we set the parameters to their boundary values, i.e. v, and . In effect, there are two dynamical phases: (i) hydrostatic equilibrium from , then (ii) quasi-static contraction from to . This is a satisfactory approach, so long as the chemical timescale is shorter than the dynamical timescale. As this is debatable, we have included the possibility of an additional dynamical ‘pause’ () at the beginning of the simulation to test the assumption.
Gas-phase reactions, freeze-out, various continuous desorption mechanisms and surface chemical reactions are all important processes in starless cores. We include a comprehensive gas-phase chemistry and full descriptions of the desorption mechanisms, coupled to a fully time and position dependent analysis of the compositional structure of the ices. Photochemistry plays an important role in the chemical evolution of starless cores, both through gas-phase photolysis and the photodesorption mechanisms, that depend on the spatial variations of the radiation field. The outer parts of the core (pc, ) are effectively in a photon dominated region (PDR), where the mutual shielding of the H2, C and CO photodissociation and photoionization continua, together with dust absorption attenuates the radiation field as it penetrates the cloud. Allowances for these various attenuation effects are included in the model. The model incorporates a simplified form of the surface chemistry, explained and justified in the appendix.
We follow the chemistry of some 81 gas-phase and 17 solid-state chemical species (of limited molecular complexity, containing no more than six atoms) composed of the elements H, He, C, N, O, S and Na (which we use as a ‘representative’ low ionization potential metal). The elemental abundances relative to hydrogen are given in Table 1 and are typical values for low mass star-forming regions (van Dishoeck et al., 2021).
The interaction between gas-phase atoms and molecules and the surface of dust grains is of crucial importance to our understanding of the chemical structure of molecular clouds and star-forming regions. Notwithstanding the discussion above concerning the physics/dynamics, this is by far the most important source of ambiguity and possible misinterpretation of the observational data. In general, we need to consider the processes of freeze-out, or depletion of a species from the gas-phase, surface chemistry, and the back-process of desorption, or sublimation, of the species from the (surface) of dust grains, back into to the gas-phase. With the exception of H2O, the desorption properties are not well defined for the dominant ice species, CO, NH3, CO2 and CH4, as well as N2, O2 and the monomers, C, N and O, from which the hydrogenated species form.
We concentrate on CO and H2O, whose abundance profiles are reasonably well-constrained. Although this could be extended to the related species CO2, which is a major ice component, an in-depth analysis is not justified due to the lack of empirical constraints for this species in L1544.
Desorption of ices by the cosmic ray heating of grains dominates the desorption in the darkest parts of the core. However, the rates are uncertain. Recent studies (e.g. Sipilä, Silsbee & Caselli, 2021; Rawlings, 2022) have shown that when realistic dust grain cooling profiles are considered the rates are typically an order of magnitude faster than those determined in previous calculations Hasegawa & Herbst (1993). The rates may be significantly larger if the effects of sporadic desorption, ice species co-desorption and/or whole mantle evaporation from small grains are included. In this study we use the revised rates for a standard interstellar dust grain size distribution (Mathis, Rumpl & Nordsieck, 1977, hereafter MRN) given in Table 3 of Rawlings (2022). KC10 found that it was necessary to use a CO desorption rate of s-1 to explain the high CO abundance that is observationally inferred for the central regions. We use a value of s-1, appropriate for CO molecules with a binding energy of 1100K, and a mean adsorbate binding energy of 1200K, (Rawlings, 2022, Table 4). This value is very close to that determined by Herbst & Cuppen (2006) in their detailed random walk Monte Carlo model of the desorption mechanism (see also Silsbee et al., 2021).
3.1 Model parameters
For our standard model we match the conditions in L1544, as the prototypical example of an isolated pre-stellar core. The values that we use for the various parameters are given in Table 1. Being marginally thermally supported with no internal energy source, the physical structure of L1544 is actually relatively simple so that these are fairly well-constrained and treated as fixed in our physical-chemical model. The values of some of the parameters (identified in Table 1) are defined by the chemical abundance profiles and we have considered the sensitivity of our results to these (see section 4.2.1).
| Carbon abundance () | |
|---|---|
| Nitrogen abundance () | |
| Oxygen abundance () | |
| Sulfur abundance () | |
| Initial radial grid extent | 1000au - 0.3 pc |
| Final radial grid extent | 100au - 0.3 pc |
| Grain albedo | 0.5 |
| Sticking coefficient () | 1.0 (all species) |
| Interstellar radiation field photon flux () | 1.0 photons cm-2 s-1 |
| Cosmic ray induced photon flux () | 4875.0 photons cm-2 s-1 |
| Binding site surface density () | 1.0 cm-2 |
| Mean ice monolayer thickness () | 3.7Å |
| Hydrodynamic pause duration () | 0 years |
| ISRF/Draine () | 1.0 |
| External extinction () | 0.0 magnitudes |
| Cosmic ray ionization rate for H2 () | 1.3 s-1 |
| Dust surface area per H nucleon () | 6.0 cm2 |
| RMS grain radius () | 0.01m |
| Photodesorption yield () | 1.0 (see text) |
| Yield for H2-formation driven desorption () | 0.0 |
| Fraction of sticking O/O+/OH that reacts on grain surfaces () | 1.0 |
| Fraction of surface-formed OH that chemically desorbs () | 0.25-0.5 (see text) |
| Fraction of OH(s) that reacts with CO(s) to form CO2(s) () | 0.1 |
| Fraction of surface-formed H2O that chemically desorbs () | 0.3-0.8 (see text) |
| Fraction of O2(s) that hydrogenates to H2O(s) () | 1.0 |
Since the various surface processes depend on the grain surface area, the rms grain radius () for the grain size distribution merits discussion. The gas-grain interaction and the microphysics of the evolution of the ice mantles (as described in Appendix B) should be followed for grains of different size. Here, as in other studies, we instead represent the distribution by mean values of the grain radius, cross-section etc. Conventionally, astrochemical models use a ‘classical’ value of m. However, the empirically constrained MRN interstellar grain size distribution is characterised by a power-law: with lower and upper limits of m and m. The surface area in this distribution is heavily weighted towards the small grain population and the resulting m. These small grains also dominate the UV opacity that regulates the photoprocesses.
A larger value of would be more appropriate if the effects of dust grain coagulation and/or ice mantle accretion are significant, as may be appropriate in dense, cold gas (Silsbee et al., 2020). However, if this were the case, then there would be several other implications to consider. These include (a) the effects on the optical properties of the dust, specifically its UV opacity - which affects the rates of the -dependent photoprocesses, (b) the effect on the grain surface area per unit volume, (c) the electrostatic enhancement factor for the freeze-out of ions, and (d) the relative rate at which dust grains grow, due to the accumulation of ice mantles (Rawlings et al., in preparation). Nonetheless, for the purpose of this study and for the sake of consistency and comparison with previous models, we adopt the values of m as given in Table 1, and defer a full discussion of these issues to a future study.
The value of the dust surface area per hydrogen nucleon () depends on a number of factors, including the assumed value of the dust to gas ratio (by mass, ), , and the mean density of the dust grains (). With these uncertainties, for the MRN distribution lies in the range cm2. Assuming that (by mass) and g cm-3 then cm2. is an important parameter in our model and we adopt a standard value of cm2 (which is the same as used in KRC14).
The photophysics can be moderated (and the temperature structure modified) by either (a) a reduction in the interstellar radiation field strength (), or (b) the inclusion of an external extinction () which would be appropriate if L1544 were surrounded by a low density background gas. However, these are not degenerate; (a) would result in a reduction in the physical extent of the PDR, whilst (b) could result in the PDR being shifted so that it is completely outside the core.
The initial conditions for the chemistry are taken to be atomic, with the HH2 ratio set to 10-3 and the fractional abundance of CO, . As explained above, a more realistic set of initial conditions could be obtained by evolving the chemistry to near-equilibrium. Therefore, to test the sensitivity of the chemistry to the dynamical evolution prior to the intial dynamical configuration that we have adopted, we have included the possibility of a hydrodynamic ‘pause’ () at the start of the simulation. During this period the cloud is treated as being static and the physical conditions are held constant.
4 Results
4.1 The chemical structure
Results from the model are shown in Figure 2 for the values of the parameters given in Table 1, which are essentially fixed for the specific chemical structure of L1544. The figure shows the radial profiles of the fractional abundances of key species as functions of position at , i.e. corresponding to the current observational epoch. The fractional abundances are defined relative to the number density of hydrogen nucleons (). This differs to the definition used in some other studies (e.g. KRC14), which is the relative to the H2 number density.
From various model calculations, and Figures 1 and 2, we find that it is possible to identify several different chemical regimes. From the outside, moving inwards:
-
1.
For the gas densities applicable to the outer parts of the core, the transition between C+/C/CO, characteristic of a photon dominated region (PDR) typically occurs at a mean A magnitudes. In our model, this corresponds to a radial position of between pc, where TK. Even at the outer boundary of 0.75pc (), K. At these very low temperatures thermal desorption from dust grains is negligible for nearly all chemical species of interest, implying the existence of a ‘cold PDR’ with a rather unusual gas-grain chemistry. We identify two zones within the PDR boundary layer:
-
•
the ice free zone; where K (pc, ). Here freeze-out and surface hydrogenation are inhibited by photodesorption, and the chemistry is dominated by gas-phase processes, and
-
•
the (marginal) ice formation zone; where K, freeze-out and surface hydrogenation occurs (yielding CH4 and H2O etc.), but is limited by photodesorption. Gas-phase chemistry still dominates in this region.
-
•
-
2.
Interior to the PDR boundary layer there is the ‘dark core’ with three zones;
-
•
an outer zone where the gas temperature falls rapidly, although the density does not rise as fast, so that freeze-out is once again inhibited,
-
•
an intermediate zone where the gas density rises significantly and freeze-out and photodesorption are both important; this is the location of the molecular (H2O) abundance peaks, and
-
•
an inner zone, where the density and extinction are high and freeze-out dominates (in analogy with the static model of Vasyunin et al., 2017).
-
•
The abundance profiles of the various species shown in Figure 2 are in broad agreement with those that are inferred from the L1544 observations. For H2O the principle empirical constraint on the gas-phase abundance profile comes from the radiative transfer analysis of the H2O 567GHz () line as observed by Herschel (Caselli et al., 2012). The different chemical zones discussed above are clearly evident, with substantial ice mantle formation only occurring within the inner 0.08pc (). Specifically, the H2O abundance profile is consistent with what was presented in KRC14. The radial location of the abundance peak is shifted purely as a result of the use of an updated (r) profile. The NH3 abundance profile remains high until innermost depletion region (pc, ), consistent with observations (Crapsi et al., 2007; Caselli et al., 2022).

4.1.1 Ice composition
In Figure 3 we show the compositional structure of the ices on the dust grains (in STARCHEM represented by particles of a single size). The figure shows the fractional composition of the ice for each monolayer, at two positions; near the outer edge of the ice formation zone (where photochemistry is important) and close to the (dark) centre of the core. We can see that there are variations in the ice composition as a function of position in the core and that there are very significant stratifications within the ice mantles. In conditions where significant freeze-out occurs, the sub-surface layers of the ices - which are effectively chemically inert - are determined by the entire evolutionary history of the cloud/core. Whilst, as we show in section 4.2, the gas-phase abundances evolve quasi-statically, the ice has a long memory so that each monolayer retains the abundances that were in equilibrium with the gas phase abundances at their time of deposition. The compositional stratification of the ice mantles thus reflects the chemical evolution of the gas. The molecules H2O and CO are seen to dominate the composition of the outer layers, as we would expect, because H2O and CO are the dominant oxygen and carbon species inside the PDR. Moreover, the O and OH that freeze onto the grains are quickly hydrogenated to H2O. In contrast, in the inner layers of the ice mantles, ammonia (NH3) and, most especially, methane (CH4) are major components. The source of the CH4 is incomplete conversion of C to CO in the earliest stages of the chemical evolution, resulting in the freeze-out and hydrogenation of C (see section 4.2.1 below). A similar behaviour can explain the NH3 and N2 abundance stratification; the inner mantle samples the early time chemistry, when the gas has a large atomic component. Here, accreting N is converted to NH3. The outer mantles sample the late time chemistry, when efficient conversion of N to N2 has taken place, and there is little N in the gas-phase.
These results are quite different to those obtained by Taquet, Ceccarelli & Kahane (2012) with the GRAINOBLE model. This is due to a number of factors; Taquet, Ceccarelli & Kahane (2012) adopt a different grain size distribution, omit photodesorption and desorption driven by the enthalpy of formation and - most significantly - they only included the accretion of H, O and CO, so that the formation of CH4 and NH3 are inhibited.
Unlike some studies (e.g. Hocuk & Cazaux, 2015), we do not consider the differences in binding energies for bare and icy grains, other than for the desorption driven by the enthalpy of molecule formation. Whilst this has some implications for the cosmic-ray heating-induced desorption of the most volatile species, this is generally not significant as the dust temperatures are so low that thermal desorption is negligible for nearly all species of interest.
Our results can be used to compare with recent JWST observations of ice mantle compositions toward dense dark clouds (e.g. McClure et al., 2023) and to guide future JWST observations of pre-stellar cores.

Small variations of the dust parameters (within the range of uncertainty) can result in an interesting phenomenon in the behaviour of the solid-state abundances of both CO and H2O in the ‘cold core’ region. These sometimes show strong enhancements in the range pc (). Although the specific form of this feature is an artefact of the physical parameters in our model (e.g. the simplifying assumption that dust grains can be represented by a single size population), there is a genuine - if somewhat counter-intuitive - reason for its existence: the sharp rise in the abundances at the outer positions correspond to the formation of ices of more than one monolayer thickness. However, whilst the desorption processes are only weakly dependent on local conditions, the freeze-out rates are proportional to the density () times the square root of the gas temperature (). There is a region in the inflow where falls faster than rises and consequently the net freeze-out rate falls and the ices reduce to the sub-monolayer regime (within pc, ). In a real grain size population this enhancement would be smoothed out, but the overall effect is for dust grains to be relatively ice-free (i.e. in the sub-monolayer regime) right down to 0.09pc ().
4.1.2 The chemistry of H2O
To understand the behaviour of H2O in more detail, we need to identify the dominant formation and destruction channels. These have been discussed at some length elsewhere (e.g. van Dishoeck, Herbst & Neufeld, 2013) but to summarise; in the cold, dense environment of pre-stellar cores the predominant gas-phase formation route is driven by (cosmic-ray generated) H:
Neutral-neutral reactions, via the hydrogenation of the OH radical, are only significant at higher temperatures, and in cold environments the H2O formation is dominated by surface reactions on interstellar ices. Several pathways have been identified (e.g. see van Dishoeck, Herbst & Neufeld, 2013; Ioppolo et al., 2008), the most direct being the surface hydrogenation of accreted oxygen atoms and hydroxide (OH) radicals. In addition, and particularly in relatively dense regions, significant contributions may be made via alternative (interconnected) channels involving O2, either accreted from the gas-phase, where it is primarily formed by the OH+O reaction, or else created via oxygen atoms reacting on the surface. The hydrogenation of surface O2 leads to the formation of intermediate species en route to H2O formation, such as HO2 and H2O2. Alternatively, surface oxidation leads to the formation of O3, which can be hydrogenated, again leading - ultimately - to H2O formation (Cuppen et al., 2010). Figure 2 shows different abundances in each of the chemical zones identified in section 4.1; low molecular abundances are seen in the outer PDR region where photodissociation is active and also in the inner core where freeze-out dominates. The molecular abundances peak at intermediate extinctions and densities. In the outer regions (pc, ) most of the gas-phase H2O derives from ice that has been desorbed by photodesorption and the enthalpy of surface formation of H2O from O and OH. Indeed, if the latter process were suppressed, then the H2O abundance would be lower by a factor of up to . The main H2O loss mechanisms are photodissociation and reaction with C+ (to form HCO+, ultimately leading to CO formation). This effectively inhibits ice formation until pc (). At the location of the H2O abundance peak (pc, ) photodesorption and formation enthalpy-driven desorption still dominates the production of gas-phase H2O, although gas-phase reactions (via H3O+) also contribute significantly. Photodissociation is the dominant destruction mechanism. In the inner core cosmic-ray induced photodesorption dominates the production of gas-phase H2O. As the rates for this are rather ill-defined there is a considerable margin of error in the model predictions. In the innermost regions (pc, ) the abundance declines due to efficient freeze-out at high densities - but gas-phase destruction by H accounts for % of the loss rate. The surface hydrogenation of accreted OH is the main formation channel.
4.1.3 The chemistry of CO
Unlike H2O, which is mainly formed on the surface of grains, CO is formed in the gas-phase. In dense cloud conditions this chemistry is relatively slow, compared to other gas-phase processes and freeze-out, but may result in the efficient conversion of C to CO. Several channels are possible, including:
| (1) |
| (2) |
| (3) |
or
However, the initiating radiative association reactions for both of these channels are very slow; the reactions of C and C+ with H2 to form CH and CH+ have large activation barriers, whereas the corresponding radiative association reactions (to form CH2 and CH) do not possess inhibitive barriers, but are inefficient. In normal dark cloud environments, reactions involving OH may therefore be more important:
| (4) |
or
| (5) |
| (6) |
followed by reaction (3), although the efficacy of reactions (5) and (6) have recently been challenged by the non-detection of CO+ in diffuse interstellar clouds (Gerin & Liszt, 2021), which suggests that non-thermal reactions involving C+, CH+, CH etc. and oxygen atoms are likely to be a more important source of the observed HCO+:
But, as noted above, the first of these reactions is very slow at low temperatures.
Interior to the PDR, at the densities applicable to pre-stellar cores, the conversion of C to CO goes to near completion (i.e. ) within a few years and the ratio of the gas-phase to solid-state CO abundances is set by the balance of freeze-out and desorption. CO has a much lower surface binding energy than H2O so that the gas-phase abundance is sensitive to the assumptions concerning the desorption efficiencies. Thus, although the dust temperature is low enough that thermal desorption is inhibited throughout this region, desorption by cosmic-ray heating is important (and dominates over photodesorption). The effect of chemical desorption (driven by H2 formation) may also be significant (e.g. Pantaleone et al., 2021).
Further out, within the PDR zone, CO formation is incomplete and the abundances of C and C+ are relatively high. Indeed, even deep inside a PDR, the abundances of C and C+, do not vanish and are typically of the order of times that of CO (e.g. see Fig 7 of Röllig et al., 2007). The situation in a ‘cold PDR’ is more complex; in (the oxygen rich) gas-phase, carbon chemistry tends to lead to the formation of the stable CO molecule as the dominant product (leaving free volatile oxygen to form H2O, O2 and other species), with a much smaller proportion of the available carbon present in other organic molecules. However, on the surface of grains, it is more likely that any accreting carbon atoms or ions are hydrogenated to form methane (CH4).
If the conditions are propitious for freeze-out (as is the case in the cold PDR in the outer regions of the core), then there will be a competition between
also leading to methanol (CH3OH) formation (which we do not discuss in this study; see Appendix B), and
The very low temperatures and the chemical structure of pre-stellar cores imply that the gas-phase and gas-grain chemistries pull in different directions (leading to CO and CH4 respectively). This implies that the efficiency of CO formation in the pre-contraction phase is important in determining the balance between CO/CH3OH and CH4. This balance will be strongly dependent on the assumptions concerning the grain size distribution. Thus, if the grain surface area is predominantly carried by negatively charged very small grains (as is the case in the MRN dust size distribution), then there could be a strong electrostatic enhancement of the freeze-out of C+, favouring the methane formation channel. We defer a full discussion of the importance of the grain size distribution to a future study.
Referring to Figure 2 we can see that the qualitative behaviour of the CO abundance profile is similar to that for H2O. That is to say there are essentially three chemical regimes; (i) an outer PDR zone, where tails off at low Av, (ii) a middle region where reaches near saturation, and (iii) an inner depletion zone where the depletion factor depends on the ratio of the freeze-out to the cosmic-ray induced desorption rates.
We confirm the findings of KC10; that an efficient desorption mechanism is required to maintain sufficiently high CO abundances at high extinctions, to explain the observed line strength. The most efficient mechanism for CO desorption is cosmic-ray grain heating - but, as deduced by KC10 from a comparison with the observed brightness of CO in L1544, the rate would need to be larger than given in Hasegawa & Herbst (1993) 222The uncertainty of a factor of three in this estimate comes from the non-linear scaling of the CO brightness with the cosmic-ray desorption, the accuracy of the radiative transfer modelling and the observational uncertainty. Current studies (Rawlings, 2022) indicate that cosmic-ray heating induced desorption rates may have been grossly underestimated in previous studies (see also Silsbee et al., 2021). There are, however, very significant uncertainties in the quantification of these rates and their -dependence but these, empirically deduced values, are within this range of uncertainty.
In our model we find that the formation of CO is a little more complex than H2O; in the outer regions several formation channels are effective, including dissociative recombination of HCO+, but also via the photodissociation/hydrogen abstraction of surface-formed CH4, yielding CH, which reacts with oxygen atoms. A corollary of this pathway multiplicity is that the CO abundance profile is fairly robust to uncertainties/variations in the rate coefficients for specific reaction pathways. The destruction of CO is completely dominated by photodissociation (in the PDR) and freeze-out (in the inner core). At intermediate radii (0.08pcpc, ) reaction with H to form HCO+ is significant, although most of the HCO+ is re-cycled to CO. In the innermost regions, there is little gas-phase chemistry and the abundance is essentially established by the balance between (cosmic-ray heating) desorption and freeze-out.
4.1.4 CO and the nitrogen chemistry
Some previous studies (e.g. Hollenbach et al., 2009) have predicted gas-phase CO to be concentrated in a ‘ring’ at A. Part of the reason for this is due to the coupling of the chemistries for CO and H2O (e.g. as is evident from reactions 4 and 5 above). But, most significantly, it was postulated that in the regions where H2O freezes out but (the more volatile) CO does not, CO is destroyed (by He+, N2H+ and photodissociation at low ) yielding O. This can then freeze out and be converted to H2O on grains, so that the net result is a gradual shift of the oxygen from CO to H2O, and an anticorrelation between CO and N2H+. Our model results do not show this anticorrelation. Observationally, there is some evidence of a rise in the abundance of N2H+ in high density regions where CO is depleted (e.g. Caselli et al., 1999; Aikawa et al., 2001), although this observation could be an artefact of radiative transfer effects (Caselli et al., 2022). We defer a full description of the chemistry of N2H+ to a future study, but our results indicate that the abundance profiles of CO and N2H+ are only weakly connected. We also find that destruction by He+ is insignificant at all positions.
The nitrogen chemistry is fairly simple: throughout much of the core, the chemistry of N2 is driven by CH:
and, here, reactions with He+ are the dominant destruction mechanisms (ultimately providing formation channels for NH3 and N2H+), although reaction of N2 with H to form N2H+ is significant at the innermost positions. In these regions of high depletion, the hydrogenation of N+ to NH, followed by dissociative recombination, is also a major formation channel for NH3. As with CO the dominant desorption mechanism for other volatile species, such as N2, is found to be direct cosmic ray heating of grains.
4.2 Time-dependence
In Figure 4 we show the radial abundance profiles for selected species (H2O, H2O(s), CO, CO(s), NH3 and CS) obtained at three specific times in the dynamical/chemical evolution: tmin=0.30Myr, 0.45Myr and tmax=0.61 Myr.

We can immediately see from this figure that there is hardly any ‘intrinsic’ time-dependence of the chemical abundances. The abundances do change with position and time, particularly in the inner regions, but this is primarily a result of the contraction of the core and the adjustment of the chemical equilibrium to the changing physical conditions. To test this result we have re-calculated these profiles, but setting Myr - i.e. inserting a period of chemical evolution, during which the physical parameters are held constant, at the beginning of the simulation. This yields almost identical results to those shown in Figure 4, other than a small reduction (by a factor of in the abundance of NH3 in the range 0.15pc0.25pc, ). This result indicates that it would not be possible to determine a ‘chemical age’ for the cloud. Although the chemical evolution is in quasi-equilibrium, in the parts of the core where thick ice mantles are present it is possible that some abundances will be affected by the prior evolution of the core. This is because the equilibrium is determined by the balance between gas-phase and gas-surface interactions. In our model the previously accreted sub-surface ice layers are assumed to be inert and effectively removed from the active chemistry.
With the assumption of quasi-equilibrium, we can estimate the gas-phase abundance of H2O in the inner parts of the core as balance between freeze-out and desorption. We can also calculate the relative contribution from each of the applicable desorption mechanisms; cosmic ray induced photodesorption, cosmic ray heating induced desorption and H2-formation induced desorption.
Comparing the desorption efficiency for cosmic-ray induced photodesorption with that for H2 formation-induced desorption, we find that the two are equal when
Thus, in normal circumstances, this implies that values of would be needed for H2 formation-induced desorption to be important.
Then, comparing the desorption efficiencies for cosmic ray heating-induced desorption with cosmic ray induced photodesorption we find that the former dominates when
where we have used parameter values as given in Table 1. For species of interest, most estimates of are less than this value, but we cannot exclude the possibility that recent revisions could imply that cosmic ray heating may the dominant desorption mechanism for most species in dark environments.
Hence, balancing freeze-out with cosmic-ray induced photodesorption, and with the additional assumptions that K and that the proportion of surface coverage of grains by water molecules is of order unity (as indicated in Figure 3), then - again using parameter values from Table 1 - the equilibrium gas-phase density of H2O is
Assuming that and do not change as functions of position, this is independent of the local conditions, so that the fractional abundance of water, , simply scales as the inverse of the density. This behaviour can be seen in the inner regions (pc, ) in Fig 4.
4.2.1 Parameter variations
We have also investigated the sensitivity of these results to the values of some of the parameters (identified in Table 1), the chemical initial conditions and the choice of reaction database, within the ranges that are appropriate for pre-stellar cores. We defer a full discussion to a future paper but highlight some key results here.
Apart from some obvious dependencies on the cosmic ray induced desorption rates and the various desorption efficiencies (particularly in the inner core) the H2O and CO abundance profiles are, in general, found to be fairly insensitive to most of these parameter variations. For most species, a range of gas-phase, gas-grain and surface reactions operate at all positions within the core. Changing the initial conditions (specifically, the initial fractional abundance of CO) has little effect on the gas-phase abundances - consistent with the condition of quasi-static equilibrium - but results in significant variations in the CH4 to CO ratio in the ice mantles. This is an interesting result that will be investigated in more detail in future studies.
The chemistry is, however, very sensitive to the value of the external extinction, as this affects both the radiation field strength and the location and extent of the PDR. We find that the inclusion of even modest values of results in a shift in the location of the H2O abundance peak and large abundances in the outer envelope that are quite incompatible with the empirically constrained abundance profile. There is filamentary structure in the vicinity of L1544, and the presence of a parsec-scale low density (cm-3) medium is required to reproduce the HCO+(1-0) observations (e.g. Redaelli et al., 2022; Giers et al., 2023). However, the regions that are responsible for the observed CO and H2O line profiles cannot be obscured from the interstellar radiation field by material with significant extinction in the near-IR and UV.
4.3 The applicability of reduced chemical networks
In this section we compare the accuracy of using a highly reduced chemical reaction network relative to a full description of the gas-grain chemistry.
In a cold, dark cloud most of the oxygen budget is taken up by O, O2, CO, OH and H2O. As CO is relatively chemically inert and O2 is not a dominant component, KRC14 proposed that the H2O chemistry could be described adequately by a highly reduced network of just a few reactions. In this scheme the gas-phase chemistry is limited to the hydrogenation and photodissociation reactions:
Although the hydrogenation reactions are vanishingly slow at temperatures below a few hundred degrees, they are included to provide reverse reactions for detailed balance with the photodissociation reactions. With these reactions, the reduced chemical network is also applicable in warmer gas.
The gas-grain interactions simply include the freeze-out and (assumed complete) surface hydrogenation of O,OH (and H2O):
balanced by desorption:
The processes include direct cosmic ray heating, photodesorption and (in KRC14) cosmic-ray induced photodesorption. Thermal desorption, though included, is insignificant in starless cores because of the low dust temperatures.
KC08 and KC10 assume that the carbon chemistry could be decoupled from the oxygen/H2O chemistry and be reduced to just three reactions:
and the (slow) radiative association of C+ with H2 (reaction 1), which is the rate-limiting step for CO formation (followed by reactions 2 and 3). The only gas-grain processes were taken to be the freeze-out and (cosmic ray-induced) desorption of CO.
4.3.1 Comparison of reduced with full chemical networks
As mentioned in the introduction, one advantage of the reduced chemical networks is the simple and rapid calculation of the abundances of the dominant coolants using a few algebraic equations. These apply to each of the H2O and CO chemistries and relate the abundances to the values of the model-dependent reaction rates. This allows for a simple analytical approximation to establish the temperature of the gas (Goldsmith, 2001; Keto & Field, 2005) which is valid even across PDR boundaries.
Previously we compared our dynamical and chemical model of L1544 to observations of L1544 (KC10, KRC14). The predicted C18O and H2O abundance profiles for L1544 along with radiative transfer modelling produced C16O, C17O and C18O (1-0) and H2O 567GHz (1) line profile shapes and strengths consistent with those observed. The reduced chemical network is also responsible for the gas temperature which factors into the line strengths. In this sense the method is observationally verified.
A direct comparison of the abundances produced by the reduced chemical network with those from a full network has the advantage that the accuracy of the approximation can be determined at least for the examples compared. To assess the accuracy of the reduced network chemistry, we have compared the abundances at from our time-dependent full network chemical model with the equilibrium abundances at also from STARCHEM but including only the reactions from the reduced network as defined above. This effectively mimics the analytical approach used in our earlier papers, KC08, KC10, and KRC14.
The results from this comparison show that whilst there is a good fit to the H2O abundance profile, the fit for the CO profile is not as good; the reduced network results in too much CO in the outer parts (due to the omission of various gas-phase destruction channels) and too little CO in the inner regions (due to the slowness of the CO production reactions). The C and C+ profiles are also problematic, with high abundances persisting down to the centre of the core. This is again partly due to the slowness of the C to CO conversion reactions in the reduced network.
An obvious problem with the carbon chemistry in the reduced network as proposed by KC08 is that C+ recombination was not included:
and, other than photoionization, there is no loss channel for carbon atoms. We have included additional channels in the network to account for the conversion of C and C+ to CO (as suggested in section 4.1.3):
(assuming that every CO+ molecule so-formed leads to CO formation, via reactions 6 and 3). Here, the abundance for OH is found from the reduced network for oxygen. The loss of OH in these reactions should not much affect the abundances in the oxygen network since the total abundance of oxygen is three times that of carbon, and we ignore this effect.
In Figure 5 we show the results of a comparison between the full network and our reduced networks for the H2O chemistry (as in KRC14) and the CO chemistry (revised, as described in Appendix A). The figure shows the abundance profiles (at ) obtained for H2O, H2O(s), O, C, C+, CO and CO(s.). To compare ‘like with like’ we suppress enthalpy-driven desorption and the surface chemistry of CO (leading to CO2 formation etc.) in these simulations. In this figure, we also show the abundances determined directly from the algebraic equations for chemical equilibrium with the reduced networks.

Using the revised reduced networks in the full model yields remarkably accurate results (typically within a factor of , at all radii) for all species, other than CO and CO(s.) in the innermost region where there is some discrepancy. This is due to the large methane abundance obtained in this partcular model, which is not accounted for in the reduced network.
The algebraic solution also gives excellent fits, except for CO and H2O which are over-estimated in the inner regions, where the dust grains have thick ice mantles. The reason for this is straightforward; the desorption rate of a species depends on the fraction of the grain surface that it covers. The algebraic formulae take the desorption rate to be proportional to the total ice mantle abundance of that species. In the sub-monolayer regime this is a satisfactory approximation, but for thicker ices this over-estimates the desorption rate by a factor of order of the number of monolayers. This discrepancy has only a marginal effect on the ice abundances as they are much greater than the gas-phase abundances in these conditions.
We conclude that the reduced networks (including the modifications for the CO chemistry as described in Appendix A) work extremely well, although their accuracy in regions of high depletion are contigent on H2O and CO being the dominant ice mantle components. We recommend that the revised CO chemistry network be used in future applications. The algebraic solutions to the networks also work well, except for CO and H2O in regions of high depletion.
4.3.2 Utility of reduced network chemistries
In pre-stellar cores the main heating mechanism for the gas throughout most of the core is cosmic ray heating. In the outer region, the UV flux on dust also heats the gas through the photoelectric effect. In the central region which is completely shielded from starlight, only cosmic ray heating is effective, and the gas becomes very cold, approaching 5K.
The main coolants for the atomic gas are [CII] and [OI] fine structure lines, whilst the molecular gas cools primarily through the CO rotational lines and dust thermal emission. The most effective optical depth for cooling is about unity. Where the CO(1-0) is optically thick, the higher excitation lines become effective coolants as well as a few less abundant simple carbon species (Goldsmith, 2001). Figure 1 shows a local maximum in the gas temperature at a radius of 0.03 pc. This is due to the variation of the optical depths of the molecular line coolants, primarily CO(1-0). As the dust temperature increases with radius due to the increasing UV flux, so does the gas temperature by collisional coupling with the dust. However, at radii 0.03 pc, the optical depth to the boundary of the cloud decreases enough that the cooling through the molecular lines becomes more effective. At radii 0.3 pc, the gas temperature decreases despite the steady increase in dust temperature. The rapid rise in the gas temperature at the boundary is caused by hot electrons photoelectrically released from dust grains by FUV radiation that penetrates only a short distance into the cloud.
5 Summary and conclusions
We have applied an empirically constrained multi-point dynamical model, coupled to a comprehensive description of the chemistry, to a study of the chemical processes and timescales in pre-stellar cores. We have applied this model to L1544 to study the temporal and spatial evolution of the abundances of H2O, CO and other key small molecular species.
The key results from our studies are as follows:
-
1.
At the time corresponding to the epoch of observation of L1544, the chemical timescales are less than the dynamical timescale throughout the core. Hence, the chemistry is in near equilibrium; that is to say, the chemical abundances at any position simply respond to the instantaneous local physical conditions () and are, to a large extent, independent of the prior chemical and dynamical evolution. The H2O abundance profile in this type of source only depends on the physical structure, and the values of certain chemical parameters. This is a significantly different result to what is usually assumed to be the case for young star-forming regions and implies that, for isolated pre-stellar cores at least, the chemical and dynamical evolution are not separable. Hence, the concept of a chemical (or depletion) ‘age’, and the applicability of ‘chemical clocks’, are meaningless. The only situations in which chemical clocks may be relevant are the highly unusual conditions where an observed system has assembled on a timescale that is short compared to the chemical timescale, but then evolves on a very much longer timescale.
-
2.
The ice mantles on dust grains are highly structured, so that whilst CO and H2O dominate the outer layers other species, such as CH4 and NH3, are important in the inner layers. As has been previously noted (e.g. Taquet, Ceccarelli & Kahane, 2012; Rawlings, Wilson & Williams, 2019), if it is assumed that the sub-surface ice layers are chemically inactive they act as a fossil record/reservoir of the prior dynamical/chemical evolution. This implies that the quasi-equilibrium gas-phase abundances are not completely decoupled from the evolutionary history of the core. For example, the degree of conversion of C to CO in the earliest evolutionary stages determines the overall abundance of CH4 ice (due to the competition between gas-phase chemistry; yielding CO, and surface chemistry; yielding CH4). A similar result applies to NH3 ice, whose abundance is determined by the degree of conversion of N to N2 in the gas-phase.
-
3.
The model matches the empirically determined abundance profiles for H2O and CO in L1544. The chemistry of hydrogenated species, such as H2O, NH3 and CH4, is dominated by surface reactions. For many other species there are gas-phase and surface chemistry formation channels that operate throughout the range of physical conditions that exist within the core, so that their abundance profiles are remarkably robust to parameter variations.
-
4.
The highly simplified reduced network chemistries for oxygen species described in KRC14, and for C/C+/CO, described in KC08 & KC10 and revised here (Appendix A), give a very accurate description of the chemistry and abundance profiles for gas-phase and solid-state H2O and CO, OH, O, C and C+. This is valid over the whole range of extinction (1A1000) applicable to starless cores and quiescent molecular gas. The accuracy of the CO and H2O profiles in regions of high depletion depends on these species being the dominant components of the ice mantles. Algebraic solutions to these networks also give good descriptions of the abundance profiles, but over-estimate the gas-phase abundances of CO and H2O when significant freeze-out has occurred.
-
5.
The abundance profiles for both H2O and CO in L1544 necessitate the existence of a PDR in the outer regions of the core and the interstellar radiation field must reach the outer layers without attenuation (i.e. ). This is indicative of the presence of highly non-uniform density and extinction structures in this source.
-
6.
The chemical structure is quite complex, with both gas-phase and surface chemistry important throughout the core. In the outer regions ‘cold PDR’ conditions prevail, with photodesorption and enthalpy-of-formation driven desorption dominating the gas/ice balance. Thermal desorption is only significant in the outermost parts of the core, and even there is only limited to highly volatile species.
-
7.
The chemistry in the inner (dark) regions of the core (pc, ) is dominated by cosmic-ray induced processes. In particular, the desorption of ices by cosmic ray induced photodesorption (for H2O) and cosmic ray grain heating (for CO etc.) are the main factors that determine the gas-phase abundances in the highly depleted regions. However, in the light of recent re-calculations (e.g. Rawlings, 2022), we find that in these conditions, desorption driven by the cosmic ray heating of grains is probably more significant than cosmic-ray induced photodesorption for a number of volatile species, including CH4 and N2.
Future modelling efforts will include updates to include a more comprehensive description of the (position-dependent) grain size distribution and its several effects on the chemistry. This update would also include allowances for the ice composition-dependences of the binding energies and desorption efficiencies.
Our modelling of the H2O and CO abundance profiles in a specific pre-stellar core (L1544) can be extended to study the abundance profiles of, and correlations between, other key molecular tracers, such as N2H+, N2, HCO+, H2CO and CH3OH. The flexibility of the model is such that this could easily be adapted and applied to studies of other pre-stellar cores.
Data availability
The data underlying this study are openly available from the published papers that are cited in the article. The data generated in support of this research are partly available in the article, and will be shared on reasonable request to the corresponding author.
References
- Aikawa et al. (2001) Aikawa Y., et al., 2001, ApJ 552, 639.
- Andersson et al. (2006) Andersson S., Al-Halabi A., Kroes G.-J., van Dishoeck E.F., 2006, J. Chem. Phys., 124, 064715
- Bate & Keto (2015) Bate M.R., Keto E.R., 2015, MNRAS, 449, 2643
- Bergin & Tafalla (2007) Bergin E., Tafalla M., 2007, Ann. Rev. A&A, 45, 339
- Bizzocchi et al. (2014) Bizzocchi L., Caselli P., Spezzano S., Leonardo E., 2014, A&A, 569, A27
- Bringa & Johnson (2004) Bringa E.M., Johnson R.E., 2004, ApJ, 603, 159
- Buch & Zhang (1991) Buch V., Zhang Q., 1991, ApJ, 379, 647
- Caselli et al. (1999) Caselli P., Walmsley C.M., Tafalla M., Dore L., Myers P.C., 1999, ApJ, 523, L165
- Caselli et al. (2012) Caselli P., Keto E., Bergin E.A. et al., 2012, ApJL, 759, L37
- Caselli et al. (2017) Caselli P., Bizzocchi L., Keto E. et al., 2017, A&A, 603, L1
- Caselli et al. (2019) Caselli P., Pineda J.E., Zhao B. et al., 2019, ApJ, 874, 89
- Caselli et al. (2022) Caselli P., Pineda J.E., Sipilä et al., 2022, ApJ, 929, 13
- Cecchi-Pestellini & Aiello (1992) Cecchi-Pestellini C., Aiello S., 1992, MNRAS, 258, 125
- Chacón-Tanarro et al. (2019) Chacón-Tanarro A., Pineda J.E., Caselli P. et al., 2019, A&A, 623, A118
- Chiar et al. (2011) Chiar J.E., Pendleton Y.J, Allamandola L.J. et al., 2011, ApJ, 731, 9
- Crapsi et al. (2007) Crapsi, A., Caselli P., Walmsley M.C., Tafalla M., 2007, A&A, 470, 221
- Cruz-Diaz et al. (2018) Cruz-Diaz G.A., Martín-Doménech R., Moreno E., Muñoz Caro G.M., Chen Y-J., 2018, MNRAS, 474, 3080
- Cuppen et al. (2010) Cuppen H.M., Ioppolo S., Romanzin C., Linnartz H., 2010, Phys. Chem. Chem. Phys., 12, 12077
- Galli et al. (2019) Galli P.A.B., Loinard L., Bouy H. et al., 2019, A&A, 630, A137
- Garrod & Pauly (2011) Garrod R.T., Pauly T., 2011, ApJ, 735, 15
- Hasegawa & Herbst (1993) Hasegawa T.I., Herbst E., 1993, MNRAS, 261, 83
- Gerin & Liszt (2021) Gerin M., Liszt H., 2021, A&A, 648, A38
- Giers et al. (2023) Giers K., Spezzano S., Caselli P. et al., 2023, A&A, 676, A78
- Glover & Clark (2012) Glover S.C.O., Clark P.C., 2012, MNRAS, 421, 116
- Goldsmith (2001) Goldsmith P.F., 2001, ApJ, 557, 736
- He et al. (2015) He J., Shi J., Hopkins H., Vidali G., Kaufman M.J., 2015, ApJ, 801, 120
- Herbst & Cuppen (2006) Herbst E., Cuppen H.M., 2006, Proceedings of the National Academy of Science, 103, 12257
- Hocuk & Cazaux (2015) Hocuk S., Cazaux S., 2015, A&A, 576, A49
- Hollenbach et al. (2009) Hollenbach D., Kaufman M.J., Bergin E.A., Melnick G.J., 2009, ApJ, 690, 1497
- Ioppolo et al. (2008) Ioppolo S., Cuppen H.M., Romanzin C., van Dishoeck E.F., Linnartz H., 2008, ApJ, 686, 1474
- Kalvns & Kalnin (2020) Kalvns J., Kalnin J.R., 2020, A&A, 633, A97
- Keto & Caselli (2008) Keto E., Caselli P., 2008, ApJ, 638, 238 [KC08]
- Keto & Caselli (2010) Keto E., Caselli P., 2010, MNRAS, 402, 1625 [KC10]
- Keto, Rawlings & Caselli (2014) Keto E., Rawlings J.M.C., Caselli P., 2014, MNRAS, 440, 2616 [KRC14]
- Keto, Caselli & Rawlings (2015) Keto E., Caselli P., Rawlings J.M.C., 2015, MNRAS, 446, 3731 [KCR15]
- Keto & Field (2005) Keto E., Field G., 2005, ApJ, 635, 1151
- Mathis, Rumpl & Nordsieck (1977) Mathis J.S., Rumpl W., Nordsieck K.H., 1977, ApJ, 217, 425
- McClure et al. (2023) McClure M.K., Rocha W.R.M., Pontoppidan K.M., et al., 2023, Nature Astronomy, 7, 431
- McElroy et al. (2013) McElroy D., Walsh C., Markwick A.J., Cordiner M.A., Smith K., Millar T.J., 2013, A&A, 550, A36
- Millar et al. (2024) Millar T.J., Walsh C., Van de Sande M., Markwick A.J., 2024, A&A, in press
- Minissale et al. (2016) Minissale M., Dulieu F., Cazaux S., Hocuk S., 2016, A&A, 585, A24
- Nelson & Langer (1997) Nelson R.P., Langer W.D., 1997, ApJ, 482, 796
- Öberg et al. (2009) Öberg K., Linnartz H., Visser R., van Dishoeck E.F., 2009, ApJ, 693, 1209
- Pantaleone et al. (2021) Pantaleone S., Enrique-Romero J., Ceccarelli C., Ferrero S., Balucani N., Rimila A., Ugliengo P., 2021, ApJ, 917, 49
- Pontoppidan (2006) Pontoppidan K.M., 2006, A&A, 453, L47
- Rawlings et al. (1992) Rawlings J.M.C., Hartquist T.W., Menten K., Williams D.A., 1992, MNRAS, 255, 471
- Rawlings, Wilson & Williams (2019) Rawlings J.M.C, Wilson T.G., Williams D.A., 2019, MNRAS, 486, 10
- Rawlings & Williams (2021) Rawlings J.M.C., Williams D.A., 2021, MNRAS, 500, 5117
- Rawlings (2022) Rawlings J.M.C., 2022, MNRAS, 517, 3804
- Redaelli et al. (2022) Redaelli E., Chacón-Tanarro A., Caselli P., Tafalla M., Pineda J.E., Spezzano S., Sipilä O., 2022, ApJ, 941, 168
- Riedel et al. (2023) Riedel W., Sipilä O., Redaelli E., Caselli P., Vasyunin A.I., Dulieu F., Watanabe N., 2023, arXiv 2310.08389
- Röllig et al. (2007) Röllig M., Abel N.P., Bell T., et al., 2007, A&A, 467, 187
- Rollins & Rawlings (2012) Rollins R.P., Rawlings J.M.C., 2012, MNRAS, 427, 2328
- Silsbee et al. (2020) Silsbee K., Ivlev A.V., Sipilä O., Caselli P., Zhao B., 2020, A&A, 641, 39
- Silsbee et al. (2021) Silsbee K., Caselli P., Ivlev A.V., 2021, MNRAS, 507, 6205
- Sipilä et al. (2019) Sipilä O., Caselli P., Redaelli E., Juvela M., Bizzocchi L., 2019, MNRAS, 487, 1269
- Sipilä, Silsbee & Caselli (2021) Sipilä O., Silsbee K., Caselli P., 2021, ApJ, 922, 126
- Sipilä et al. (2022) Sipilä O., Caselli P., Redaelli E., Spezzano S., 2022, A&A, 668, A131
- Taquet, Ceccarelli & Kahane (2012) Taquet V., Ceccarelli C., Kahane C., 2012, A&A, 538, A42
- van Dishoeck, Herbst & Neufeld (2013) van Dishoeck E.F., Herbst E., Neufeld D.A., 2013, Chem. Rev., 113, 9043
- van Dishoeck et al. (2021) van Dishoeck E.F., Kristensen L.E., Mottram J.C. et al., 2021, A&A, 648, 24
- Vasyunin et al. (2017) Vasyunin A.I., Caselli P., Dulieu F., Jiménez-Serra I., 2017, ApJ, 842, 33
- Wakelam et al. (2012) Wakelam V., Herbst E., Loison J.-C., et al., 2012, ApJS, 199, 21
- Willacy et al. (1994) Willacy K., Rawlings J.M.C., Williams D.A., 1994, MNRAS, 269, 921
- Woodall et al. (2007) Woodall J., Agúndez M., Markwick–Kemper A.J. & Millar T.J., 2007, A&A, 466, 1197
- Zucconi, Walmsley & Galli (2001) Zucconi A., Walmsley C.M., Galli D., 2001, A&A, 376, 650
Appendix A Simplified chemical networks
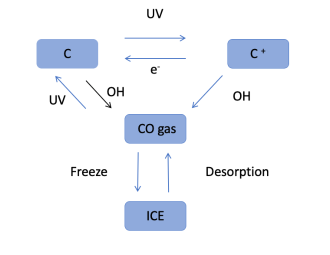
KC08 suggested that the equilibrium abundances of CO, C, and C+, and CO ice can be approximated by a simultaneous solution of the equilibrium rate equations, and that this approximation is adequate for quiescent molecular clouds such as starless cores. KRC14 suggested a similar procedure for the abundances of O, OH, H2O and H2O ice as discussed in detail in Appendix B of that paper. From the discussion above and in §4.1.3, we can now define a revised reduced chemical network (figure 6) for carbon and CO. This allows us to simultaneously solve the rate equations above for the equilibrium abundances of C, C+, CO, and CO ice independently of STARCHEM. To do so, we assume that the abundance of OH is given by the reduced network chemistry for oxygen species, and the abundance of free electrons is equal to the abundance of C+. The latter results in a quadratic equation for C+. The carbon-chemistry reaction scheme and recent values for the rate coefficients (taken from UDFA22; Millar et al., 2024) are:
The rates for the freeze-out and desorption reactions are described in §B.3 and §B.4, respectively. The simple description of ice desorption considers the rate to be proportional to the total solid-state abundance of a species and omits the detailed calculations of the several grain surface processes in STARCHEM, including the desorption due to the energy released by the formation of molecules on grain surfaces. Owing to the quadratic equation for C+, we solve the set of simultaneous rate equations by elementary algebra rather than matrix inversion as was used in KRC14.
Appendix B The STARCHEM model
Although STARCHEM has been applied in previously published studies (e.g. Rawlings & Williams, 2021; Rawlings, 2022) it was originally formulated for the study of pre-stellar and protostellar cores, so we give a fuller description of the model here. The model was designed to allow fully flexible descriptions of the chemistry and dynamics and the main features of the generic code are as follows:
-
1.
The chemistry and physical parameters are co-integrated using the DLSODE integration package, along Lagrangian streamlines, for a number of test points in the chosen geometry. The model has been constructed so as to be easily adaptable to any user-defined dynamics. The physical parameters (such as the density, gas and dust temperatures, visual extinction and velocity field) can either be specified analytically, or in look-up tables, with the continuous values determined though smoothed interpolation.
-
2.
The chemistry is defined by flexible descriptions of gas-phase reactions, gas-grain interactions (in the surface layers of the dust ices), and solid-state (sub-surface) processes. In particular, the chemical datasets (species and reaction rate coefficients) are dynamically switchable - allowing the sensitivity to the adopted chemistry to be tested.
-
3.
Where appropriate (i.e. at relatively low values of extinction), the code incorporates a model of the photon dominated region (PDR) to describe the photochemistry.
-
4.
Freeze-out, plus a full suite of desorption processes are included (thermal, direct and CR-induced photodesorption, CR heating - spot and whole grain, heating by H2 formation and species-specific enthalpy of formation etc.), together with a simplified surface chemistry.
-
5.
The chemical composition of the ices that form on the dust grains are determined with time- and position-dependence on a layer-by-layer basis, in a so-called ‘three-phase’ model, which differentiates the chemically active surface layers and the chemically inert sub-surface layers.
Details of these various features are given below, as well as the specific application to our model of L1544.
B.1 The gas-phase chemistry
One of the features of STARCHEM, and partly to allay any concerns that the results are artefacts of errors and inconsistencies in reaction rate data, is its flexibility to be able to dynamically switch between different chemistries. We consider three databases: (a) UDFA 2012 (McElroy et al., 2013), (b) UDFA 2006 (Woodall et al., 2007) and (c) KIDA 2012 (Wakelam et al., 2012). As our basis set, we use the first of these. In this study, the reaction set consists of some 1250 chemical reactions between 98 species, involving the elements H, He, C, N, O, S and a representative low ionization potential metal, Na. Molecules are limited to species composed of less than 6 atoms. The chemistry includes ion-molecule, neutral-neutral, cosmic ray ionizations and photochemical reactions as applicable to molecular clouds. Secondary (cosmic ray induced) photodissociation is also included.
In this study we made a few alterations to the reaction data. e.g. the rates given in UDFA Rate12 for the reaction
are probably anomalous (T.J. Millar, private communication):
If this were correct, then due to the strong temperature-dependence, this reaction would be a dominant contributor to the H2O formation rate (in the low temperature, gas-phase limit). Instead, we adopt the values given in the Ohio State University (OSU) database:
B.2 The Photon Dominated Region
Photochemistry clearly plays an important role in the chemical evolution of starless cores, both through gas-phase photolysis and the desorption mechanisms described below. In the outer parts of the core (pc) the mutual shielding of the H2, C and CO photodissociation and photoionization continua, coupled to the dust absorption are very important. The model includes a simulation for the photon-transmission probability in a photon dominated region (PDR). This is particularly important for the determination of the rates for H2 photodissociation, C photoionization and CO photodissociation, and hence the H/H2 and C+/C/CO transitions. This is a simplified approach that is based on accurate analytical fits (as functions of extinction and radiation field strength) to the data presented in Figures 8, 10 and 13 of Röllig et al. (2007).
The code also includes allowances for the mutual shielding effects. Specifically, the shielding by the CO photodissociation and C photoionization lines/continuum has significant implications for the photochemistry of other species; most notably N2 and CN (Rollins & Rawlings, 2012).
B.3 Freeze-out
Following Rawlings et al. (1992), the rate of change of the gas-phase fractional abundance of a species, , due to freeze-out onto the surface of grains is given by:
| (7) |
where: is the mean surface area of dust grains per hydrogen nucleon and is the grain population-averaged value of . Here is the dust to gas ratio (by number, relative to ) and the factor of 4 in this expression implicitly assumes that the grains are spherical. is the hydrogen nucleon density (cm-3), is the sticking coefficient, is the gas kinetic temperature, is the molecular mass of species in , and C is a factor which takes into account electrostatic effects for ions (assuming an average grain charge of -1); C=1 for neutral species, whilst for singly charged positive ions .
Following laboratory measurements and quantum mechanical calculations we assume that 1.0 for all species except that the possibility for the differentiation of ions and neutrals is included. It is also assumed that electrons impinge upon and stick to grains at a rate that is just sufficient to neutralise all accreted ionic species.
B.4 Desorption
Comprehensive descriptions of the various continuous desorption mechanisms are included in STARCHEM. These are: (i) thermal desorption, (ii) direct photodesorption by the (attenuated) interstellar radiation field, (iii) photodesorption driven by radiation field generated by the cosmic-ray excitation of excited states of H2, (iv) desorption due to cosmic ray heating of whole grains or ice mantle hot spots, (v) non-selective chemical desorption driven by the enthalpy of H2 formation on grains, and (vi) species-specific chemical desorption driven by the enthalpy of their formation (e.g. for H2O, NH3 etc.).
Most desorption processes involve sublimation from the surface layers of the ices that depends on the compositional structure of the ice. An ice mantle that is predominantly composed of one molecular species (e.g. H2O) may be covered by ice layers of a different composition (e.g. CO) that effectively protects the lower levels of the ice against desorption. We therefore allow for the detailed time-dependent variations of the composition in the individual ice layers, and adopt the so-called ‘three-phase’ model of the chemistry; differentiating between the gas-phase, the ‘active’ surface ice layers and the inert ice core. This implementation is described in more detail in subsection B.5.
B.4.1 Thermal desorption
The rate of thermal sublimation (per molecule) for a zeroth order process is given by:
where is the binding energy of the adsorbate, is the dust temperature and is the vibration frequency of the adsorbed molecule given by
where is the number of binding sites per unit area, and is the mass of the adsorbed particle. Typically, s-1. This implies an evaporation rate of
where is the fractional surface coverage of species and is the grain surface area per hydrogen nucleon, as described above.
The exponential dependence on the dust temperature implies a critical temperature, primarly defined by the binding energy of the adsorbate. This is rather ill-defined in ices of mixed composition although, for the dust temperature profiles given in Figure 1, thermal desorption is not expected to be important except for the most volatile species.
B.4.2 Photodesorption
The photodesorption of molecules from ices proceeds by absorption of a far-UV photon (which typically has an energy greater than the bond energy of the absorbing molecule, and very much greater than the surface binding energy of the molecule). This results either in the direct desorption of the molecule, or else its photodissociation in situ. The dissociation may be followed by the desorption of one or more of the dissociation products. Alternatively, the molecule may recombine and be chemically desorbed as a result of the energy released in the bond formation.
For H2O the process is driven by solid-state photodissociation. This has been studied, both experimentally and theoretically, in some detail (e.g. see review in van Dishoeck, Herbst & Neufeld, 2013) and in our model we include two possible photodesorption channels:
although the channel
may also be possible with lower efficiency. The laboratory (e.g. Öberg et al., 2009; Cruz-Diaz et al., 2018), theoretical (e.g. Andersson et al., 2006) and observational evidence (based on the observed OH:H2O ratio in translucent clouds, e.g. Hollenbach et al., 2009) all suggest that the yield for dissociative photodesorption is approximately twice that for non-dissociative desorption, and we split the total yield for photodesorption between these processes accordingly. Similar branchings are included for other important ice mantle components, such as methane:
The UV photons that cause the desorption can only penetrate the upper (maybe 3 or 4) monolayers of ices - with quite limited efficiency. In general, the desorption flux (cm-2) due to photodesorption is given by:
where is the photodesorption yield for species , is the fraction of binding sites in the surface layer(s) that are occupied by species (as determined from the model of the compositional structure of the ice layers) and is the photon flux, given by:
where s-1 is the standard value for the cosmic ray ionization rate. In this expression the first term accounts for direct photodesorption; photons cm-2 is the unshielded interstellar UV flux, with a scaling factor and the exponential accounts for shielding by dust. is the cosmic ray induced photon flux (from Cecchi-Pestellini & Aiello, 1992) and accounts for cosmic-ray induced photodesorption.
There are therefore three major uncertainties in quantifying the photodesorption rates: (i) the (total) yield for the process , and its dependence on the substrate where the molecule is located, (ii) the products and branching ratios of the desorption process (if dissociative), and (iii) the -dependence of the rate ().
In the case of H2O all three of these have been well studied. has been measured in the laboratory to be for pure water ices on a flat gold substrate. It seems unlikely that the same results would apply to impure, mixed ices on amorphous and morphologically complex grain surfaces. The photodesorption yields for other species, and particularly for ices of mixed composition, are poorly understood. However, it is unlikely that the photodesorption of H2O molecules would occur whilst leaving other (perhaps more volatile) species bound to the ices, particularly in ices that are predominantly composed of H2O. So, we make the simplifying assumption that the same photodesorption yield applies to all ice species, although we consider that yield to be a free parameter.
The values of are also highly uncertain and depend on the (a) the photodesorption efficiency, and (b) the dust opacity, which are both wavelength dependent. In the absence of information, we crudely assume (in common with many other studies) that the same value of for H2O applies to all other species. We recognise that this is not well justified and could result in significant errors in the gas-phase abundances determined in regions of moderate extinction ().
B.4.3 Desorption driven by cosmic-ray heating
The interaction between cosmic rays and ice-coated grains is complex and ill-defined. Cosmic ray strikes may lead to desorption in a number of ways including direct sputtering, heat-spike pressure-pulse desorption and via grain heating. At one extreme, high energy cosmic rays may be capable of totally disrupting (small) grains, whilst at the other they may simply act to heat the grains. In this study we adopt the commonly used grain heating model - in which cosmic ray impacts, that typically occurring once every Myr, result in grain heating and the rapid desorption of material from the surface layers, accompanied by efficient evaporative cooling. This is a sporadic thermal desorption process that may result either from whole grain heating or, in some cases, spot heating at the entry/exit points of the cosmic ray on the grain surface. The efficiency of the process depends on the binding energies of the molecules and the spectrum of the cosmic rays, together with the duty cycle of grain heating and cooling.
Recent studies have questioned the various assumptions that go into these models. These indicate that the previously adopted values of the effective desorption rates may have been significantly underestimated (e.g. Sipilä et al., 2019; Kalvns & Kalnin, 2020; Sipilä, Silsbee & Caselli, 2021; Rawlings, 2022) and that the sporadic nature of the process cannot easily be reduced to continuous desorption rates (Rawlings, 2022). For the ease of comparison, and to test our stated objectives, we have continued to use the updated, continuous desorption rates determined for whole grain heating. We add a note of caution concerning their validity.
With this assumption, the rates can be expressed (e.g. Hasegawa & Herbst, 1993) as:
where is the desorption rate per molecule and is the volume abundance of solid-state species .
There are several variations in the calculated values for the desorption rates. For example, by considering more localised ice mantle ‘hot spot’ heating, Bringa & Johnson (2004) calculated a rate for H2O desorption that is approximately 30 times larger than the value given in Hasegawa & Herbst (1993). We use these ‘hot spot’ values for H2O, and other species, in our model.
B.4.4 Desorption driven by H2 formation
The formation of H2 molecules on the surface of grains yields an energy equal to the bond energy of H2. A significant fraction of this energy may be deposited locally in the substrate and conducted to the rest of the grain. This energy may be sufficient to desorb other nearby molecules, non-selectively (Willacy et al., 1994; Pantaleone et al., 2021). As H2 formation occurs on the surface of grains the desorption process is limited to molecules in the surface layers. In this case, the rate of desorption (cm-3s-1) of a species is given by
where is the desorption yield for species , is the surface coverage of species , as defined above, and is the rate of (surface) H2 formation, which we determine from the hydrogen atom impingement rate on grains.
B.4.5 Desorption driven by the enthalpy of formation
We also include the selective desorption of individual molecules, driven by the enthalpy of their formation on the surfaces of bare or ice-coated grains. This is important for several species, such as H2CO and - most especially - OH and H2O. To quantify this, we use the results of Minissale et al. (2016) who determined the chemical desorption efficiencies to be %, amorphous water ice substrates respectively, and %, 80% and 30% for the OH+HH2O reaction on oxidised graphite, amorphous silicates and amorphous water ice, respectively. This dependence of the desorption efficiencies on the nature of the surface is included in the model. Additional complexities, such as the likelihood of higher desorption efficiencies from CO-rich ices (Vasyunin et al., 2017) have not yet been included in the model.
B.5 Surface chemistry
In the current version of STARCHEM we do not consider the thermodynamics and kinetics of surface chemical processes, which are dominated by the thermal hopping of hydrogen and other, light, reactive species. Instead we apply a limited and very simple realisation of the surface chemistry, and consider the fractional conversion of species, subject to empirical constraints.
Thus, all neutral molecules and radicals are allowed to stick to grains and, where appropriate, hydrogenate to saturation (e.g. C, C+, CH, CH2, CH CH4 and N, N+, NH, NH NH3 etc.). Some atomic ions (He+, Na+ and S+) are allowed to recombine and return to the gas phase, whilst all molecular ions are assumed to dissociatively recombine, with the products returned to the gas-phase. H2 formation is described using the same formalism as for other species. For the temperature-dependence of the combined sticking and reaction probability for the conversion of H to H2 we use the simple formula of Buch & Zhang (1991).
For the surface chemistry that results in the formation of H2O and CO2 we note the following: (a) H2O and CO2 are not very reactive and so can be treated as being chemically inert on dust grains, (b) Pontoppidan (2006); Garrod & Pauly (2011) suggest that CO2 is formed on a CO ice surface via the surface reaction of O or OH with CO, and (c) empirically, for Taurus cores, H2O is the dominant (observed) ice, with the CO and CO2 abundances relative to H2O being 10-40% and 20% respectively (Chiar et al., 2011).
For the oxygen chemistry, the freeze-out and surface reactions of significance are (representing solid-state species by ‘(s)’):
| (8) |
| (9) |
| (10) |
| (11) |
| (12) |
| (13) |
| (14) |
The chemical endpoint for the oxygen surface chemistry is thus dominated by water formation.
For the very low dust temperatures within starless cores, CO is much less mobile than hydrogen atoms on grains surfaces (Garrod & Pauly, 2011). So, to allow for the formation of CO2(s) (as opposed to hydrogenation products) we assume that CO2(s) is formed by the non-diffusive prompt (Eley-Rideal) reaction of gas-phase O, O+ or OH with bound CO molecules (reaction 10). The impact probability is thus proportional to the surface coverage of CO, , and the reaction efficiency is , where is the reaction probability per impact. In typical simple models of gas-grain interactions is typically adopted to account for the observed CO2:H2O abundance ratio. For the O, O+ or OH that does not react with CO, and providing the timescale for the surface residence of adsorbed oxygen atoms is greater than the hydrogen atom migration timescale over the surface, we assume that the hydrogenation reactions (11 & 12) are efficient, so that a fraction () is hydrogenated to form H2O.
A proportion of the surface-formed OH and H2O may be desorbed due to the enthalpy of formation ( and , respectively). The efficiencies of these processes are discussed and quantified in Minissale et al. (2016) and Vasyunin et al. (2017), as discussed above. Following that work, we can include formation enthalpy-driven desorption with and for formation on bare, refractory, grains and amorphous H2O ice, respectively. For O2 we assume that a fraction (, typically 1) is ultimately hydrogenated to H2O (reaction 14) via several possible chemical pathways, that we do not discuss and, again, a proportion () of this H2O is desorbed. The remaining O, O+, OH and O2 not undergoing these reactions is simply assumed to freeze out (reactions 8, 9 & 13). The binding energies (/k) for O, OH, O2 and H2O are taken to be 800K, 1300K, 1210K and 5770K, respectively, although some authors claim that the binding energy of oxygen atoms may be as high as 1660 or 1850K on amorphous ice and bare refractory grains, respectively (He et al., 2015). Our approach allows for the various poorly-defined competing processes of freeze-out, desorption, hydrogenation and more complex reactions.
For the carbon chemistry, other than CO, the dominant species in the freeze-out/hydrogenation reactions will be C/C+. The intermediate species CH has a very low binding energy (650K) and so it is likely that enthalpy-of-formation driven desorption may be important:
We treat the efficiency of this process as a free parameter ().
We should also include the hydrogenation of CO, leading to the formation of methanol (CH3OH). This appears to be a very efficient mechanism on the surface of dust grains at low temperatures (see eg. Vasyunin et al., 2017; Riedel et al., 2023). We do not, however, follow the chemistry of CH3OH in this study.
B.6 Ice composition and layering
In STARCHEM we pay careful attention to the composition of the ices and trace this composition on a microscopic, layer-by-layer basis. We recognise that both the freeze-out of gas-phase species and most desorption processes result in the addition, or removal, of the top layer(s) of the ice leaving the sub-surface layers unaffected.
This implies that, at any given time, the nature of the gas-grain interactions is determined by the structure and composition of only the surface layers. This is the only chemically active part of the ice, within which surface migration and reaction can occur; the sub-surface layers are treated as being chemically inert and, in most situations, chemically inaccessible. We do not allow for any diffusion between the layers. This is similar to the so-called ‘three phase’ approach adopted by in other studies (e.g. Taquet, Ceccarelli & Kahane, 2012). In regions where there is progressive freeze-out the sub-surface layers will be a ‘fossil record’ of the prior chemical/dynamical evolution of the cloud. Unless the ices are disrupted or sublimated, the subsurface layers are removed from the active chemistry and the net budget of accessible volatiles. This implies that, even in those situations where chemical quasi-equilibrium exists, the observed gas-phase abundances will be dependent on the prior evolution of the cloud. In addition, the composition of the surface layers may be quite different to that of the bulk ice. In these circumstances, the effect of the outer layers ‘shielding’ the inner layers against surface desorption results in significant imbalances between the gas-phase and solid-state abundances of species. This is an idea that has been explored in the context of the anomalous O2 abundances seen in comet 67/P (Rawlings, Wilson & Williams, 2019). Moreover, the compositional differentiation may also lead to significant errors in the estimation of solid-state abundances from observational data.
The determination of the composition of the ice mantles in environments where ice layers can be added or removed is a non-trivial computational exercise but is one that is essential if we want to correctly quantify the gas-grain interactions. The chemically significant parameter at any one instant is the number of surface binding sites per grain, which is given by
where is the surface density of binding sites (cm-2) or, expressed as a ‘fractional abundance of binding sites’ (i.e. the number of binding sites per hydrogen nucleon):
This parameter is, of course, not fixed and will vary from layer to layer, as the radius of the grain+ice, and hence the surface area per hydrogen nucleon () will vary as ice layers are deposited or removed. The fractional coverage of the surface layers by species is then given by
where represents the fractional abundance of species , apportioned to the surface layers.
Although this is similar to some other studies (e.g. Taquet, Ceccarelli & Kahane, 2012) we do not include some of the additional complexities of those models (e.g. the inclusion of grain porosity/lattice defects etc., as appropriate for ‘fluffy aggregate’ grain models) as there are a number of assumptions and simplifications in (all of) the ice layering models that are probably more significant. These include: (i) the assumption that dust grains are spherical, (ii) the assumption that ices form in neat, sequential, concentric, layers. It is possible that the ice layers may not stack up neatly and there may be some parts of a dust grain that have many more layers of ice than other parts, (iii) whilst the segregation of layers implies that each layer will have its own chemical composition, there is no allowance for any compositional variations within each ice layer. We might not expect polar and apolar components to be fully mixed and there may be ‘patches’ of ices with different composition and binding properties as a result, affecting both the freeze-out and desorption properties of the surface layers, and (iv) the assumption that the ice layer structure remains unaltered, other than as a result of freeze-out or desorption. This could break down, for example, in the case of energetic cosmic ray heating which acts to melt/partly sublimate the ices and hence significantly disrupt the integrity of the ice layers.
We treat each ice layer as having a (defined) constant thickness equal to the mean bond length in the ice. This allows us to calculate how the grain radius including the ice mantle (and hence the grain surface area) varies with the number of accreted layers. As the freeze-out (and surface desorption) rates are proportional to the surface area, we can see how - in a region where freeze-out dominates over desorption - the rate of freeze-out can rapidly increase (the ‘snowball effect’). The accretion of ices may have other effects whose implications we defer to a future study. These include, for example, the effective removal of the smallest grains from the grain size distribution (e.g. Silsbee et al., 2020) and variations in the refractive index and albedo of the grains.
Using the method described above, we can determine the fractions of the binding sites in the upper layers that are occupied by the different species, with the possible inclusion of additional factors, such as allowances for variations in the binding energy of key adsorbates as a function of surface layer composition. Ultimately, this allows us to calculate the surface desorption rates and the efficiencies of the surface reactions, such as those that result in the formation of H2, H2O and CO2.