Fermiology and transport properties of the candidate topological crystalline insulator SrAg4Sb2
Abstract
Compared to time-reversal symmetry-protected topological insulators and Dirac/Weyl semimetals, there are significantly fewer candidates for topological crystalline insulators. SrAg4Sb2 is predicted to exhibit topological crystalline insulator behavior when considering spin-orbit coupling. In this study, we systematically investigate single crystals of \ceSrAg4Sb2 using electrical transport and magnetic torque measurements, along with first-principles calculations. Our transport data reveals its compensated semimetal nature with a magnetoresistance up to around 700% at 2 K and 9 T. Analysis of de Haas-van Alphen oscillations uncovers a Fermi surface consisting of three distinct Fermi pockets with light effective masses. Comparison between the three-dimensional fermiology obtained from our oscillation data and the first-principles calculations demonstrates excellent agreement. This confirms the accuracy of the calculations, which indicate a band inversion centered at the point and identify the existence of nontrivial tube and needle hole Fermi pockets at , alongside one trivial diamond electron pocket at the T point in the Brillouin zone. Furthermore, symmetry and topology analysis results in two potential sets of topological invariants, suggesting the emergence of two-dimensional gapless Dirac surface states either on the planes or on both the planes and mirror planes, protected by crystal symmetries. Therefore, SrAg4Sb2 emerges as a promising candidate topological crystalline insulator.
I Introduction
In the past decade, topological crystalline insulators (TCIs) have attracted interest due to their robust topological surface states on certain high symmetry crystal surfaces. Unlike the well-known topological insulators protected by time reversal symmetry, these topological states are protected by crystal symmetries TCI ; TCIinvariants . This unique property of TCIs makes their topological property more robust against external perturbations such as magnetic fields and readily tunable through the application of strain, structural distortions, and morehsiehsnte ; tanaka-3 ; serbyn ; evelyn ; spinfiltered ; nanomembranes , providing a versatile application platform in spintronics, quantum computing, and pressure sensors applications . The first TCI, SnTe, was predicted in 2012 and has since been studied extensively hsiehsnte ; tanaka ; tanaka-2 ; GiantMR ; Transport-1 ; Transport-2 ; Transport-3 ; ARPESpump ; ARPES-1 ; ARPES-2 ; ARPES-3 . However, compared to topological insulators and Dirac/Weyl semimetals, the exploration of TCI insulator candidates is far more limited.
Guided by databases tqc ; catalog ; catalog-2 , we found that according to first-principles calculations, \ceSrAg4Sb2 can be classified as a TCI when spin-orbit coupling (SOC) is taken into account. \ceSrAg4Sb2 crystallizes in the \ceCaCu4P2-type centrosymmetric trigonal space group (No.166) with \ceSr atoms sandwiched in between layers of \ceAg2Sb, as shown in the right inset of Fig. 1. In a recent study of the electronic structure and topology of \ceSrAg4Sb2, density functional theory (DFT) calculations were performed both in the presence and absence of SOC morgan_SrAg4Sb2_bonding . In \ceSrAg4Sb2, one might expect SOC to play an important role Since SOC is most significant when heavy atoms are present. According to the calculated band structures, there are two band touching points at the and T points of the Brillouin zone that are gapped by SOC with band gaps of 0.5 eV. More specifically, the two bands immediately above the Fermi level exchange character between {Ag + Sb } and {Ag + Sb } as a function of . It is also worth noting that this is a relatively “clean” band structure catalog-2 , making \ceSrAg4Sb2 a great candidate TCI.
However, despite reports of the observation of quantum oscillations (QOs) Sr142 , there is no thorough experimental study of this compound to determine its three-dimensional (3D) fermiology to shed light on if it is indeed a TCI or not. In this paper, we report the single crystal growth, magnetotransport properties, 3D fermiology extracted from angle-dependent QOs, as well as density functional theory (DFT) calculations for \ceSrAg4Sb2. By magnetotransport measurements, we show that \ceSrAg4Sb2 is a compensated semimetal. Through the data analysis of the angle-dependent de Haas-van Alphen (dHvA) effect in magnetic torque measurements and the comparison with theoretical calculations, we are able to verify the existence of two hole pockets and one electron pocket. The excellent agreement between DFT and experiments suggests that our DFT calculations as well as the ones performed in databases tqc ; catalog ; catalog-2 correctly describe the band structure of \ceSrAg4Sb2. We further show that a band inversion centered around the T point with an avoided band crossing along the -T line exists on the mirror planes and then discuss the potential topological invariants and where the 2D Dirac surface states protected by crystal symmetries are expected. Our result provides evidence that \ceSrAg4Sb2 is a promising TCI for exploration of topological surface states protected by crystal symmetry.
II Experimental Methods
Single crystals were grown using the self-flux method srag4as2 ; euag4as2 . Sr, Ag and Sb pieces were combined using the molar ratio 1:14:7 and placed inside an alumina crucible, which was then sealed in a quartz tube under vacuum. When the growth ampule was heated to 1050 overnight for the mixture to homogenize and then allowed to slowly cool down to 650 , the growth of \ceSrAg4Sb2 single crystals was complicated by the existence of another stable, competing phase, \ceSrAgSb. Where \ceSrAgSb was sandwiched between \ceSrAg4Sb2, suggesting that SrAgSb formed first. This was confirmed by performing another trial with an increased spin-out temperature of 750 , where the relative amount of \ceSrAgSb was higher. Thus, to eliminate the presence of \ceSrAgSb, after heating the quartz tube to 1050 , we quenched it in air. It was then placed into a furnace which was at 700 , and then slowly (over 120 hours) cooled to 580 , at which point it was centrifuged to separate the single crystals from the liquid flux. By this, the presence of \ceSrAgSb was completely eliminated, as illustrated by Fig. 1. Free standing three dimensional, hexagonal single crystals of \ceSrAg4Sb2 formed, as shown in the inset of Fig. 1.
Powder X-ray diffraction measurements were performed using a PANalytical Empyrean (Cu K radiation) diffractometer. Magnetotransport measurements were performed inside a Quantum Design (QD) Dynacool Physical Properties Measurement System (PPMS) with a maximum magnetic field of 9 T. Magnetic torque measurements were performed in a QD-PPMS. Torque measurements were made by mounting a small piece of single crystal on the tip of a piezoresistive cantilever. The magnetic torque was then inferred from the magnetoresistance of the cantilever measured by a Wheatstone bridge, as the resistance of the cantilever is very sensitive to the deformation caused by torque. The electrical resistivity () and Hall () measurements were performed using the six-probe technique inside QD-PPMS. To eliminate unwanted contributions from mixed transport channels, data were collected while sweeping the magnetic field from -9 T to 9 T. The data were then symmetrized to obtain using and antisymmetrized to get using . The magnetoresistance is defined as . In our measurement geometry, a positive slope of suggests the hole carriers dominate the charge transport.
The electronic structure of \ceSrAg4Sb2 was studied via DFT calculations using the PBE functionalhohenberg ; kohn ; pbefunctional and the projector augmented wave (PAW) pseudopotential method as implemented in the Vienna Ab initio Simulation Package (VASP), version 5.4.4 blo . An approximate SOC correction implemented in VASP was used to compute the electronic properties in the first Brillouin zone vasp soc . Fermi surfaces were computed using a -mesh spacing of 0.008 (31-31-31). Fermi surface data were generated from the DFT calculations using Vaspkit and visualized with Fermisurfer vaspkit ; fermisurfer . Band structures were plotted with pyprocar version 5.6.6 pyprocar . dHvA frequencies were computed using SKEAF, with a modified file conversion program to allow SKEAF to process VASP output skeaf .
III Experimental Results and Discussion
SrAg4Sb2 has the lattice parameters = = 4.7404(4) Å, = 25.029(2) Å, = = 90o and = 120o stoyko ; Ca142 . Figure 1 shows the powder X-ray diffraction pattern where all peaks except three (marked by an asterisk) can be well indexed using the \ceSrAg4Sb2 structure. These three anomaly peaks are likely due to small amount of \ceAg3Sb droplets present on the surfaces of the crystals.
Figure 2(a) shows the temperature dependence of the resistivity of \ceSrAg4Sb2 measured at zero field and with the current in the plane. The residual resistivity ratio (RRR), defined as is 42, and the residual resistivity is . Upon cooling, the resistivity decreases with a linear behavior in the range between 300 K and 20 K, a characteristic feature of a conventional metal. Below 20 K, the resistivity exhibits the typically Fermi-liquid behavior , where = 2 FermiLiquid .
III.1 Magnetotransport Properties of \ceSrAg4Sb2
Figures 2(b) and 2(c) show the magnetoresistivity and Hall resistivity respectively with and at temperatures in the range between 2 K - 50 K. shows a nearly parabolic behavior with a moderately large MR of 700% at 2 K. Quasi-linear shows QOs in a field range of 3 T to 9 T. Large quadratic MR with quasi-linear are the characteristic features of compensated semimetals. To extract the carrier concentrations and mobilities, the data were fitted using the semiclassical two-band Drude model of transport pippard . The field dependence of and are given by
| (1) |
and
| (2) |
where , , and are the carrier densities and mobilities of electrons and holes respectively. The simultaneous nonlinear least-squares fit of and at 2 K using the above expressions yields /m3 and /m3. The ratio being approximately equal to 1 suggests that this is a compensated semimetal and consistent with the observation of large MR at low temperatures. The obtained electron and hole mobilities at 2 K are m and m. As shown in Fig. 2 (d), upon increasing temperatures, the mobilities decreases due to the enhanced thermal fluctuations while the carrier densities remains unchanged. These carrier densities and mobilities are consistent with the ones we obtained from QO data which will be discussed in the following section.
III.2 Quantum Oscillations of \ceSrAg4Sb2
| (T) | () | (m/s) | (K) | (s) | () | |||||
| 98(4) | 0.14(1) | 0.06 | 0.06(1) | 4.5(8) | 3.6(1) | 3.4(1) | 0.43(3) | 0.06(2) | ||
| 340(9) | 0.35(2) | 0.22 | 0.10(2) | 3.3(2) | 5.7(1) | 2.10(4) | 0.10(1) | |||
| 60(3) | 0.097(1) | 0.04 | 0.04(1) | 5(1) | 2.4(1) | 5.0(2) | 0.63(7) | |||
| 850(7) | 0.35(4) | 0.39 | 0.16(1) | 5.3(7) | 1.3(3) | |||||
| 420(8) | 0.27(1) | 0.25 | 0.11(2) | 4.7(9) | ||||||
| 1120(9) | 0.43(4) | 0.42 | 0.18(2) | 4.8(7) | ||||||
| 790(7) | 0.23(2) | 0.33 | 0.16(1) | 8.0(9) | ||||||
| 600(14) | 0.16(1) | 0.26 | 0.14(2) | 9.5(2) | ||||||
| 560(14) | 0.23(2) | 0.23 | 0.13(2) | 5.4(2) |
QOs are also observed in magnetic torque measurements. Figure 3(a) depicts the field-dependent at various temperatures when the magnetic field was applied 40 away from the -axis, in the plane, as shown in the inset of Fig. 3 (b). Strong QOs can be clearly seen above 3 T. Figure 3(b) shows after the subtraction of a polynomial background from . The Fast Fourier Transform (FFT) of the oscillations (Fig. 3(c)) reveal many features. One strong peak with the frequency = 98(4) T is observed, followed by three weaker peaks that are the 2nd, 3rd, and 4th higher harmonics of , respectively. Peaks with = 600(14) T, = 850(7) T, and = 1120(9) T as well as lobes surrounding and also present. To better investigate this rich FFT feature, the zoom-in plot between 700 T and 1500 T at 2 K is plotted as Fig. 3(d), where QO FFT peaks other than , and are clearly seen. The black arrows point to the exact location of the calculated values of and (. The positions of these lobes agree well with the locations of the black arrows. Frequency combinations such as this can arise from magnetic breakdown (MB) or magnetic interaction (MI). MB occurs at fields high enough such that the separation between Landau levels is larger or equivalent to Blount , where is the energy gap between the two bands and is the Fermi energy. An estimate of the magnetic breakdown field can be made through Chambers , where and are the Fermi wave vectors of the Fermi pockets contributing to the combined oscillation frequencies, respectively. Plugging in values as shown later in this section, we find that the field needed for MB to occur between the Fermi pockets associated with and is more than 400 T, suggesting this effect is a result of MI instead. MI can occur as a complication of sample shape and/or crystal anisotropy much like that seen in layered materials MagInt . Figure 3(e) summarizes the temperature-dependent FFT amplitudes of , , and . The amplitude of multiple oscillations in the magnetic torque is given by the Lifshitz-Kosevich (LK) theory as
| (3) |
where , and are constants, frequencies and phase factors of each pocket, respectivelyschoenberg . represents the thermal damping factor, which is a finite temperature correction to the Fermi-Dirac distribution. It describes the temperature dependence of the oscillations’ amplitude and is given by equation , where , is equal to T/K and is the cyclotron effective mass. is the Dingle damping factor, which is related to the quantum lifetime through the equation . = cos is the spin damping factor, which accounts for the interference between two oscillations from spin-split Landau levels. When several frequencies exist and are not easily separable, the extraction of the effective mass and the Dingle temperature can be quite challenging or even impossible by fitting the QO using Eq. (3). Alternatively, we obtain the effective mass by fitting the temperature-dependent FFT amplitude of each peak (Fig. 3(e)) using , where is the average inverse field of the FFT window from to and defined as . However, care must be taken when choosing which and to use in the analysis, as the wrong choice may lead to overestimated or underestimated values. For reasons outlined in our previous report on \ceSrAg4As2, we chose T and Tsrag4as2 . The obtained effective masses are , , and . Despite there being many frequencies present, the peak dominates the oscillation, resulting in the exponential decaying oscillation amplitude with increasing as shown in Fig. 3(b). The maximum peak intensity at 2 K in Fig. 3(b), , as well as the corresponding field are recorded and plotted in Fig. 3 (f). By fitting this Dingle plot with where is the fitting parameter, we are able to extract a Dingle temperature of (2 K) = 3.6(1) K. From this we calculate the quantum lifetime to be (2 K) = s. Using = we estimate the quantum mobility associated with the pocket to be m. Similar analysis is performed for the QO data at various temperatures and with the field along the [120] and [001] directions. The obtained effective masses alongside the DFT computed ones are summarized in table 1. The obtained s are angle-dependent, which is expected for anisotropic Fermi pockets. ranges from 0.63(7) m when holes move in the plane to 0.10(1) m when holes move perpendicular to the [120] direction, as expected for a compound with layered structure. The exacted quantum mobility associated with the pocket when the field is along the [001] direction monotonically decreases upon warming, as plotted in Fig. 2(d). The hole mobility extracted using the two-band model fitting, 0.35(6) m, is an average of the classical mobilities for all hole pockets. It is comparable to the ones obtained from QO, indicating that the impact of small angle scattering is likely negligible Cd3As2 .
Since QO frequency is directly proportional to the extreme cross sectional area () of the Fermi surface perpendicular to the magnetic field through the Onsager relation schoenberg , to reconstruct the Fermi pockets, we utilized angle-dependent magnetic torque measurements to obtain the angular dependence of the extreme cross sectional area of each Fermi pocket. The sample was rotated from to in the plane, as well as in the plane to the crystallographic axis. Rotation in these two planes allows for the experimental determination of the 3D fermiology of the material. A contour plot of the frequencies extracted via FFT of can be seen in Fig. 4(a). The left panel illustrates rotation in the plane where four branches of the fundamental dHvA frequencies (, , , and ) and a set of three harmonic frequencies of are observed (dashed lines are a guide for the eye). In the right panel where the rotation is in the plane, only two fundamental frequencies ( and ) are observed with being angle independent.
III.3 Comparison to DFT calculations
To understand the angular dependence of QO, DFT calculations were performed and the results were compared to the measured dHvA data. We first optimized the structure of \ceSrAg4Sb2 and found good agreement with experimentstoyko ; morgan_SrAg4Sb2_bonding . We then computed the band structure and Fermi surface, shown in Fig. 4(b) and (c). The computed Fermi surface contains three features: the needle pocket, a long, closed hole pocket oriented along ; the tube pocket, a continuous distorted cylinder oriented along which encloses the needle pocket; and the diamond pocket, a set of three rounded-diamond-shaped electron pockets centered at the F points on the faces of the 1st Brillouin zone. Solid lines on Fig. 4(a) are the DFT-computed dHvA frequencies corresponding to the three Fermi pockets. We find excellent agreement in the angular dependence. The minimum in in the sweep occurs when the field is oriented along , i.e. along the length of the needle pocket (Fig. 4(c)), and the maximum appears when the field is aligned along , perpendicular to the needle pocket. is independent of angle in the sweep because of the rotational symmetry of the needle pocket. and , the frequencies arising from the tube pocket, behave similarly, diverging as the field is rotated from to . Because the tube is continuous in the direction and has infinite extreme cross section perpendicular to the plane (Fig. 4(c)), it is expected that the frequency corresponding to the tube pocket can not be seen when the field rotates within the plane. This is indeed what we have observed in the right panel of Fig. 4(a). The multiplicity and lower symmetry of the diamond pocket create the more complex profiles in both and sweeps.
Despite excellent agreement in angular dependence, a scaling factor of 0.7 is needed to maximize the quantitative similarity between the experimental and computed values of the extreme cross sections. Small quantitative deviations can occur due to the approximate nature of DFT, particularly when computing flat bands close to the Fermi level skeaf . Furthermore, in a previous study of \ceNbAs2, a similar deviation was observed and attributed to As vacancies or imperfections that may lead to subtle relative shifts in bands NbAs2 . Crystalline defects, despite being low in \ceSrAg4Sb2stoyko , could contribute to the difference here since even small shifts can lead to sizable changes in small pockets. With these factors in mind, we conclude that the essential features of the Fermi surface are correctly described by our DFT calculations.
Based on our QO data and the shape of Fermi surface determined from DFT, we can estimate the hole carrier densities associated with the tube pocket and the needle pocket. For the tube pocket, according to the Onsager relation and assuming circular cross sections, the Fermi wave vector are and with the Fermi velocities valued at and , where values T, T, and are used. Approximating the tube as a cylinder with a radius and a height , the carrier density is estimated to be m-3. We can calculate the carrier density associated with the needle pocket by approximating it as a prolate spheroid. The Fermi wave vectors are along the minor axis and along the major axis with the Fermi velocity of and , where T, T, , and are used. The carrier density is thus estimated as m-1 and the total hole carrier density obtained from QO is m-3, this rough estimation agrees with m-3 reasonably well.
| Weak | |||||
|---|---|---|---|---|---|
| 111 | 0 | 1 | 1 | 1 | 1 |
| 111 | 2 | 0 | 0 | 1 | 0 |
IV Discussion
The excellent agreement between experiments and DFT calculations suggests the latter correctly describe the band structure of \ceSrAg4Sb2. Now let us take a closer look at the electronic band structure of \ceSrAg4Sb2, as shown in Fig. 4(b) and supplemental Fig. S1 (a). Most of the bands near are dominated by Sb orbitals with contributions from the Ag orbitals, which is consistent with Sb being an anion with filled and orbitals. Above , the contributions of Sb are highly -dependent. Meanwhile, Sr, a closed-shell cation with little covalency, contributes very little to the bands close to . Figure 4(d) shows the computed Fermi surface of \ceSrAg4Sb2 with projections onto Sb and Agtrig orbitals. Sb 5 and Agtrig 4 orbitals dominate the body of the needle pocket (near T point), while the tip of the needle pockets (near point) is mainly composed of Sb 5 and Agtrig 5 orbitals. The needle pocket thus arises predominantly due to orbital interactions in the plane, although near the tips the pocket has more character. The tube pocket is predominantly composed of Sb 5 and Agtrig 4 orbitals, like the body of the needle pocket. The diamond pocket, on the other hand, has stronger \ceAg^tet character. The quasi-cylindrical shapes of the tube pocket and the needle pocket are consistent with the fact that they arise primarily from in-plane interactions in the layered structure of \ceSrAg4Sb2, while the diamond pockets likely arise from more isotropic interactions. The compositions also give us a chemical intuition for the charge transfer processes at work in \ceSrAg4Sb2 - the needle and tube hole pockets are primarily composed of Sb, a formal 3- anion, and the diamond electron pockets are primarily composed of \ceAg^tet, a formal 1+ cation, so charge transfer of electrons from Sb to \ceAg^tet occurs.
The most important feature in the band structure is an avoided crossing between the two bands marked by a dashed oval slightly above along the -T line (Fig. 4(b)), which lies in the mirror plane. It has been previously shown to be part of a band inversion, a significant feature for topological materials morgan_SrAg4Sb2_bonding . To characterize the symmetry properties of the band inversion we have used the irvsp code irvsp . and T both have point symmetry, the highest possible point symmetry in the space group. Since SOC is required to form the band inversion we must describe the band symmetries with double groups, rather than the usual point groups. At the needle band transforms as and the tube band transforms as , while at T (in the inverted state) they are the other way around. Points between and T have point symmetry, and both bands transform as . Since the bands have the same symmetry at the intermediate points, they mix and avoid each other, rather than crossing, which creates the band inversion. The band inversion leads to the -dependent changes in orbital composition shown in Fig. 4(d).
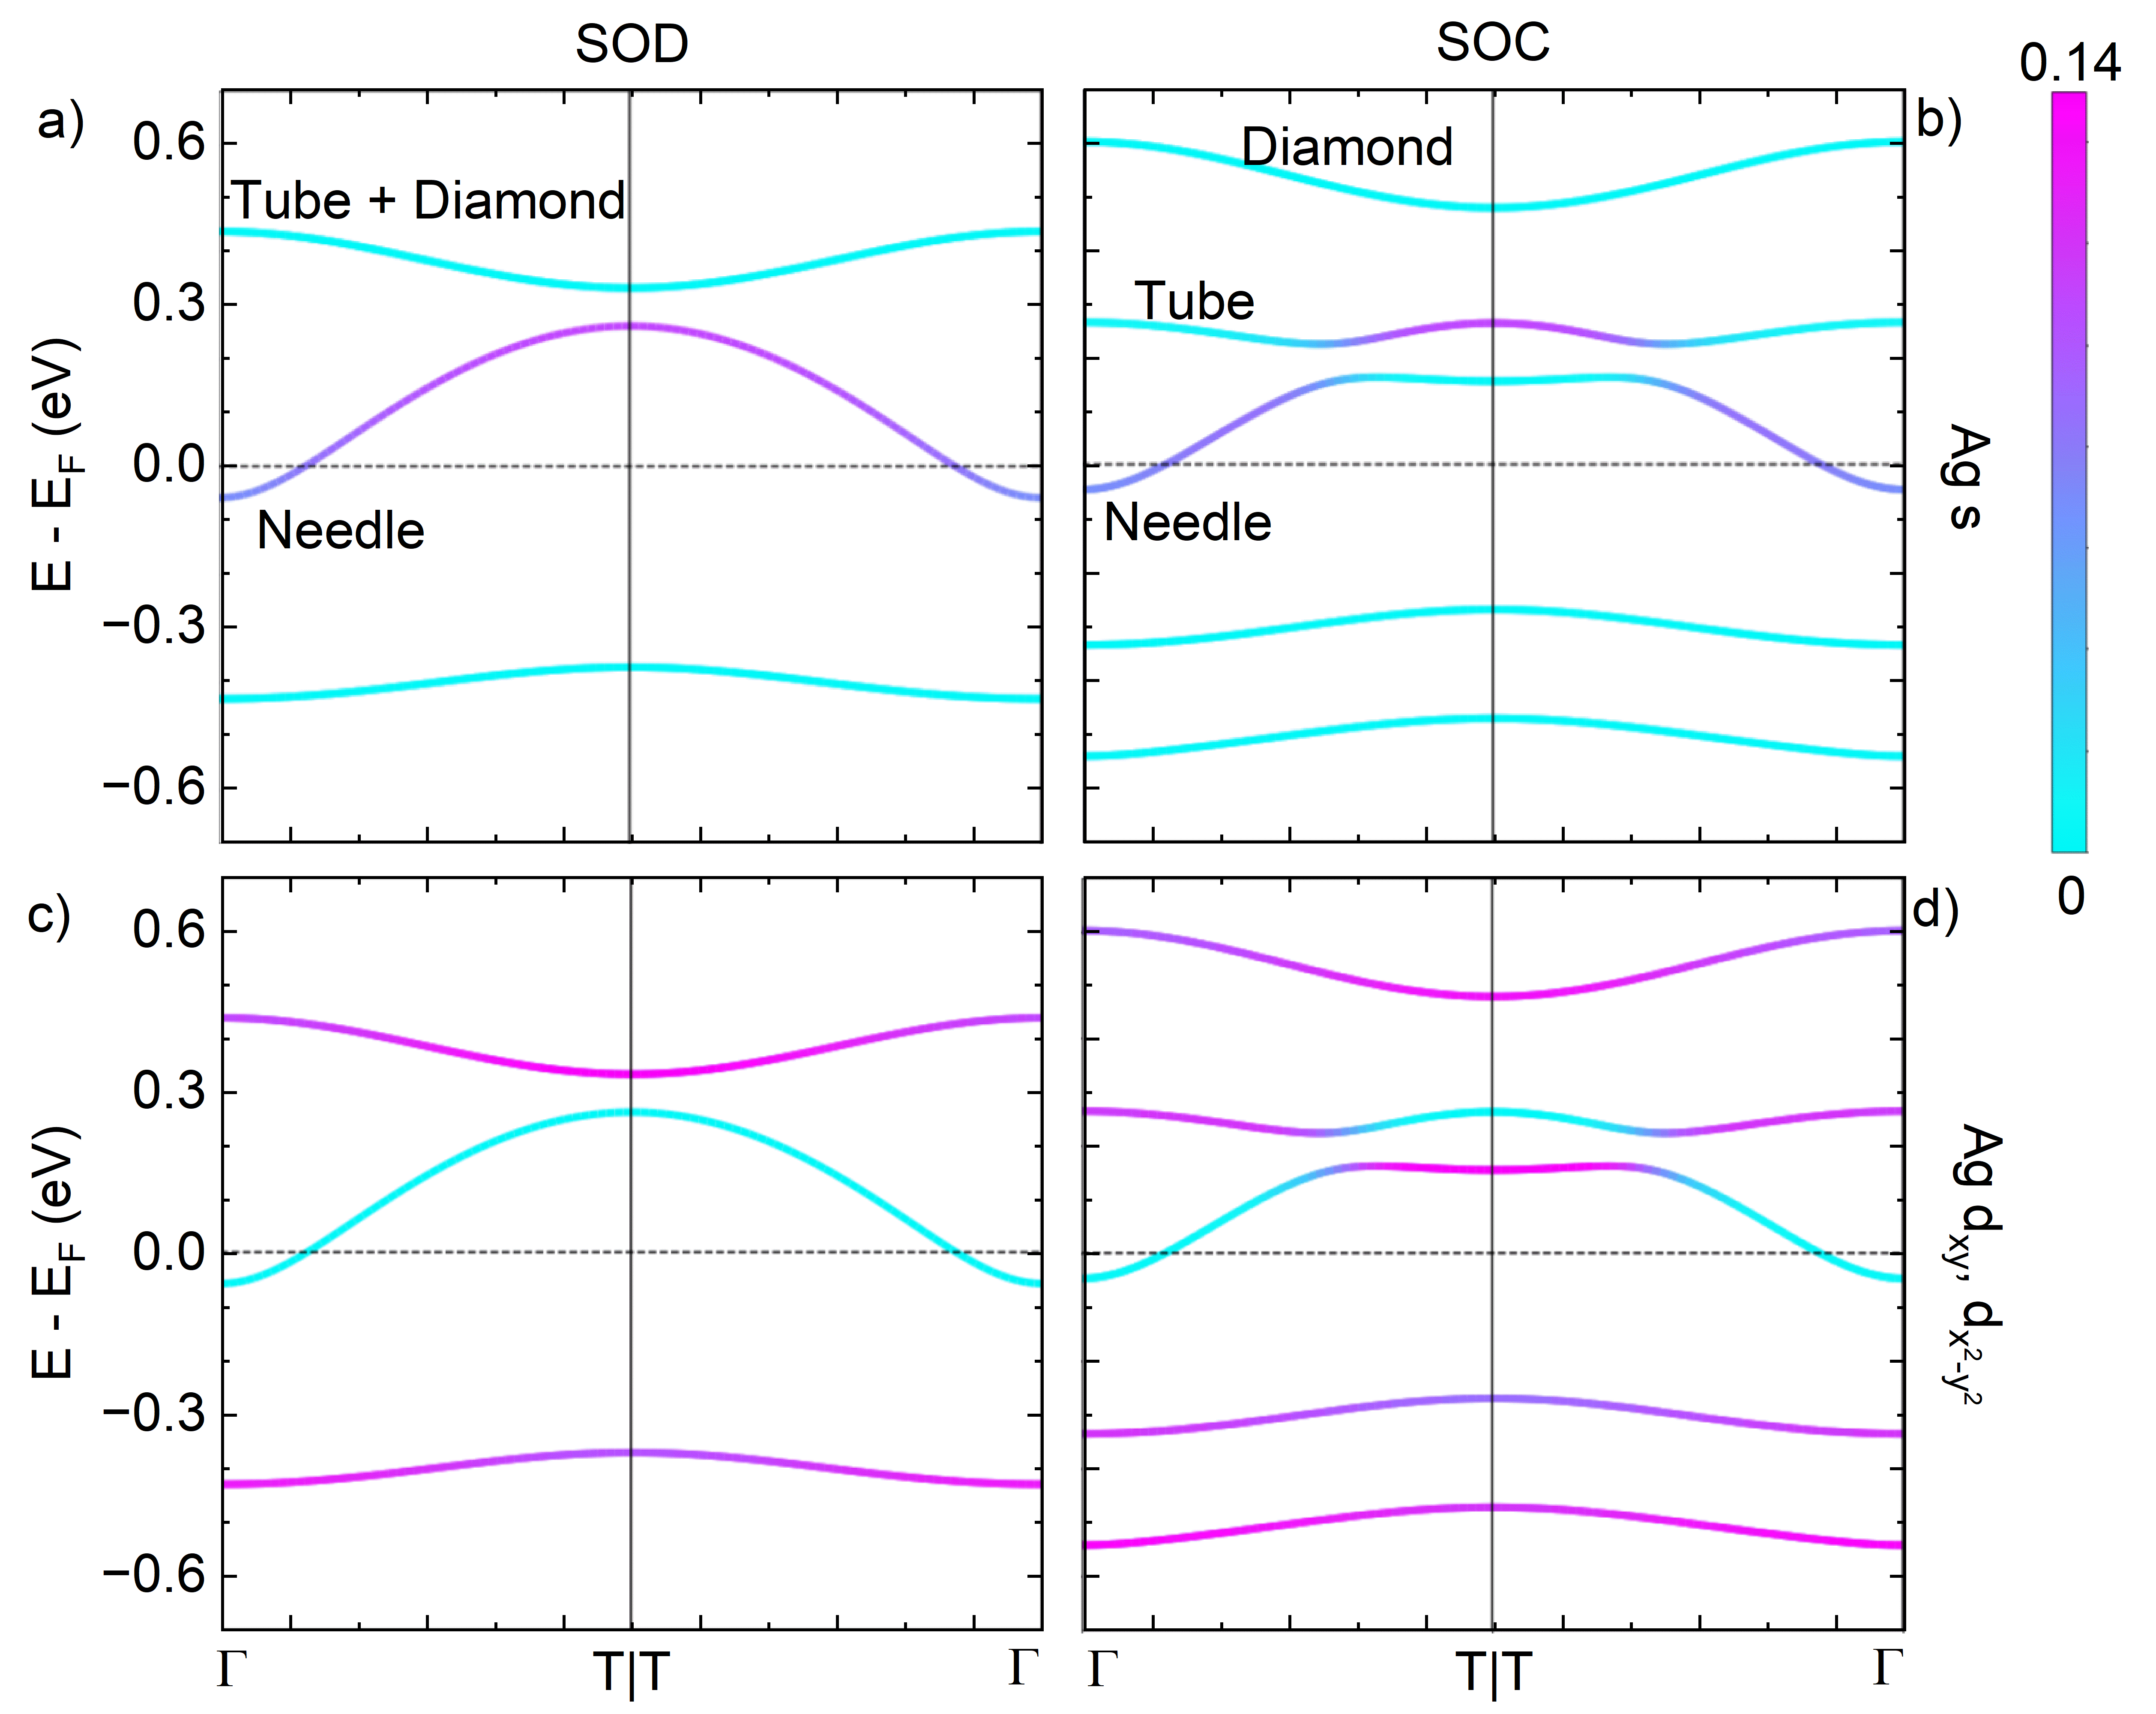
To check where the band inversion occurs, we projected the band structures onto the atomic orbitals. The band inversion is shown in detail in the projected band structures along the -T- path in Fig. 5, where the projections are onto Ag 5 and Agtrig 4. The left column (fig. 5 (a) and (c)) show the bands when they are spin orbit decoupled (SOD) and the right column (fig.5 (b) and (d)) illustrates the changes to the bands when SOC is taken in to account. In the SOD regime, the lower band, which is below at , forms the needle pocket, and the upper band forms the tube and diamond pocket. When SOC is activated, the upper band splits, resulting in a decrease and increase in energy of the tube and diamond bands, respectively. This leads to a distinct band inversion centered at T, formed between the tube and needle bands.
Materials in the space group are characterized by four symmetry-based indicators, = {1, 1, 1, 2} TCIinvariants ; tqc . Odd values associated with suggests a strong TI, however, for the case of \ceSrAg4Sb2, = 2, thus excluding the possibility of being a strong TI. To further comprehend this, we repeated the symmetry analysis for the SOD electronic structure and found that the symmetry relationships between the bands transform as different irreps at and T but the same at all intermediate points. SOC therefore creates the band inversion by influencing the band energies but not their symmetries. The symmetry consequences of SOC are a necessary ingredient for a time-reversal-symmetry protected topological insulator but not for a TCI TIs colloquium , so this analysis further supports the claim that \ceSrAg4Sb2 is a TCI with SOC.
By mapping the symmetry-based indicator to topological invariants, two possible sets of topological invariants exist, as shown in table 2. The first set states that the mirror Chern number , while the hourglass invariant , the rotation invariant , the inversion invariant and the screw invariant . This set of invariants indicate 2D Dirac surface states are protected by two-fold rotational symmetry and exist on the (), (110), and (1) planes; 2D Dirac surface states that are protected by glide symmetry occur on the plane. The second set states that the mirror Chern number and the inversion invariant . In this case, 2D Dirac surface states only exist on the plane and are protected by mirror symmetry. From the symmetry-based indicator, it is unclear which set \ceSrAg4Sb2 takes unless is calculated. For example, in the proposed TCI candidate Bi, the symmetry-based indicator suggests it either has a non-zero mirror Chern number or a non-zero rotation invariant . And further calculations suggest the latter is the case in the real material Bi .
Last but not least, although \ceSrAg4Sb2 is topologically categorized as a TCI, it is an electronic conductor, having a bulk Fermi surface. This aspect of \ceSrAg4Sb2 is discussed in previous work and coined the term “semimetallic topological insulator”morgan_SrAg4Sb2_bonding . This property is not unique or new; the same issue was noted for the Bi-Sb alloy system in a landmark paper on time-reversal-symmetry protected topological insulators TIs inversion sym and has also been discussed for \cePbTaSe2 which is a superconducting topological insulator, featuring a continuous gap with multiple band crossings rather than a global gap at the Fermi level PbTaSe2 .
V Conclusion
In summary, we have grown high quality single crystals of the TCI candidate \ceSrAg4Sb2 and investigated its magnetotransport properties and 3D fermiology. From our magnetotransport measurements, we find a moderately large MR of 700. From the two-band model fitting we show holes and electrons to posses similar concentrations at low temperatures, suggesting that this is a compensated semimetal. Quantum oscillations are observed in both Hall and magnetic torque measurements. The temperature dependence of the dHvA oscillations reveals small effective masses associated with the Fermi pockets. The angle dependence of the dHvA data shows great agreement with the DFT calculations. Through the analysis of dHvA oscillations and comparison with first-principles calculations, we have demonstrated \ceSrAg4Sb2 to have a band inversion centered around the T point and contain one needle hole pocket centered at the T point, one tube hole pocket centered at the point and a diamond pocket at the F point. Two sets of topological invariants are possible for \ceSrAg4Sb2, suggesting that it is a TCI candidate with the 2D Dirac surface states either on the planes or on both planes and mirror planes, which are all as-grown single crystal surfaces. Further angle-resolved photoemission spectroscopy measurements and theoretical works are urged to confirm its topological properties.
Acknowledgments
Work at UCLA was supported by the U.S. Department of Energy (DOE), Office of Science, Office of Basic Energy Sciences under Award Number DE-SC0021117 to N.N., and the Brown Science Foundation award 1168 to A.N.A.
References
- (1) L. Fu, Phys. Rev. Lett. 106, 106802 (2011)
- (2) Z. Song, T. Zhang, Z. Fang, and C. Fang, Nat Commun 9, 3530 (2018).
- (3) T. H. Hsieh, H. Lin, J. Liu, W. Duan, A. Bansil, and L. Fu, Nat. Commun. 3, 982 (2012).
- (4) Y. Tanaka, T. Sato, K. Nakayama, S. Souma, T. Takahashi, Z. Ren, M. Novak, K. Segawa, and Y. Ando, Phys. Rev. B 87, 155105 (2013).
- (5) M. Serbyn and L. Fu, Phys. Rev. B 90, 035402 (2014).
- (6) E. Tang and L. Fu, Strain-Induced Partially Flat Band, Nat. Phys. 10, 964 (2014).
- (7) J. Liu, T. H. Hsieh, P. Wei, W. Duan, J. Moodera, and L. Fu, Nat. Mater. 13, 178 (2014).
- (8) X. Qian, L. Fu, and J. Li, Nano Res. 8, 967 (2015).
- (9) Q. Wang, F. Wang, J. Li, Z. Wang, X. Zhan, and J. He, Small 11, 4613 (2015).
- (10) Y. Tanaka, Z. Ren, T. Sato, K. Nakayama, S. Souma, T. Takahashi, K. Segawa, and Y. Ando, Nat. Phys. 8, 800 (2012).
- (11) Y. Tanaka, T. Shoman, K. Nakayama, S. Souma, T. Sato, T. Takahashi, M. Novak, K. Segawa, and Y. Ando, Phys. Rev. B 88, 235126 (2013).
- (12) F. Wei, X. P. A. Gao, S. Ma, and Z. Zhang, physica status solidi (b) 256, 1900139 (2019).
- (13) A. A. Taskin, F. Yang, S. Sasaki, K. Segawa, and Y. Ando, Phys. Rev. B 89, 121302(R) (2014).
- (14) B. A. Assaf, F. Katmis, P. Wei, B. Satpati, Z. Zhang, S. P. Bennett, V. G. Harris, J. S. Moodera, and D. Heiman, Applied Physics Letters 105, 102108 (2014).
- (15) R. Akiyama, K. Fujisawa, T. Yamaguchi, R. Ishikawa, and S. Kuroda, Nano Res. 9, 490 (2016).
- (16) H. Ito, Y. Otaki, Y. Tomohiro, Y. Ishida, R. Akiyama, A. Kimura, S. Shin, and S. Kuroda, Phys. Rev. Research 2, 043120 (2020).
- (17) C.-H. Yan, H. Guo, J. Wen, Z.-D. Zhang, L.-L. Wang, K. He, X.-C. Ma, S.-H. Ji, X. Chen, and Q.-K. Xue, Surface Science 621, 104 (2014).
- (18) Y. Zhang, Z. Liu, B. Zhou, Y. Kim, L. Yang, H. Ryu, C. Hwang, Y. Chen, Z. Hussain, Z.-X. Shen, and S.-K. Mo, Journal of Electron Spectroscopy and Related Phenomena 219, 35 (2017).
- (19) P. Dziawa, B. J. Kowalski, K. Dybko, R. Buczko, A. Szczerbakow, M. Szot, E. Ausakowska, T. Balasubramanian, B. M. Wojek, M. H. Berntsen, O. Tjernberg, and T. Story, Nature Mater 11, 1023 (2012).
- (20) B. Bradlyn, L. Elcoro, J. Cano, M.G. Vergniory, Z. Wang, C. Felser, M.I. Aroyo, and B.A. Bernevig, Nature 547, 298 (2017).
- (21) M.G. Vergniory, L. Elcoro, C. Felser, N. Regnault, B.A. Bernevig, and Z. Wang, Nature 566, 480 (2019).
- (22) T. Zhang, Y. Jiang, Z. Song, H. Huang, Y. He, Z. Fang, H. Weng, and C. Fang, Nature 566, 475 (2019).
- (23) H. W. T. Morgan, W. T. Laderer, and A. N. Alexandrova, Chem. Eur. J. e202303679 (2023)
- (24) Y. Nie, W. Tu, Y. Yang, Z. Chen, Y. Wang, S. Pan, M. Mei, X. Zhu, W. Lu, W. Ning, and M. Tian, Applied Physics Letters 123, 163101 (2023)
- (25) B. Shen, E. Emmanouilidou, X. Deng, A. McCollam, J. Xing, G. Kotliar, A. Coldea, and N. Ni, Phys. Rev. B 98, 235130 (2018).
- (26) B. Shen, C. Hu, H. Cao, X. Gui, E. Emmanouilidou, W. Xie, and N. Ni, Phys. Rev. Materials 4, 064419 (2020)
- (27) S. S. Stoyko, M. Khatun, C. Scott Mullen, and A. Mar, J. Solid State Chem. 192, 325 (2012).
- (28) P. Hohenberg and W. Kohn, Phys. Rev. 136, B864 (1964).
- (29) W. Kohn and L. J. Sham, Phys. Rev. 140, A1133 (1965).
- (30) J. P. Perdew, K. Burke, and M. Ernzerhof Phys. Rev. Lett. 77, 3865 (1996)
- (31) P. E. Blochl, Phys. Rev. B 50, 17953 (1994).
- (32) S. Steiner, S. Khmelevskyi, M. Marsmann, and G. Kresse, Phys. Rev. B 93, 224425 (2016)
- (33) V. Wang, N. Xu, J. C. Liu, G. Tang, and W. T. Geng, Comput. Phys. Commun. 267, 108033 (2021)
- (34) M. Kawamura, Comput. Phys. Commun. 239, 197 (2019)
- (35) U. Herath, P. Tavadze, X. He, E. Bousquet, S. Singh, F. Munoz, and A. H. Romero, Comput. Phys. Commun. 251, 107080 (2020)
- (36) P. M. C. Rourke, and S. R. Julian, Comput. Phys. Commun. 183, 2, 324 (2012)
- (37) A. Mewis, Z. Naturforsch., B 35, 942, 942-945 (1980).
- (38) L. D. Landau, I. Y. Pomeranschuk, Soviet Phys. JETP 7, 379 (1937)
- (39) A. B. Pippard, Magnetoresistance in Metals (Cambridge University Press, Cambridge [England]; New York, 1989).
- (40) E. I. Blount, Phys. Rev. 126, 1636 (1962).
- (41) R. G. Chambers, Proc. Phys. Soc. 88, 701 (1966).
- (42) J. H. Condon, Phys. Rev. 145, 526 (1966).
- (43) D. Shoenberg, Magnetic Oscillations in Metals (Cambridge University Press, Cambridge, 1984).
- (44) A. Narayanan, M. D. Watson, S. F. Blake, N. Bruyant, L. Drigo, Y. L. Chen, D. Prabhakaran, B. Yan, C. Felser, T. Kong, P. C. Canfield, and A. I. Coldea, Phys. Rev. Lett. 114, 117201 (2015).
- (45) B. Shen, X. Deng, G. Kotliar, and N. Ni, Phys. Rev. B 93, 195118 (2016)
- (46) J. Gao, Q. Wu, C. Persson, and Z. Wang, Comput. Phys. Commun. 261, 107760 (2021)
- (47) M. Z. Hasan and C. L. Kane, Rev. Mod. Phys. 82, 3045 (2010)
- (48) C.-H. Hsu, X. Zhou, T.-R. Chang, Q. Ma, N. Gedik, A. Bansil, S.-Y. Xu, H. Lin, and L. Fu, Proceedings of the National Academy of Sciences 116, 13255 (2019).
- (49) L. Fu and C. L. Kane, Phys. Rev. B. 76, 045302 (2007)
- (50) T.-R. Chang, P.-J. Chen, G. Bian, S.-M. Huang, H. Zheng, T. Neupert, R. Sankar, S.-Y. Xu, I. Belopolski, G. Chang, B. Wang, F. Chou, A. Bansil, H.-T. Jeng, H. Lin, and M. Z. Hasan, Phys. Rev. B 93, 245130 (2016)