Meta-GGAs vs. Hybrid Functionals for Point Defects: The Best of Both Worlds Applied to Layered MnO2, NiO2 and KCoO2
Abstract
Defects in a material can significantly tune its properties and enhance its utility. Hybrid functionals like HSE06 are often used to describe solids with defects. However, geometry optimization using hybrid functionals (e.g., HSE06), often used to describe solids with defects, is challenging for a large supercell, as needed for defect study. The proposed r2SCAN+rVV10+U+ method, which is computationally much cheaper and faster than hybrid functionals, can successfully describe defects in materials with the proper choice of U (for the d orbitals of the host atom) and (for those of the defect atom), as shown here for small polarons in layered transition-metal oxides. We use a literature value of U or appropriate to a given transition-metal ion and its oxidation state. The materials MnO2 and NiO2, with one K atom intercalated between layers in a supercell, are found to have one localized occupied eg state on the transition metal ion that takes an electron from the K atom, when the geometry is calculated as above, for standard U values but not for U==0. K-intercalated KCoO2 is surprisingly different, due to a dramatic change of electronic configuration of the defected Co+2 ion.
I Introduction
This work is part of a larger project to predict computationally which layered materials with which patterns of alkali-atom intercalation are promising candidates for catalysis of the oxygen evolution reaction in water splitting for clean hydrogen fuel. Earlier workPeng et al. (2017); Ding et al. (2021) showed the importance of small-polaron defects formed by transfer of an electron from an alkali atom to a neighboring transition-metal ion. Calculation of the polaron requires a nonlocal density functional for the exchange-correlation energy, and geometry optimization in a large supercell. We found that hybrid functionals as used in Ref.Peng et al. (2017) are too expensive for a broad materials search. In this article, we show that an alternative r2SCAN+rVV10+U+ approach can achieve comparable accuracy at much lower cost. This approach may be useful for other point defects in other materials. We also found that, while one intercalated K atom creates one localized electron in the energy gap of layered MnO2 and NiO2, it can create four in layered KCoO2. We further found that, while r2SCAN needs a +U correction to create a polaron in MnO2 and NiO2, it does not need one in KCoO2. Our broader computational and experimental materials search is now underway.
Various types of defects exist in solids, and defects in solids can influence numerous important properties like electrical conductivity, reactivity, and magnetic or optical properties. For example, defects like polarons in transition metal oxides (TMOs) favor the Oxygen Evolution Reaction (OER)Peng et al. (2017); Ding et al. (2021). Leveraging defects as a tool allows fine tuning of the electronic properties of materials, making the understanding of defects in materials a pivotal area of research.
The computational design and study of such materials using first-principles density functional theory (DFT)Hohenberg and Kohn (1964); Kohn and Sham (1965) offer valuable early insights. However, studying defects using first-principle DFT presents challenges, as density functional approximations (DFAs) introduce self-interaction error (SIE). Popular DFAs such as LDA/GGA/meta-GGA tend to underestimate the Perdew-Parr-Levy-Balduz (PPLB) Perdew et al. (1982) straight line condition, leading to inaccuracies in describing charge transfer that are reduced but not eliminated in that sequence of functionals. Given that defect studies require proper charge transfer, DFAs often fall short in accurately portraying defects in a system.
However, hybrid functionals, which combine a fraction of exact exchange, such as HSE06 which utilizes 25% exact exchange and 75% PBE exchange in the short range along with full PBE exchange in the long range, experience less SIE and provide a more accurate description of the electronic structure of materials. Hybrid functionals have been successfully employed in studying defects in solids. For instance, Peng et al. Peng et al. (2017) effectively investigated polaron-like defects in birnessite. Nevertheless, the inclusion of exact exchange in hybrid functionals renders them computationally expensive. The structural relaxation using hybrid functionals becomes particularly costly for a reasonably sized supercell with localized defects, with computational expenses rapidly escalating as the supercell size increases to better simulate defects. Consequently, the structural optimization of large supercells becomes exceedingly challenging, and at times almost impossible. Another challenge associated with hybrid functionals is that the universal exact-exchange mixing parameter is not determined through any exact condition, nor is the range-separation parameter in range-separated hybrids Sun et al. (2016). Peng et al. determined a mixing parameter of 0.22 to study defects in birnessite using HSE06 Peng et al. (2017), deviating from the original value of 0.25. Additionally, determining a mixing parameter for semiconductors that may not be suitable to metals or insulators Henderson et al. (2011) adds to the challenge of finding an appropriate parameter for the system under study when employing hybrid functionals.
Furness et al. (2020a) is a recently developed meta-generalized gradient approximation that reinstates exact constraint adherence to rSCAN Bartók and Yates (2019), preserving the numerical efficiency of rSCAN while simultaneously restoring the transferable accuracy of SCAN Furness et al. (2020b). Several studies have demonstrated that SCAN predicts geometries and other properties as well as or even better than hybrid functionals. Sun et al. Sun et al. (2016) showed that SCAN accurately predicts geometries and energies of diversely bonded materials and molecules, matching or surpassing the accuracy of computationally expensive hybrid functionals. Another study by Saÿnick and Cocchi on cesium-based photocathode materials and reported excellent performance of SCAN and HSE06 for both structural and electronic properties Saÿnick and Cocchi (2021). A recent paper on the arXiv Wickramaratne and Lyons reports that, while SCAN may not reliably describe the properties of deep defects and small polarons in several semiconductors and insulators, it yields remarkably good agreement with experimental structural parameters for materials like ZnO, GaN, and NaF. Additionally, a study by Varadwaj and Miyake on the geometrical, electronic, and optical properties of vanadium dioxide found that SCAN and SCAN-rVV10 can adequately predict the most important geometrical and optoelectronic properties of Varadwaj and Miyake (2022). Numerous related studies further support the idea that SCAN successfully describes the structure and other properties of materials. Given that closely agrees with SCAN in accuracy, we assume that would exhibit similar accuracy in the aforementioned studies.
By construction, can exhibit very small or negligible SIE (as reflected by its smaller Hubbard U correction) and performs at the level of hybrid functionals but demands less computational resource and time. In this study, we demonstrate that the functional can effectively describe the defects in materials at the level of the hybrid functional HSE06, or possibly even better. Here, U represents the Hubbard U correction of Anisimov and collaboratorsAnisimov et al. (1991, 1993); Solovyev et al. (1994), applied to transition metal sites other than the defect site, while is the correction applied to the defect site. Cococcioni and de Gironcoli Cococcioni and de Gironcoli (2005) showed that the +U correction can be regarded as a many-electron self-interaction correction that, like the PPLB condition Perdew et al. (1982), penalizes non-integer electron number on a localized orbital to which it is applied.
Additionally, vdW denotes the long-range van der Waal’s correction. In our approach, we utilize rVV10Vydrov and Voorhis (2010); Sabatini et al. (2020) to account for this interaction, which importantly reduces inter-layer spacing. In many of our calculations, including HSE06 without vdW, we use the supercell volume and shape from , although we can as a check relax the internal coordinates with HSE06.
Transition metal ions, which serve as a site for defect formation in solids, are in different oxidation states (OS) than otherwise-identical ions. For example, in a K-intercalated , the polaronic Mn site is in the +3 OS and the remaining Mn ions are in the +4 oxidation statePeng et al. (2017); Ding et al. (2021). Ions in different OS have different numbers of d electrons. Reference Long et al. (2020) reports that the ideal U correction decreases with increasing OS, which is attributed to a lower number of exchange interactions among fewer d electrons in a higher oxidation state. This behavior has been observed and reported for vanadium ions Long et al. (2020).
However, this situation is not universal, as we can see that U values for Mn for are 1.5 eV, 2.1 eV and 1.8 eV for Mn ions with average oxidation states +3.5, +2.5 and +2.33 respectively Swathilakshmi et al. (2023). Here we see that Mn in the +2.5 average OS needs more U correction than Mn in the +2.33 average OS, which does not follow the trend observed for vanadium, but at least U for Mn in the +3.5 average OS supports the trend. However it’s obvious for the Mn oxide system that Mn ions in different oxidation states need different U corrections. It is also important to note that U = 1.8 eV, determined for Co ions for SCAN using the oxidation reaction CoOCo3O4 where Co ions are in +2 and +2.67 oxidation states, wrongly predicted to be non-metallic Long et al. (2020). However SCAN without U correction correctly predicted (+4 oxidation state) to be metallic Long et al. (2020). Thus the U value can vary with the oxidation state of ions in the system. This indicates that if a system has transition metal ions in different OS, the proper way to describe such a system would be by applying different U corrections to the transition metal ions based on their OS. This could be because DFAs make different SIE for ions in different OS.
Here we present a successful study of defects in solids by the double U correction method, where Ud is the U correction applied to the defect site and U is the U correction applied to remaining sites as required for the system. Since U generally increases with decreasing OS, and defect sites are typically in a lower oxidation state, we expect , although exceptions are possible.
One can use the geometry and the HSE06 hybrid functional orbital energies to leverage the best features of the hybrid functional. It appears that employing the full and/or HSE06 using geometry is a state-of-the-art method for studying defects in solids.
II Results and Discussion
We choose three layered TMOs, , , and for our study. Transition metal and oxygen ions in these TMOs are arranged in MO6 (where M=Ni, Mn, Co) octahedron patterns. Inserting an alkali metal ion between the layers creates a polaronic defect, specifically a Jahn-Teller electron small polaron [1]. This defect has been studied in birnessite () using the HSE06 functional [1]Bunting et al. (2018).
II.1 Layered MnO2
First, we calculated the one-electron density of states (DOS) for both the pristine and a K-intercalated birnessite using the HSE06 functional with an exact exchange mixing parameter () of 0.22 to reproduce the work of Peng et al. Peng et al. (2017). Comparing Figures 1A and 1B in the current work with Figures 2B and 2C of Peng et al Peng et al. (2017), we conclude that we have successfully reproduced the latter’s figures 2B and 2C. We found the band gap of pristine birnessite to be 3.4 eV. We observed similar effects upon intercalation of a potassium (K) ion, as observed by Peng et al. Peng et al. (2017). In Figure 1B, a K-intercalated birnessite exhibits the shifting of Mn(III) d-states to higher energy, a polaronic peak at the conduction band (CB) edge, and a break in spin symmetry of the total DOS in the CB. These effects were previously seen and explained by Peng et al. Peng et al. (2017). The shifting of Mn(III) d-states is attributed to increased coulomb repulsion in d orbitals of Mn(III). The spin symmetry of the total DOS in pristine MnO2 arises from the antiferromagnetic order of the M(IV) ions, and is disrupted by the defect Mn(III) ion (while the other pristine materials are non-magnetic). The appearance of the polaron peak is attributed to e1g states in Mn(III)Peng et al. (2017); Ding et al. (2021).
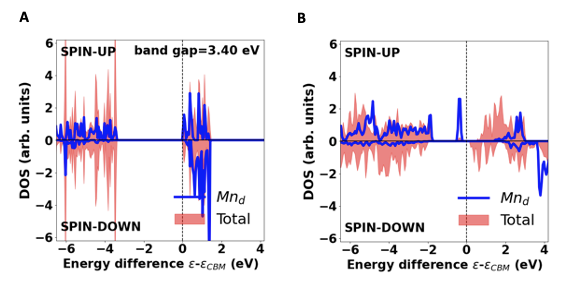
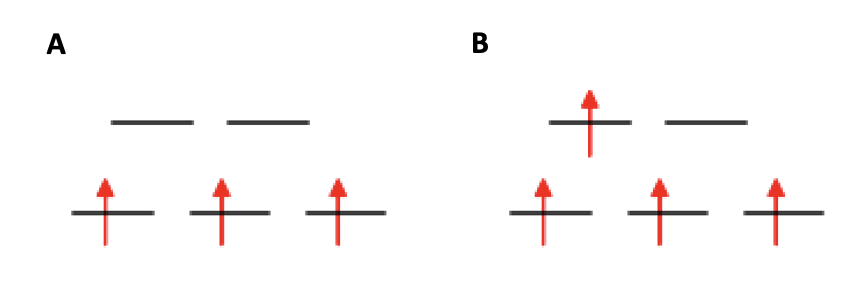
We will see similar effects upon a K-intercalation in and systems later, and these effects can be understood through similar reasoning. The d-state electronic configurations of Mn(IV) in pristine and Mn(III) in a single K-intercalated are as shown in Fig. 4 A and B respectively.
Swathilakshmi et al. Swathilakshmi et al. (2023) recently determined the optimal U value for r2SCAN for Mn to be 1.8 eV. They utilized three oxidation reactions: MnOMn2O3,MnOMn3O4, and Mn2 O3MnO2. The U values for these reactions are 2.1 eV, 1.8 eV and 1.5 eV respectively Swathilakshmi et al. (2023). The average OS of Mn ions in these reactions are +2.5, +2.3 ,and +3.5 respectively Swathilakshmi et al. (2023). U values for these reactions are small compared to those for the PBE GGA and do not differ significantly, suggesting that r2SCAN makes a small, comparable SIE but not an equal one for Mn(II), Mn(III) and Mn(IV) ions in manganese oxide systems. The reported optimal U value of 1.8 eV for the Mn ion is the average of U values for the above three oxidation reactions Swathilakshmi et al. (2023).
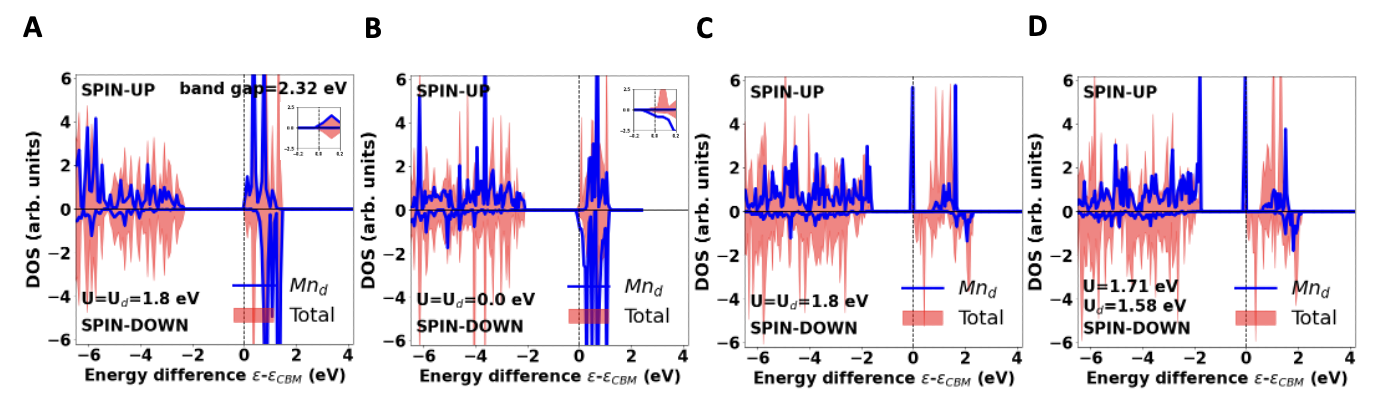
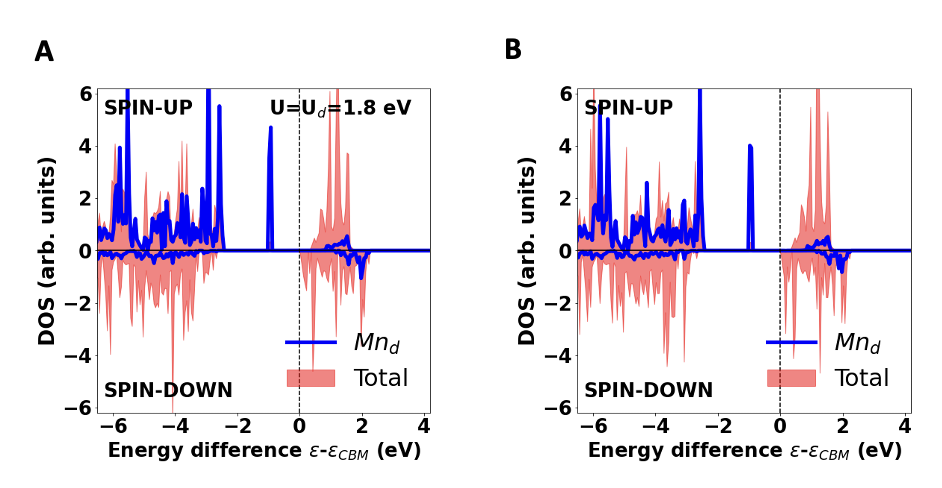
First, we performed calculations for pristine birnessite with the optimal U of 1.8 eV and obtained the DOS as shown in Figure 2A. predicts a band gap of 2.30 eV for the pristine structure. The underestimation of the band gap compared to HSE06 by meta-GGA/GGA is a general trend. Next, we performed calculations for a K-intercalated MnO2. As exhibits a small SIE, we initially set U==0.0 eV to see the performance of r2SCAN+rVV10 without U correction. However, this method failed to resolve the defect, as depicted in Figure 2B, suggesting the necessity of a U correction. The corresponding polaron is delocalized, which can be seen by the extra electrons between the CB minimum and the chemical potential or Fermi level at 0 eV. This can be clearly seen in the inset figure. For the description of a polaron in a single K-intercalated MnO2, DFA has to transfer charge from the inserted K atom to a Mn atom. The charge delocalization error of DFAs prohibits transferring a complete electron from the K atom to the Mn site. This indicates the need for +U correction, which can lower the energy of the defected system by removing the partial occupancy and localizing the electron on the defect site. Subsequently, we tested the optimal U by setting U==1.8 eV and the obtained DOS is shown in Figure 2C, revealing the appearance of a polaronic peak. The +U correction helps to remove the partial occupancy by applying an extra penalty to the partially occupied orbital and lowering its energy. As a result, the polaron is localized and appeared at the CB edge. We see shifting of Mn(III) d-states to higher energy, and spin symmetry breaking in the total DOS in the CB, consistent with the HSE06 results. As discussed in the work by Peng et al. Peng et al. (2017) and Ding et al. Ding et al. (2021), polaron formation can with the right distribution of intercalated potassium atoms create a potential step between layers. Consequently, the layer without a defect places the conduction band closer in energy to the polaronic electronic state of the layer with defects. This effect can facilitate the electron transfer process between sheets and any interlayer species and enhance catalytic activity of the material.
Motivated by studies indicating that U depends on OS, and that generally U decreases with an increase in OS, we determined U for the r2SCAN+rVV10+U functional for Mn+3 and Mn+4 by comparing r2SCAN+rVV10+U’s magnetic moment with the HSE06+D3 magnetic moment. For this we used pristine KMnO2 and MnO2 systems. First, we relaxed the structure using HSE06+D3 and used the structure to get the magnetic moment due to spin charge density within the Wigner-Seitz sphere around an Mn ion. We used the HSE06+D3 geometry for r2SCAN+rVV10+U and slowly increased U in small steps until we got the same magnetic moment as HSE06+D3. This method gave U values of 1.71 eV and 1.58 eV for Mn+3 and Mn+4 ions respectively. These values are close to the values in reference Swathilakshmi et al. (2023).
We then obtained the r2SCAN+rVV10+U+ DOS of a K intercalated MnO2 with U=1.71 eV and =1.58 eV which is as shown in figure 2C. U=1.71 eV and =1.58 eV gave similar result to U==1.8 eV.
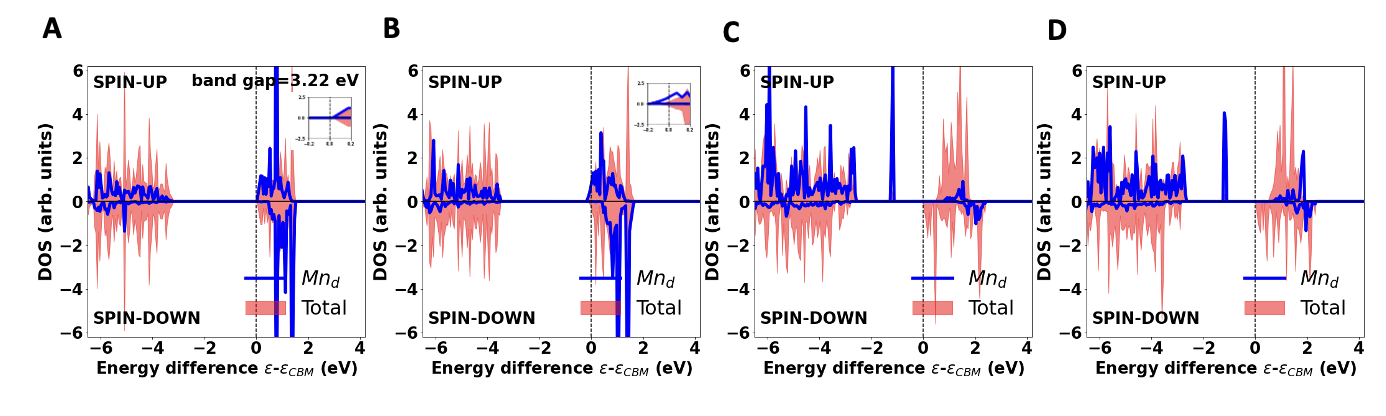
We also performed HSE06+D3 calculations on the r2SCAN+rVV10+U+ geometries, and the resulting DOS are plotted in Figure 3. The D3 dispersion correction was used for the HSE06 functional with new D3 damping parameters a1 = 0.383, a2 = 5.685, and s8 = 2.310 generated for HSE06 functional Jonas and Grimme (2014). For HSE06+D3 calculations, we used an exact exchange mixing parameter () of 0.25. This is because we found that the r2SCAN+rVV10+U geometry in much better agreement with the HSE06+D3 geometry for =0.25 than for 0.22. More details are in the supplementary information.
Fig. 3A shows the HSE06+D3 DOS of pristine MnO2 obtained using the r2SCAN+rVV10+U+ (U==1.8 eV) geometry. HSE06+D3 increases the band gap of pristine MnO2, close to the HSE06 result (Figure 1A). Fig. 3B shows the HSE06+D3 DOS of a K-intercalated MnO2 obtained using the r2SCAN+rVV10+U+ (U==0.0 eV) geometry. Like the r2SCAN+rVV10+U+ (U==0.0 eV) method, HSE06+D3 also fails to localize the defect state. Fig. 3C shows the HSE06+D3 DOS of a K-intercalated MnO2 obtained using the r2SCAN+rVV10+U+ (U==1.8 eV) geometry. Here, the defect state appears as in the r2SCAN+rVV10+U+ (U==1.8 eV) method, but deep in the band gap. Fig. 3D shows the HSE06+D3 DOS of a K-intercalated MnO2 obtained using the r2SCAN+rVV10+U+ (U=1.71 eV and = 1.58eV) geometry. Here, also, the defect state appears as in the r2SCAN+rVV10+U+ (U==1.8 eV) method, but deep in the band gap.
We also calculated HSE06 and HSE06+D3 DOS using an exact exchange mixing parameter of 0.22 as determined by Peng et al.Peng et al. (2017) on r2SCAN+rVV10+U+ geometry with U==1.8 eV and obtained DOS as shown in Fig. S A and B, respectively. As expected, HSE06(=0.22) and HSE06(=0.22)+D3 DOS do not look different. Noticeably, HSE06(=0.22) DOS does not look different from the full HSE06(=0.25)+D3 evaluated on the same geometry, which is shown in Fig. 3C.
R. Ding et al.Ding et al. (2021) have proposed a position of the polaron close to the CB in layered MnO2 with an alternation of polaron-containing and polaronless layers. This scenario matches better with r2SCAN+rVV10+U+Ud DOS, where the polaron is close to the CB.
r2SCAN+rVV10+U+ with U==1.8 eV, and U=1.71 eV and =1.58 eV give similar DOS. HSE06+D3 DOS are also similar for those geometries, with the polaron appearing deep in the gap. We found slightly better agreement between the magnetic moment of the defected Mn+3 ion between r2SCAN+rVV10+U+ and HSE06+D3 for U=1.71 eV and =1.53 eV.
We do not have direct experimental DOS results to make a comparison. Thus, it is challenging to conclude which method provides a better description of the defect. However, we can assert that all three methods- HSE06, r2SCAN+rVV10+U+ and HSE06+D3 using r2SCAN+rVV10+U+ geometry- have successfully described the polaronic defect in birnessite with the proper U and for r2SCAN+rVV10+U+ calculations.
II.2 Layered NiO2
Our next system under study was a layered NiO2. This material has a hexagonal crystal structure with space group P63/mmc. The material project website (https://next-gen.materialsproject.org/) reports that the material is synthesizable but not stable. Whether stable or not, this material is stable enough for our study. Layered NiO2 has a similar structure to birnessite, where Ni ions are in a +4 OS with completely occupied t2g states Martirez and Carter (2019).
We began the DOS calculation using the r2SCAN+rVV10+U+ functional for both pristine and K-intercalated NiO2 systems. The r2SCAN U value for Ni ions was recently determined by Swathilakshmi et al. Swathilakshmi et al. (2023). They utilized the oxidation reaction 2Li2O+4NiO+O24LiNiO2 and obtained a U value of 2.1 eV. In this reaction, the Ni ions exhibit OS of +2 and +3, with an average OS for Ni ions in the reaction calculated to be +2.5.
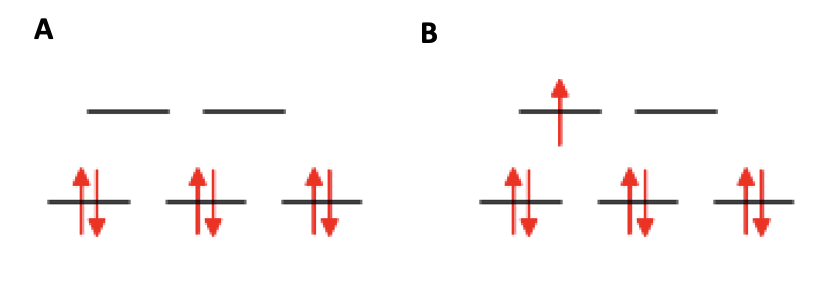
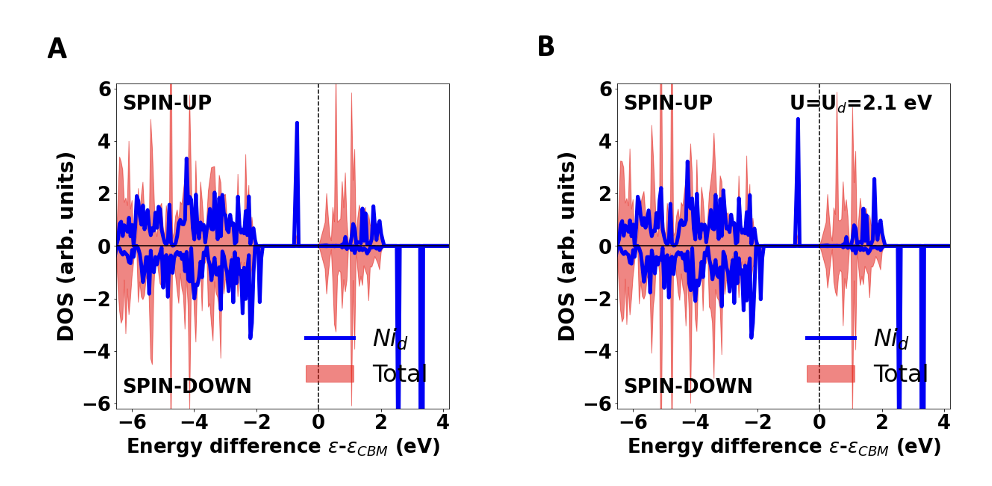
For the pristine NiO2, r2SCAN+rVV10+U+ with U==2.1 eV, correctly predicted a non-magnetic ground state with a band gap of 1.62 eV, as shown in Fig. 5A. The d-states of Ni(IV) in pristine NiO2 are split into t2g and eg states, with t2g states completely occupied and eg states empty, as shown in Fig. 7A. This gives zero spin to Ni ions and makes the solution non-magnetic. As in the birnessite case, we expect that adding an extra K atom between layers would transfer an electron from the inserted K atom to a Ni site, forming a defect. The defected Ni site would undergo Jahn-Teller distortion, localizing the electron in the eg state, as shown in Fig. 7B.
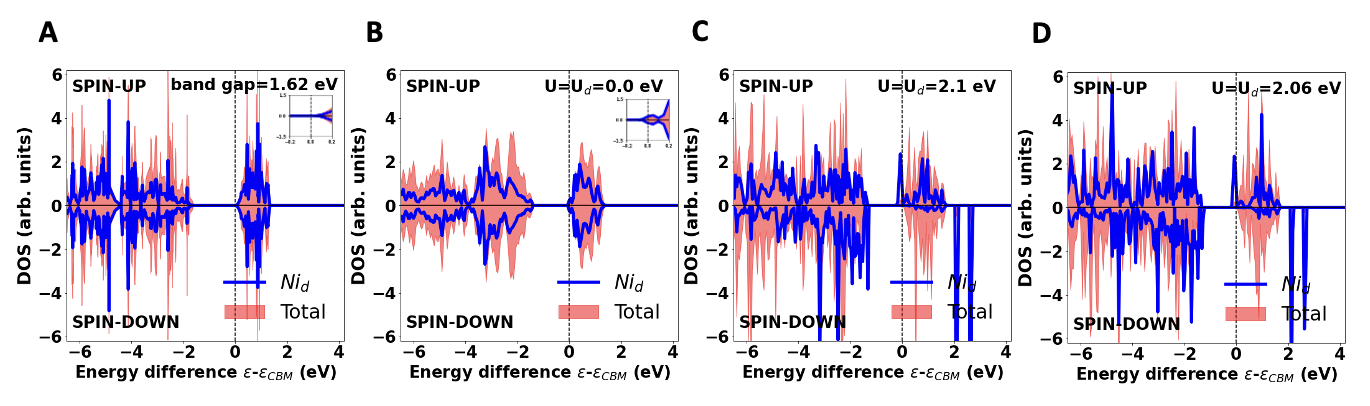
For a K-intercalated NiO2, we initially used U==0.0 eV to observe how r2SCAN+rVV10 without U correction performs for this system, as r2SCAN makes small SIE, and we obtained the DOS as plotted in Fig. 5B. However, this choice of U and failed to describe the defect state. The polaron is delocalized, which can be seen from the insets to Figs. 5B: The extra electron goes to localized states at the bottom of the conduction band, with fractional occupation on each Ni ion in the supercell. For the description of a polaron in a single K-intercalated NiO2, DFA has to transfer charge from the inserted K atom to a Ni atom. The charge delocalization error of DFAs prohibits the transfer of complete electrons from the K atom to the Ni site. This indicates the need for +U correction, which can lower the energy of the polaron by removing the partial occupancy and localizing it. We then used the available U value by setting U==2.1 eV and obtained the DOS, as plotted in Fig. 5C. This choice of U values forms a defect at one of the Ni sites. The +U correction helps to remove the partial occupancy by applying an extra penalty to the orbital and lowers the energy of the orbital. As a result, the polaron is localized and appears in the gap just below the CB minimum. The formation of the polaron at the VB edge indicates that a K -intercalated NiO2 could show catalytic activity similar to that of birnessite by lowering the overpotential. Most of the charge from K atom is transferred to this defect site, which has magnetic moment of 0.786 B . However, we observe a Ni site in another layer picking up small but nonzero magnetic moment of 0.137 B with magnetic moment of all remaining Ni sites smaller than 0.03 B. This suggests that we might need different values of U and for r2SCAN+rVV10+U+ to accurately describe charge transfer to the defect site in a K-intercalated NiO2 system.
The determination of U=2.1 eV for Ni for r2SCAN involves Ni in +2 and +3 states Swathilakshmi et al. (2023), with an average OS of +2.5. Since the precise U values for Ni(III) and Ni(IV) states are not available, we set =2.1 eV for NI(III) as the Ni (III) OS is close to +2.5 and searched for different U values for Ni(IV). We observed that increasing U values beyond 2.3 eV transfers more and more charge to a Ni site in another layer than a defect site. So, we lowered the U values (U=1.0 eV and 0.0 eV ) and found that lowering the U values slightly improves the solution by lowering the magnetic moment of a Ni site in another layer to 0.06 B without significant change in magnetic moment of the defect site. The DOS plots for U=0.0 eV and =2.1 eV doesn’t look different from Fig. 5C. We also increased values, keeping U fixed at 2.1 eV, and observed an increase in the magnetic moment of the defect site, reaching 1 B for U=3.8 eV. These are magnetic moments due to the spin charge density inside the Weigner-Seitz sphere. It is important to note that the magnetic moment of the defect site 1.0 doesn’t guarantee the full transfer of an electron from the intercalated K atom to the defect site, as this is a magnetic moment inside the Weigner-Seitz sphere, which doesn’t reflect the actual magnetic moment of the defect site. However, this analysis shows that one can adjust the U and value for more charge transfer to the defect site where necessary.
We also determined the U value of 2.06 eV for the Ni+3 ion by comparing the HSE06+D3 magnetic moment of the ion with the r2SCAN+rVV10+U magnetic moment as discussed in the supplementary material. The magnetic moment here is due to the spin charge density inside the Weigner-Seitz sphere. We couldn’t apply this method to get the U value for the Ni+4 ion as the magnetic moment of Ni+4 ions are zero and the magnetic moment of Ni+4 ion in the r2SCAN+rVV10+U calculation of the NiO2 system remained zero until the U value was significantly large. As this value is not very different from 2.1 eV, we got a similar r2SCAN+rVV10+U+ result with U==2.06 eV compared to U==2.1 eV. Fig 5D shows r2SCAN+rVV10+U+ DOS with U==2.06 eV.
Similar to birnessite, Ni(III) d- states in the VB in Figures 6C and 5D are shifted to higher energy, and there is spin symmetry breaking in total spin DOS in CB, which could be explained with similar reasoning as in birnessite. Here we do not claim U=0.0 eV to be the precise U value for Ni(IV) ions, but we suspect that U could be different than for a K-intercalated NiO2 system. The accurate determination of U for all the ions in the system would make the r2SCAN+rVV10+U+ method more accurate but determining accurate U values is beyond the scope of this work.
The Ni(IV) d-states contain 3 electrons in each spin channel. Due to lower number of electrons in each channel in d-states, it is possible that r2SCAN might induce a different SIE, suggesting a different need of U correction for Ni(IV) sites. The requirement of a different U for different oxidation states has been observed for Vanadium ions Long et al. (2020). However, directly observing this phenomenon for the Ni system is challenging, as U determination involves only one oxidation reaction, given the lack of reliable thermodynamic and/or structural data for Ni2O3 and NiO2Long et al. (2020); Swathilakshmi et al. (2023). It is important to note that U=3.0 eV, determined for Co ions (using reaction enthalpies for the oxidation reaction CoOCo3O4 with an average OS of +2.34 for Co ions), for SCAN+U, can’t describe the magnetic and geometric structure of O3-CoO2 as accurately as SCAN Long et al. (2020). Additionally, DFT-SCAN correctly predicts metallic behavior in O1-CoO2, while SCAN+UCo shows a large band gap (1.48 eV) Long et al. (2020); Motohashi et al. (2009). These results suggest that, depending upon the system, description of a defect might require different from U.
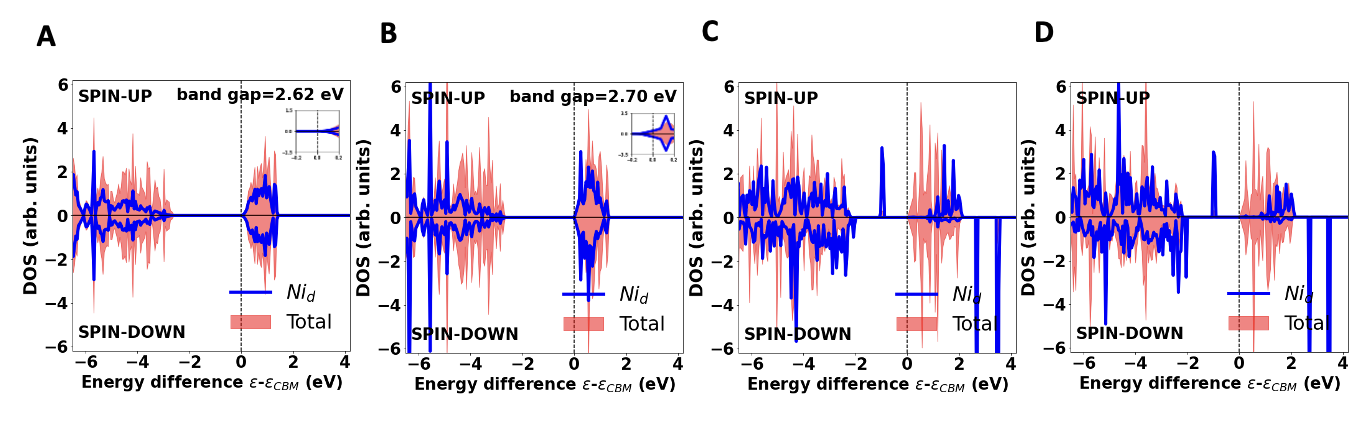
We also did HSE06+D3 calculations using r2SCAN+rVV10+U+ geometry, and the results are shown in Figure 6. We observe an increase in the band gap of pristine NiO2, as shown in Fig. 6A. For a single K-intercalated NiO2, we do not observe polaron formation for U==0.0 eV, similar to r2SCAN+rVV10+U+ as shown in Fig. 6B; however, we observed an increase in the band gap. We also performed HSE06+D3 calculations for U==2.1 eV and for U==2.06 eV and obtained DOS as shown in Figures 6C, and 6D, respectively. We observe an increase in the band gap and a shift of the polaron peak deep into the band gap region compared to the corresponding r2SCAN+rVV10+U+ DOS. We also observe other effects like shifting of Ni(III) d-states to higher energy and spin symmetry breaking in the total DOS in CB, which could be explained with similar reasoning as above.
We also calculated HSE06 and HSE06+D3 DOS using an exact exchange mixing parameter of 0.22 on r2SCAN+rVV10+U+ geometry with U==2.1 eV and obtained DOS as shown in Fig. 12 A and B in the supplementary material (SM), respectively. We used the same value of for Ni, assuming that the value determined by Peng et al. Peng et al. (2017) for Mn won’t be very different for Ni as their atomic numbers are not very different. As expected, HSE06(=0.22) and HSE06(=0.22)+D3 DOS don’t look different. Noticeably, HSE06(=0.22) DOS doesn’t look different from the full HSE06(=0.25)+D3 evaluated on the same geometry, which is shown in Fig. 6C.
HSE06+D3 essentially repeats the results of r2SCAN+rVV10+U+, with the only difference being the energy shift, and we lack experimental data to validate which method is more correct. However, we can assert that both methods, full r2SCAN+rVV10+U+ and HSE06+D3 using the r2SCAN+rVV10+U+ geometry with proper U and values, successfully describe defects in a single K-intercalated NiO2. Among the methods employed to study defect in a K-intercalated NiO2, full r2SCAN+rVV10+U+ is notably superfast.
It seems that we may require different U treatment for the defect site than for the non-defect site, as r2SCAN would exhibit different SIE for these sites. It’s also possible that ions in successive oxidation states make very small difference in their SIE. In that case, different U treatments might not be relevant, as U for those oxidation state could be very close or almost equal.
II.3 Layered
We studied another layered material: KCoO2, which has a hexagonal crystal structure with space group P63/mmc, similar to the above materials MnO2 and NiO2. The material project website (https://next-gen.materialsproject.org/) shows a similar material, LiCoO2, with space group P63mc, to be synthesizable but not stable. The electronic configuration of cobalt d-states is distinct from that of Mn and Ni, as illustrated in Figure 1 in reference Ding et al. (2021). The optimal U value determined for Co ions for r2SCAN is 1.8 eV Swathilakshmi et al. (2023).
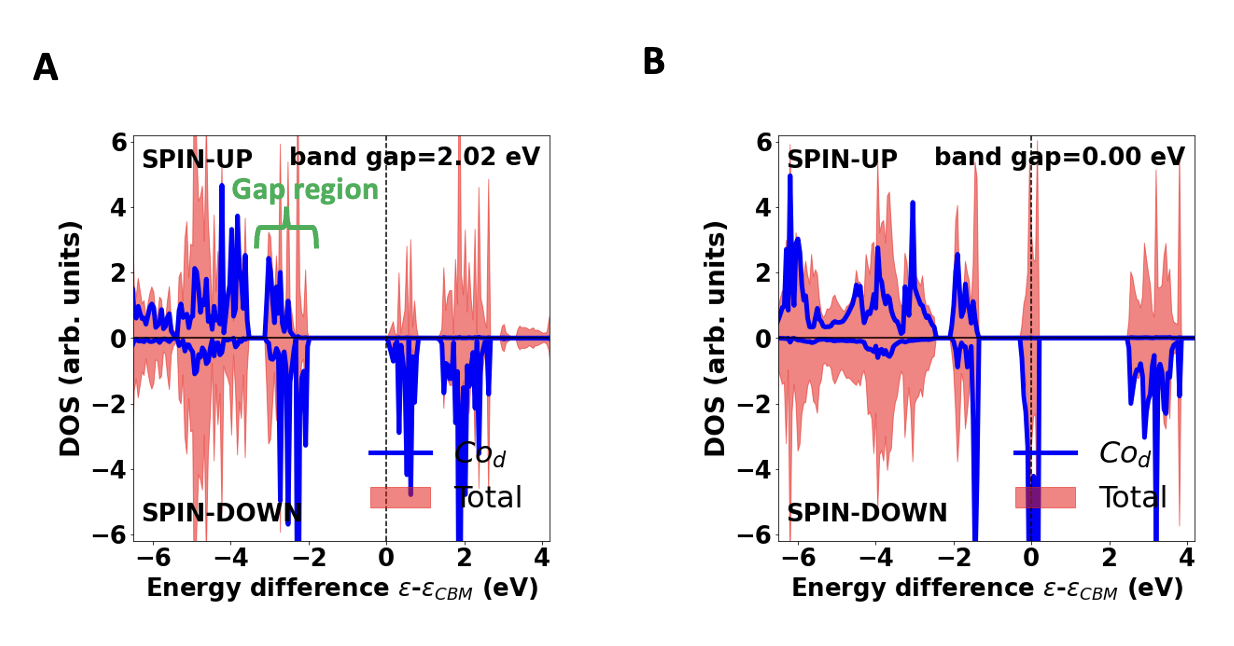
First, we calculated the DOS of KCoO2 using the optimal U value of 1.8 eV and plotted the DOS, as shown in Figure 8A. The band gap of KCoO2 predicted by r2SCAN+rVV10+U is 2.6 eV. We observed symmetry in the spin resolved total DOS and Co d-states projected onto a Co site. This suggests that Co(III) ions in KCoO2 have zero spin. The zero spin of Co+3 is also reported in the work of Chen et al. Chen et al. (2011). The d-state distribution of Co(III) is as shown in Fig. 10A.
The pristine CoO2 has cobalt d states in a d5 distribution, and KCoO2 has cobalt in a d6 distribution. A K-intercalated KCoO2 would have a defect cobalt site in a d7 distribution, with the remaining Co ions in a d6 distribution. Co ions in a K-intercalated KCoO2 are in +3 OS, except for the defect site, which is in +2 OS. It is interesting to note that the Co+3 ion has no unpaired electron, but Co+2 has three unpaired electrons Chen et al. (2011). Chen et al. have proposed d-states of Co+2 as shown in figure 7 in their work Chen et al. (2011). So, unlike one electron in the state of defected Ni+3 and Mn+3, defected Co+2 has four electrons in the states, two in each spin channelChen et al. (2011).
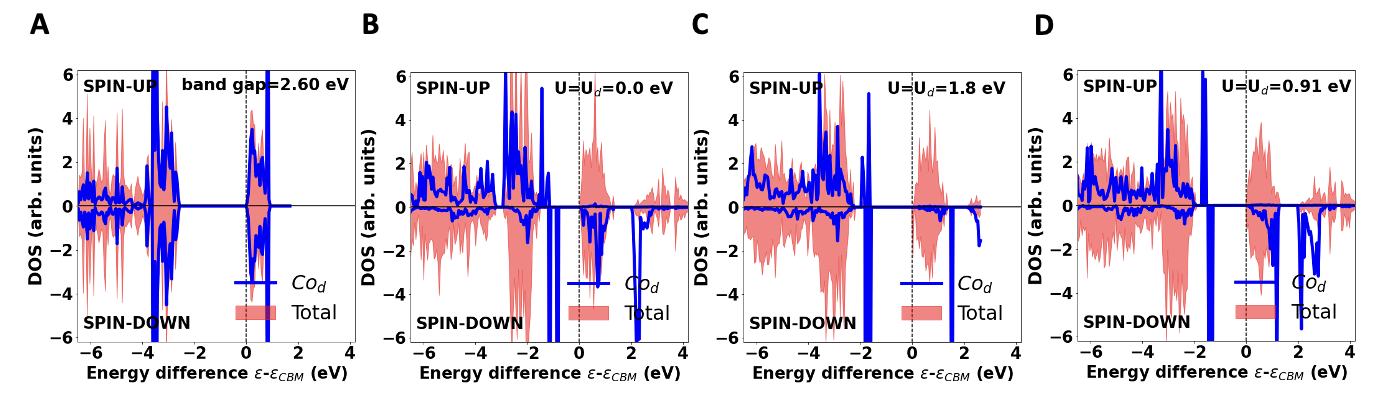
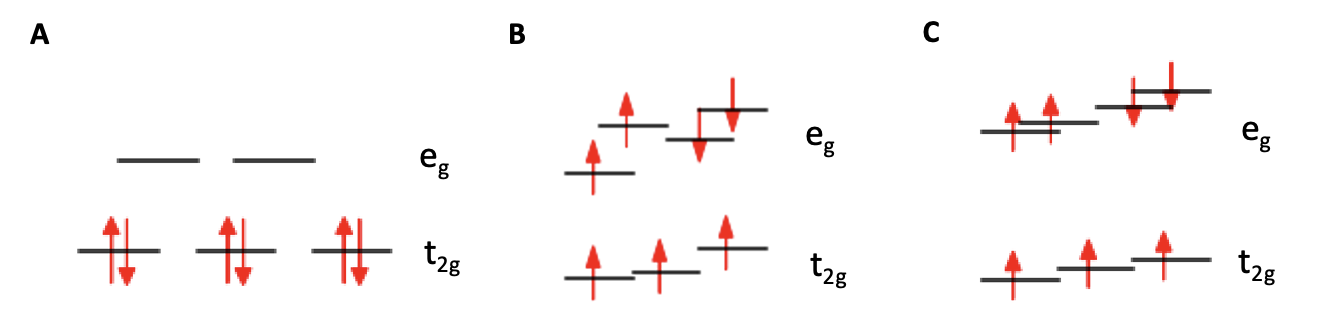
We performed r2SCAN+rVV10+U+ calculations to study the defects in a K- intercalated KCoO2. First, we tried U==0.0 eV to see how r2SCAN+rVV10 performs without U correction, and obtained a DOS as shown in figure 8B. The blue plot, which is the PDOS of d-states of the Co+2 ion, shows a significant change in the d-state of Co+2 compared to the d-state of Co+3 ion. Our calculation shows the magnetic moment of the Co+2 ion around 3 , indicating three unpaired electrons in d-states. Presence of three unpaired electrons is previously seen in references [37-39]. We observed Co+2 d-states splitting as shown in figure 10B. Such splitting is previously reported in ref. Chen et al. (2011). This explains the appearance of Co+2 d-states just above the VB maximum in both channels, absence of Co+2 d-states in the CB in the up channel and presence in the down channel. Compared to pristine KCoO2, shifting of the Co+2 d-states in a single K-intercalated KCoO2 could be attributed to the increased coulomb repulsion in the d-states. There is a breaking of spin symmetry in the DOS, which could be attributed to the dipole formation between K and Co+2 ions, which changes the potential of the Co+2 containing layer. The phenomena like shifting of d-states to higher energy and spin symmetry breaking in CB are similar to those observed and explained before in Peng et al.’s work Peng et al. (2017) in the study of birnessite.
Then we used U==1.8 eV in r2SCAN+rVV10+U+ and obtained a DOS as shown in figure 8C. The DFA+U method tries to penalize fractional occupation. We don’t see much difference between the r2SCAN+rVV10+U+ DOS for U==0.0 eV and U==1.8 eV. This indicates that the occupied Kohn-Sham orbitals are well localized and there is no fractional occupancy in r2SCAN+rVV10+U+ calculations with U==0.0 eV. However, the larger U appears to bring peaks of the defected Co+2 d-states closer together in the band gap region just above the VB maximum.
As discussed in the supplementary material, we tried to determine the U value for the Co+2 ion by comparing the HSE06+D3 magnetic moment with the r2SCAN+rVV10+U magnetic moment and obtained the U value for the Co+2 ion to be 0.91 eV. We couldn’t apply the method for Co+3 ions as they have zero spin; we used the same U value of 0.91 eV for Co+3. We used U==0.91 eV and obtained a DOS as shown in figure 8D, which looks similar to above result.
We tried to compare a full HSE06+D3 DOS with r2SCAN+rVV10+U+ for pristine KCoO2 and a K-intercalated KCoO2. We obtained the KCoO2 supercell by inserting a K layer for each CoO2 layer. Compared to the pristine CoO2 supercell, which contain 96 ions, the KCoO2 supercell has 32 extra K ions, and the K-intercalated KCoO2 supercell has 33 extra K ions. Therefore, one would expect a different lattice parameter for KCoO2 and a K-intercalated KCoO2 , which requires the full relaxation of the supercell. We attempted to optimize the structure using the HSE06+D3 method, but it is very challenging for these systems in terms of time and resource. After a month, we chose not to proceed. This is one of the important reasons that motivated us to explore the r2SCAN+rVV10+U+ method, highlighting the significance of the r2SCAN meta-GGA for defect studies.
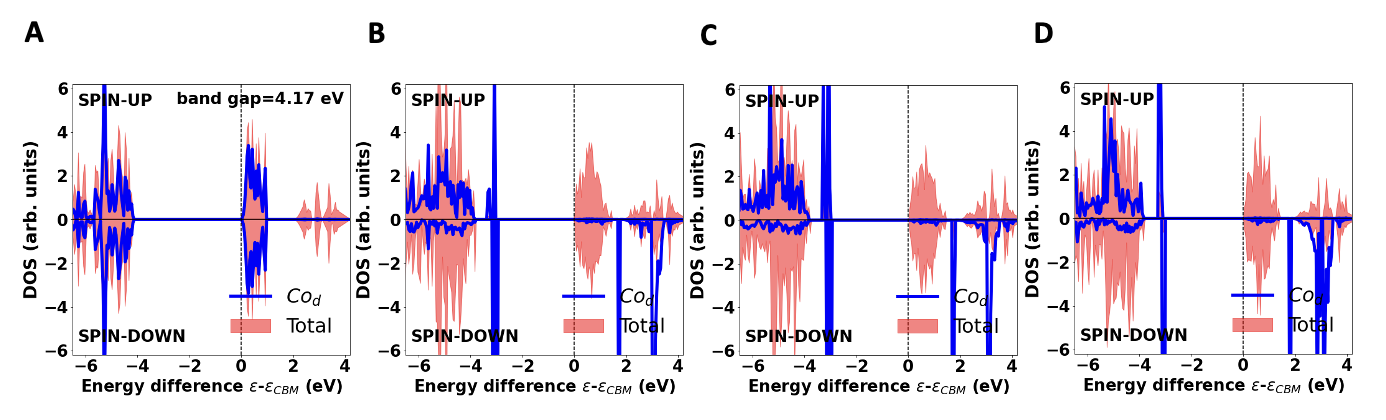
However, we calculated the HSE06+D3 DOS using r2SCAN+rVV10+U+ geometry. As shown in figure 9A, HSE06+D3 predicts KCoO2 to be non- magnetic with an increased band gap of 4.17 eV. For a K-intercalated system with r2SCAN+rVV10+U+ geometry, HSE06+D3 DOS is shown in figures 9 B, C, and D for U==0.0 eV, 1.8 eV, and 0.91 eV, respectively. Here we see that HSE06+D3 not only opens the gap between VB and CB, but it also brings the peaks of the defected Co+2 d-states closer together in the band gap region just above the VB maximum. The later effect is similar to r2SCAN+rVV10+U+ result. We observed Co+2 d-states splitting as shown in figure 10C for the HSE06+D3 calculation using the r2SCAN+rVV10+U+ geometry with U==1.8 eV. Such splitting is previously reported in ref. Chen et al. (2011). This explains the appearance of Co+2 d-states just above the VB maximum in both the channels, absence of Co+2 d-states in CB in the up channel and presence in the down channel. In all HSE06+D3 calculations using r2SCAN+rVV10+U+ geometry, we observed an increase in the band gap, shifting of d-states to higher energy, merging of states in the respective spin channel in the gap region, and spin symmetry breaking of DOS.
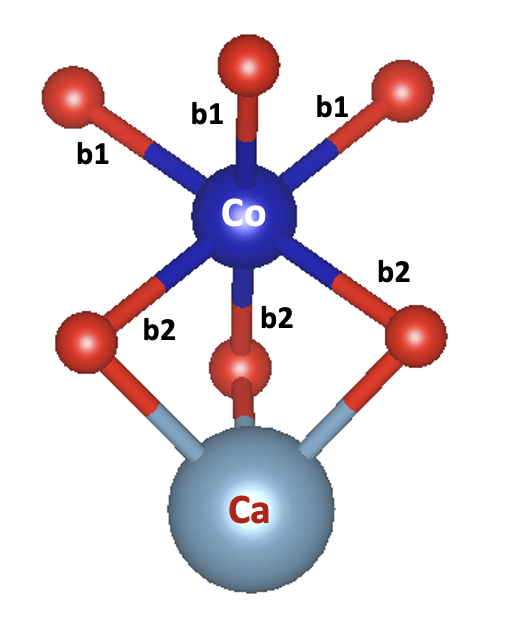
Our r2SCAN+rVV10+U+ and HSE06+D3 calculations for a single K-intercalated KCoO2 indicate the defected Co+2 ion to have a magnetic moment of around 3 and we find the same for the Co+2 ion in CaCoO2 by the r2SCAN+rVV10+U(1.8 eV) calculation. The high spin state of Co+2 with three unpaired electrons was previously reported in several studiesBunting et al. (2018); Chen et al. (2011); Kim et al. (2023). These studies also show that an arrangement of O ions around Co+2 plays an important role in its d-orbital splitting. In the case of a symmetrical tetrahedral CoO6 arrangement, the d-orbitals of Co ions split into and states, as shown in Fig 10A. There are several factors that can lead to different arrangements of d-orbitals in Co ions. In a recent work by Kim et al.Kim et al. (2023) on CaCoO2, a Co+2 ion bonds with four oxygen ions in a plane and shows three types of Co+2 ions with different PDOS of d states, as shown in figures 4d and extended data 5d and e, indicating different d-orbital arrangements. In the same work, figs. 1 and 4d clearly show that Co+2 d-orbital splitting depends on the Co+2 environment. In the other work by Chen et al.Chen et al. (2011) on cobalt oxide Co3O4, which contains cobalt ions in two different oxidation states Co+2 and Co+3, which are located at interstitial tetrahedral and octahedral sites, respectively, it has also been reported that there are three unpaired electrons in Co+2 with d-orbital splitting as shown in Fig. 7. In a different work by Bunting et al. Bunting et al. (2018) on a molecule Co(C(SiMe2ONaph)3)2, the high spin electronic configuration of the Co+2 ion was reported. A common finding of these studies is that Co+2 has three unpaired electrons, and its d-orbital arrangement is not unique but rather very sensitive to the arrangement of ions around it.
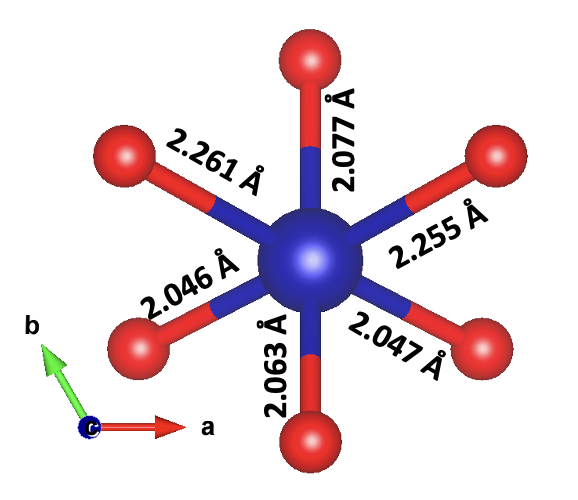
Fig. 13 in SM shows Co+2-O bond lengths in angstrom units and Fig. 14 in SM shows PDOS of Co+2 d-states in a single K-intercalated KCoO2. We see that all the d-states in the spin-up channel in Fig. 14 in SM are occupied, indicating five electrons in the spin-up channel. To get a rough estimate of the number of d-electrons in the Co+2 ion in a different region of the DOS plot in a single K-intercalated KCoO2, we integrated the PDOS shown in Fig. 9C and found 2.3 electrons in VB and 3.6 in CB in the spin-down channel and 6.7 in VB and 0.0 in the CB in spin up channel. Please note that these could not be the exact number of electrons as PDOS is due to the charge density in the Weigner-Seitz sphere, which does not measure the charge of the ion in the solids. However, these rough estimates indicate that there are a total of two electrons in the d-orbitals in the spin-down channel and five electrons in the spin-up channel, supporting the d7 configuration of Co+2 with three unpaired electrons. The “EIGENVAL” file in VASP calculation also shows three extra electrons in spin-up channel compared to spin-down channel.
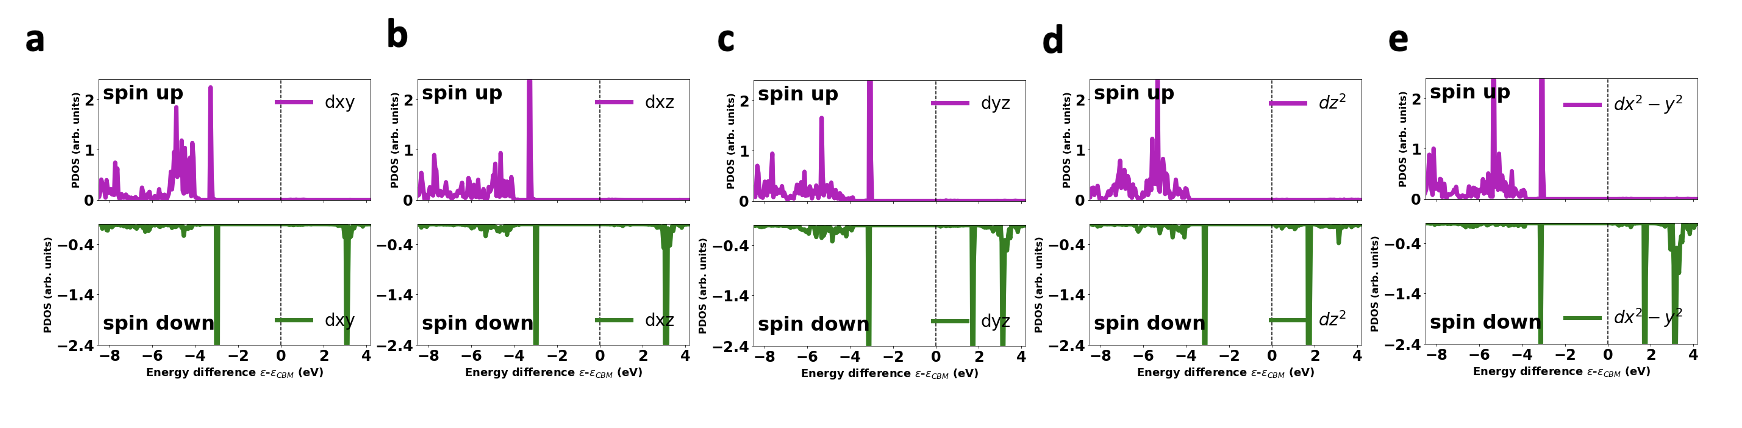
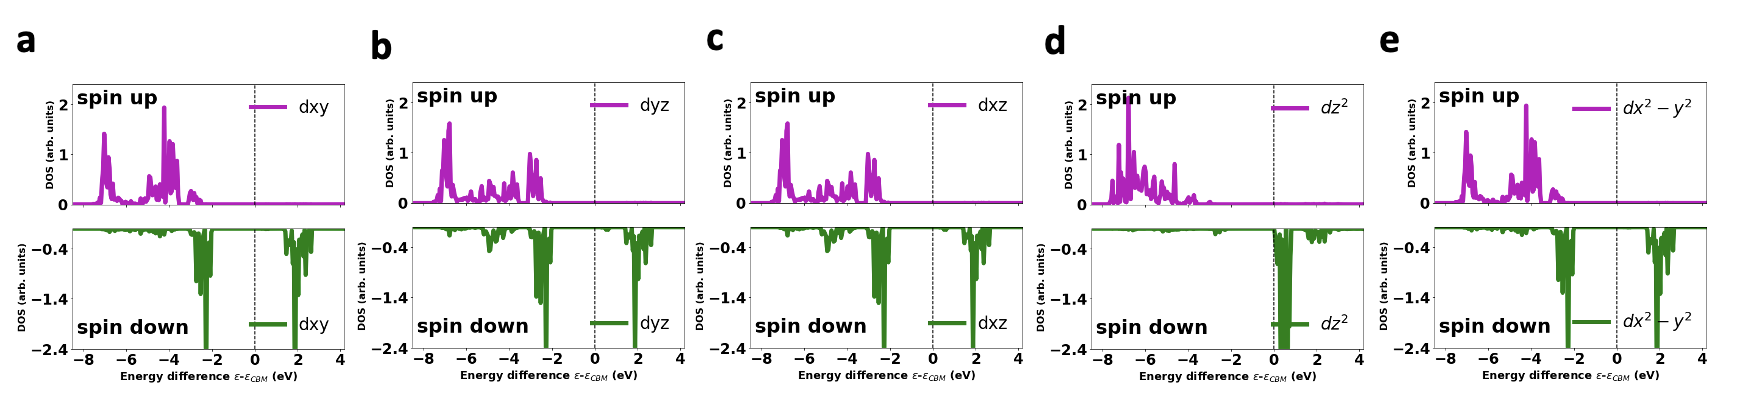
To get more details on the d-states of the Co+2, we also obtained the r2SCAN+rVV10+U with U=1.8 eV total DOS and PDOS of a pristine CaCoO2, as shown in Fig. 15 in SM A. We also plotted individual PDOS of Co+2 d-orbitals as shown in Fig. 17 in SM. The CaCoO2 bilayer supercell with 128 atoms was used in our calculation, where Ca ions were sandwiched between CoO2 layers such that Ca:Co=1:1. The structure is fully relaxed using the r2SCAN+rVV10+U(1.8 eV) functional. Our calculation shows two types of Co+2-O bond lengths of 2.178Å and 2.182Å in pristine CaCoO2, as shown in Fig. 16 in SM. However, the r2SCAN+rVV10+U calculation with U = 1.8 eV using a bilayer CaCoO2 small cell with eight ions shows no distortion in the CoO6 tetrahedron and metallic nature, as shown in Fig. 15 B in SM. The bigger cell opens a band gap due to small distortions in the CoO6 tetrahedron. Compared to the KCoO2 DOS, as shown in figures 8A and 9A, there is an appearance of DOS in the band gap region of pristine CaCoO2 in both spin channels. We also estimated the rough number of electrons by integrating PDOS and found 2.6 electrons in VB and 3.2 in CB in the spin-down channel and 5.6 in VB and 0.0 in CB in the spin-up channel. This supports the d7 distribution of Co+2 with three unpaired electrons in the spin-up channel in pristine bilayer CaCoO2. As shown in Fig. 15 A in SM, we also integrated PDOS in the “gap region” and found 0.7 electrons in the spin-up channel and 1.9 electrons in the spin down channel. This suggests that electrons in the down channel are more localized in the gap region. As shown Fig. 15 A in SM, the PDOS in the gap region in the up channel is mainly due to dyz, dxz, and dx2-y2 orbitals that are delocalized deep in the VB. This explains why integrating the gap region in the up channel gives only 0.7 electrons. Figures 13 and 16 in SM clearly differ from each other, which explains the reason for the difference in d-states of Co+2 ions in a single K-intercalated KCoO2 and pristine CaCoO2.
We plotted the HSE06+D3 energy of Co+2 occupied d-orbitals evaluated at the gamma point in a single K-intercalated KCoO2 using r2SCAN+rVV10+U+ geometry with U==1.8 eV as shown in figure 10C. We observe splitting in spin-up and spin-down orbitals. The higher energy of spin-down dz2 and dx2-y2 could be due to increased coulomb repulsion between these orbitals and sp3 hybridized orbitals of oxygen. This also explains why the distorted tetrahedron as shown in Fig. 13 in SM, has two of the bonds between defected Co+2 and O nearly 15% longer compared other remaining four bonds. The spin due to orbitals in the majority channel could be cancelling the spin due to orbitals in the minority channel giving a high spin state of Co+2 ion with three unpaired electrons in a single K-intercalated KCoO2. This arrangement of d-orbitals is similar to Fig. 7 in the work by Chen et al. Chen et al. (2011).
We can say that the r2SCAN+rVV10+U+ method successfully described the point defect in a K-intercalated KCoO2 and was much faster compared to expensive hybrid functions like HSE06. The use of r2SCAN+rVV10+U+ geometry and wavefunction to conduct further HSE06+D3 calculations for obtaining the electronic structure of defects in solids could be a way to describe defects which is as accurate as full HSE06+D3 method, but much faster.
III Conclusions
Defects in solids can be utilized to tune the electronic structure of materials, impacting applications in various fields. Defects can be investigated using first-principles calculations with DFT. However, DFAs introduce SIE that could vary depending on the element, system, site, and oxidation state, hindering the performance of DFAs. Hybrid functionals mitigate SIE by mixing exact exchange , but at the expense of computational cost, successfully describing defects in many materials. The computational cost of hybrid functionals increases significantly for a SCF (self-consistent field) calculation compared to meta-GGAs like r2SCAN. Defect studies require large supercells, making SCF calculations very expensive. Ionic relaxation calculations for defect studies involve many SCF cycles, making the process cumbersome for a hybrid functional to optimize the structure.
Here we demonstrate that the r2SCAN+rVV10+U+ method can successfully describe defects in materials with proper values of U and . The method is much faster than hybrid functionals but equally accurate. Using r2SCAN+rVV10+U+ geometry enables the completion of hybrid functional calculations in a reasonable time and with fewer resources. This approach makes hybrid functional calculations feasible for larger systems with transition-metal ions.
The r2SCAN+rVV10+U+ method proposed here is not only faster but as accurate as the already established hybrid functional method for defect studies. This method will expedite the study of defects in materials and contribute to the rapid growth of the field. The r2SCAN+rVV10+U+ method can also be employed in systems without defects where ions of the same species are in different OS.
We have studied the layered oxides MnO2, NiO2, and KCoO2, both in the pristine state and with one K atom intercalated between layers in a supercell. Inexpensive r2SCAN+rVV10+U+ equilibrium geometries have been used for electronic structure calculations with r2SCAN+rVV10+U+ and with the expensive HSE06 hybrid functional. For K-intercalated MnO2 and NiO2, we find no localized eg state on the defected transition metal ion for U-=0, but we find one such state for standard positive U values. This state, in the gap between conduction and valence bands accepts the electron donated by the intercalated K. (For U==0, the extra electron from the intercalated K goes into the bottom of the conduction band, making the intercalated material a semi-metal. The extra electron is then delocalized over the supercell, with fractional occupation on each transition-metal ion.)
For K-intercalated KCoO2, both for U==0 (standard semilocal r2SCAN without a nonlocal +U self-interaction correction) and for standard positive U values, we seem to find two majority-spin and two minority-spin occupied localized eg states in the gap between valence and conduction bands, and three empty localized minority-spin t2g states in the gap above the conduction band. This surprising result is consistent with a dramatic change in the electronic configuration (Fig. 10) from the undefected Co+3 ions to the defected Co+2 ion, as reported previously in Ref. Chen et al. (2011).
IV Computational Details
First-principles calculations were performed with the projector-augmented wave method Blöchl (1994), implemented in the VASP codeKresse and Hafner (1994); G and Joubert (1999). A 4 x 4 x 2 supercell was used to simulate defects in layered TMOs. For all supercell calculations, a 2 x 2 x 2 -centered Monkhorst-Pack k mesh Monkhorst and Pack (1976) was used.
For r2SCAN+rVV10+U+ calculations, a 500 eV cutoff for the plane waves was used. In all r2SCAN+rVV10+U+ calculations, the cell volume was relaxed with the ISIF=3 setting until forces converged to less than 0.03 eV/Å and energy converged to less than 10-6 eV. To conduct r2SCAN+rVV10+U+ calculations, we employed the simplified rotationally invariant framework developed by Dudarev et al. Dudarev et al. (1998).
For HSE (as for r2SCAN+rVV10+U+), corrections due to the periodic boundary condition and the supercell size have been addedPeng et al. (2017); Kumagai and Oba (2014). For figure 1, we used an exact mixing parameter of 0.22 in the hybrid functional HSE06 Peng et al. (2017); Krukau et al. (2006), as determined from the Generalized Koopman’s Condition (GKC) methodLany and Zunger (2009); Lany (2011); Peng and Lany (2012); Peng et al. (2015). For all the remaining HSE06+D3 calculations, we used the standard exact exchange mixing parameter of 0.25. A plane-wave basis with an energy cutoff of 400 eV was employed.
V Acknowledgments
This work was supported by the U.S. Department of Energy, Office of Science Basic Energy Sciences under Award No. DE-SC0023356.
References
- Peng et al. (2017) H. Peng, I. G. McKendry, R. Ding, A. C. Thenuwara, Q. Kang, S. L. Shumlas, D. R. Strongin, M. J. Zdilla, and J. P. Perdew, PNAS 114, 9523 (2017).
- Ding et al. (2021) R. Ding, P. Yasini, H. P. Peng, J. P. Perdew, E. Borguet, and M. J. Zdilla, Adv. Energy Mater. 11, 2101636 (2021).
- Hohenberg and Kohn (1964) P. Hohenberg and W. Kohn, Phys. Rev. 136, B864 (1964)).
- Kohn and Sham (1965) W. Kohn and L. J. Sham, Phys. Rev. 140, A1133 (1965).
- Perdew et al. (1982) J. P. Perdew, R. G. Parr, M. Levy, and J. L. Balduz, Jr., Phys. Rev. Lett. 49, 1691 (1982).
- Sun et al. (2016) J. Sun, R. C. Remsing, Y. Zhang, Z. Sun, A. Ruzsinszky, H. Peng, Z. Yang, A. Paul, U. Waghmare, X. Wu, M. L. Klein, and J. P. Perdew, Nature Chemistry 08, 831 (2016).
- Henderson et al. (2011) T. M. Henderson, J. Paier, , and G. E. Scuseria, Phys. Status Solidi B 248, 767 (2011).
- Furness et al. (2020a) J. W. Furness, A. D. Kaplan, J. Ning, J. P. Perdew, and J. Sun, J. Phys. Chem. Lett. 11, 8208 (2020a).
- Bartók and Yates (2019) A. P. Bartók and J. R. Yates, J. Chem. Phys. 150, 161101 (2019).
- Furness et al. (2020b) J. W. Furness, A. D. Kaplan, J. Ning, and J. P. Perdew, J. Phys. Chem. Lett. 11, 8208 (2020b).
- Saÿnick and Cocchi (2021) H.-D. Saÿnick and C. Cocchi, Electron. Struct. 3, 027001 (2021).
- (12) D. Wickramaratne and J. L. Lyons, ArXiv:2311.03634v1.
- Varadwaj and Miyake (2022) A. Varadwaj and T. Miyake, Electron. Struct. 7, e20220017 (2022).
- Anisimov et al. (1991) V. I. Anisimov, J. Zaanen, , and O. K. Andersen, Phys. Rev. B 44, 943 (1991).
- Anisimov et al. (1993) V. I. Anisimov, I. V. Solovyev, M. A. Korotin, M. T. Czyzyk, , and G. A. Sawatzky, Phys. Rev. B 48, 16929 (1993).
- Solovyev et al. (1994) I. V. Solovyev, P. H. Dederichs, , and V. I. Anisimov, Phys. Rev. B 50, 16861 (1994).
- Cococcioni and de Gironcoli (2005) M. Cococcioni and S. de Gironcoli, Phys. Rev. B 71, 035105 (2005).
- Vydrov and Voorhis (2010) O. A. Vydrov and T. V. Voorhis, J. Chem. Phys. 133, 244103 (2010).
- Sabatini et al. (2020) R. Sabatini, T. Gorni, and S. de Gironcoli, Physical Review Material 4, 045401 (2020).
- Long et al. (2020) O. Y. Long, G. S. Gautam, and E. A. Carter, Physical Review Material 4, 045401 (2020).
- Swathilakshmi et al. (2023) S. Swathilakshmi, R. Devi, and G. S. Gautam, J. Chem. Theory Comput. 19, 4202 (2023).
- Bunting et al. (2018) P. C. Bunting, M. Atanasov, E. Damgaard-Møller, M. Perfetti, I. Crassee, M. Orlita, J. Overgaard, J. V. Slageren, F. Neese, and J. R. Long, Science 362, 1378 (2018).
- Jonas and Grimme (2014) J. Jonas and S. Grimme, J. Phys. Chem. C 118, 7615 (2014).
- Martirez and Carter (2019) J. M. P. Martirez and E. A. Carter, J. Am. Chem. Soc. 141, 693 (2019).
- Motohashi et al. (2009) T. Motohashi, T. Ono, Y. Sugimoto, Y. Masubuchi, S. Kikkawa, R. Kanno, M. Karppinen, and H. Yamauchi, Phys. Rev. B 80, 165114 (2009).
- Chen et al. (2011) J. Chen, X. Wu, and A. Selloni, Phy. Rev. B 83, 245204 (2011).
- Kim et al. (2023) W. J. Kim, M. A. Smeaton, C. Jia, B. H. Goodge, B. G. Cho, K. Lee, M. Osada, D. Jost, A. V. Ievlev, B. Moritz, L. F. Kourkoutis, T. P. Devereaux, and H. Y. Hwang, Nature 615, 237 (2023).
- Blöchl (1994) P. E. Blöchl, Phys. Rev. B 50, 17953 (1994).
- Kresse and Hafner (1994) G. Kresse and J. Hafner, Phys. Rev. B Condens Matter 49, 14251–14269 (1994).
- G and Joubert (1999) G. K. G and D. Joubert, Phys. Rev. B 59, 1758–1775 (1999).
- Monkhorst and Pack (1976) H. Monkhorst and J. Pack, Phys. Rev. B 13, 5188–5192 (1976).
- Dudarev et al. (1998) S. L. Dudarev, G. A. Botton, S. Y. Savrasov, C. J. Humphreys, and A. P. Sutton, Phys. Rev. B 57, 1505 (1998).
- Kumagai and Oba (2014) Y. Kumagai and F. Oba, Phys. Rev. B 89, 195205 (2014).
- Krukau et al. (2006) A. Krukau, O. Vydrov, A. Izmaylov, and G. Scuseria, J. Chem. Phys. 125, 224106 (2006).
- Lany and Zunger (2009) S. Lany and A. Zunger, Phys. Rev. B 80, 085202 (2009).
- Lany (2011) S. Lany, Phys. Status Solidi B 248, 1052–1060 (2011).
- Peng and Lany (2012) H. Peng and S. Lany, Phys. Rev. B 85, 201202 (2012).
- Peng et al. (2015) H. Peng, P. Ndione, D. Ginley, A. Zakutayev, and S. Lany, Phys. Rev. X 5, 021016 (2015).
Supplementary Material
Determination of Hubbard U correction
To determine the Hubbard U correction, we compared the HSE06+D3 magnetic moment (MM) of ions inside the Weigner-Seitz sphere with the r2SCAN+rVV10+U’s MM. First, we relaxed the structure using the HSE06+D3 method and used this structure to calculate the HSE06+D3 MM. We then used the HSE06+D3 structure to do the r2SCAN+rVV10+U calculation, where we slowly varied the U value until r2SCAN+rVV10+U’s MM becomes equal to the HSE06+D3’s MM. We used smaller bilayer unit cells of transition metal oxides for U determination using this method. We used MnO2, KMnO2, KNiO2, and CaCoO2 to get U values for Mn+4, Mn+3, Ni+3, and Co+2 ions, respectively. All calculations are performed using VASP code, where we used -centered Monkhorst-pack grid of size 8 x 8 x 8 and a cut off energy of 400 eV for plane wave basis.
First, we used HSE06+D3 with an exact exchange mixing parameter () of 0.22 to be consistent with Peng et. al.’s workPeng et al. (2017). We have summarized the calculated U value for these ions in Table 1 below.
| HSE06()+D3 MN () | r2SCAN+rVV10+U MM () | U (eV) | |
|---|---|---|---|
| MnO2 | 3.023 | 3.023 | 1.41 |
| KMnO2 | 3.933 | 3.933 | 1.26 |
| KNiO2 | 1.098 | 1.098 | 1.53 |
| CaCoO2 | 2.663 | 2.663 | 0.55 |
We couldn’t use this method to determine the U values for Ni+4 and Co+3 ions using NiO2 and KCoO2 systems because the MM of Ni+4 and Co+3 ions in NiO2 and KCoO2 being zero, and these MMs are zero and largely independent of U values in the r2SCAN+rVV10+U calculation. So, we used the same U values for Ni+4 and Co+3 as determined for Ni+3 and Co+4, respectively. We used the U values determined in Table 1, as well as U values from the literatureDing et al. (2021), and calculated lattice parameters for MnO2, NiO2, and CaCoO2 unit cells to see how r2SCAN+rVV10+U performs compared to HSE06+D3 with =0.22. The results are summarized in the Table 2 below.
| System | Method | Lattice Parameters (Å) | Lattice Angles (Degree) | ||||
|---|---|---|---|---|---|---|---|
| a | b | c | |||||
| r2SCAN+rVV10 | 2.82 | 2.82 | 9.23 | 90 | 90 | 120 | |
| MnO2 | r2SCAN+rVV10+U(1.41 eV) | 2.83 | 2.83 | 9.22 | 90 | 90 | 120 |
| HSE06()+D3 | 2.83 | 2.83 | 9.59 | 90 | 90 | 120 | |
| r2SCAN+rVV10 | 2.74 | 2.74 | 8.98 | 90 | 90 | 120 | |
| NiO2 | r2SCAN+rVV10+U(1.53 eV) | 2.73 | 2.73 | 9.00 | 90 | 90 | 120 |
| HSE06()+D3 | 2.72 | 2.72 | 9.25 | 90 | 90 | 120 | |
| r2SCAN+rVV10 | 2.89 | 2.89 | 11.64 | 90 | 90 | 120 | |
| KCoO2 | r2SCAN+rVV10+U(0.55 eV) | 2.89 | 2.89 | 11.65 | 90 | 90 | 120 |
| HSE06()+D3 | 2.86 | 2.86 | 11.21 | 90 | 90 | 120 | |
We see that the lattice constants agree well for r2SCAN+rVV10 and r2SCAN+rVV10+U, but they disagree with HSE06+D3 (=0.22) lattice parameters, especially the c parameter. This motivated us to go back to full HSE06.
| HSE06()+D3 MN () | r2SCAN+rVV10+U MM () | U (eV) | |
|---|---|---|---|
| MnO2 | 3.036 | 3.036 | 1.71 |
| KMnO2 | 3.947 | 3.947 | 1.58 |
| KNiO2 | 1.163 | 1.163 | 2.06 |
| CaCoO2 | 2.683 | 2.683 | 0.91 |
As above, we again determined U values by comparing the MM of r2SCAN+rVV10+U with the full HSE06+D3 (=0.25 ) functional. Table 3 below summarizes the result. The U values determined in the Table 3 are closer to the values in the literature, where optimal values for Mn, Ni, and Co ions for r2SCAN are 1.8 eV, 2.1 eV, and 1.8 eV, respectively Ding et al. (2021). The difference in oxidation states of ions could be the cause of the discrepancy. We used the above U values for the r2SCAN+rVV10+U functional and again compared the lattice parameters. The results are summarized in Table 4 below.
| System | Method | Lattice Parameters (Å) | Lattice Angles (Degree) | ||||
|---|---|---|---|---|---|---|---|
| a | b | c | |||||
| r2SCAN+rVV10 | 2.82 | 2.82 | 9.23 | 90 | 90 | 120 | |
| MnO2 | r2SCAN+rVV10+U(1.71 eV) | 2.84 | 2.84 | 9.11 | 90 | 90 | 120 |
| HSE06()+D3 | 2.82 | 2.82 | 9.25 | 90 | 90 | 120 | |
| r2SCAN+rVV10 | 2.74 | 2.74 | 8.98 | 90 | 90 | 120 | |
| NiO2 | r2SCAN+rVV10+U(2.06 eV) | 2.73 | 2.73 | 8.98 | 90 | 90 | 120 |
| HSE06()+D3 | 2.73 | 2.73 | 9.03 | 90 | 90 | 120 | |
| r2SCAN+rVV10 | 2.89 | 2.89 | 11.64 | 90 | 90 | 120 | |
| KCoO2 | r2SCAN+rVV10+U(0.91 eV) | 2.89 | 2.89 | 11.65 | 90 | 90 | 120 |
| HSE06()+D3 | 2.87 | 2.87 | 11.61 | 90 | 90 | 120 | |
| Integrated PDOS range | Estimated Number of Electrons | |
|---|---|---|
| Spin Up | Spin Down | |
| VB | 5.6 | 2.6 |
| CB | 0.0 | 3.2 |
| Gap region (shown in Fig. 15 A) | 0.7 | 1.9 |