Multipole magnons in topological skyrmion lattices resolved by cryogenic Brillouin light scattering microscopy
Non-collinear magnetic skyrmion lattices provide novel magnonic functionalities due to their topological magnon bands and asymmetric dispersion relations. Magnon excitations with intermediate wavelengths comparable to inter-skyrmion distances are particularly interesting but largely unexplored so far due to experimental challenges. Here, we report the detection of such magnons with wavevectors q 48 rad/um in the metastable skyrmion lattice phase of the bulk chiral magnet Cu2OSeO3 using micro-focused Brillouin light scattering microscopy. Thanks to its high sensitivity and broad bandwidth we resolved various excitation modes of a single skyrmion lattice domain over a wide magnetic field regime. Besides the known modes with dipole character, quantitative comparison of frequencies and spectral weights to theoretical predictions enabled the identification of a quadrupole mode and observation of signatures which we attribute to a decupole and a sextupole mode. Our combined experimental and theoretical work highlights that skyrmionic phases allow for the design of magnonic devices exploiting topological magnon bands.
INTRODUCTION
Non-collinear skyrmion spin textures with linear dimensions of tens of nanometers are stabilized in noncentrosymmetric chiral magnets due to the bulk Dzyaloshinskii-Moriya interaction (DMI) (?, ?, ?, ?, ?, ?, ?, ?, ?). Skyrmions possess a topological character and spontaneously condense into regular hexagonal lattices, which makes them appealing for magnonic applications and novel computing (?, ?). These periodic arrangements operate as natural magnonic crystals without challenging nano-fabrication and offer the possibility of a bottom-up engineering of magnon band structures in the exchange-dominated spin-wave regime, i.e., at ultrashort wavelength (?, ?). Remarkably, the real-space topology of skyrmion textures is reflected in a non-trivial reciprocal-space topology of the magnon bands resulting in robust magnonic edge states (?, ?, ?, ?, ?). Moreover, the chirality of the system also gives rise to an asymmetry of the magnon dispersions leading to non-reciprocal magnon propagation (?, ?, ?, ?, ?, ?, ?, ?, ?, ?, ?) which is important for uni-directional signal transmission.
The magnonic band structure of skyrmion lattices is characterized by a plethora of excitation modes but their experimental detection is restricted by selection rules. Waveguide microwave spectroscopy gives access to only the three dipole-active modes close to the -point of the magnetic Brillouin zone (BZ): the so-called counterclockwise (CCW), breathing and clockwise (CW) modes (?). These three magnetic resonances have been experimentally investigated in several chiral magnets by microwave spectroscopy (?, ?, ?, ?, ?, ?) and other experimental probes like resonant elastic x-ray scattering (?) and time-resolved magneto-optics (?, ?). Other modes of the magnon band structure generically do not possess a macroscopic AC magnetic dipole moment and, therefore, do not yield a microwave response. However, for specific values of the magnetic field, the cubic crystalline environment hybridizes the CCW and the breathing resonance, respectively, with a sextupole (denoted as sextupole-1 below) and octupole mode such that these otherwise dark modes leave characteristic signatures in the spectrum. This hybridization has been recently verified experimentally (?). The dispersions, i.e., the wavevector, , dependences of the three magnetic resonances have been investigated for small wave vectors by spin-wave spectroscopy in close vicinity of the -point, where is the reciprocal lattice vector of the magnetic skyrmion lattice (SkL). The study revealed a pronounced non-reciprocity of the CCW mode for wavevectors perpendicular to the skyrmion lattice plane (?). In the opposite limit of large wavevectors, , much beyond the first BZ, inelastic neutron scattering was used to explore the convoluted signal of a manifold of spin wave excitations without resolving individual magnon bands (?). For intermediate wavevectors, , only neutron spin-echo spectroscopy provided first evidence for the dispersion of the CCW mode (?). Nevertheless, magnon modes of the skyrmion lattice with intermediate wavevectors remain largely unexplored experimentally.
Here, we report the spectroscopy of such magnons of the skyrmion lattice with wavevectors on the order in the chiral magnet Cu2OSeO3. We use cryogenic Brillouin light scattering (BLS) with an option for high cooling rates of 25 K/min and thereby explore the skyrmion lattice in its metastable phase (?, ?, ?) at 12 K where the spin-wave damping is low (?). BLS is ideally suited to probe the regime over a wide range of frequencies. At such wavevectors, the selection rules of BLS provide a finite spectral weight for mulitple modes offering the possibility to detect so far unexplored magnon modes beyond the ones known from waveguide microwave spectroscopy (?). Particularly, we apply micro-focused BLS using a green laser with wavelength nm. The micro-focused setup allows to explore a microscopic volume in the bulk crystal, hence resolving the spin dynamics of the skyrmion lattice in an individual magnetic domain. Stokes and Anti-Stokes spectra are detected corresponding to the emission and absorption of magnons, respectively, with wavevectors covering values up to 48 rad/m within the plane of the skyrmion lattice. Detailed comparisons with a basically parameter-free theoretical prediction for the BLS spectra enable us to identify various excitation modes. Going beyond previous studies, we observe the CCW, breathing and CW modes at finite wavevectors whose frequencies, due to their dispersions, differ substantially from the ones detected close to the -point. We present experimental evidence for an additional quadrupole mode and, consistent with theory, a weak sextupole mode, denoted, respectively, as quadrupole-2 and sextupole-2 below. Both of which have not been resolved previously with other techniques. In addition, we demonstrate that the breathing mode in the BLS spectrum hybridizes for a specific value of the magnetic field with a decupole mode. Our findings are, on the one hand, key for the fundamental understanding of magnetic skyrmion lattices as the spin-wave dispersions of the various detected modes depend decisively on symmetric and antisymmetric exchange interactions as well as dipolar coupling between non-collinear spins. On the other hand, our data confirm quantitatively the minibands provided by a theory which can now be expanded to explore the functionality of skyrmion-based magnonic crystals for controlling GHz signals on the nanoscale.
RESULTS
Experimental setup and skyrmion lattice in Cu2OSeO3
The experimental setup is sketched in Fig. 1A. The BLS laser is focused on the polished top surface of a 300 thick Cu2OSeO3 platelet (described in Materials and Methods section), and the external magnetic field is applied along its [001] crystallographic orientation. The hexagonal skyrmion lattice crystallizes within the (001) plane perpendicular to the applied field and skyrmion tubes extend along . According to Ref. (?), one of the reciprocal lattice vectors of the skyrmion lattice is expected to be aligned with [100] for this field direction, and thus one of its primitive lattice vectors is pointing along [010], see Fig. 1B.
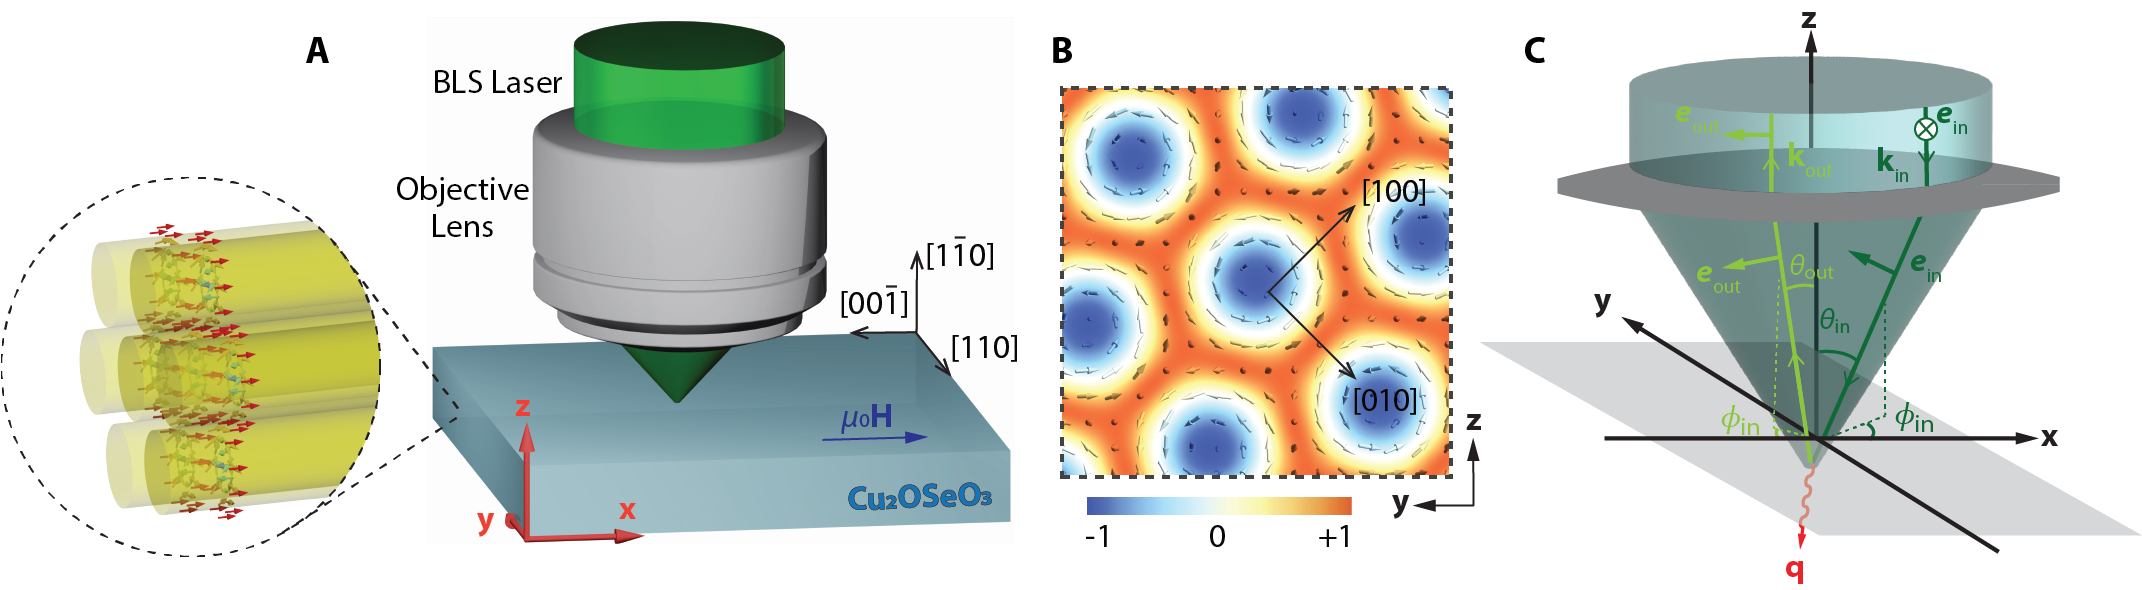
The green laser light with wavelength = 532 nm is incident along the direction with linear polarization along and the back-reflected light propagating along is detected with linear polarization along , where the unit vectors in the crystallographic basis are given by and , see Fig. 1A. Before impinging on the sample, the light beam is focused using an optical lens that generates a conical incident-angle distribution with respect to the -axis, i.e., the crystallographic [10] direction, with a cone angle corresponding to a numerical aperture of 0.55. The diameter of the focus spot on the sample surface is approximately suggesting that the focal point is located roughly below the surface. The lens is also rotating the polarization such that the light cone contains rays with different incoming wavevectors as well as different linear polarizations , see Fig. 1C. Assuming a cylindrical symmetry of the incoming laser beam and the lens, we can parametrize with and the angle of incidence .
The ingoing and outgoing polarization vectors are
| (1) |
with and where .
At the sample surface the light is refracted according to Snell’s law
| (2) |
where , and the prime identifies angles and wavevectors within the sample. The refractive index outside the material is taken as , while inside Cu2OSeO3 we assume at the wavelength of the incoming light (?). In particular, this implies . The polarizations within the sample can be obtained from Eq. (1) by replacing . When the light scatters within the material it transfers momentum and energy to the sample,
| (3) |
where is the speed of light within the material. Compared to the wavevectors of interest, the Faraday rotation (?) is small and will be neglected. The wavevector can be decomposed into two components and that are, respectively, aligned and perpendicular to the applied magnetic field. The component possesses values within the range , and the magnitude of varies from to .
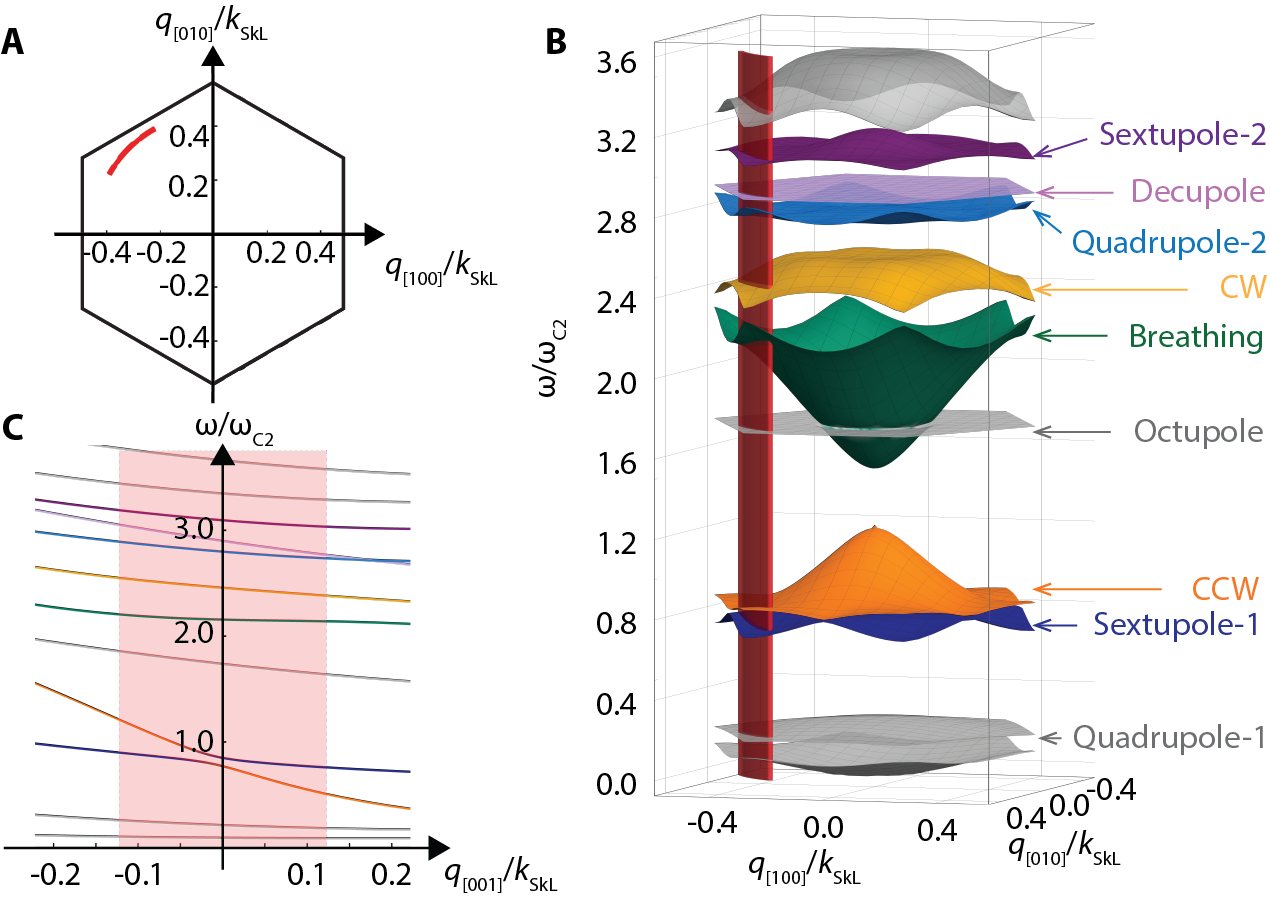
Importantly, is on the same order as the reciprocal lattice vector of the skyrmion lattice in Cu2OSeO3. The value of depends weakly on the applied field, and it is approximately equal, , to the wavevector of the helix phase in this material (see supplementary S8). The inelastic scattering of such light by emission and absorption of single magnons is thus ideally suited to probe their dispersion close to the edge of the first magnetic Brillouin zone. The magnon band structure theoretically expected for the skyrmion lattice phase in cubic chiral magnets (?) is shown in Fig. 2 for with parameters of Cu2OSeO3, where the critical field borders the field polarized phase existing at large . The hexagonal lattice of skyrmions gives rise to a magnetic Brillouin zone sketched in panel A. The circular segment sampled by the component is indicated in red in panel A and B. Panel B displays the dispersion of low-energy spin wave modes of the skyrmion lattice phase for wavevectors within the lattice plane. Colors and labels highlight the modes that are especially important for the present BLS experiment. Only the CCW (orange), breathing (green), and CW (yellow) modes are dipole active at the -point. Note in particular that due to their strong dispersion the excitation frequency of the CCW and the breathing mode within the experimentally accessible regime of the red segment differ substantially from their frequencies at the -point. Panel C shows the dispersion as a function of along the skyrmion tubes at a fixed pointing along ; the red-color-shaded area indicates the range accessible by . The CCW mode possesses a particular strong non-reciprocity as previously discussed in Ref. (?).
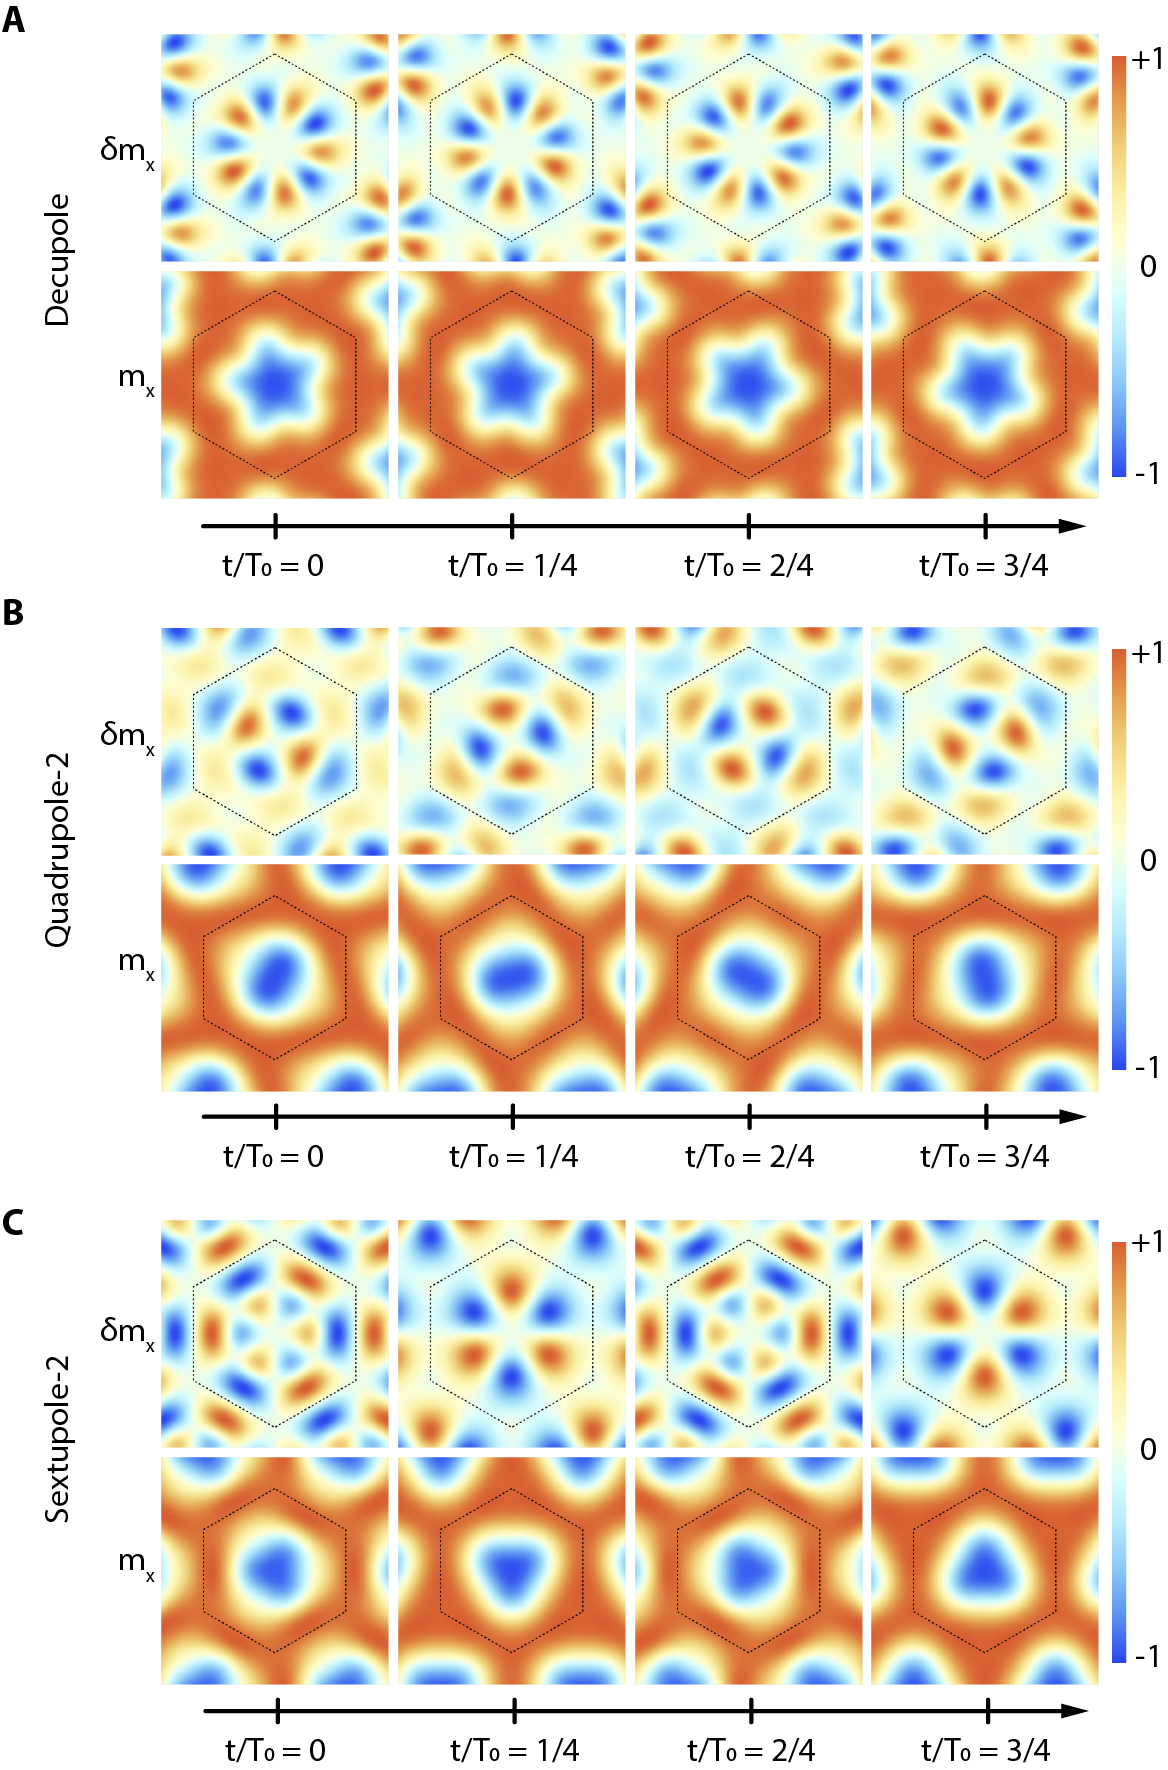
The other labeled modes in Fig. 2B can be characterized by the angular symmetry of the magnon eigenfunctions that determine the corresponding dynamic deformation of the skyrmion within each unit cell. The sextupole-1 (dark blue) and octupole mode hybridize with the dipole-active modes as reported in (?). The quadrupole-2 (light blue) and sextupole-2 (purple) modes are second-order modes with more involved radial profiles than the respective first-order modes, quadrupole-1 and sextupole-1. The decupole mode (pink) is a first-order mode resulting in a five-fold symmetric deformation of skyrmions within each unit cell. Figure 3 illustrates the predicted temporal evolution of the decupole, quadrupole-2, and sextupole-2 modes when excited near the -point. The short wavelengths and anti-phase spin-precessional motion inside the Wigner-Seitz cell of the skyrmion lattice make the detection of these modes particularly challenging.
BLS of magnons of the metastable skyrmion lattice phase
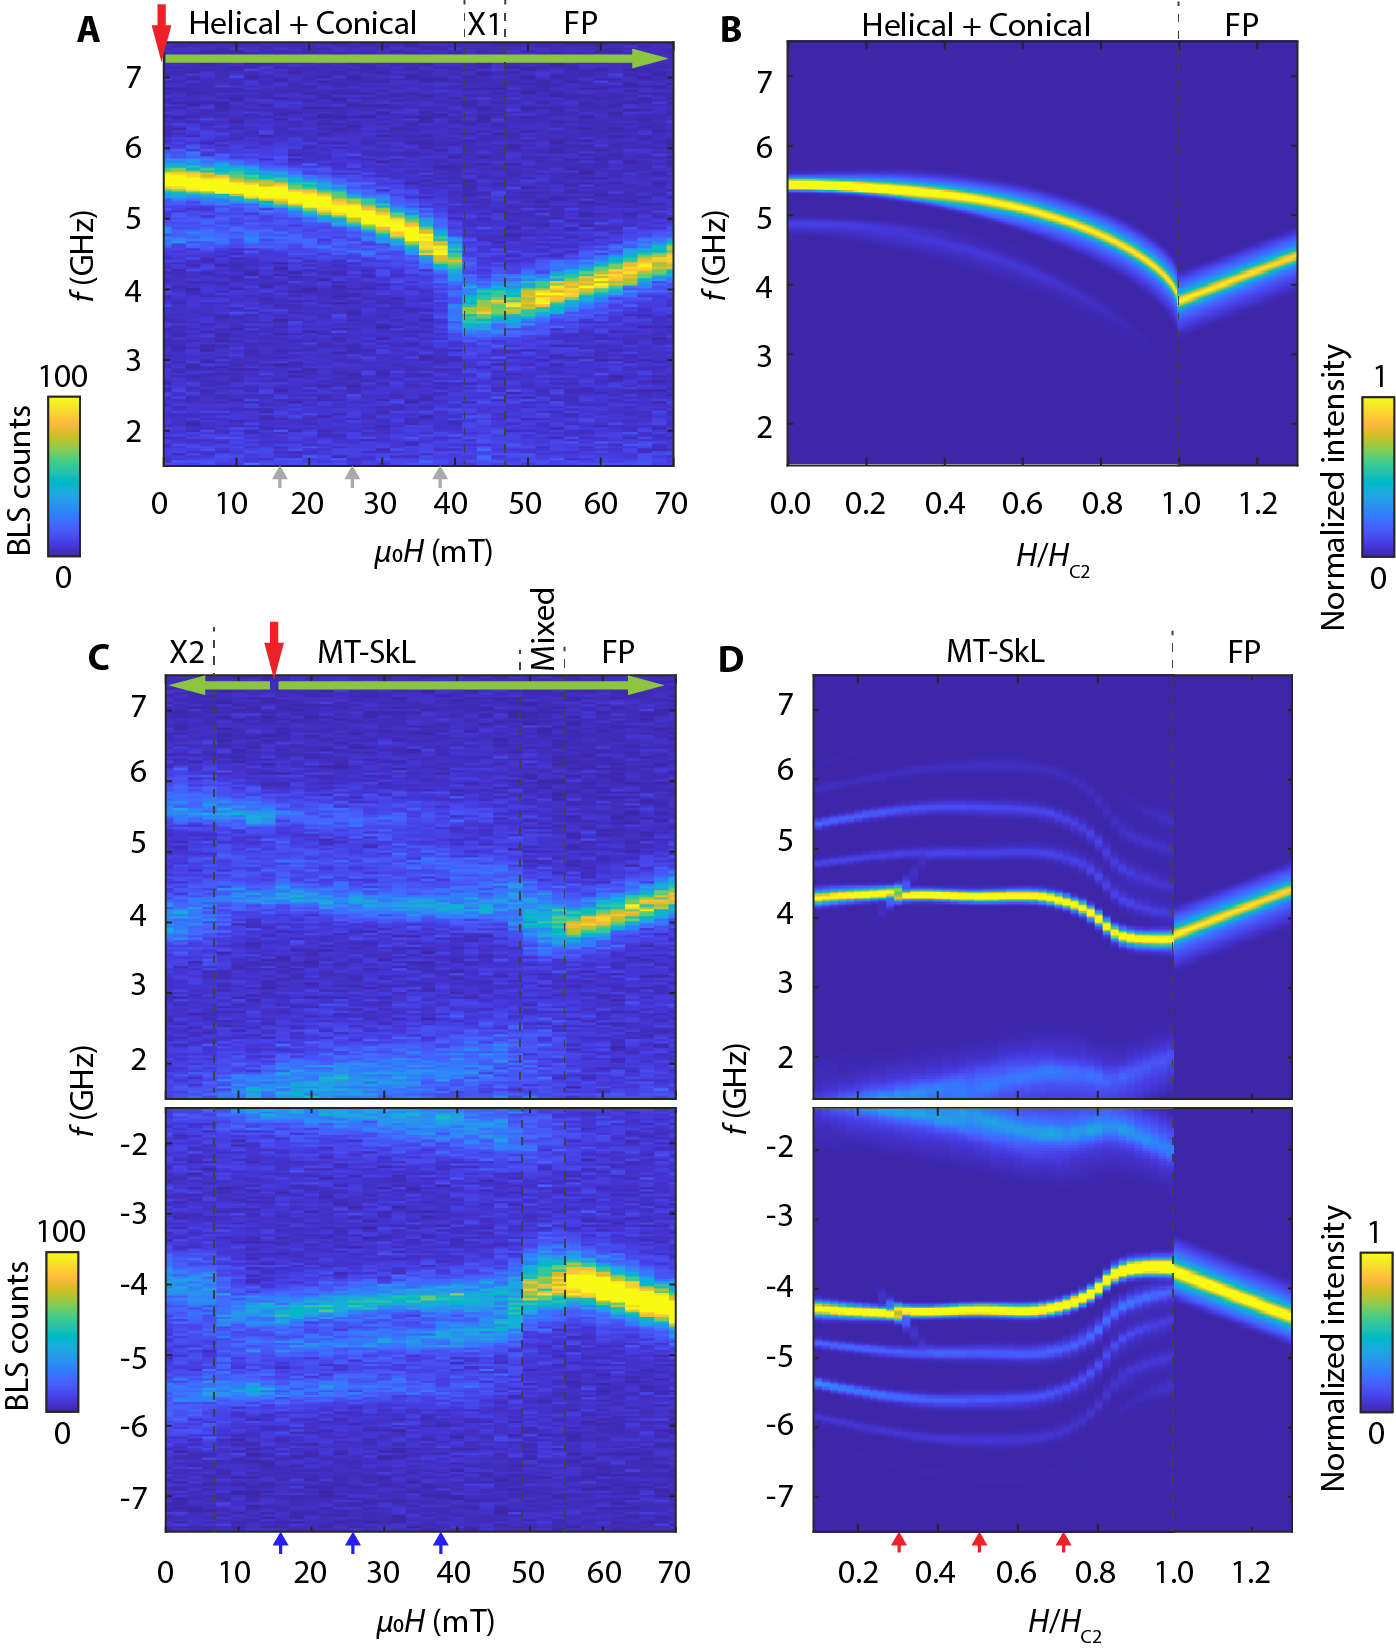
As a benchmark, we present in Fig. 4A the intensity maps of experimental BLS spectra obtained in the conical helix phase and field-polarized phase of Cu2OSeO3. In Fig. 4B, the corresponding theoretical spectra are shown, that will be explained further below. The color-coded spectra of Fig. 4A contain branches (yellow) which follow a field dependency consistent with a previous work using an unfocused laser beam (?). They substantiate the good quality of our chiral magnet Cu2OSeO3. These experimental spectra were taken in a zero-field cooling (ZFC) protocol, i.e., the sample was cooled down at as indicated by the red arrow, see Materials and Methods section and Supplementary Fig. S1 for details. After stabilizing the temperature at 12 K, the external field was increased from 0 mT to 70 mT as indicated by the green arrow. In the field range from 0 mT to 38 mT, a mode with large intensity and a mode with weaker spectral weight and lower frequency are clearly resolved that we attribute, respectively, to the +Q and -Q modes of the conical helix phase (?, ?, ?). At around 40 mT, the slope of the frequency-versus-field dependence of the resonance reverses from negative to positive, which indicates a phase transition. This is confirmed by AC susceptibility measurements yielding a finite imaginary part in that field range, see Supplementary Fig. S2. There might exist an intermediate phase attributed to either a tilted-conical or a low-temperature skyrmion lattice phase; both phases are known, respectively, to be metastable and stable due to magnetocrystalline anisotropies in Cu2OSeO3 at low temperatures for the present field orientation (?, ?, ?). For larger fields above mT, the resonance exhibits a field dependency typically attributed to the Kittel mode. This behavior indicates that the field polarized phase is reached.
Figure 4C displays the BLS intensity map after a field-cooling (FC) protocol at a rate of 25 K/min, i.e., the sample was cooled to the same temperature of 12 K but with a finite field mT applied (red arrow). The process is sketched in Supplementary Fig. S1 panel B. The field was chosen such that during the cooling process the sample passed through the high-temperature skyrmion lattice phase characterized by both the AC susceptibility and BLS spectra conducted at = 50 K (Supplementary Materials Fig. S2 and S3) and realized a metastable skyrmion lattice at 12 K. When increasing from 16 mT to about 55 mT, we indeed find completely different BLS spectra with multiple resonances between 1.4 GHz to 7.5 GHz. Both, Stokes at negative frequency and Anti-Stokes signals at positive frequency are plotted corresponding, respectively, to the emission and absorption of spin waves. We find an asymmetry of intensity between the two signals with the Stokes component being enhanced compared to the Anti-Stokes one. In the field-polarized phase beyond 55 mT, a spectrum consistent with the high-field branch of Fig. 4A is detected. After warming up the sample to 100 K and cooling down again to 12 K with mT applied, we took spectra for fields smaller than 16 mT. Importantly, the branches at small field align well to the ones detected above mT. We note that selected branches change slopes or fade out for mT indicating a phase transition near zero field. In this work, we focus on fields mT.
Theory for micro-focused BLS of magnons of the skyrmion lattice
Generally, the BLS differential cross section can be expressed in terms of a correlation function for the fluctuations of the dielectric permittivity (?)
| (4) |
up to a proportionality factor that depends on the frequency of the light. specifies the light polarization within the sample. In the present work, the laser beam is focused and we get for the total scattering cross section
| (5) |
Assuming that each light ray scatters independently, we can integrate over intensities of the incoming light beam. For a homogeneous intensity distribution within the cylindrical beam, the intensity is proportional to its area and we get for a angular segment, , where the radius can be expressed in terms of the angle of incidence with the focal length F of the lens. Integrating over all segments amounts to the first integral in Eq. (5) with the focal cone angle .
The solid angle of the outgoing wavevector, , needs to be integrated over all scattering events that finally reach the detector. For the focused setup, it is important to realize that the map of the solid angle inside the sample onto the detector far outside the sample strongly depends on the real space position where the scattering occurs. It is appreciable only for scattering events taking place within a microscopic volume around the focal point of the lens. Its linear dimension is proportional to where F is the focal length and is the distance between the lens and the detector. For the current setup F = 2 mm and is around 2.9 m yielding a length on the order of micrometer. On the one hand, this scattering volume is large enough to allow for a spectroscopic detection of magnon wavevectors with sufficient resolution, i.e. m according to the uncertainty principle. On the other hand, this scattering volume is sufficiently small such that the setup is likely to probe only a single magnetic domain. Effectively, we can thus limit ourselves to scattering events occurring in the vicinity of the focal point. The condition that the outgoing light reaches the detector then amounts to integrating the solid angle over the domain and with and . The BLS intensity displayed in Fig. 4 is related to the scattering cross section via .
In linear order of spin wave theory, we can expand the magnetization up to first order in the spin wave amplitude where is the magnetization profile in equilibrium sketched in Fig. 1B. Magnons will induce fluctuations in the dielectric permittivity,
| (6) |
where the tensors and comprise the magneto-optic constants for the cubic material. Using the above expression, we can relate the BLS cross section to the dynamical magnetic response function attributed to magnons.
The low-energy magnetization dynamics in Cu2OSeO3 is well described by a continuum theory comprising the exchange interaction, Dzyaloshinskii-Moriya interaction, Zeeman term and dipolar interaction. All parameters are known from independent measurements providing a parameter-free prediction of the dynamics. Magnetocrystalline anisotropies are relatively small but are known to stabilize additional phases at low temperatures (?, ?, ?) and potentially account for the behaviour in the small field ranges denoted by , and Mixed in Fig. 4. As these field ranges are not at the focus of this work, we neglect magnetocrystalline anisotropies in the following and restrict ourselves to the universal theory valid in the limit of small spin-orbit coupling.
For the conical helix and the field-polarized phase in Cu2OSeO3 the BLS cross section was evaluated previously in Ref. (?), and in Fig. 4B we present the theoretical results for the focused BLS setup. The focused beam generates a distribution of transferred wavevectors . As a consequence, the transferred energy will cover a range that is determined by the dispersion of the magnon mode, which results in an extrinsic spectral lineshape. In the following theoretical discussion, we limit ourselves to this extrinsic broadening due to the BLS setup using a focused laser beam (?), and we do not consider the small intrinsic damping of spin waves in Cu2OSeO3 (?). Figure 4B shows the calculated Anti-Stokes component corresponding to the absorption of magnons. In the conical phase, , the and mode with higher and lower frequency, respectively, can be clearly distinguished, whereas in the field polarized phase, , a single branch remains. The response function for magnons in the skyrmion lattice phase was previously evaluated in the context of inelastic neutron scattering and we refer the reader to Ref. (?) for details. Here, we calculate their BLS intensities. The color-coded intensities are shown in Fig. 4D for where various distinct branches can be recognized in the skyrmion lattice phase.
Quantitative comparison between theoretical and experimental BLS spectra
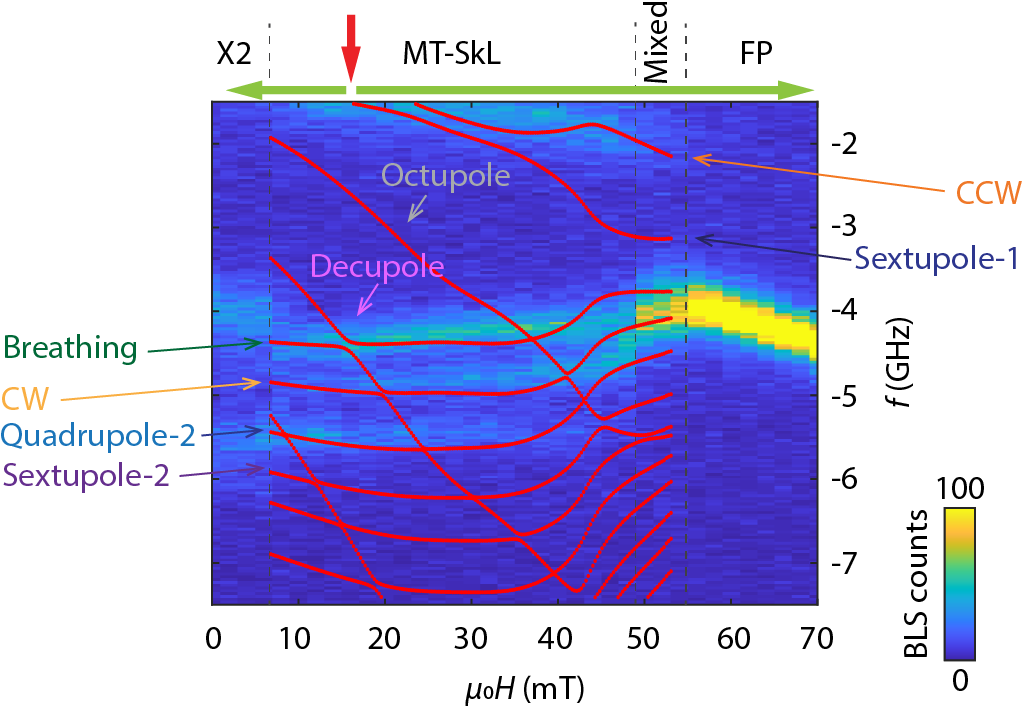
In order to facilitate the following discussion, the experimental Stokes spectrum is shown again in Fig. 5 overlaid with the theoretical magnon branches calculated for the fixed wave vector rad corresponding to an angle of incidence in the present setup. At low absolute frequency most of the spectral weight is attributed to the CCW mode. As magnons with a finite wavevector are probed by BLS a hybridization of the CCW with the sextupole-1 mode is expected even in the absence of magnetocrystalline anisotropies (?), see also Fig. 4D. The spectral weight of the measured CCW mode is distributed over a relatively broad frequency range due to its strong dispersion for out-of-plane wavevectors, see Fig. 4C, over which the focused BLS setup collects the scattered photons. The appreciable wavevector distribution and overall small signal-to-noise ratio might explain why the hybridization with the sextupole-1 mode is not resolved experimentally. The narrow branch with relatively large intensity between 4 and 4.5 GHz is ascribed to the breathing mode whose absolute frequency decreases with increasing field in contrast to the CCW mode. The detected difference in eigenfrequencies between the CCW and breathing mode is much larger than that observed with microwave spectroscopy. This large difference reflects the opposite dispersion in the two minibands with increasing in-plane wavevectors as shown in Fig. 2B. The frequency gap predicted for the avoided crossing with the decupole mode is not resolved. Still, the experimental breathing mode branch exhibits the anticipated small blue shift next to the predicted gap toward small . We attribute the intensity at around GHz to the CW mode. The branch at about 5.5 GHz which stays nearly constant with field is consistent with the predicted quadrupole-2 mode. Its constant frequency up to about 40 mT is distinctly different from the mode of the previously discussed conical phase whose frequency drops considerably with (see Supplementary Fig. S5 for comparison). In the theoretical spectra of Fig. 4D the sextupole-2 mode possesses a strikingly small spectral weight. In the experimental intensity map of Fig. 5 this branch is not clearly resolved. We will readdress the sextupole-2 mode when analyzing quantitatively the line cuts shown in Fig. 6. The strongly dispersing octupole mode possesses a negligible BLS spectral weight.
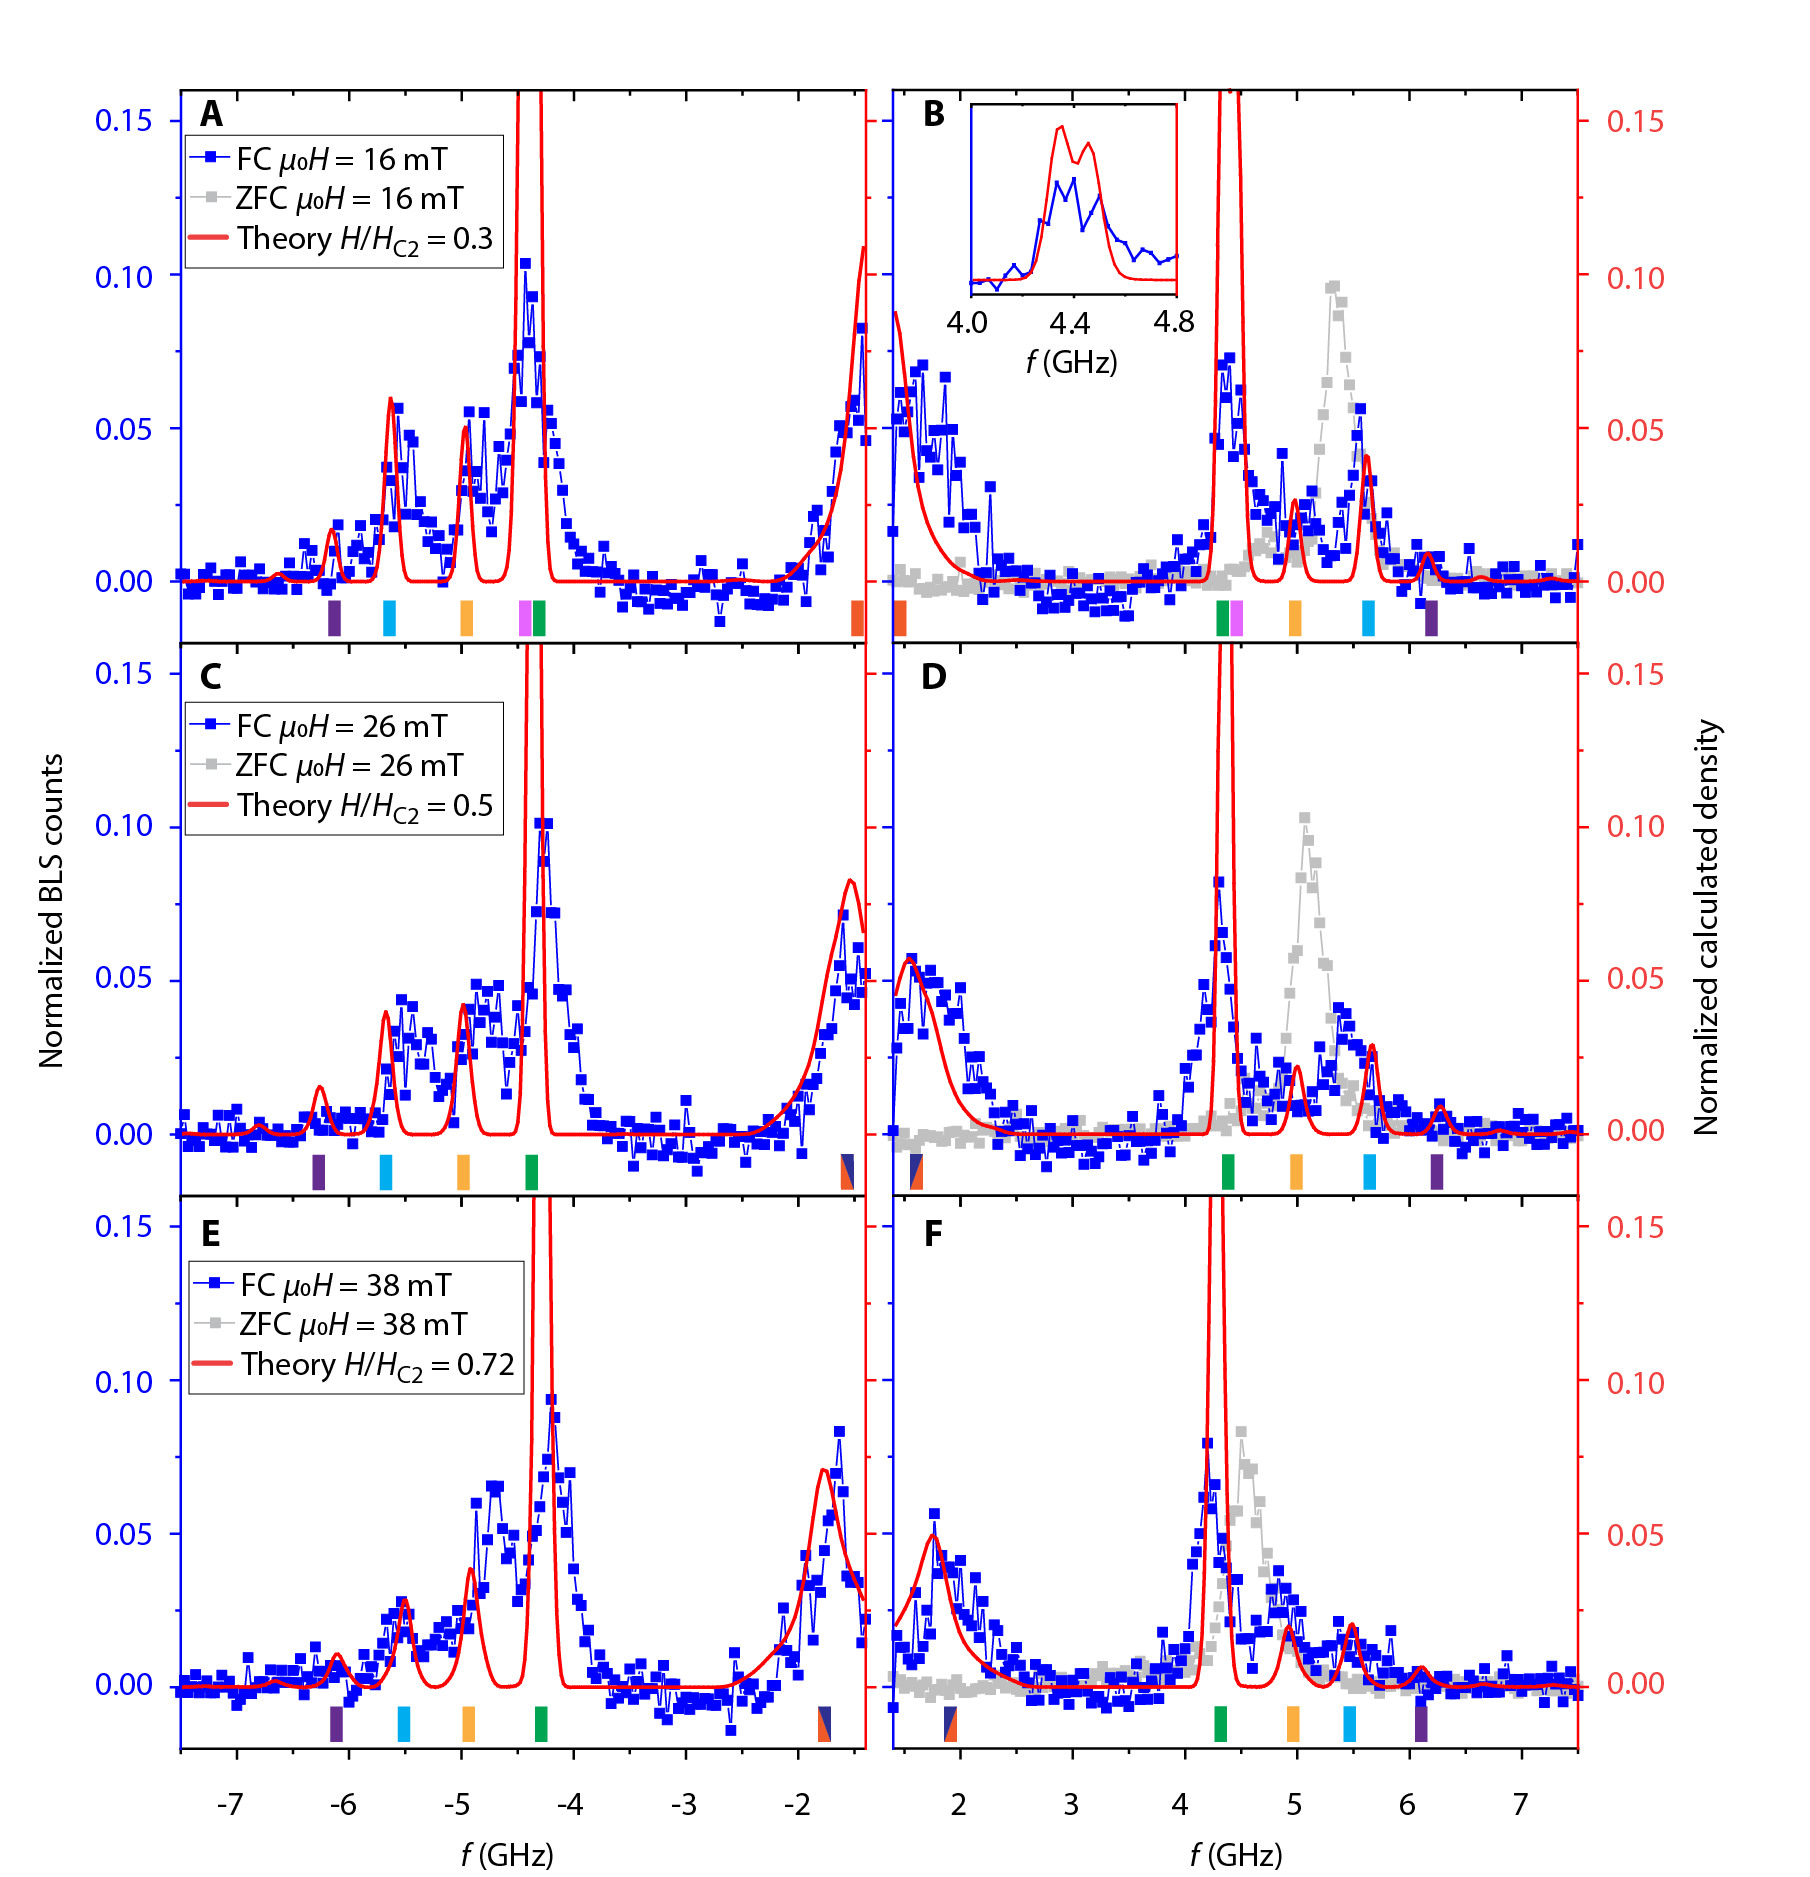
For the quantitative comparison between theory and experiment, we present in Fig. 6 line cuts of the spectral weights at three distinct magnetic fields, and mT, as indicated by the three arrows at the bottom of Fig. 4C and D. The blue symbols are the experimental data of the metastable skyrmion lattice phase, Fig. 4C, and the grey symbols, as a reference, correspond to the conical state, Fig. 4A. The red solid lines are the theoretical BLS spectra. The colored bars at the bottom of each panel identify the various modes which we analyze. The CCW mode (orange) at smallest frequencies possesses a large spectral weight. At 26 mT it hybridizes with the sextupole-1 mode (dark blue) so that these two modes are not clearly separated. The breathing mode (green) gives rise to a large spectral peak positioned between 4 and 4.5 GHz. At 16 mT it hybridizes with the decupole mode (pink), see inset of Fig. 6B. The BLS spectra at positive (Anti-Stokes) and negative (Stokes) frequencies possess features that are reminiscent of this hybridization. The CW mode (yellow) is predicted to exhibit a relatively small spectral weight. It is better resolved in the Stokes than the Anti-Stokes spectrum. At the finite wavevector probed in the BLS experiment, the quadrupole-2 mode (light blue) is predicted to possess a larger spectral weight than the CW mode, in agreement with the experimental observation. For the sextupole-2 mode (purple), the theoretical spectra show extremely small spectral weights. At 16 mT, the line cut of the experimental BLS data maintains indeed a finite signal strength above the noise floor in the relevant frequency regime of the sextupole-2 mode. With increasing the predicted signal strength becomes weaker. Correspondingly, the BLS experiment does not resolve the sextupole-2 mode at larger .
In Fig. 6 we depict in light gray color the Anti-Stokes spectra for comparison which we took in the conical phase by means of the ZFC protocol. There are clear discrepancies in peak positions and field dependencies between the two measurement protocols. The characteristics of modes in the metastable skyrmion lattice phase (blue) are distinctly different from the conical phase (gray).
Illustration of the decupole, quadrupole-2 and sextupole-2 modes
In Fig. 3 we have illustrated the microscopic nature the decupole, quadrupole-2 and sextupole-2 modes, respectively, when excited with at the center of the Brillouin zone. The evolution of their spin wave function is shown in the first rows of Fig. 3A, B and C, and it reflects, respectively, the decupolar, quadrupolar and sextupolar character of the three modes. A typical feature of the quadrupole-2 and sextupole-2 modes, that distinguishes them in particular from the corresponding quadrupole-1 and sextupole-1 modes, is the node in their wave function as a function of radial distance for a generic time. This node separates the wave function into an inner ring and an outer ring which rotate as a function of time in opposite directions, see also the movies (Movie1 to Movie5 for CCW, breathing, CW, quadrupole-2 and sextupole-2 modes) in the supplementary materials. The resulting decupole, quadrupole and sextupole deformation of the equilibrium magnetization of Fig. 1B and its time evolution is shown, respectively, in the second row of Fig. 3A, B and C.
DISCUSSION
We evidenced that micro-focus BLS resolves relevant higher order magnon modes of the skyrmion lattice phase which have not been yet addressed by either microwave spectroscopy or neutron scattering previously applied to the chiral magnet Cu2OSeO3. In the backscattering geometry, the BLS probes spin waves with a relatively large wavevector, , on the order of the reciprocal lattice vector of the periodic magnetic texture. Thereby, it monitors the dispersion in an intermediate wavevector regime and is complementary to the other experimental methods that are sensitive to either small, , or large, , wavevectors, respectively.
The good agreement of the experimental data with theoretical predictions for both the eigenfrequencies and the spectral weights has allowed us to identify various modes. We found clear evidence for the wavevector dependent eigenfrequencies of the CCW, breathing and CW modes which were previously studied at the -point (). In addition, we report on the experimental detection of so far unexplored modes. In particular, a mode with quadrupole character, denoted as quadrupole-2, is well resolved in our spectra over a broad field regime. For a magnon mode with sextupole character, denoted as sextupole-2, small spectral weights are predicted. Its signatures appear with a correspondingly small signal-to-noise ratio in the BLS spectra at 16 mT. At larger , this mode is not resolved experimentally. The multitude of nodes within the Wigner-Seitz cell of Fig. 3B corresponds to pronounced anti-phase precession of neighboring spins belonging to a single skyrmion. At the finite of the BLS experiment, only a weak net spin precession per skyrmion can remain which explains the challenging detection by inelastic light scattering via the dynamic permittivity tensor components. The mode pattern hence motivates the correspondingly small signals of the sextupole-2 mode in both the experimental data and theoretical curves. Similarly, the decupole mode only possesses a small BLS spectral weight for a magnetic field where it hybridizes with the breathing mode, and we find preliminary evidence for such a hybridization in our spectra at 16 mT.
The agreement between the experimental and theoretical BLS spectra, see Figs. 4 and 5, is remarkably good given that the theoretical modelling of the complex micro-focused BLS setup was based on minimal assumptions. We employed the standard theory for cubic chiral magnets valid in the limit of small spin-orbit coupling that neglects magnetocrystalline anisotropies. This theory is characterized by three parameters only (?): a frequency scale , where is the gyromagnetic ratio, is the magnetic constant, and is the internal critical field, a wavevector scale and the ratio , with the saturation magnetization , that corresponds to the susceptibility within the conical phase and quantifies the strength of the dipolar interaction. For the latter two parameters we took values from the literature, i.e., rad and reported in Ref. (?). We fitted the frequency scale to our experimental data within the field-polarized phase and obtained GHz that agrees within our error bar with the value 2.06 found by Ogawa et al. (?). For the BLS matrix elements, we needed, furthermore, the magneto-optic constants in Eq. (6). In a cubic material, the tensor , with the Levi-Civita symbol , is characterized by a single constant that can be absorbed in the overall absolute intensity. The higher-order tensor accounts for the asymmetry of Stokes and Anti-Stokes intensities, and within the field-polarized phase we found a satisfactory fit for the values and in Voigt notation (see Supplementary Materials Fig. S7). After having fixed all these parameters, we obtained, up to the absolute intensity, the parameter-free theoretical prediction for the magnon dispersion and the BLS spectra for the skyrmion lattice phase shown in Figs. 2 and 4, respectively, that describe reasonably well the experimental data.
We note that the value for the frequency scale GHz implies for a -factor of (?) an internal critical field mT that overestimates the value found experimentally mT (see Supplementary Materials Fig. S6) where mT and the demagnetization factor . A similar discrepancy was found in the laser-based experiments performed by Ogawa et al. (?). The origin of this inconsistency is unclear but could be due to local heating by the laser or due to the so far neglected magnetocrystalline anisotropies. Such anisotropies arise as corrections to the standard theory in a systematic expansion in powers of spin-orbit coupling. However, already in lowest order it involves many unknown additional coupling constants involving not only the cubic magnetocrystalline anisotropies but also various exchange anisotropies that are of similar importance. Without the knowledge of all these parameters the theory looses its predictive power, and so we decided to limit ourselves here to the minimal theory. We expect these corrections to become relevant when accounting for the signatures and in the spectra of Fig. 4. In particular, in the low-field regime the metastable skyrmion lattice might undergo an oblique distortion resulting in an elongated skyrmion lattice phase as discussed in Refs. (?) and (?). The distortion provides a potential explanation for the reconstruction of the spectra in the field range below 6 mT. Above 50 mT before entering the field-polarized (FP) phase in Fig. 4, the spectrum reconstructs with a large intensity close to 4 GHz. In this field range, a conical state, a tilted-conical state or some other magnetic order might be realized resulting in a coexistence of various magnetic states denoted as Mixed in Figs. 4C and 5. Interestingly, close to this field range the theoretically predicted frequencies of the three modes, breathing, CW, and quadrupole-2, strongly bend towards smaller frequencies partially reflecting the trend also observed experimentally. These aspects will be further investigated in future work.
In the focused BLS setup the scattering probability is summed over a range of solid angles for in- and outgoing wavevectors. This gives rise to spectral line shapes that depend on the dispersion of each mode. In particular, the pronounced non-reciprocity of the dispersion of the CCW mode discussed previously (?) is reflected in its broad linewidth in spectra obtained by a focused BLS setup. As an outlook, we note that the small laser spot, combined with a cryogenic scanning stage, might be further used to probe spectra locally and even identify a topological magnon edge mode materialising at the border of skyrmion lattice domains (?, ?).
The present study demonstrates that focused BLS is an effective tool to study spin waves of the skyrmion lattice in the chiral magnet Cu2OSeO3 with high frequency resolution. Combined with the quantitative theory which models the distribution of transferred wave vectors in the scattering process the minibands in the first Brillouin zone are explored. Our quantitative understanding of such bands substantially promotes the control and engineering of magnonic crystals with topological magnon band structures operating at microwave frequencies.
MATERIALS AND METHODS
Sample description
The Cu2OSeO3 bulk was grown by chemical vapor transport (CVT) method and shaped to the dimension of about 4 mm 3 mm 0.5 mm. Three axes of the samples [001] [110] [10] were characterized by diffraction patterns taken with a transmission electron microscope on a lamella fabricated from the same bulk Cu2OSeO3 crystal. The top surface of the samples was polished for BLS laser focusing. A bipolar magnetic field was applied along -axis. The sample orientation with respect to the incident laser is illustrated in Fig. 1A. The phase diagram was characterized by AC susceptibility measurements and is shown in the Supplementary Fig. S2.
Temperature-versus-field histories
Two typical temperature-versus-field histories were exploited in the BLS experiments: zero-field cooling (ZFC) with field sweeps up and field cooling (FC) with field sweeps in both directions. They are sketched in Supplementary Materials Fig. S1. The current in the magnet coils for zero magnetic field was calibrated at room temperature. Within the protocol of ZFC, the magnetic field was increased from zero after the cooling process. Within the protocol of FC, the cooling process was performed with a certain cooling field applied, e.g. 16 mT. After reaching the relevant temperature the field was either (i) scanned up or (ii) scanned down from the cool-down field. In between each two scans (i) and (ii), the sample was heated up to at least 100 K for 10 minutes and cooled down again. Spectra were collected after the temperature had been stabilized for 10 minutes. The Stokes and Anti-Stokes spectra at each field were collected at the same time.
Cryogenic micro-focused Brillouin light scattering setup
We use a monochromatic continuous-wave solid-state laser with a wavelength of nm. The scattered photons were analyzed with a six-pass Fabry–Perot interferometer TFP-2 (JRS Scientific Instruments). A Mitutoyo M Plan Apo SL 100x objective lens with NA = 0.55 (numerical aperture) was utilized for focusing the laser on the Cu2OSeO3 sample residing in a magnetooptical cryostat. The closed-cycle cryostat was equipped with magnetic field coils. The Cu2OSeO3 sample was placed on a cold finger where a slip-stick step-scanner was installed to position the sample. Microscopy images were taken by a charge-coupled device (CCD) camera so that we located the laser at specific positions during the measurements. Right beneath the sample, a thermal sensor and a heater was placed. Thereby we achieved fast cooling of the sample temperature with a rate of up to 25 K min-1. Our cool-down procedure fulfils the reported quenched metastable skyrmion lattice mechanism by fast cooling through the skyrmion lattice pocket in the phase diagram (?, ?, ?). In our experiments, the focused BLS green laser of 0.8 mW was applied to the sample during the fast cooling process (?). Resonances of the metastable skyrmion lattice were observed over a wide temperature range from about 10 K to 40 K (Supplementary Materials Fig. S4). BLS spectra similar to the reported ones were recorded when we applied different cooling fields of 10 mT 16 mT with a cooling rate of 6 K min-1. The stable skyrmion lattice phase was noticed in BLS at a sample holder temperature of 50 K in that clearly shifted mode frequencies appeared between 10 mT to 16 mT (Supplementary Materials Fig. S3). The discrepancy between the transition temperatures observed in BLS and in AC susceptibility measurements was attributed to the different mounting of the sample and the additional heating by the laser in the BLS experiment.
Theory for the chiral magnet
For the theoretical description of the magnetization dynamics of the chiral magnet we follow previous work (?, ?, ?, ?, ?, ?, ?, ?) and use the free energy functional with
| (7) |
where is the exchange interaction, is the DMI, is the saturation magnetization, is the magnetic field constant, and is the applied magnetic field. We assume a left-handed system with . In this work, we focus on transversal spin fluctuations and use for the parameter , which fixes the length of the normalized magnetization vector to unity up to deviations on the level of a percent. The magnetization field can then be identified with . The magnetic dipolar interaction reads
| (8) |
The Fourier transform of the susceptibility, , for wavevectors larger than the inverse linear system size is given by whereas in the opposite limit it can be approximated, , by the demagnetization matrix with unit trace tr. In the limit of small spin-orbit coupling, corrections to this theory, which includes magnetocrystalline anisotropies, are parametrically small as they are suppressed by higher powers of spin-orbit coupling.
The magnetisation dynamics in the absence of damping is described by the Landau-Lifshitz equation
| (9) |
with the gyromagnetic ratio . In order to access the magnetization dynamics, this equation was treated perturbatively in the framework of linear spin-wave theory by expanding it up to linear order in the deviations from the static equilibrium state, .
The above theory possesses the characteristic wavevector and frequency scale, and , respectively. The effective strength of the dipolar interaction can be quantified by the dimensionless parameter . The mean-field ground state of the theory changes from the field-polarized phase to the conical helix phase at the critical internal field , which can be also related to the frequency scale .
Theory for the BLS cross section
On the level of linear spin wave theory, the correlation function of the dielectric permittivity in Eq. (4) can be expressed in terms of the spin correlation function using Eq. (6),
| (10) | |||
For a cubic material the magneto-optic tensors reduce to , where is the antisymmetric Levi-Civita tensor and is a parameter, and is specified by three parameters only, , , and . The parameter determines the total spectral weight and can be absorbed in the overall proportionality constant of the total cross section (5). The higher-order tensor is responsible for the asymmetry between the intensities of Stokes and anti-Stokes signals. Fitting the excitation spectra within the field-polarized phase using the theory of Ref. (?) we found a reasonable agreement for the values and , which we also used for the calculation within the skyrmion lattice phase.
With the help of the fluctuation-dissipation theorem, the Fourier transform of the magnetic correlation function with respect to the time difference can be related to the response function
| (11) |
with Boltzmann constant and temperature . In the last approximation we used that we work in the limit . Note that the correlation function only depends on the time difference due to invariance with respect to time translations. However, as the skyrmion lattice breaks translational symmetry of space the correlation and response functions will also depend on . The correlation function that eventually enters the differential cross section (4) can thus be expressed as
| (12) | |||
where we averaged the dependence on over the volume . For the skyrmion lattice, the equilibrium magnetization and the response function in particular were evaluated previously in the context of inelastic neutron scattering and for details we refer the reader to the supplementary information of Ref. (?). In the present context it is important to note that the length of the reciprocal lattice vector depends on the magnetic field, see supplementary Fig. S7. The time and spatial evolution of certain magnon modes is illustrated in supplementary Fig. S8 as well as in the supplementary videos.
In the micro-focused BLS setup only scattering events are detected that occur close to the focal point of the lens. The volume probed by the setup can be estimated with the help of the thin lens equation where is the object distance, is the image distance and F is the focal length. If the scattering event occurs at the focus with , the image distance is infinite and a maximal amount of outgoing photons will reach the detector. This remains true as long as the image distance is larger than the distance to the detector, , resulting in a maximal object distance . Only scattering events that occur at a distance between F and from the lens thus contribute substantially, that corresponds to a linear extension , for , of the scattering volume around the focal point. For the parameters mm and this amounts to . Accounting for the refraction at the surface of the sample this estimate changes and the linear extension of the scattering volume is enhanced by roughly a factor of 2. Nevertheless, the size of the scattering volume remains mesoscopic in the sense that it is much larger than the unit cell of the skyrmion lattice but probably smaller than the typical domain size.
From these considerations follows that we can limit ourselves to scattering events close to the focal point and sample over outgoing photon wavevectors that cover the full aperture of the lens. The total scattering cross section of Eq. (5) thus becomes
| (13) |
where . We have also transformed the integral over the angles of the incoming photon wavevector to angles defined within the sample where the distribution
| (14) |
For the evaluation it is convenient to express the total cross section in the following form
| (15) |
with the auxiliary tensor function
| (16) | ||||
where the two integrals are convoluted via the delta function. This auxiliary function was determined numerically for a sufficiently dense mesh of wavevectors and, afterwards, the total cross section was evaluated using Eq. (15) by discretizing the -integral. In addition to Figs. 4D and 6, the resulting frequency dependence of the total scattering cross section is illustrated for various magnetic fields in supplementary Fig. S9 .
Supplementary materials
Supplementary Text
Figs. S1 to S10
Movies: Movie1 to Movie5
References
- 1. S. Mühlbauer, B. Binz, F. Jonietz, C. Pfleiderer, A. Rosch, A. Neubauer, R. Georgii, P. Böni, Skyrmion lattice in a chiral magnet. Science 323, 915–919 (2009).
- 2. X. Z. Yu, Y. Onose, N. Kanazawa, J. H. Park, J. H. Han, Y. Matsui, N. Nagaosa, Y. Tokura, Real-space observation of a two-dimensional skyrmion crystal. Nature 465, 901–904 (2010).
- 3. X. Z. Yu, N. Kanazawa, Y. Onose, K. Kimoto, W. Z. Zhang, S. Ishiwata, Y. Matsui, Y. Tokura, Near room-temperature formation of a skyrmion crystal in thin-films of the helimagnet FeGe. Nat. Mater. 10, 106-109 (2011).
- 4. S. Seki, X. Z. Yu, S. Ishiwata, Y. Tokura, Observation of skyrmions in a multiferroic material. Science 336, 198–201 (2012).
- 5. A. Bauer, C. Pfleiderer, Magnetic phase diagram of MnSi inferred from magnetization and ac susceptibility. Phys. Rev. B - Condens. Mater. Phys. 85, 214418 (2012).
- 6. T. Adams, A. Chacon, M. Wagner, A. Bauer, G. Brandl, B. Pedersen, H. Berger, P. Lemmens, C. Pfleiderer, Long-wavelength helimagnetic order and skyrmion lattice phase in Cu2OSeO3. Phys. Rev. Lett. 108, 237204 (2012).
- 7. P. Milde, D. Köhler, J. Seidel, L. M. Eng, A. Bauer, A. Chacon, J. Kindervater, S. Mühlbauer, C. Pfleiderer, S. Buhrandt, C. Schütte, A. Rosch, Unwinding of a skyrmion lattice by magnetic monopoles. Science 340, 1076–1080 (2013).
- 8. Y. Tokunaga, X. Z. Yu, J. S. White, H. M. Rønnow, D. Morikawa, Y. Taguchi, Y. Tokura, A new class of chiral materials hosting magnetic skyrmions beyond room temperature. Nat. Commun. 6, 7638 (2015).
- 9. K. Karube, J. S. White, N. Reynolds, J. L. Gavilano, H. Oike, A. Kikkawa, F. Kagawa, Y. Tokunaga, H. M. Rønnow, Y. Tokura, Y. Taguchi, Robust metastable skyrmions and their triangular-square lattice structural transition in a high-temperature chiral magnet. Nat. Mater. 15, 1237–1242 (2016).
- 10. C. Back, V. Cros, H. Ebert, K. Everschor-Sitte, A. Fert, M. Garst, T. Ma, S. Mankovsky, T. L. Monchesky, M. Mostovoy, N. Nagaosa, S. S. P. Parkin, C. Pfleiderer, N. Reyren, A. Rosch, Y. Taguchi, Y. Tokura, K. von Bergmann, J. Zang, The 2020 skyrmionics roadmap. J. Phys. D. Appl. Phys. 53, 363001 (2020).
- 11. O. Lee, T. Wei, K. D. Stenning, J. C. Gartside, D. Prestwood, S. Seki, A. Aqeel, K. Karube, N. Kanazawa, Y. Taguchi, C. Back, Y. TOkura, W. R. Branford, H. Kurebayashi, Task-adaptive physical reservoir computing. Nat. Mater. 23, 79-87 (2024).
- 12. M. Krawczyk, D. Grundler, Review and prospects of magnonic crystals and devices with reprogrammable band structure. J. Phys. Condens. Matter. 26, 123202 (2014).
- 13. M. Garst, J. Waizner, D. Grundler, Collective spin excitations of helices and magnetic skyrmions: Review and perspectives of magnonics in non-centrosymmetric magnets. J. Phys. D. Appl. Phys. 50, 293002 (2017).
- 14. A. Roldán-Molina, A. S. Nunez, J. Fernández-Rossier, Topological spin waves in the atomic-scale magnetic skyrmion crystal. New J. Phys. 18, 045015 (2016).
- 15. S. A. Díaz, J. Klinovaja, D. Loss, Topological Magnons and Edge States in Antiferromagnetic Skyrmion Crystals. Phys. Rev. Lett. 122, 187203 (2019).
- 16. S. A. Díaz, T. Hirosawa, J. Klinovaja, D. Loss, Chiral magnonic edge states in ferromagnetic skyrmion crystals controlled by magnetic fields. Phys. Rev. Res. 2, 013231 (2020).
- 17. T. Weber, D. M. Fobes, J. Waizner, P. Steffens, G. S. Tucker, M. Böhm, L. Beddrich, C. Franz, H. Gabold, R. Bewley, D. Voneshen, M. Skoulatos, R. Georgii, G. Ehlers, A. Bauer, C. Pfleiderer, P. Böni, M. Janoschek, M. Garst, Topological magnon band structure of emergent Landau levels in a skyrmion lattice. Science. 375, 1025–1030 (2022).
- 18. R. L. Melcher, Linear Contribution to Spatial Dispersion in the Spin-Wave Spectrum of Ferromagnets, Phys. Rev. Lett. 30, 125 (1973).
- 19. Kh. Zakeri, Y. Zhang, J. Prokop, T.-H. Chuang, N. Sakr, W. X. Tang, and J. Kirschner, Asymmetric Spin-Wave Dispersion on Fe(110): Direct Evidence of the Dzyaloshinskii-Moriya Interaction, Phys. Rev. Lett. 104, 137203 (2010).
- 20. D. Cortés-Ortuño and P. Landeros, Influence of the Dzyaloshinskii-Moriya interaction on the spin-wave spectra of thin films, J. Phys.: Condens. Matter 25, 156001 (2013).
- 21. S. Seki, Y. Okamura, K. Kondou, K. Shibata, M. Kubota, R. Takagi, F. Kagawa, M. Kawasaki, G. Tatara, Y. Otani, and Y. Tokura, Magnetochiral nonreciprocity of volume spin wave propagation in chiral-lattice ferromagnets, Phys. Rev. B 93, 235131 (2016).
- 22. T. J. Sato, D. Okuyama, T. Hong, A. Kikkawa, Y. Taguchi, and Y. Tokura, Magnon dispersion shift in the induced ferromagnetic phase of noncentrosymmetric MnSi, Phys. Rev. B 94, 144420 (2016).
- 23. T. Weber, J. Waizner, G. S. Tucker, L. Beddrich, M. Skoulatos, R. Georgii, A. Bauer, C. Pfleiderer, M. Garst, and P. Böni, Non-reciprocal magnons in non-centrosymmetric MnSi, AIP Adv. 8, 101328 (2018).
- 24. T. Weber, J. Waizner, G. S. Tucker, R. Georgii, M. Kugler, A. Bauer, C. Pfleiderer, M. Garst, and P. Böni, Field dependence of nonreciprocal magnons in chiral MnSi, Phys. Rev. B 97, 224403 (2018).
- 25. T. Weber, J. Waizner, P. Steffens, A. Bauer, C. Pfleiderer, M. Garst, P. Böni, Polarized inelastic neutron scattering of nonreciprocal spin waves in MnSi. Phys. Rev. B. 100, 060404 (2019).
- 26. C. Zhang, C. Jin, J. Wang, H. Xia, J. Wang, J. Wang, Q. Liu, Directional spin-wave propagation in the skyrmion chain. J. Magn. Magn. Mater. 490, 165542 (2019).
- 27. S. Seki, M. Garst, J. Waizner, R. Takagi, N. D. Khanh, Y. Okamura, K. Kondou, F. Kagawa, Y. Otani, Y. Tokura, Propagation dynamics of spin excitations along skyrmion strings. Nat. Commun. 11, 256 (2020).
- 28. N. Ogawa, L. Köhler, M. Garst, S. Toyoda, S. Seki, Y. Tokura, Nonreciprocity of spin waves in the conical helix state. Proc. Natl. Acad. Sci. U. S. A. 118 e2022927118 (2021).
- 29. M. Mochizuki, Spin-wave modes and their intense excitation effects in Skyrmion crystals. Phys. Rev. Lett. 108, 017601 (2012).
- 30. Y. Onose, Y. Okamura, S. Seki, S. Ishiwata, Y. Tokura, Observation of magnetic excitations of skyrmion crystal in a helimagnetic insulator Cu2OSeO3. Phys. Rev. Lett. 109, 037603 (2012).
- 31. Y. Okamura, F. Kagawa, M. Mochizuki, M. Kubota, S. Seki, S. Ishiwata, M. Kawasaki, Y. Onose, Y. Tokura, Microwave magnetoelectric effect via skyrmion resonance modes in a helimagnetic multiferroic. Nat. Commun. 4, 2391 (2013).
- 32. T. Schwarze, J. Waizner, M. Garst, A. Bauer, I. Stasinopoulos, H. Berger, C. Pfleiderer, D. Grundler, Universal helimagnon and skyrmion excitations in metallic, semiconducting and insulating chiral magnets. Nat. Mater. 14, 478–483 (2015).
- 33. I. Stasinopoulos, S. Weichselbaumer, A. Bauer, J. Waizner, H. Berger, S. Maendl, M. Garst, C. Pfleiderer, D. Grundler, Low spin wave damping in the insulating chiral magnet Cu2OSeO3. Appl. Phys. Lett. 111, 032408 (2017).
- 34. A. Aqeel, J. Sahliger, T. Taniguchi, S. Mändl, D. Mettus, H. Berger, A. Bauer, M. Garst, C. Pfleiderer, C. H. Back, Microwave Spectroscopy of the Low-Temperature Skyrmion State in Cu2OSeO3. Phys. Rev. Lett. 126, 017202 (2021).
- 35. R. Takagi, M. Garst, J. Sahliger, C. H. Back, Y. Tokura, S. Seki, Hybridized magnon modes in the quenched skyrmion crystal. Phys. Rev. B. 104, 144410 (2021).
- 36. S. Pöllath, A. Aqeel, A. Bauer, C. Luo, H. Ryll, F. Radu, C. Pfleiderer, G. Woltersdorf, C. H. Back, Ferromagnetic Resonance with Magnetic Phase Selectivity by Means of Resonant Elastic X-Ray Scattering on a Chiral Magnet. Phys. Rev. Lett. 123, 167201 (2019).
- 37. N. Ogawa, S. Seki, Y. Tokura, Ultrafast optical excitation of magnetic skyrmions. Sci. Rep. 5, 9552 (2015).
- 38. J. Kalin, S. Sievers, H. Füser, H. W. Schumacher, M. Bieler, F. García-Sánchez, A. Bauer, C. Pfleiderer, Optically excited spin dynamics of thermally metastable skyrmions in Fe0.75Co0.25Si. Phys. Rev. B 106, 054430 (2022).
- 39. H. Oike, A. Kikkawa, N. Kanazawa, et al., Interplay between topological and thermodynamic stability in a metastable magnetic skyrmion lattice. Nat. Phys. 12, 62–66 (2016).
- 40. R. Takagi, Y. Yamasaki, T. Yokouchi, V. Ukleev, Y. Yokoyama, H. Nakao, T. Arima, Y. Tokura, S. Seki, Particle-size dependent structural transformation of skyrmion lattice. Nat. Commun. 11, 5685 (2020).
- 41. S. L. Zhang, A. Bauer, D. M. Burn, P. Milde, E. Neuber, L. M. Eng, H. Berger, C. Pfleiderer, G. Van Der Laan, T. Hesjedal, Multidomain Skyrmion Lattice State in Cu2OSeO3. Nano Lett. 16, 3285–3291 (2016).
- 42. R. B. Versteeg, I. Vergara, S. D. Schäfer, D. Bischoff, A. Aqeel, T. T. M. Palstra, M. Grüninger, and P. H. M. van Loosdrecht, Optically probed symmetry breaking in the chiral magnet Cu2OSeO3 Physical Review B 94, 094409 (2016).
- 43. A. Chacon, L. Heinen, M. Halder, A. Bauer, W. Simeth, S. Mühlbauer, H. Berger, M. Garst, A. Rosch, C. Pfleiderer, Observation of two independent skyrmion phases in a chiral magnetic material. Nat. Phys. 14, 936–941 (2018).
- 44. F. Qian, L. J. Bannenberg, H. Wilhelm, G. Chaboussant, L. M. Debeer-Schmitt, M. P. Schmidt, A. Aqeel, T. T. M. Palstra, E. Brück, A. J. E. Lefering, C. Pappas, M. Mostovoy, A. O. Leonov, New magnetic phase of the chiral skyrmion material Cu2OSeO3. Sci. Adv. 4, eaat7323 (2018).
- 45. L. J. Bannenberg, H. Wilhelm, R. Cubitt, A. Labh, M. P. Schmidt, E. Lelièvre-Berna, C. Pappas, M. Mostovoy, A. O. Leonov, Multiple low-temperature skyrmionic states in a bulk chiral magnet. npj Quantum Mater. 4, 11 (2019).
- 46. see e.g. chapter §119 Scattering with small change in frequency in L. D. Landau, E. M. Lifshitz, and L. P. Pitaevskij, Electrodynamics of continuous media (Elsevier Butterworth-Heinemann, Amsterdam, 2007).
- 47. M. Hamdi, F. Posva, D. Grundler, Spin wave dispersion of ultra-low damping hematite (-Fe2O3) at GHz frequencies. Phys. Rev. Mater. 7 054407 (2023).
- 48. P. Che, Helimagnons and Skyrmion Dynamics in Cu2OSeO3 and Fe/Gd Multilayers Explored by Brillouin Light Scattering and X-ray Microscopy. PhD Thesis, EPFL, https://infoscience.epfl.ch/record/287943 (2021).
Acknowledgments
The authors acknowledge Bin Lu for the assistance on the cryogenic setup optimization. Funding: We acknowledge the financial support from Swiss National Science Foundation (SNSF) via Sinergia Network NanoSkyrmionics CRSII5 171003. M.G. acknowledges support from Deutsche Forschungsgemeinschaft (DFG) via Project-id 403030645 (SPP 2137 Skyrmionics) and Project-id 445312953. Author contributions: D.G. and P.C. planned the experiments. A.M. and H.B. grew the sample. P.C., P.R.B, T.S. and H.M.R. characterized the sample. P.C. performed the cryogenic BLS experiments. R.C., V.K. and M.G. conducted the theoretical calculation. P.C., R.C., M.G. and D.G. analyzed the data. P.C., R.C., M.G. and D.G. wrote the manuscript with the input from all authors. Competing Interests: The authors declare that they have no competing interests. Data and materials availability: All data needed to evaluate the conclusions in the paper are present in the paper and/or the Supplementary Materials. Source data related to this paper will be uploaded to the open access data platform Zenodo and DOI will be attached.