Verma Sharma Dewangan 1]Aryabhatta Research Institute of observational sciencES (ARIES), Manora Peak, Nainital-263001, India 2]Physical Research Laboratory, Navrangpura, Ahmedabad-380 009, India \correspondanceaayushiverma@aries.res.in
Extraction of YSO Cores and Active Regions near Star-forming Site AFGL 5157
Abstract
We have carried out a quantitative analysis of the region near star-forming site AFGL 5157 using ’Minimal Spanning Tree’ (MST). The analysis reveals that this region consists of five major clusters. The cluster radii of the cores and active regions were found to be varying between 0.75-2.62 pc and 2.77-4.58 pc, respectively, for these regions, while the aspect ratio varies between 0.71 to 7.17. This hints towards the clumpy as well as elongated clusters in the region. We calculated structure parameter for each region which varies between 0.41-0.62 and 0.23-0.81 for the cores and ARs, respectively. This shows the existence of fractal distribution in all the cores and ARs except the core of the [HKS2019] E70 bubble.
keywords:
Interstellar medium, Star formation, Star-forming regions1 Introduction
The formation of stars occurs in a group of clusters and associations, and it is assumed that they cannot be formed in isolation (Lada and Lada, 2003). Observational analyses of embedded star-forming regions reveal that the distribution of stars is generally elongated, clumpy, or both (Allen et al. 2008; Koenig et al. 2008). This distribution is correlated with the distribution of dense molecular gas of natal clouds (Allen et al., 2008). The degree to which a cloud can form a group or association of stars is majorly governed by the dense material in the molecular cloud (Lada and Lada, 2003). The star formation scenario and the physical processes affecting the star formation in the region can be well understood by the mapping of young stellar objects (YSOs; Koenig et al. 2008). Various surveys of molecular clouds reveal that approximately 75 % of the embedded young stars exist in groups their clusters have equal to or more than 10 members (Zinnecker et al., 1993; Allen et al., 2007). The quantitative structural analysis of these clusters; the sizes, densities, and morphologies of young stellar cores: can be used to examine the theoretical models of star formation (Kuhn et al., 2014).
2 Source Selection
Active star-forming regions in molecular clouds generally consist of young star clusters (YSCs), mid-infrared (MIR) bubbles, clouds/filaments, and massive stars. Previous studies have suggested that the expansion of bubbles associated with the H ii regions can trigger 14 to 30% of the formation of the stars (e.g., Deharveng et al. 2010, Kendrew et al. 2012).
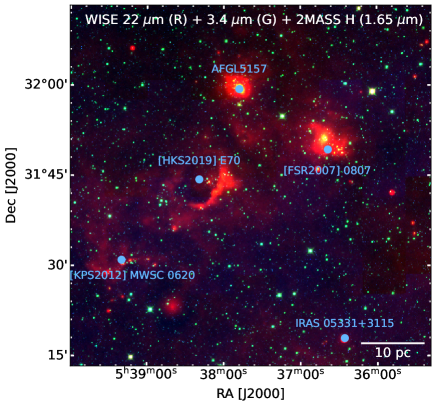
For the present study, we have selected a poorly explored region of which consists of five clusters: AFGL 5157 ( and ), MIR bubble [HKS2019] E70 ( and ), [FSR2007] 0807 ( and ), [KPS2012] MWSC 0620 ( and ) and an H ii region IRAS 05221+3115 ( and ).
Figure 1 shows the color-composite image (Red: WISE 22 m; Green: WISE 3.4 m; Blue: 2MASS H band, 1.65 m) of region overlaid with the locations of five clusters (blue color). The WISE 22 m represents the distribution of warm gas. The MIR emission in 3.4 m wavelength indicates the distribution of gas and dust. All these features coincide with the locations of identified clusters indicating strong evidence of star formation activities.
3 Extraction of the Cores and the Active Regions (ARs)
Assuming that the five clusters in the region might be fragmented from the same molecular cloud, we isolated them by applying an empirical technique ’Minimal Spanning Tree’ (MST; Gutermuth et al. 2009). This technique finds edges with minimum weight in each iteration and then adds them to the MST. The advantage of this technique is that it isolates the subgroups without biasing or smoothening and prevents basic geometry (Cartwright and Whitworth, 2004; Gutermuth et al., 2009; Pandey et al., 2020). We used this technique on the identified YSOs based on excess IR emission. The MST is plotted in the left panel of Figure 2, which points towards five subgroups in the region having different concentrations of YSOs. The dots and lines in different colors are representing the YSOs and the MST branches, respectively. We chose a surface density threshold stated as critical branch length to isolate the subgroups by plotting a histogram between MST branch lengths and MST branch numbers (right panel of Figure 2). The histogram peaks at a relatively small spacing than large spacing which indicates the existence of significant subgroups. If the sources have a branch length less than the critical branch length, then they are considered part of the same cluster.
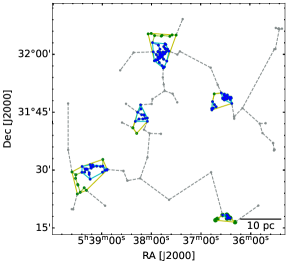
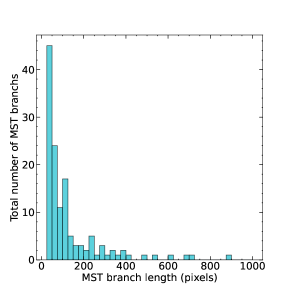
These sub-groups are enclosed by selecting a point where the shallow-sloped segment has a gap in the distribution of MST branch lengths. These regions are termed as ’active regions’ (AR). It is considered that these regions have moved out of the core (overdense regions) because of dynamic evolution. The critical branch lengths are 100 and 125 pixels for the cores and ARs, respectively. The YSOs and MST connections in the cores and ARs are represented by blue and green dots and lines, respectively, in the left panel of Figure 2. The isolated cores and ARs are enclosed by the Convex hulls using cyan and yellow lines, respectively. All the clusters are found to have a single core, whereas [FSR2007] 0807 is found to have two cores which are termed C1 and C2. The locations of all the identified YSOs are shown by black dots. We have also calculated the radius of the cores and ARs (), , and aspect ratio. is expressed as half of the distance between the two most distant hull points, whereas the aspect ratio is . The evaluated parameters of identified regions are given in Table 1.
The shape of the cluster may not always be circular. So, the cluster area is redefined by convex hull, which is a polygon enclosing all points of a grouping with internal angles less than 180∘ between two contiguous sides (Schmeja and Klessen 2006, Sharma et al. 2020). The convex hull is used to evaluate the area of the cluster (Sharma et al., 2020), given as:
| (1) |
where is the hull area, is the total number of hull vertices and is the number of points lying inside the hull. is the radius of the circle whose area is equal to .
| Region | Na | Nb | Nc | Vd | Aspect | |||
| (pc) | (pc) | Ratio | parameter | |||||
| For Cores | ||||||||
| AFGL5157 | 52 | 2 | 50 | 9 | 2.62 | 3.39 | 3.96 | 0.62 |
| HKS2019 E70 | 12 | 0 | 12 | 5 | 2.59 | 2.19 | 0.71 | 0.50 |
| FSR2007 0807 (C1) | 16 | 4 | 20 | 7 | 1.29 | 1.82 | 2.00 | 0.55 |
| FSR2007 0807 (C2) | 7 | 2 | 5 | 4 | 0.89 | 1.02 | 1.31 | 0.44 |
| KPS2012 MWSC 0620 | 25 | 5 | 20 | 9 | 2.61 | 3.10 | 1.41 | 0.39 |
| IRAS 05221+115 | 10 | 0 | 10 | 5 | 0.75 | 2.00 | 7.17 | 0.24 |
| For ARs | ||||||||
| AFGL5157 | 60 | 2 | 58 | 7 | 3.57 | 4.58 | 1.64 | 0.38 |
| HKS2019 E70 | 15 | 1 | 14 | 6 | 2.59 | 3.53 | 1.86 | 0.81 |
| FSR2007 0807 | 30 | 5 | 25 | 9 | 2.56 | 2.80 | 1.20 | 0.61 |
| KPS2012 MWSC 0620 | 36 | 10 | 26 | 7 | 3.95 | 5.27 | 1.78 | 0.37 |
| IRAS 05221+115 | 13 | 3 | 9 | 4 | 1.44 | 2.77 | 3.70 | 0.23 |
Notes: The central position of the sub-regions along with the number of enclosed YSOs are mentioned in column 2,3,4; the number of vertices of the convex hull, radius of the cluster, circle radius, and the aspect ratio are given in columns 5, 6, 7, and 8, respectively.
aNumber of enclosed YSOs
bNumber of enclosed Class i YSOs
cNumber of enclosed Class ii YSOs
dNumber of the vertices of the convex hull
4 Result and Conclusion
We examined the spatial distribution of the YSOs in the region near the star-forming site AFGL 5157. MST analysis of the region reveals the presence of five major clustering in the region. We have determined the basic structural parameters of these regions and found that the radius of the cluster varies between 0.75 pc to 2.62 pc with a mean value of 1.74 pc. In contrast, the aspect ratio varies between 0.71 to 7.17. Thus this region consists of clumpy as well as elongated clusters. We also calculated structure parameter for each region (see Table 1) and found that it varies between 0.41-0.62 and 0.23-0.81 for the cores and ARs, respectively. The large values (i.e., 0.8) are related to the centrally condensed spatial distributions, whereas small values (i.e., 0.8) are related to the fractal substructures (Dib and Henning, 2019). This shows the existence of fractal distribution in all the cores and ARs except the core of [HKS2019] E70. Since [HKS2019] E70 has , thus it has a centrally condensed spatial distribution.
Acknowledgements.
This publication makes use of data from the Two Micron All Sky Survey, which is a joint project of the University of Massachusetts and the Infrared Processing and Analysis Center/California Institute of Technology, funded by the National Aeronautics and Space Administration and the National Science Foundation. This work is based on observations made with the Spitzer Space Telescope, which is operated by the Jet Propulsion Laboratory, California Institute of Technology under a contract with the National Aeronautics and Space Administration. This publication makes use of data products from the Wide-field Infrared Survey Explorer, which is a joint project of the University of California, Los Angeles, and the Jet Propulsion Laboratory/California Institute of Technology, funded by the National Aeronautics and Space Administration. A.V. acknowledges the financial support of DST-INSPIRE (No. DST/INSPIRE Fellowship/2019/IF190550).0000-0002-6586-936XAayushiVerma \orcid0000-0001-5731-3057SaurabhSharma \orcid0000-0001-6725-0483LokeshDewangan
The present study results from a collaboration to which all the authors have significantly contributed.
The authors declare no conflict of interest.
References
- Allen et al. (2007) Allen, L., Megeath, S. T., Gutermuth, R., Myers, P. C., Wolk, S., Adams, F. C., Muzerolle, J., Young, E. and Pipher, J. L. (2007) The Structure and Evolution of Young Stellar Clusters. In Protostars and Planets V, edited by Reipurth, B., Jewitt, D. and Keil, K., p. 361. https://doi.org/10.48550/arXiv.astro-ph/0603096.
- Allen et al. (2008) Allen, T. S., Pipher, J. L., Gutermuth, R. A., Megeath, S. T., Adams, J. D., Herter, T. L., Williams, J. P., Goetz-Bixby, J. A., Allen, L. E. and Myers, P. C. (2008) Spitzer, Near-Infrared, and Submillimeter Imaging of the Relatively Sparse Young Cluster, Lynds 988e. ApJ, 675(1), 491–506. https://doi.org/10.1086/525241.
- Cartwright and Whitworth (2004) Cartwright, A. and Whitworth, A. P. (2004) The statistical analysis of star clusters. MNRAS, 348(2), 589–598. https://doi.org/10.1111/j.1365-2966.2004.07360.x.
- Deharveng et al. (2010) Deharveng, L., Schuller, F., Anderson, L. D., Zavagno, A., Wyrowski, F., Menten, K. M., Bronfman, L., Testi, L., Walmsley, C. M. and Wienen, M. (2010) A gallery of bubbles. The nature of the bubbles observed by Spitzer and what ATLASGAL tells us about the surrounding neutral material. A&A, 523, A6. https://doi.org/10.1051/0004-6361/201014422.
- Dib and Henning (2019) Dib, S. and Henning, T. (2019) Star formation activity and the spatial distribution and mass segregation of dense cores in the early phases of star formation. A&A, 629, A135. https://doi.org/10.1051/0004-6361/201834080.
- Gutermuth et al. (2009) Gutermuth, R. A., Megeath, S. T., Myers, P. C., Allen, L. E., Pipher, J. L. and Fazio, G. G. (2009) A Spitzer Survey of Young Stellar Clusters Within One Kiloparsec of the Sun: Cluster Core Extraction and Basic Structural Analysis. ApJS, 184(1), 18–83. https://doi.org/10.1088/0067-0049/184/1/18.
- Kendrew et al. (2012) Kendrew, S., Simpson, R., Bressert, E., Povich, M. S., Sherman, R., Lintott, C. J., Robitaille, T. P., Schawinski, K. and Wolf-Chase, G. (2012) The Milky Way Project: A Statistical Study of Massive Star Formation Associated with Infrared Bubbles. ApJ, 755(1), 71. https://doi.org/10.1088/0004-637X/755/1/71.
- Koenig et al. (2008) Koenig, X. P., Allen, L. E., Gutermuth, R. A., Hora, J. L., Brunt, C. M. and Muzerolle, J. (2008) Clustered and Triggered Star Formation in W5: Observations with Spitzer. ApJ, 688(2), 1142–1158. https://doi.org/10.1086/592322.
- Kuhn et al. (2014) Kuhn, M. A., Feigelson, E. D., Getman, K. V., Baddeley, A. J., Broos, P. S., Sills, A., Bate, M. R., Povich, M. S., Luhman, K. L., Busk, H. A., Naylor, T. and King, R. R. (2014) The Spatial Structure of Young Stellar Clusters. I. Subclusters. ApJ, 787(2), 107. https://doi.org/10.1088/0004-637X/787/2/107.
- Lada and Lada (2003) Lada, C. J. and Lada, E. A. (2003) Embedded Clusters in Molecular Clouds. ARA&A, 41, 57–115. https://doi.org/10.1146/annurev.astro.41.011802.094844.
- Pandey et al. (2020) Pandey, R., Sharma, S., Panwar, N., Dewangan, L. K., Ojha, D. K., Bisen, D. P., Sinha, T., Ghosh, A. and Pandey, A. K. (2020) Stellar Cores in the Sh 2-305 H II Region. ApJ, 891(1), 81. https://doi.org/10.3847/1538-4357/ab6dc7.
- Schmeja and Klessen (2006) Schmeja, S. and Klessen, R. S. (2006) Evolving structures of star-forming clusters. A&A, 449(1), 151–159. https://doi.org/10.1051/0004-6361:20054464.
- Sharma et al. (2020) Sharma, S., Ghosh, A., Ojha, D. K., Pandey, R., Sinha, T., Pandey, A. K., Ghosh, S. K., Panwar, N. and Pandey, S. B. (2020) The disintegrating old open cluster Czernik 3. MNRAS, 498(2), 2309–2322. https://doi.org/10.1093/mnras/staa2412.
- Zinnecker et al. (1993) Zinnecker, H., McCaughrean, M. J. and Wilking, B. A. (1993) The Initial Stellar Population. In Protostars and Planets III, edited by Levy, E. H. and Lunine, J. I., p. 429.