\systemname: Interactive Structured Knowledge Extraction and Synthesis from Scientific Literature with Large Language Model
Abstract.
Extraction and synthesis of structured knowledge from extensive scientific literature are crucial for advancing and disseminating scientific progress. Although many existing systems facilitate literature review and digest, they struggle to process multimodal, varied, and inconsistent information within and across the literature into structured data. We introduce SciDaSynth, a novel interactive system powered by large language models (LLMs) that enables researchers to efficiently build structured knowledge bases from scientific literature at scale. The system automatically creates data tables to organize and summarize users’ interested knowledge in literature via question-answering. Furthermore, it provides multi-level and multi-faceted exploration of the generated data tables, facilitating iterative validation, correction, and refinement. Our within-subjects study with researchers demonstrates the effectiveness and efficiency of SciDaSynth in constructing quality scientific knowledge bases. We further discuss the design implications for human-AI interaction tools for data extraction and structuring.
1. Introduction
Nowadays, the rapid advancement of scientific research has witnessed an unprecedented growth of research literature from different disciplines. As a result, the extraction and synthesis of structured knowledge and findings from this vast amount of information has become increasingly paramount. This process is crucial for researchers to keep pace with the latest research developments, identify emerging trends, and drive innovative ideas and hypotheses based on prior research. Moreover, the structured organization of the extracted knowledge as databases facilitates a systematic and cohesive understanding of the research landscape, promotes seamless integration of new discoveries, and fosters collaboration and communication within the scientific community. Building structured knowledge bases from the massive research literature is a cognitively demanding and time-consuming process with a sequence of inter-connected tasks. Prior systems have been built to aid researchers with the preliminary stages of structured knowledge extraction, including literature discovery and collection (Shahaf et al., 2012; Google, nd; Ponsard et al., 2016a; Chau et al., 2011), comprehension, and digestion (Kang et al., 2023, 2022; Head et al., 2021a).
However, a critical gap remains in the ability of these systems to process the unstructured knowledge within the literature as structured data in a standardized format. To address this gap, several challenges arise. 1) Multimodal information in literature. Scientific papers often contain diverse modalities of information, such as text, tables, and figures. The multimodality adds complexity to identifying the relevant information within each modality scattered throughout a paper and integrating it into a structured and coherent format. 2) Variation and inconsistencies across literature. The style, structure, and presentation of the papers can significantly vary from one to another. The variation and inconsistencies make it difficult to standardize the information to be included in a structured knowledge base. For example, the same concepts may be described using different terminologies or measurement units. 3) Flexibility and domain adaptation. Users may have varying research questions for a collection of papers, and these papers can span across different domains. Therefore, the system must be flexible enough to adapt to the diverse data needs of different users and domains.
To tackle these challenges, we leverage large language models (LLMs) as the backbone to interpret complex scientific literature, extract relevant information from diverse modalities, and produce structured output via QA-based interactions with users. Our choice is motivated by the following considerations: 1) recent LLMs (e.g., GPT-4 (OpenAI, 2024) and Llama 2 (Touvron et al., 2023)) have exhibited promising understanding, reasoning and generation capabilities to solve various natural language and multimodal tasks across different domains (Singhal et al., 2023; Zeng et al., 2023); 2) LLM-based systems (e.g., ChatGPT and Gemini) with QA-based interactions have become increasingly popular for people to flexibly specify their analytical needs and conduct information-seeking and sensemaking. Despite their potential, LLMs can struggle with complex reasoning tasks in specialized domains (e.g., inconsistent information disambiguation and numerical reasoning). Additionally, LLMs may suffer from hallucination problems, leading to the generation of misinformation. All these drawbacks are particularly problematic for the precision requirements of scientific knowledge bases and necessitate human expertise to oversee and rectify the structured knowledge generated by LLMs. We aim to synergize LLMs’ strengths with researchers’ expertise to efficiently build accurate and reliable knowledge bases from the scientific literature.
To this end, we present SciDaSynth, a novel interactive system that helps researchers build structured knowledge bases from scientific literature in a systematic and scalable manner powered by LLMs. It enables users to distill their interested knowledge into structured data tables via QA-based interactions and provides a multi-faceted visual summary of different dimensions and subsets of the data tables to guide iterative validation, correction, and refinement. Particularly, the system supports dimension-guided flexible grouping of data records to assist a global understanding of data variations and inconsistencies across the literature. To further help users identify and fix data errors, SciDaSynth establishes, highlights, and maintains connections between generated data and relevant information in the literature and supports data editing by batch. We conducted a within-subjects study with 12 researchers to qualitatively and quantitatively study the effectiveness and usability of SciDaSynth for data extraction from literature. The results show that by using SciDaSynth, participants could produce quality data comparable to the human baseline in a much shorter time. Moreover, participants perceive various benefits brought by SciDaSynth, such as streamlining their data extraction workflow and facilitating data locating, validation, and refinement. However, several limitations of automated LLMs for data extraction were revealed. Participants remained cautious of LLM-generated results and expressed their preferences about using and trusting these generated results. Besides, participants also identify promising use cases of SciDaSynth, such as paper screening, data monitoring, results interpretation, and sharing. Finally, we discuss design implications for future human-AI interaction systems for information extraction tasks.
In summary, our major contributions are:
-
•
SciDaSynth, an interactive system that offers a computational pipeline for data extraction and structuring from massive scientific literature and facilitates human-data interactions in data exploration, extraction, validation, and refinement via interactions and visualizations.
-
•
The quantitative and qualitative results of our user study that reveal the effectiveness, user experience, and promising use cases of SciDaSynth for data extraction from the scientific literature.
-
•
Implications for future system designs of human-AI interaction for data extraction and structuring.
2. Related Work
2.1. Structured Information Extraction from Scientific Literature
The exponential growth of scientific papers has generated large-scale data resources for LLMs’ building and applications for information extraction tasks, such as named entity recognition and relation extraction in scientific domains. Some representative LLMs (e.g., SciBert and Galactica) (Beltagy et al., 2019; Taylor et al., 2022; Lewis et al., 2020a) adopt supervised fine-tuning on scientific publications and achieve good generalizability to perform information extraction from various domains. Building upon these models, Zhao et al. (2023) proposed text-based and table-based BERT-based models for the optical-materials domain. Dagdelen et al. (2024) leveraged LLMs to extract entities and their relations from material science text and organized them in JSON format. By integrating reinforcement learning with human feedback into the LLM training process, current LLMs (e.g., GPT-4 (OpenAI, 2024) and Llama (Touvron et al., 2023)) enable zero-shot prompting to follow human instructions and demonstrate superior performance in complex analytical and reasoning tasks in diverse domains without fine-tuning. In our work, we prompt GPT-4 to identify relevant information in papers according to users’ requests.
Besides, data in scientific literature is another particular focus for extraction. The data is usually stored in tables and figures in PDFs of research papers, and many toolkits are available to parse PDF documents, such as PaperMage (Lo et al., 2023), GROBID (GROBID, 2024), Adobe Extract API (Inc., nd), GERMINE (Tkaczyk et al., 2015), GeoDeepShovel (Zhang et al., 2023), PDFFigures 2.0 (Clark and Divvala, 2016). Here, we leverage the off-the-shelf tool to parse PDF text, tables, and figures. Besides the tools in the research community, Elicit (Elicit, 2023) is a commercial software that facilitates systematic review. It enables users to describe what data to be extracted and create a data column to organize the results. However, it does not provide an overview of the extracted knowledge to help users handle variation and inconsistencies across different research literature. Here, we also formulate the knowledge as structured data tables. Moreover, we provide multi-faceted visual and text summaries of the data tables to help users understand the research landscape, inspect nuances between different papers, and verify and refine the data tables interactively.
2.2. Tools that Augment Literature Reading and Comprehension
Research literature reading and comprehension is cognitively demanding, and many systems have been developed to facilitate this process (Head et al., 2021b; August et al., 2023; Lee et al., 2016; Fok et al., 2023; Kang et al., 2022, 2023; Fok et al., 2024; Kim et al., 2018; Chen et al., 2023; Peng et al., 2022). One line of research studies aims to improve the comprehension and readability of individual research papers. To reduce barriers to domain knowledge, ScholarPhi (Head et al., 2021b) provided in-situ support for definitions of technical terms and symbols within scientific papers. PaperPlain (August et al., 2023) helped healthcare consumers to understand medical research papers by AI-generated questions and answers and in-situ text summaries of every section. Some work (Ponsard et al., 2016b; Chau et al., 2011) designed interactive visualizations to summarize and group different papers and guide the exploration. Some systems support fast skimming of paper content. For example, Spotlight (Lee et al., 2016) extracted visual salient objects in a paper and overlayed it on the top of the viewer when scrolling. Scim (Fok et al., 2023) enabled faceted highlighting of salient paper content. To support scholarly synthesis, Threddy (Kang et al., 2022) and Synergi (Kang et al., 2023) facilitated a personalized organization of research papers in threads. Synergi further synthesized research threads with hierarchical LLM-generated summaries to support sensemaking. To address personalized information needs for a paper, Qlarify (Fok et al., 2024) provided paper summaries by recursively expanding the abstract. Kim et al. (2018) linked text with corresponding tables to promote a unified understanding of arguments in papers. Although these systems help users digest research papers and distill knowledge with guidance, we take a step further by converting unstructured knowledge and research findings scattered within research papers into a structured data table with a standardized format.
2.3. Document Question Answering Systems for Information Seeking
People often express their information needs and interests in the documents using natural language questions (ter Hoeve et al., 2020). Many researchers have been working on building question-answering models and benchmarks (Dasigi et al., 2021; Krithara et al., 2023; Jin et al., 2019; Vilares and Gómez-Rodríguez, 2019; Ruggeri et al., 2023) for scientific documents. With recent breakthroughs in LLMs, some LLM-fused chatbots, such as ChatDoc (ChatDoc, nd), ChatPDF (ChatPDF, nd), ChatGPT (AI, 2024), Claude (Anthropic, 2024), are becoming increasingly popular for people to turn to when they have analytic needs for very long documents. However, LLMs can produce unreliable answers, resulting in hallucinations (Ji et al., 2023; Khullar et al., 2024). It is important to attribute the generated results with the source (or context) of the knowledge (Wang et al., 2024). Then, automated algorithms or human raters can examine whether the reference source really supports the generated answers using different criteria (Gao et al., 2023; Yue et al., 2023; Rashkin et al., 2023; Bohnet et al., 2023; Menick et al., 2022). In our work, we utilize retrieval-augmented generation techniques (Lewis et al., 2020b) to improve the reliability of LLM output by grounding it on the relevant supporting evidence in the source documents. Then, we use quantitative metrics, such as context relevance, to evaluate the answer quality and prioritize users’ attention on checking and fixing low-quality answers.
3. Formative Study
We aim to develop an interactive system that helps researchers distill, synthesize, and organize structured knowledge from scientific literature in a systematic, efficient, and scalable way111Here, we focus on the stage where researchers have the final pool of studies ready for extraction, excluding literature search and screening.. To better understand the current practice and challenges they face during the process, we conducted a formative interview study.
3.1. Participants and Procedures
3.1.1. Participants
12 researchers (P1-P12, five females, seven males, age: three from 18-24, nine from 25-34) were recruited from different disciplines, including medical and health sciences, computer science, social science, natural sciences, and mathematics. Nine obtained PhD degrees and three were PhD researchers. All of them had extracted data (e.g., interventions and outcomes) from literature, ten of which had further statistically analyzed data or narratively synthesized data. Seven rated themselves as very experienced, where they had led or been involved with the extraction and synthesis of both quantitative and qualitative data across multiple types of reviews. Five had expert levels of understanding and usage of computer technology for research purposes, and seven rated themselves at moderate levels.
3.1.2. Procedures
Before the interviews, we asked the participants to finish a pre-task survey, where we collected their demographics, experience with literature data extraction and synthesis, and understanding and usage of computer technology. Then, we conducted 50-minute interviews with individuals over Zoom. During the interviews, we inquired the participants about (1) their general workflow for data extraction from literature, desired organization format of data; (2) what tools were used for data extraction and synthesis, and what are their limitations; (3) expectations and concerns about computer and AI support.
3.2. Findings and Discussions
3.2.1. Workflow and tools.
After getting the final pool of included papers, participants first created a data extraction form (e.g., fields) to capture relevant information related to their research questions, such as data, methods, interventions, and outcomes. Then, they went through individual papers, starting with a high-level review of the title and abstract. Afterward, participants manually distilled and synthesized the relevant information required on the form. The data synthesis process often involved iterative refinement, where participants might go back and forth between different papers to update the extraction form or refine previous extraction results.
Common tools used by participants included Excel (9/12) and Covidence or Revman (4/12) for organizing forms and results of data extraction. Some participants also used additional tools like Typora, Notion, Python or MATLAB for more specialized tasks or to enhance data organization. The final output of this process was structured data tables in CSV and XLSX format that provided a comprehensive representation of the knowledge extracted from the literature.
3.2.2. Challenges
Time-consuming to manually retrieve and summarize relevant data within the literature. Participants found it time-consuming to extract different types of data, including both qualitative and quantitative data, located at different parts of the papers, such as text snippets, figures, and tables. P1 commented, “Sometimes, numbers and their units are separated out at different places.” The time cost further increases when facing “many papers” (7/12) to be viewed, “long papers” (5/12), or papers targeting very specialized domains they are not so familiar with (5/12). P3 added, “When information is not explicit, such as limitations, I need to do reasoning myself.” And P5 mentioned, “It takes much time for me to understand, summarize, and categorize qualitative results and findings.”
Tedious and repetitive manual data entry from literature to data tables. After locating the facts and relevant information, participants need to manually input them into the data tables, which is quite low-efficiency and tedious. P3 pointed out, “… the data is in a table (of a paper), I need to memorize the numbers, then switch to Excel and manually log it, which is not efficient and can cause errors.” P4 echoed, “Switching between literature and tools to log data is tedious, especially when dealing with a large number of papers, which is exhausting.”
Significant workload to resolve data inconsistencies and variations across the literature. Almost all participants mentioned the great challenges of handling inconsistencies and variations in data, such as terminologies, abbreviations, measurement units, and experiment conditions, across multiple papers. It was hard for them to standardize the language expressions and quantitative measurements. P7 stated, “Papers may not use the same terms, but they essentially describe the same things. And it takes me lots of time to figure out the groupings of papers.” P9 said, “I always struggle with choosing what words to categorize papers or how to consolidate the extracted information.”
Inconvenient to maintain connections between extracted data and the origins in literature. The process of data extraction and synthesis often required iterative review and refinement, such as resolving uncertainties and addressing missing information by revisiting original sources. However, when dealing with numerous papers and various types of information, the links between the data and their sources can easily be lost. Participants commonly relied on memory to navigate specific parts of papers containing the data, which is inefficient, unscalable, and error-prone. P8 admitted, “I can easily forget where I extract the data from. Then, I need to do all over again.”
3.2.3. Expectations and concerns about AI and computer support
Participants anticipated that AI systems could automatically extract relevant data from literature based on their requests (7/12), and organize it into tables (9/12). They desired quick data summaries and standardization to (6/12) facilitate synthesis. Additionally, they wanted support for the categorization of papers based on user-defined criteria (4/12) and enabling efficient review and editing in batches (4/12). Besides, participants expected that the computer support should be easy to learn and flexibly adapt to their data needs. Many participants stated that the existing tools like Covidence and Revman were somewhat complex, especially for new users who may struggle to understand their functionalities and interface interactions.
Due to the intricate nature of scientific research studies, participants shared concerns about the accuracy and reliability of AI-generated results. They worried that AI lacks sufficient domain knowledge, and may generate results based on the wrong tables/text/figures. P12 demanded that AI systems should highlight uncertain and missing information. Many participants requested validation of AI results.
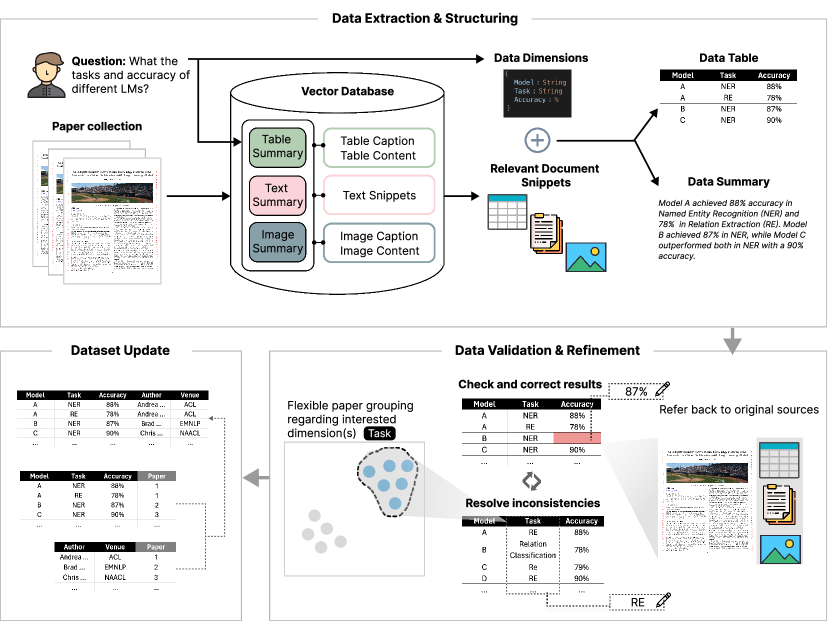
System workflow of SciDaSynth: (1) Data extraction and structuring through Retrieval augmented generation (RAG) based technical framework using LLMs. (2) Data validation and refinement through iterative checking and correcting results with visual highlights and easy access to their original sources and resolving inconsistencies in data by flexible grouping based on interested data dimensions. (3) Database update by integrating the current data table.
3.3. Design Goals
Given the current practice and challenges of data extraction and synthesis from literature and the expectations and concerns about AI support, we distilled the following system design goals (DGs).
DG1. Automated data extraction and structuring adapted to users’ needs.
DG2. Data summarization and standardization.
DG3. Scalable and efficient review, editing, and refinement of data.
-
3.1
Flexible grouping and separation of papers based on user-defined criteria.
-
3.2
Awareness and validation of AI accuracy.
-
3.3
Maintain connections between extracted data and its origins in literature.
-
3.4
Efficient batch editing and refinement.
DG4. Familiar and straightforward designs and interactions.
Teaser.
4. System
In this section, we introduce the design and implementation of SciDaSynth. First, we provide an overview of the system workflow. Then, we describe the technical implementations for data extraction and structuring. Afterward, we elaborate on the designs and interactions for the interface. Finally, we introduce a usage scenario to walk through the system.
4.1. System Workflow
After uploading the PDF files of research literature, users can interact with SciDaSynth with natural language questions (e.g., “What are the task and accuracy of different LMs?”) in the chat interface. The system then processes this question and presents the user with a text summary and a structured data table (DG2). This natural language interaction directly addresses the data needs without requiring tedious interface interactions (e.g., drag and drop) (DG1, DG4).
The data table provided by SciDaSynth includes specific dimensions related to the user’s question, such as “Model”, “Task”, and “Accuracy”, along with corresponding values extracted from the literature. If there are missing values or information with low relevance scores, these are highlighted in the table. This feature directs the user’s attention to areas that may need further exploration or validation by referring back to the original data sources in the literature (DG3.2). In cases where the system is found to use incorrect source information to generate the results, the user can easily access the original paper, review the extracted paper tables and figures, and make necessary corrections directly in the data table (DG3.3). To assist the user in gaining an overview of inconsistencies and variations in data, the system supports flexible grouping of papers into scatter plots based on the user’s specified dimensions (DG3.1). The user can then select interested groups and perform batch editing of dimension values (DG3.4), for instance, unifying different expressions of the same entity.
Once satisfied with the accuracy and completeness of the data table, the user can add it to the database, where it is automatically integrated with existing data. The user can then proceed to pose additional questions to the system and repeat the process for further data extraction and synthesis. Finally, when the user has completed their research, they can export the entire database in CSV format for further analysis or reporting.
4.2. Data Extraction and Structuring
We leverage LLMs 222We use ‘gpt-4-turbo’ for data table generation considering the task complexity, while ‘gpt-3.5-turbo’ is used for data structure generation and summarization. Vectorization uses OpenAI’s ‘text-embedding-3-small’ embedding. to extract and structure data from scientific literature based on user questions. To mitigate the hallucination issues and facilitate user validation of LLM-generated answers, we adopt the retrieval-augmented generation (RAG) framework by grounding LLMs in the relevant information in the papers (as shown in Figure 1). The framework includes building the vector database for PDF collection, generating data dimensions from the question, and producing the answer (i.e., the data table and data summary) based on these dimensions and relevant document snippets retrieved from the vector database. The process begins with parsing the paper PDF collection into tables, text snippets, and images using a state-of-the-art toolkit for processing scientific papers (Lo et al., 2023). Afterward, they are transformed into vectors333For figures, we use GPT4-V to provide text descriptions and convert the text into vectors. For each table, text snippet, and image, we create a text summary using LLMs and encode both the summary and the original data as vectors for computation and retrieval. The text summary helps consolidate the verbose original content, improving scalability and reducing noise for retrieval. Given a user’s question, we encode it as a vector and use vector-based similarity search to retrieve relevant information from the paper collection. This search finds the original tables, text, or images indexed by text summaries that are related to the question. Meanwhile, we prompt LLMs to infer data dimensions by generating dimension names and types based on the question. Finally, the retrieved original document snippets and generated data dimensions are fused in a prompt to guide LLMs in generating the data table and data summary. This approach ensures that the extracted data is structured and relevant to the user’s query, while also allowing for easy validation and refinement.
4.3. User Interface
Building upon the technical framework for extracting and structuring data from scientific literature, the user interface enables the automatic generation of data tables via question-answering (in Figure 2, DG1, DG2). Based on the data tables, users can perform iterative data validation and refinement by pinpointing and correcting error-prone data records and by resolving data inconsistencies via flexible data grouping regarding specific dimensions. Finally, users can add the quality-ready data tables into the database. Here, we will introduce the system designs and interactions in detail.
4.3.1. Paper exploration and question answering
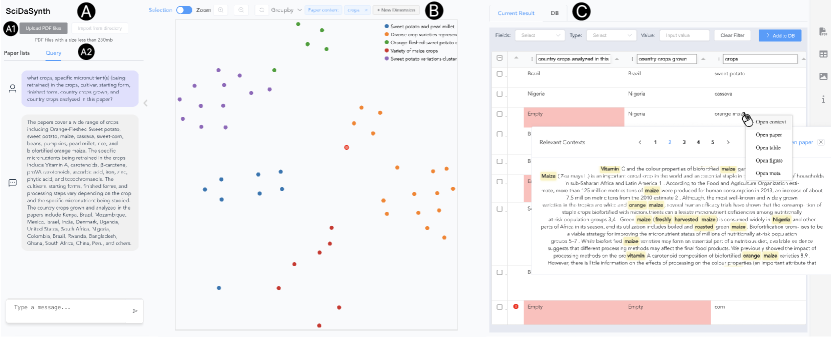
After uploading the PDF collection of scientific literature (in Figure 2A1), the paper meta information is organized as a data table in the database (in Figure 2C). Then, users can get familiar with the content of the paper collection in the scatter plot, where each paper is encoded as vector444All vectorization in this section uses OpenAI’s ‘text-embedding-3-small’ embedding based on the paper title and abstract and projected onto the 2D plane using T-SNE. Papers that share similar content will form a visual cluster. Users can lasso a paper cluster and right-click in the scatter plot to trigger a context menu that has the option of requesting a summary of the abstracts. In addition, users can click individual dots and examine the corresponding paper PDFs in the tab of the right panel, as well as the parsed tables (\faTable), figures (\faImage), or meta (\faInfoCircle) by clicking the icons in the sidebar.
4.3.2. Multi-level and multi-faceted data summary.
Dimension-guided data exploration. Users can gain an overview of data variations using the scatter plot by selecting interested dimensions at the header (in Figure 2B). Then, the system will perform a flexible grouping of papers based on dimension values. Specifically, each record (row) of the selected dimensions in the table is transformed into a text description (“dimension_name: value”), encoded as a vector, and projected on the 2D plane as a dot555Numerical values are converted into categories from “low” to “high”.. The variations and similarities of dimension values for different rows are reflected in the distribution of clusters of dots using KMeans clustering. To concretize the data variations, each cluster is associated with a text label generated by LLMs’ summarization of the text descriptions for the dimensions. Thereafter, users can lasso select an interested cluster to see the detailed values in the data table. They can resolve the inconsistencies of these values by assigning them the same label in the table.
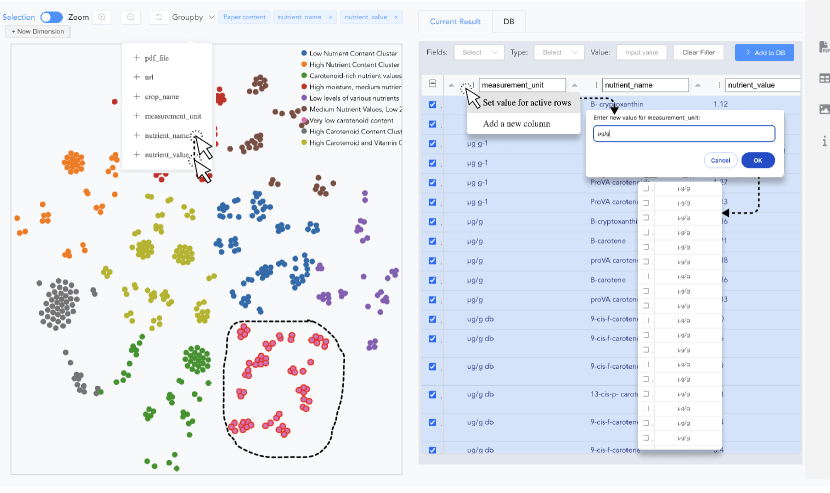
Users can select multiple dimensions to explore their distribution in the scatter plot. Then, they can lasso a cluster (i.e., “Very low carotenoid content”) to inspect the detailed values in the data table. In the data table, users can unify the expressions of the same measurement unit ().
For example, after asking questions about crops and nutrients in the chat interface, users may select “crops” as the target dimension to explore the distribution of different types of crops in the papers (Figure 2B). By examining different colored clusters and their labels, users understand there are different clusters of sweet potatoes and the orange cluster contains mixed crops. Besides, users can select multiple dimensions at once, such as “nutrient_name” and “nutrient_value” (in Figure 3), to explore different pairings of nutrients and their values (contained in crops). Afterward, users can select one cluster to look at the detailed values in the data table. In the table, the user may observe varied phrasings of measurement units and decide to unify them as “”.
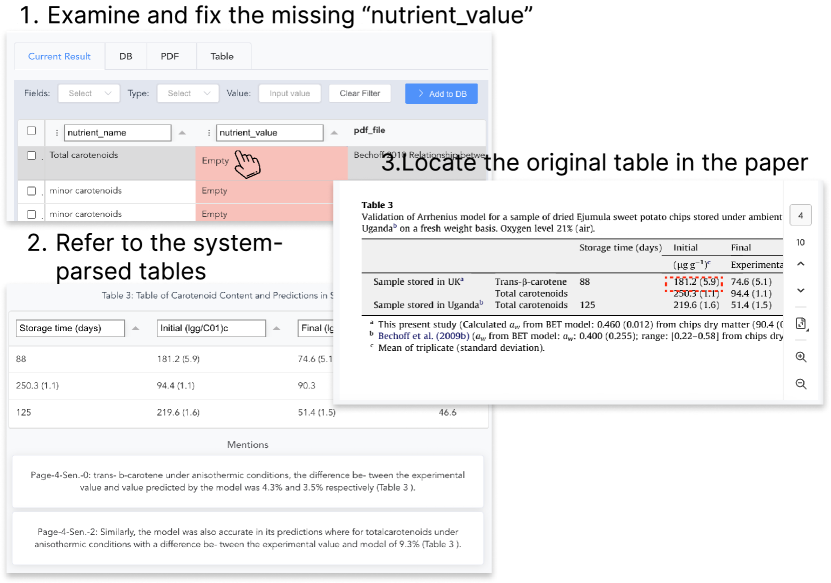
Highlight error-prone data. To make users aware of and validate the potentially problematic results (DG3.2), the system highlights table cells with missing information or table rows (records) that are not quite relevant to the current question. The missing information is detected by prompting LLMs to output “Empty” when they cannot decide the values based on the retrieved paper content. The relevance of the results is measured by the semantic similarities of the vectors 666using cosine similarity between data dimensions and their corresponding records. Users can sort the table at the column header to check the records having low relevance scores (labeled with \faInfoCircle in red).
Trace back data origins in literature. To check the quality of the generated data, users can right-click the individual rows to “open the context” pop-up that shows the original sources used by LLMs for the generation. Those original sources are the relevant context information retrieved from the vector database of tables, texts, and images in the paper collection. Moreover, the context information that matches with the generated data is highlighted to help users quickly locate the important evidence that supports the generation. If the system is found to rely on incorrect evidence to generate data, users can right-click the corresponding rows to open the paper or table or figure in a new tab for further inspection.
For example, a user may want to inspect and fix a highlighted “Empty” nutrient value for “Total carotenoids”. Then, the user can check the system-parsed tables in the “Table” tab, where Table 3 is found relevant to the target nutrient value, but it seems to be wrongly parsed by the system. Thus, the user utilizes the mentions of this table (on Page 4 of the paper) below to trace back to the original table in the paper PDF. Afterward, the user finds the correct value (“250.3” for “Total carotenoids”) and fixes the missing value in the resulting data table.
Teaser.
5. Evaluation Design
Given the paper collection, we aimed to evaluate how SciDaSynth impacted the data extraction quality and efficiency and what were the perceived benefits and limitations when working with SciDaSynth. We conducted a user study with 12 researchers, who were tasked with building data tables given a set of predefined dimensions using a pool of scientific publications in PDF format. We adopted a within-subjects design, wherein participants needed to use SciDaSynth and the baseline system to extract data from a pool of paper PDFs. The paper collections were selected from a recent systematic review published in Nature Food (Huey et al., 2023), focusing on micronutrient retention in biofortified crops through various processing methods. The supplementary data table from this review served as the ground truth for the extracted data tables. We measured task completion time and accuracy and collected participants’ feedback on their experience with both systems. This approach allowed us to assess the usability and effectiveness of SciDaSynth in supporting the data extraction process from the scientific literature.
Our research questions are:
-
•
Effectiveness of data extraction:
-
*
Data quality: How does SciDaSynth impact the quality of the final synthesized data table from scientific literature collection?
-
*
Efficiency: How does SciDaSynth impact the efficiency of data extraction?
-
*
-
•
User perceptions: What are the perceived benefits and limitations of system designs and workflows?
-
•
Promising use cases: How do researchers envision using SciDaSynth for data extraction in their studies?
5.1. Experiment Settings
5.1.1. Dataset & Processing
The datasets for this study were derived from the included studies in the systematic review published in Nature Food. We downloaded the corresponding research papers in PDF format. These papers examined the retention of micronutrients (e.g., provitamin A, iron, and zinc) in biofortified crops (e.g., maize, orange sweet potato, cassava, pearl millet, rice, beans, and wheat) after post-harvest processing (e.g., storage and fermentation). The supplementary data table published along with the systematic review includes all the extracted data from individual studies in CSV format. This data table served as the ground truth of our data extraction and synthesis study. We pre-processed the papers by extracting tables, figures, and text snippets from the PDFs and converting them into a vector database for data extraction and structuring, as described in subsection 4.2. For the user study, we created two datasets, Dataset I and Dataset II, each containing 10 papers sampled from the studies included in the systematic review.
5.1.2. Participants
We recruited 12 researchers (P1-P12; eight females, four males; ages: four aged 18-24, seven aged 25-34, one aged 35-44) for the study. Their backgrounds were in nutritional sciences, including food science and technology, human nutrition, medical and health sciences, and life sciences. All participants (five postdoctoral fellows and seven PhD students) were actively engaged in research and familiar with the data dimensions from the systematic review, either through previous papers (10/12) or their own research (2/12). Most had extensive experience in extracting and analyzing both qualitative and quantitative data from literature and had led or been involved in at least one type of review (e.g., intervention, diagnostic test accuracy, and narrative). All participants had the need for data extraction and synthesis for their research studies. Their expertise and usage of computer technology varied, with five participants identifying as expert users who regularly coded and programmed and seven as intermediate users who coded as needed.
5.2. Baseline Implementation
Participant-facing baseline without data extraction and structuring. This baseline, Baseline A, was a simplified version of SciDaSynth designed to replicate current practices in data extraction and synthesis. It provided users with a PDF viewer that supported highlighting, annotation, and searching, allowing them to explore individual PDF content. Additionally, it automatically parsed paper metadata, tables, and figures for user reference. Unlike SciDaSynth, Baseline A did not offer question-answering (QA)-based interactions for generating data tables or support dimension-guided data exploration with scatter plots. This baseline aimed to emulate the manual process of reviewing individual paper PDFs to distill and organize information into table format. It also offered an integrated workspace and computational parsing for data extraction and content review while maintaining connections between data and source PDFs with a side-by-side view.
Automated GPT baseline. We developed Baseline B, a fully automated system based on GPT-3.5/4, to generate data tables according to specified data dimensions. This baseline was intended to evaluate the accuracy of our technical framework for automatic data table generation. The implementation followed the data extraction and structuring approach of SciDaSynth (described in subsection 4.2). We used web-based ChatGPT to generate two data questions based on the dimensions specified for the data extraction tasks. These questions were then input into Baseline B to generate two data tables for each dataset, resulting in a total of four data points for comparison with other systems.
5.3. Tasks
Participants were instructed to use SciDaSynth and Baseline A to extract data from two paper collections, Dataset I and Dataset II, each containing 10 papers. These collections were sampled from a systematic review on micronutrients in crops (introduced in subsubsection 5.1.1). Due to the complexity of the data extraction tasks, participants were requested to extract four data dimensions from papers, including “crops (types)”, “micronutrients (being retained)”, “absolute nutrient raw value”, and “raw value measurement units”. These dimensions covered both qualitative and quantitative measurements. They needed to organize the data into tables and download them from the systems. The data extraction scenario was presented as “working with your colleagues to conduct a systematic review.” The order of the systems and the datasets was counterbalanced, resulting in 4 (=2 x 2) conditions.
5.4. Procedure
We conducted the experiment remotely via Zoom, with both the Baseline A and SciDaSynth deployed on a cloud server for participants’ access. The produce of the study: pre-study setup; interface tutorial for the first system; main task for the first system followed by a survey; alternate and repeat for the second system; think-aloud exploration using SciDaSynth; and interview.
First, we collected the participants’ consent forms and background information, including demographics and prior research experience regarding data extraction and the nutrition domain. Then, participants were briefed about the study information. The pre-study survey and the introduction took about 10 minutes. Then, depending on the condition assigned to participants for each task, the interviewer demonstrated the PDF uploading and main features and interactions of SciDaSynth or Baseline A using a new collection of papers from the systematic review step-by-step via screen sharing. The tutorial took about 10 minutes for each system. Following that, participants used the assigned system to conduct the main task based on the assigned Dataset A or B and then answered a post-study survey about the system usage experience. After finishing both tasks, they were asked to freely explore SciDaSynth with interested data questions using both Datasets A and B for about 15 minutes. During the exploration, participants shared their screen and think-aloud. Finally, participants were interviewed to gather feedback on the system designs, workflow, and potential system use cases. Each participant spent about two hours in total for the study and was compensated with $30 USD.
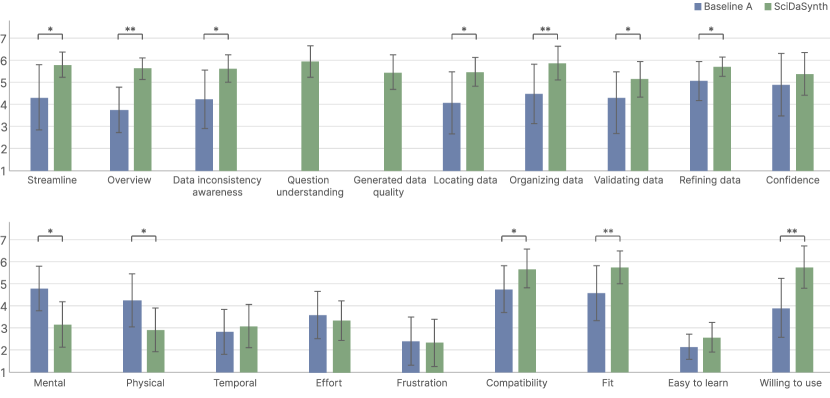
User study questionnaire results for both Baseline A and SciDaSynth. The first row of items compared the ratings regarding the effectiveness in streamlining data extraction workflow, gaining an overall understanding of the paper collection, awareness of data inconsistencies, question understanding, perceived generated data quality, data locating, organization, validation, refinement, and confidence in the final data table. The second row compared the questionnaire items adapted from the NASA Task Load Index and the technology acceptance model. All ratings were on a 7-point scale. For ratings: “Mental”, “Physical”, “Temporal”, “Frustration”, “Easy to learn”, the lower the ratings, the better. For all other ratings, the higher the ratings, the better. **: p ¡ 0.01, *: p ¡ 0.05.
5.5. Measurements
Effectiveness of data extraction was assessed by evaluating the data quality and task completion time:
For data quality, we compared the data tables generated by participants using SciDaSynth, Baseline A, and the automated GPT baseline (Baseline B) against the original data tables from the systematic review.
The lead author (also the co-author of this paper) of the review scored the data tables based on accuracy and completeness on a 3-point scale.
-
0 (Not Correct): Errors were present in the corresponding records for specific dimensions.
-
1 (Partially Correct): Records were generally correct but incomplete, missing some information for certain dimensions.
-
2 (Correct): Records in the data table were fully aligned with the original records in the review’s data table.
For SciDaSynth and Baseline A, we calculated 12 scores ranging from 0 to 20, corresponding to the number of papers for each dataset. For automated Baseline B, we had 4 (=2 x 2) scores in total for both datasets. Then, the paired Student’s t-test was performed to compare the average scores of SciDaSynth and Baseline A. The Mann-Whitney U test was performed for comparison involving Baseline B (Kang et al., 2023).
For task efficiency, we measured task completion time from the moment the PDFs were uploaded to the system to the moment the final data table was downloaded. The task completion times for SciDaSynth and Baseline A were compared using paired Student’s t-tests.
Users’ perceptions We measured participants’ perceptions towards systems for data extraction via post-task questionnaires. For the perceived workload using the systems, we adopted the validated 6-item NASA Task Load Index on a 7-point scale. For the system compatibility and adaptability with participants’ existing data extraction workflow, we adapted the technology acceptance model (5 items) on a 7-point scale (Kang et al., 2023; Wu and Wang, 2005). Furthermore, perceived utility around paper overview, workflow simplification, data location, organization, validation, awareness of data inconsistencies, editing and refinement, and confidence was measured via the questionnaire for each system on a 7-point scale. All questionnaire data was analyzed using non-parametric Wilcoxon’s signed rank test. We also collected and summarized the participants’ feedback during the post-study interviews on system designs and workflows and promising use cases of SciDaSynth for data extraction in their research work.
6. Results and Analyses
6.1. Effectiveness of Data Extraction
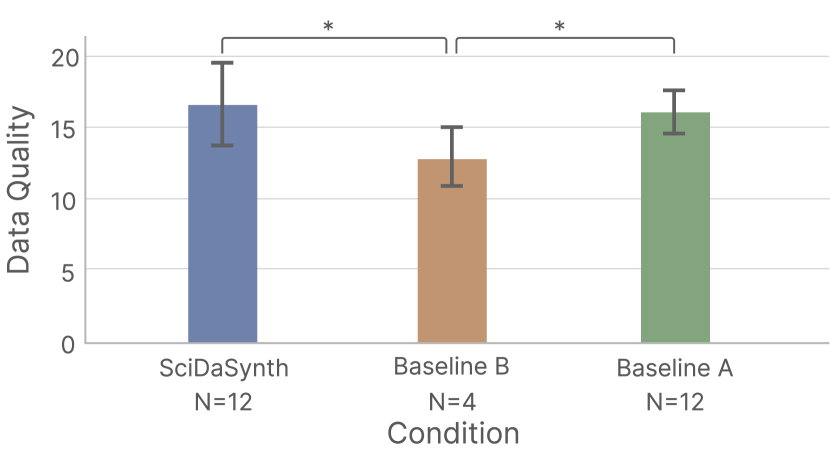
The data quality of using SciDaSynth, Baseline A (human baseline), and Baseline B (automated method). There was no significant difference in data quality between SciDaSynth and Baseline A. However, there were significant differences between Baseline B and the other two systems. *: p ¡ 0.05.
6.1.1. Data quality
Figure 6 shows the data quality results. Using SciDaSynth, participants were able to generate good-quality data tables (M=16.73, SD=2.83), 83.65% (=16.73/20) accuracy, comparable to Baseline A (M=16.18, SD=1.60) that mostly rely on manual data extraction from papers. There was no significant difference in accuracy scores between the two systems, as rated by the expert (i.e., the lead author of the systematic review from which the ground truths were derived): p=0.56 using paired Student’s t-test. The automated GPT baseline (i.e., Baseline B) achieved lower scores (M=13.00, SD=2.16), with 65.00% (=13.00/20) accuracy, which was less than both human-involved systems. And we observed significant differences between Baseline B and two other systems (vs. Baseline A: U=39.5, p=0.026; vs. SciDaSynth: U=38.5, p=0.040) with two-sided Mann-Whitney tests. Note that the rater was blind to the conditions under which each data record was generated.
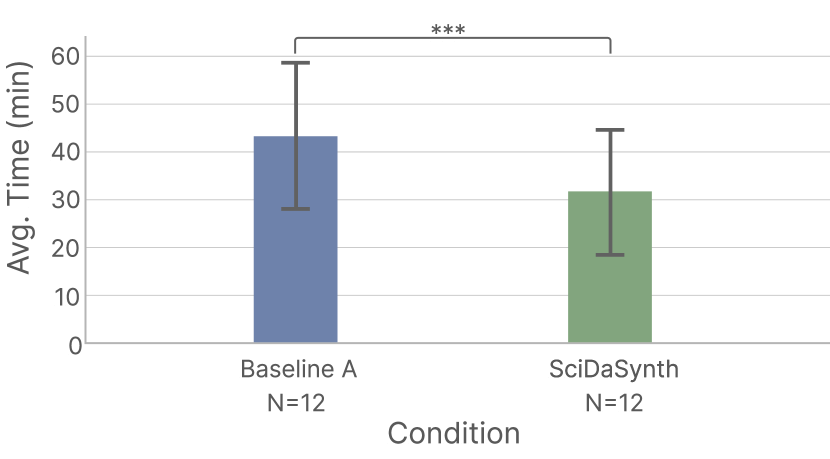
The task completion time of using SciDaSynth and Baseline A. The pairwise comparison between Baseline A and SciDaSynth was significant.
6.1.2. Efficiency
On average, participants using SciDaSynth spent 31.49 (SD = 12.91) minutes finishing the task, while participants using Baseline A spent 43.60 (SD = 15.36) minutes, which was nearly 40% longer. The difference in the task completion time between SciDaSynth and Baseline A was significant (p¡0.001 with paired Student’s t-test). Given the comparable and good data quality scores of both systems, SciDaSynth demonstrated its efficiency in facilitating users to produce quality data in significantly less time.
6.1.3. Case analyses of GPT baseline built upon our technical framework
The overall accuracy for automated Baseline B was 65.00% (=13.00/20). We further investigated the failure cases, where the accuracy score was 1 or 2 for each paper, of the GPT baseline for two datasets with two repetitions on each (i.e., total score of 80 (=2 (repetitions) x 2 (datasets) x 20 (total score for one dataset)) and identified three major reasons for these failures:
First, incomprehensive understanding of the query in the specific paper context (13/80). When asking about raw nutrient values in crops, Baseline B failed to contextualize the meaning of “raw” in individual paper contexts. For example, some papers might use words like “unprocessed” and “unwashed” or imply it in the tables with the processing start time equal to zero, which the system failed to recognize. Also, there were cases where one paper could have multiple crop types, but Baseline B extracted only one.
Second, incorrect table and figure parsing (9/80) Many failure cases stemmed from the retrieved tables and figures. Some tables, which had very complex designs and structures (e.g., hierarchical data dimensions), were parsed wrongly. And some information in the figures was overlooked. The quality of the retrieved information impacted the LLMs’ reasoning, resulting in outputting “empty” cell values for specific dimensions.
Third, missing associations between different parts of papers (6/80). In some instances, data in tables were incomplete and required interpretation with information from other sections. For example, when asking for what crops are in a paper, the system retrieved and reported all crop variety numbers from one table instead of crop names. However, the corresponding crop names were recorded in method sections, demonstrating the mappings between crop names and their variety numbers.
6.2. User Perceptions towards SciDaSynth
Quantitative analysis of post-task survey results and qualitative analysis of interviews revealed various types of benefits gained from using SciDaSynth, such as streamlining data extraction workflow, summarizing data characteristics embedded in paper collections, and facilitating data locating, validation, and editing. In addition, we identified several system limitations. Participants shared some opinions about AI support for data extraction, provided some suggestions, and pointed out promising use cases in their research.
6.2.1. Streamline the data extraction workflow
Overall, participants felt that SciDaSynth simplified the data extraction flow in several ways. They agreed that SciDaSynth greatly saved their time and effort in scanning and extracting relevant information by presenting them with a compact structured data table to start with. P12 said, “The system completes a data table with multiple records and dimensions through just one query. This is so labor-saving and efficient.” P8 commented, “The query helps me to find all of the key information, and I only need to verify them. That improves my efficiency a lot. ” This sentiment was also reflected in the significant difference in the questionnaire item: “effectiveness of simplifying data extraction workflow” between SciDaSynth (M=5.83, SD=0.58) and Baseline A (M=4.33, SD=1.50): p=0.012777All user questionnaire items were analyzed using Wilcoxon’s signed rank test..
Participants agreed that the system interactions were well-designed and that different system components were seamlessly glued together for data extraction. They appreciated the ability to filter data tables using both the summary plot (i.e., scatter plot) and table functions and the easy access to original paper content for specific data. Moreover, participants favored the question-answering interaction of the systems, which was deemed as “natural” (P9), “user-friendly”(P4), and “comfortable” (P12) way for extracting data. As shown in Figure 5, participants felt that SciDaSynth could understand their data questions (M=6.00, SD=0.74) They generally did not see any issues with the system’s ability to identify a set of interested data columns from their questions. Participants also agreed that SciDaSynth provided an acceptable quality of data tables (M=5.50, SD=0.80, with a score over 5) accordingly.
6.2.2. A global understanding of paper collections
reported that SciDaSynth significantly enhanced their overall understanding of the paper collection compared to Baseline A: (M=5.67, SD=0.49 vs. M=3.75, SD=1.06, p=0.005). Specifically, the scatter plot feature was highlighted as particularly useful for developing a sense of and comparing different paper topics. P8 said, “In a real work scenario, I need to have a basic overview of each paper, or about this set of papers, before I go to seek pieces of information and extract data into the Excel file. This overview (scatter plot) just fits my purpose.” P4 appreciated, “It helped to classify the literature so that I can dig deeper into details with less effort.” P6 liked the flexibility to select a group of papers of interest and get a short summary of them.
Moreover, SciDaSynth was found to facilitate the discovery of data inconsistencies and variations across the literature (M=5.67, SD=0.83) compared with Baseline A (M=4.25, SD=1.36): p=0.019. Many participants noted that the dimension-guided exploration in the scatter plot was effective in capturing the similarities and differences in papers, revealing data characteristics from different aspects, and conducting semantic filtering of data, especially in large paper collections (P4). For example, P3 stated, “Those colored clusters with labels were really meaningful, and they helped me understand and reason the data semantics. ” P7 praised, “I like how I can choose different dimensions to group different papers. I can really see the trends and significance of the topics from those groups. ” P1 shared, “Sometimes, I may be interested in multiple dimensions, like what crops contain beta carotene, what are their values for different processing methods. Previously, I may not easily get the answers to these questions. The scatter plot just nicely helps me label the information for me.”
6.2.3. Data locating, validation, and refinement
As shown in Figure 5, SciDaSynth were rated helpful for locating (M=5.50, SD=0.67), organizing (M=5.92, SD=0.79), validating (M=5.17, SD=0.83), and editing data (M=5.75, SD=0.45) from literature, with all scores over five. There were significant differences in these dimensions compared to Baseline A (locating: M=4.08, SD=1.44, p=0.031; organization: M=4.50, SD=1.38, p=0.007; validation: M=4.08, SD=1.44, p=0.046; editing: M=5.08, SD=0.90, p=0.021). Particularly, participants found that SciDaSynth allowed them to quickly navigate to the relevant parts of the papers by establishing and maintaining the connections between data and paper PDFs. This was also helpful for validating the auto-generated data. P1 shared, “I could easily access pdf, tables, and figures (using SciDaSynth). The option to look at context is also helpful to verify the data. For example, I easily cross-checked the data by clicking on open context, which saved time from skimming the whole paper.“ P7 added, “It helped me to direct my focus where the data is available in the paper.” P3 said, “The listed keywords (highlighted in the relevant contexts by clicking the rows) can help me locate contextual information to determine whether the information is correct.” Besides, many participants praised the batch editing feature. P5 mentioned, “I find several clusters pointing at the same crops. … after locating them in the table, it was super convenient for me to edit multiple rows of data in the table at once. ”
6.2.4. Reduced workload for data extraction
Participants generally felt that SciDaSynth provided support and reduced their workload for data extraction from the literature. Specifically, the results from NASA-TLX questionnaire items (shown in Figure 5) demonstrate that SciDaSynth lowered participants’ mental workload (M=3.17, SD=1.03 vs. M=4.75, SD=0.97) and physical workload (M=2.92, SD=1.00 vs. M=4.25, SD=1.22) compared to Baseline A: mental: p=0.015, physical: p=0.034. However, there were no significant differences between SciDaSynth and Baseline A in perceived temporal demand (M=3.08, SD=1.00 vs. M=2.83, SD=1.03, p=0.39), effort (M=3.33, SD=0.89 vs. M=3.58, SD=1.08, p=0.43), and frustration (M=2.33, SD=1.07 vs. M=2.42, SD=1.08, p=0.81).
6.2.5. Compatibility, learnability, and adaptability
Participants thought SciDaSynth was well-aligned with their data extraction workflow. They perceived it as compatible with their existing workflow and fitting their expected ways of data extraction, with significant differences between SciDaSynth and Baseline A in terms of compatibility (p=0.027) and fit (p=0.005). Although SciDaSynth had additional visualizations and interactions compared to the baseline, participants found it fairly easy to learn the system. P12 said, “I think the system is easy to learn and use, such as the query part, interface, and queried results.” And “It is easy to add a query and start a run” (P6), with minimum time to understand all the components (P1, P11, P12). Although SciDaSynth received a slightly higher score on the easiness of learning scale ( 1: easy to learn, 7: hard to learn) compared to Baseline A. The difference was not significant (p=0.21). Participants mentioned that some interactions took some time to become familiar with, such as “the operation on cluster results (enlarge, move, clear filtering)” (P10). P8 mentioned “I didn’t feel which component is difficult to learn. Every part is easy to learn, but some components may not align with my habits, so I probably make error clicks.” And Participants showed a stronger interest in using SciDaSynth (M=5.75, SD=0.97) than using SciDaSynth (M=3.92, SD=1.31) in their future work (p=0.002).
6.2.6. Participants remained cautious of AI-generated results
Participants were generally confident in their data tables built with SciDaSynth (M=5.75, SD=0.45) and with Baseline A (M5.08, SD=0.90). There was no significant difference in confidence between the two systems (p=0.33). In the interviews, they mentioned that they were reserved about AI-generated results and had their own preferences about using and trusting them. Generally, for the usage, they regarded the generated results as a starting point (“general guideline” (P1)) to gain an overview of data distributions and get some sense of what data might look like. They felt more comfortable letting the system automate qualitative data analyses than quantitative ones, especially for “straightforward” (P1, P3) and “exact” data (P8). However, when it came to a deep understanding of the paper content that requires specialized domain knowledge and rigor, participants were skeptical about generated results, regardless of their performance. They preferred to drill down to specific details in papers on their own. P12 said, “When I need to find the similarity or summary across multiple papers, I prefer to use this system. But for a very limited number of papers, I need to get detailed and precise information; I don’t depend on LLM.” P8 added, “I would say that I prefer not to rely on the system when collecting data from the results. These can be misinterpreted sometimes.” She also noted that “In the scenario that if the information I want to extract needs more understanding of the whole paper or knowing of the area, I would like read by myself. Another scenario is that if I am not familiar with the area, I will read by myself first. After I get familiar with the paper type and research paradigms, I will use this system.” Participants also expressed a fear of missing relevant information, which prompted them to cross-check the system-generated results. P6 mentioned, “At some places, not all relevant data were extracted. For example, in one paper, there were multiple crop genotypes with biofortification, but the data was extracted for one. If that’s the case for one paper, then I will always go back to the paper to cross-check if something was missed.”
6.2.7. System suggestions
Participants also provided some valuable suggestions for system improvement. P8 advised that besides scientific papers written in English, the system could support more languages. P5 suggested, “I tend to make notes and comments throughout the extraction, and it may be helpful to have a field dedicated to it.” P10 said, “I don’t like downloading papers one by one, may let system loads papers from websites.” P3 wanted a customizable interface where positions and sizes of views can be flexibly adjusted. Other suggestions mainly involve enriching table operations (e.g., change column orders (P6), ), tracking data provenance and reversing back the changes (P1),
6.3. Promising Use Cases
During post-study interviews, participants mentioned several situations in their research work that SciDaSynth would be helpful for their research studies.
6.3.1. To screen papers and preliminary categorization of papers.
Many participants thought SciDaSynth would be helpful in selecting and grouping papers more efficiently and systematically. P7 said, “When I search papers, I need to go to different websites like PubMed and Google Scholar and customize the search functions using some regular expressions, it would be nice to use this system to simply specify my requirements in natural language questions. Paper screening is usually tedious and time-consuming. I can imagine this tool (SciDaSynth) can be very useful to screen papers really fast and find relevant ones according to my interests. The scatter plot can help me assess different papers and topics, like what topics are most studied and which clusters (of papers) are more relevant or irrelevant to my study. It is also nice to see I can get a quick summary of those papers.” P5 commented “I would love to use it for preliminary grouping and labeling of papers. This would help me get a sense of papers from my unfamiliar domains quickly and help me develop ideas about paper taxonomy for review.”
6.3.2. To validate and monitor the database construction process.
Participants also mentioned that SciDaSynth could help analyze the quality of included studies. P1 said, “When I extract data from my paper collections, I usually delve into individual papers and do not have a big picture of what my data looks like. Sometimes, after extraction, I find that I may be inconsistently labeling specific topics. I think the data grouping supported in the scatter plot could keep me aware of my extracted data distribution throughout the process and alert me to potential biases or errors. ” P2 also liked about the idea of using SciDaSynth to track the data construction process on demand. P8 emphasized, “The system could identify my own inconsistent performance in data extraction and help me refine my extraction criteria.”
6.3.3. To interpret and summarize results
Participants also shared an interest in using SciDaSynth to interpret and summarize their results after data extraction. P9 said, “I am willing to use it to qualitatively summarize and explain relationships between different clusters of papers, especially for cases where narrative syntheses are needed.” P10 added that sometimes data from different studies are too heterogeneous in terms of methods or outcomes to be combined together statistically. SciDaSynth could help categorize studies qualitatively and summarize the trends and findings with each category, highlighting any consistent and notable patterns.
6.3.4. To communicate and share findings with the community
Some participants felt excited about using SciDaSynth as an interactive data portal to publicize and share their findings with other researchers. P4 and P7 thought that the natural language interactions and interactive data visualizations were intuitive and helpful for people to easily access, explore, and engage with others’ research work. P4 said, “Research findings were usually buried in different parts of papers; reading and digesting papers to extract them is exhausting and tedious. The data table (generated by the system) is a very nice way to organize and present them for people understand it. And the visuals and interactions (of the system) just make the data exploration so much fun and engaging.”
7. Discussion
7.1. Summary
In this work, we built a computational pipeline based on LLMs to automatically generate structured data tables according to users’ data questions for a paper collection. Building upon this, we designed and implemented an interactive system that supports data extraction and structuring from literature in a systematic and efficient manner. The user study with 12 researchers showed that SciDaSynth could help participants produce data tables with decent quality in a much shorter time compared to the human baseline and outperformed the fully automated baseline with higher data quality. Moreover, participants generally perceived that SciDaSynth effectively streamlined their data extraction process via natural question-answering interactions and provided a better overview of data characteristics and variations across the literature through flexible grouping in the scatter plot. Moreover, with the auto-generated data tables being the preliminary results, SciDaSynth facilitated data validation and refinement via easy access to the relevant information in the literature. Overall, the system designs and interactions helped reduce their workload, were compatible with their existing workflow, were easy to learn, and were desired for use in future research. Participants also came up with some use cases of SciDaSynth, such as paper screening, data extraction monitoring, results summary, and results sharing.
We also identified several limitations and challenges regarding technical implementations and user experience of using SciDaSynth. The automated technical framework was still far from perfect regarding the generated data quality. The failure cases included incorrect table and figure parsing, missing associations between different parts of papers, and incomprehension in understanding the domain contexts. Meanwhile, participants were cautious of auto-generated results and felt hesitant to use them for situations that require a deep understanding of domain knowledge and rigor. They generally regarded them as preliminary evidence and would need cross-checking with the source literature. In addition, participants expressed some challenges regarding navigating between different data contexts, missing highlighting of relevant information, and other usability functionality issues.
7.2. Design Implications
7.2.1. Structured data organization and presentation beyond table
In this work, we built a technical framework for automatically generating data tables from massive literature according to users’ interested questions. The structured data table helped externalize and standardize the large scale of unstructured knowledge embedded in the paper collections. According to the user study, the structured data table provided a good basis for a global understanding of paper collections and interactive visualizations of data improved awareness of data variations in different dimensions. In the future, systems can consider other data representations beyond table format for structuring and presenting knowledge. For example, the mind map is a useful diagram that can visually summarize the hierarchy within data, showing relationships between pieces of the whole. It can help users build a conceptual framework and taxonomy for paper collections, identify future research directions, and present research findings by branching out to sub-findings, implications, and recommendations. In addition, knowledge graphs could be useful for presenting and explaining the integration of data from multiple sources. They can also enrich data with semantic information by linking entities to concepts in an ontology, adding layers of meaning and context, and revealing hidden connections between entities.
7.2.2. Reduce context switch and provide in-situ highlighting of information
To assist users in locating, validating, and refining data, SciDaSynth establishes, highlights, and maintains the connections between data and relevant information in the literature. In the user study, participants favored the keyword highlighting in the pop-ups of relevant data contexts for corresponding rows. And they could easily access the original source PDFs for each data record. Both of these designs helped them validate the data quality. However, some participants pointed out that they needed to switch different tabs to validate data tables with the source PDF content. They also desired the text highlighting in the original paper PDFs. All of these benefits and challenges in data validation emphasize the importance of designs for reducing context switches and in-situ highlighting of information in knowledge extraction tasks.
7.2.3. Provide analytical guidance during information extraction
During the system exploration in the user study, some participants mentioned that they were hesitant about what questions to ask and how they should be formatted when facing paper collections that they might not be very familiar with. The future system should provide adaptive support and guidance for users to navigate the complex information space by suggesting information questions or user interactions for initial start, follow-ups, and clarifications (August et al., 2023; Wang et al., 2022). Those user questions and interaction suggestions could also be learned from users’ feedback and dynamic interactions as the question-answering process progresses.
7.2.4. Promote collaborative effort for knowledge extraction
In this work, we designed and built an interactive system, SciDaSynth, that facilitates users in extracting structured data from scientific literature based on LLM-generated results. The user study showed that SciDaSynth improved the efficiency of data extraction while presenting a comparable accuracy to the human baseline. However, the accuracies of both systems used by individual researchers were only slightly over 80%. There was still significant room for improvement regarding the quality of the data extracted by individuals. This showed that data extraction from literature is a demanding and challenging task. The system designs and workflow can further consider how to promote collaborative effort among individuals to extract and synthesize higher quality and more reliable data.
7.3. Limitations and Future Work
We discuss the limitations and future work based on our design and evaluation of SciDaSynth.
The technical limitations for future work include:
-
•
Improving domain context understanding. Currently, we use vanilla GPT3.5/4 to build a technical pipeline for data extraction from domain-specific literature. As reflected in the user study, the LLMs may still lack a deep understanding of the specialized domains and may impact users’ usage and trust of the results. Therefore, future work can consider enhancing the domain knowledge and reasoning of LLMs via various approaches, such as model finetuning on domain-related articles and iterative human-in-the-loop feedback.
-
•
Incorporate more quantitative metrics to measure the quality of auto-generated results. We only considered the data relevance and missingness metrics to guide users’ attention for cross-checking potentially low-quality data. However, errors could occur that are not captured by our metrics and may negatively impact the final data quality. In the future, we can develop and integrate more quantitative metrics to provide users with a more comprehensive understanding of LLM performance.
The user study evaluation has the following limitations:
-
•
Lack of evaluation with diverse and larger user groups. In this study, we only evaluated our system with 12 researchers who came from nutritional science related backgrounds. Inviting more researchers from different disciplines would further enhance the evaluation of SciDaSynth.
-
•
Lack of longitudinal study in real research scenarios. The user study was conducted based on a set of predefined data extraction tasks and paper collections. However, in real research settings, participants may have interests in different data dimensions and paper topics. A longitudinal study of how researchers would use SciDaSynth can further help validate and comprehensively identify the benefits and limitations of SciDaSynth.
8. Conclusion
In this paper, we designed and developed SciDaSynth, an interactive system for researchers to extract and synthesize data from massive scientific literature in an efficient and systematic way. Particularly, we built an LLM-based retrieval-augmented generation framework to automatically build structured data tables according to users’ data questions via question-answering interactions. Then, the system provided a suite of visualizations and interactions that guide the multi-faceted exploration of the generated data tables. During the exploration, users can gain a high-level understanding of data variations in different dimensions and quickly locate, validate, and refine data with relevant information in the source papers. Through a within-subjects study with 12 researchers, we demonstrated that SciDaSynth participants could use SciDaSynth to produce high-quality data tables in a shorter time compared to a baseline that mostly relies on manual data extraction from individual papers. And the system designs and workflow were perceived as useful by participants. They also pointed out some promising use cases of SciDaSynth in their research work. We further discussed some design implications and limitations based on the designs and evaluation of SciDaSynth.
References
- (1)
- AI (2024) Open AI. 2024. ChatGPT. https://chat.openai.com/. Accessed March 2024.
- Anthropic (2024) Anthropic. 2024. Claude. https://claude.ai/chats. Accessed March 2024.
- August et al. (2023) Tal August, Lucy Lu Wang, Jonathan Bragg, Marti A. Hearst, Andrew Head, and Kyle Lo. 2023. Paper Plain: Making Medical Research Papers Approachable to Healthcare Consumers with Natural Language Processing. ACM Trans. Comput. Hum. Interact. 30, 5, Article 74 (sep 2023), 38 pages. https://doi.org/10.1145/3589955
- Beltagy et al. (2019) Iz Beltagy, Kyle Lo, and Arman Cohan. 2019. SciBERT: A Pretrained Language Model for Scientific Text. In Proceedings of the 2019 Conference on Empirical Methods in Natural Language Processing and the 9th International Joint Conference on Natural Language Processing. Association for Computational Linguistics, Hong Kong, China, 3615–3620. https://doi.org/10.18653/v1/D19-1371
- Bohnet et al. (2023) Bernd Bohnet, Vinh Q Tran, Pat Verga, Roee Aharoni, Daniel Andor, Livio Baldini Soares, Massimiliano Ciaramita, Jacob Eisenstein, Kuzman Ganchev, Jonathan Herzig, et al. 2023. Attributed Question Answering: Evaluation and Modeling for Attributed Large Language Models. arXiv:2212.08037 [cs.CL]
- ChatDoc (nd) ChatDoc. n.d.. ChatDoc. https://chatdoc.com/. Accessed: March 2024.
- ChatPDF (nd) ChatPDF. n.d.. ChatPDF. https://www.chatpdf.com/. Accessed: March 2024.
- Chau et al. (2011) Duen Horng Chau, Aniket Kittur, Jason I Hong, and Christos Faloutsos. 2011. Apolo: Making Sense of Large Network Data by Combining Rich User Interaction and Machine Learning. In Proceedings of the 2011 CHI Conference on Human Factors in Computing Systems. ACM, New York, USA, 167–176.
- Chen et al. (2023) Xiang “Anthony” Chen, Chien-Sheng Wu, Lidiya Murakhovs’ka, Philippe Laban, Tong Niu, Wenhao Liu, and Caiming Xiong. 2023. Marvista: Exploring the Design of a Human-AI Collaborative News Reading Tool. ACM Trans. Comput.-Hum. Interact. 30, 6, Article 92 (sep 2023), 27 pages. https://doi.org/10.1145/3609331
- Clark and Divvala (2016) Christopher Clark and Santosh Divvala. 2016. PDFFigures 2.0: Mining Figures from Research Papers. In Proceedings of the 16th ACM/IEEE-CS on Joint Conference on Digital Libraries (Newark, USA). ACM, New York, USA, 143–152.
- Dagdelen et al. (2024) John Dagdelen, Alexander Dunn, Sanghoon Lee, Nicholas Walker, Andrew S. Rosen, Gerbrand Ceder, Kristin A. Persson, and Anubhav Jain. 2024. Structured Information Extraction from Scientific Text with Large Language Models. Nature Communications 15, 1 (15 Feb 2024), 1418. https://doi.org/10.1038/s41467-024-45563-x
- Dasigi et al. (2021) Pradeep Dasigi, Kyle Lo, Iz Beltagy, Arman Cohan, Noah A. Smith, and Matt Gardner. 2021. A Dataset of Information-Seeking Questions and Answers Anchored in Research Papers. In Proceedings of the 2021 Conference of the North American Chapter of the Association for Computational Linguistics: Human Language Technologies. Association for Computational Linguistics, Online, 4599–4610. https://doi.org/10.18653/v1/2021.naacl-main.365
- Elicit (2023) Elicit. 2023. Elicit: The AI Research Assistant. https://elicit.com
- Fok et al. (2024) Raymond Fok, Joseph Chee Chang, Tal August, Amy X Zhang, and Daniel S Weld. 2024. Qlarify: Bridging scholarly abstracts and papers with recursively expandable summaries. arXiv:2310.07581 [cs.HC]
- Fok et al. (2023) Raymond Fok, Hita Kambhamettu, Luca Soldaini, Jonathan Bragg, Kyle Lo, Marti Hearst, Andrew Head, and Daniel S Weld. 2023. Scim: Intelligent Skimming Support for Scientific Papers. In Proceedings of the 28th International Conference on Intelligent User Interfaces (Sydney, Australia). ACM, New York, USA, 476–490. https://doi.org/10.1145/3581641.3584034
- Gao et al. (2023) Luyu Gao, Zhuyun Dai, Panupong Pasupat, Anthony Chen, Arun Tejasvi Chaganty, Yicheng Fan, Vincent Zhao, Ni Lao, Hongrae Lee, Da-Cheng Juan, and Kelvin Guu. 2023. RARR: Researching and Revising What Language Models Say, Using Language Models. In Proceedings of the 61st Annual Meeting of the Association for Computational Linguistics. ACL, Toronto, Canada, 16477–16508. https://doi.org/10.18653/v1/2023.acl-long.910
- Google (nd) Google. n.d.. Google Scholar. https://scholar.google.com/. Accessed: March 2024.
- GROBID (2024) GROBID 2008–2024. GROBID. https://github.com/kermitt2/grobid.
- Head et al. (2021a) Andrew Head, Kyle Lo, Dongyeop Kang, Raymond Fok, Sam Skjonsberg, Daniel S Weld, and Marti A Hearst. 2021a. Augmenting Scientific Papers with Just-in-time, Position-sensitive Definitions of Terms and Symbols. In Proceedings of the 2021 CHI Conference on Human Factors in Computing Systems. ACM, New York, USA, 1–18.
- Head et al. (2021b) Andrew Head, Kyle Lo, Dongyeop Kang, Raymond Fok, Sam Skjonsberg, Daniel S. Weld, and Marti A. Hearst. 2021b. Augmenting Scientific Papers with Just-in-Time, Position-Sensitive Definitions of Terms and Symbols. In Proceedings of the 2021 CHI Conference on Human Factors in Computing Systems (Yokohama, Japan). ACM, New York, USA, Article 413, 18 pages. https://doi.org/10.1145/3411764.3445648
- Huey et al. (2023) Samantha L. Huey, Elsa M. Konieczynski, Neel H. Mehta, Jesse T. Krisher, Arini Bhargava, Valerie M. Friesen, Mduduzi N. N. Mbuya, Eva C. Monterrosa, Annette M. Nyangaresi, and Saurabh Mehta. 2023. A systematic review of the impacts of post-harvest handling on provitamin A, iron and zinc retention in seven biofortified crops. Nature Food 4, 11 (01 Nov 2023), 978–985. https://doi.org/10.1038/s43016-023-00874-y
- Inc. (nd) Adobe Inc. n.d.. Adobe PDF Services API. https://developer.adobe.com/document-services/apis/pdf-extract/. Accessed March 2024.
- Ji et al. (2023) Ziwei Ji, Nayeon Lee, Rita Frieske, Tiezheng Yu, Dan Su, Yan Xu, Etsuko Ishii, Ye Jin Bang, Andrea Madotto, and Pascale Fung. 2023. Survey of Hallucination in Natural Language Generation. Comput. Surveys 55, 12 (2023), 1–38.
- Jin et al. (2019) Qiao Jin, Bhuwan Dhingra, Zhengping Liu, William Cohen, and Xinghua Lu. 2019. PubMedQA: A Dataset for Biomedical Research Question Answering. In Proceedings of the 2019 Conference on Empirical Methods in Natural Language Processing and the 9th International Joint Conference on Natural Language Processing. ACL, Hong Kong, China, 2567–2577. https://doi.org/10.18653/v1/D19-1259
- Kang et al. (2022) Hyeonsu Kang, Joseph Chee Chang, Yongsung Kim, and Aniket Kittur. 2022. Threddy: An Interactive System for Personalized Thread-based Exploration and Organization of Scientific Literature. In Proceedings of the 35th Annual ACM Symposium on User Interface Software and Technology. ACM, New York, USA, 1–15.
- Kang et al. (2023) Hyeonsu B Kang, Tongshuang Wu, Joseph Chee Chang, and Aniket Kittur. 2023. Synergi: A Mixed-Initiative System for Scholarly Synthesis and Sensemaking. In Proceedings of the 36th Annual ACM Symposium on User Interface Software and Technology. ACM, New York, USA, 1–19.
- Khullar et al. (2024) Dhruv Khullar, Xingbo Wang, and Fei Wang. 2024. Large Language Models in Health Care: Charting a Path Toward Accurate, Explainable, and Secure AI. Journal of General Internal Medicine (2024), 1–3. https://doi.org/10.1007/s11606-024-08657-2
- Kim et al. (2018) Dae Hyun Kim, Enamul Hoque, Juho Kim, and Maneesh Agrawala. 2018. Facilitating Document Reading by Linking Text and Tables. In Proceedings of the 31st Annual ACM Symposium on User Interface Software and Technology (Berlin, Germany) (UIST ’18). ACM, New York, USA, 423–434. https://doi.org/10.1145/3242587.3242617
- Krithara et al. (2023) Anastasia Krithara, Anastasios Nentidis, Konstantinos Bougiatiotis, and Georgios Paliouras. 2023. BioASQ-QA: A Manually Curated Corpus for Biomedical Question Answering. Scientific Data 10, 1 (27 Mar 2023), 170. https://doi.org/10.1038/s41597-023-02068-4
- Lee et al. (2016) Byungjoo Lee, Olli Savisaari, and Antti Oulasvirta. 2016. Spotlights: Attention-Optimized Highlights for Skim Reading. In Proceedings of the 2016 CHI Conference on Human Factors in Computing Systems (San Jose, USA). ACM, New York, USA, 5203–5214. https://doi.org/10.1145/2858036.2858299
- Lewis et al. (2020a) Patrick Lewis, Myle Ott, Jingfei Du, and Veselin Stoyanov. 2020a. Pretrained Language Models for Biomedical and Clinical Tasks: Understanding and Extending the State-of-the-Art. In Proceedings of the 3rd Clinical Natural Language Processing Workshop. ACL, Online, 146–157. https://doi.org/10.18653/v1/2020.clinicalnlp-1.17
- Lewis et al. (2020b) Patrick Lewis, Ethan Perez, Aleksandra Piktus, Fabio Petroni, Vladimir Karpukhin, Naman Goyal, Heinrich Küttler, Mike Lewis, Wen-tau Yih, Tim Rocktäschel, et al. 2020b. Retrieval-augmented Generation for Knowledge-intensive NLP Tasks. Advances in Neural Information Processing Systems 33 (2020), 9459–9474.
- Lo et al. (2023) Kyle Lo, Zejiang Shen, Benjamin Newman, Joseph Chang, Russell Authur, Erin Bransom, Stefan Candra, Yoganand Chandrasekhar, Regan Huff, Bailey Kuehl, Amanpreet Singh, Chris Wilhelm, Angele Zamarron, Marti A. Hearst, Daniel Weld, Doug Downey, and Luca Soldaini. 2023. PaperMage: A Unified Toolkit for Processing, Representing, and Manipulating Visually-Rich Scientific Documents. In Proceedings of the 2023 Conference on Empirical Methods in Natural Language Processing: System Demonstrations. ACL, Singapore, 495–507. https://doi.org/10.18653/v1/2023.emnlp-demo.45
- Menick et al. (2022) Jacob Menick, Maja Trebacz, Vladimir Mikulik, John Aslanides, Francis Song, Martin Chadwick, Mia Glaese, Susannah Young, Lucy Campbell-Gillingham, Geoffrey Irving, et al. 2022. Teaching Language Models to Support Answers with Verified Quotes. arXiv:2203.11147 [cs.CL]
- OpenAI (2024) OpenAI. 2024. GPT-4 Technical Report. arXiv:2303.08774 [cs.CL]
- Peng et al. (2022) Zhenhui Peng, Yuzhi Liu, Hanqi Zhou, Zuyu Xu, and Xiaojuan Ma. 2022. CReBot: Exploring Interactive Question Prompts for Critical Paper Reading. International Journal of Human-Computer Studies 167 (2022), 102898. https://doi.org/10.1016/j.ijhcs.2022.102898
- Ponsard et al. (2016a) Antoine Ponsard, Francisco Escalona, and Tamara Munzner. 2016a. PaperQuest: A Visualization Tool to Support Literature Review. In Proceedings of the 2016 CHI Conference Extended Abstracts on Human Factors in Computing Systems. ACM, New York, USA, 2264–2271.
- Ponsard et al. (2016b) Antoine Ponsard, Francisco Escalona, and Tamara Munzner. 2016b. PaperQuest: A Visualization Tool to Support Literature Review. In Proceedings of the 2016 CHI Conference Extended Abstracts on Human Factors in Computing Systems (San Jose, USA). ACM, New York, USA, 2264–2271. https://doi.org/10.1145/2851581.2892334
- Rashkin et al. (2023) Hannah Rashkin, Vitaly Nikolaev, Matthew Lamm, Lora Aroyo, Michael Collins, Dipanjan Das, Slav Petrov, Gaurav Singh Tomar, Iulia Turc, and David Reitter. 2023. Measuring Attribution in Natural Language Generation Models. Computational Linguistics 49, 4 (12 2023), 777–840. https://doi.org/10.1162/coli_a_00486
- Ruggeri et al. (2023) Federico Ruggeri, Mohsen Mesgar, and Iryna Gurevych. 2023. A Dataset of Argumentative Dialogues on Scientific Papers. In Proceedings of the 61st Annual Meeting of the Association for Computational Linguistics. ACL, Toronto, Canada, 7684–7699. https://doi.org/10.18653/v1/2023.acl-long.425
- Shahaf et al. (2012) Dafna Shahaf, Carlos Guestrin, and Eric Horvitz. 2012. Metro Maps of Science. In Proceedings of the 18th ACM SIGKDD international conference on Knowledge discovery and data mining. ACM, New York, USA, 1122–1130.
- Singhal et al. (2023) Karan Singhal, Shekoofeh Azizi, Tao Tu, S Sara Mahdavi, Jason Wei, Hyung Won Chung, Nathan Scales, Ajay Tanwani, Heather Cole-Lewis, Stephen Pfohl, et al. 2023. Large Language Models Encode Clinical Knowledge. Nature 620, 7972 (2023), 172–180.
- Taylor et al. (2022) Ross Taylor, Marcin Kardas, Guillem Cucurull, Thomas Scialom, Anthony Hartshorn, Elvis Saravia, Andrew Poulton, Viktor Kerkez, and Robert Stojnic. 2022. Galactica: A Large Language Model for Science. arXiv:2211.09085 [cs.CL]
- ter Hoeve et al. (2020) Maartje ter Hoeve, Robert Sim, Elnaz Nouri, Adam Fourney, Maarten de Rijke, and Ryen W White. 2020. Conversations with Documents: An Exploration of Document-centered Assistance. In Proceedings of the 2020 Conference on Human Information Interaction and Retrieval. ACM, New York, USA, 43–52.
- Tkaczyk et al. (2015) Dominika Tkaczyk, Paweł Szostek, Mateusz Fedoryszak, Piotr Jan Dendek, and Łukasz Bolikowski. 2015. CERMINE: Automatic Extraction of Structured Metadata from Scientific Literature. International Journal on Document Analysis and Recognition 18 (2015), 317–335.
- Touvron et al. (2023) Hugo Touvron, Louis Martin, Kevin Stone, Peter Albert, Amjad Almahairi, Yasmine Babaei, Nikolay Bashlykov, Soumya Batra, Prajjwal Bhargava, Shruti Bhosale, et al. 2023. Llama 2: Open Foundation and Fine-tuned Chat Models. arXiv:2307.09288 [cs.CL]
- Vilares and Gómez-Rodríguez (2019) David Vilares and Carlos Gómez-Rodríguez. 2019. HEAD-QA: A Healthcare Dataset for Complex Reasoning. In Proceedings of the 57th Annual Meeting of the Association for Computational Linguistics. ACL, Florence, Italy, 960–966. https://doi.org/10.18653/v1/P19-1092
- Wang et al. (2022) Xingbo Wang, Furui Cheng, Yong Wang, Ke Xu, Jiang Long, Hong Lu, and Huamin Qu. 2022. Interactive Data Analysis with Next-step Natural Language Query Recommendation. arXiv:2201.04868 [cs.HC]
- Wang et al. (2024) Xingbo Wang, Renfei Huang, Zhihua Jin, Tianqing Fang, and Huamin Qu. 2024. CommonsenseVIS: Visualizing and Understanding Commonsense Reasoning Capabilities of Natural Language Models. IEEE Transactions on Visualization and Computer Graphics 30, 1 (2024), 273–283. https://doi.org/10.1109/TVCG.2023.3327153
- Wu and Wang (2005) Jen-Her Wu and Shu-Ching Wang. 2005. What Drives Mobile Commerce?: An Empirical Evaluation of the Revised Technology Acceptance Model. Information & management 42, 5 (2005), 719–729.
- Yue et al. (2023) Xiang Yue, Boshi Wang, Ziru Chen, Kai Zhang, Yu Su, and Huan Sun. 2023. Automatic Evaluation of Attribution by Large Language Models. In Findings of the Association for Computational Linguistics: EMNLP 2023. ACL, Singapore, 4615–4635. https://doi.org/10.18653/v1/2023.findings-emnlp.307
- Zeng et al. (2023) Andy Zeng, Maria Attarian, brian ichter, Krzysztof Marcin Choromanski, Adrian Wong, Stefan Welker, Federico Tombari, Aveek Purohit, Michael S Ryoo, Vikas Sindhwani, Johnny Lee, Vincent Vanhoucke, and Pete Florence. 2023. Socratic Models: Composing Zero-Shot Multimodal Reasoning with Language. In The Eleventh International Conference on Learning Representations. OpenReview.net. https://openreview.net/forum?id=G2Q2Mh3avow
- Zhang et al. (2023) Shao Zhang, Hui Xu, Yuting Jia, Ying Wen, Dakuo Wang, Luoyi Fu, Xinbing Wang, and Chenghu Zhou. 2023. GeoDeepShovel: A Platform for Building Scientific Database from Geoscience Literature with AI Assistance. Geoscience Data Journal n/a, n/a (2023). https://doi.org/10.1002/gdj3.186
- Zhao et al. (2023) Jiuyang Zhao, Shu Huang, and Jacqueline M Cole. 2023. OpticalBERT and OpticalTable-SQA: Text-and Table-based Language Models for the Optical-materials Domain. Journal of Chemical Information and Modeling 63, 7 (2023), 1961–1981.