Modeling Rainwater Harvesting Systems with Covered Storage Tank on A Smartphone
1 Introduction
Harvesting rainwater and storing it in a covered tank for future use is an attractive way of meeting the water needs in many parts of the world111For more details see the article Rainwater Harvesting in Wikipedia Such systems are often referred to as rainwater harvesting systems with covered storage tanks; for brevity, we will refer to them simply as RWHS. These systems are appealing on many counts: they are relatively simple to build, easy to integrate with other sources of water, and they minimize the use of energy for transporting the water from the source to the user. The role of RWHS is likely to increase with the increasing occurrence of drought, even in the regions which historically have not faced water scarcity [1].
An important concern while exploring the use of RWHS as a main or supplemental source of water is the variability in the rainfall. It is expected that due to global warming the variability in rainfall will increase in many parts of the world, and this will be reflected in frequent droughts interspersed with floods [2][3]. Therefore it is important to take into account these fluctuations in rainfall in designing and using RWHS. Specifically, we would like to take into account these fluctuations in finding the optimum tank size for meeting a given demand from a given catchment area. Similarly, while developing strategies for facing a drought we would like to take into account the fluctuations in rainfall in estimating the amount of water that will be available in the immediate future knowing the present amount of stored water.
Aim of this article is to document a model that attempts to answer the above questions222Precursor of the present model is described in [4]. The model has been implemented as an app SimTanka for smartphones333SimTanka is a free and open-source app for designing, maintaining and using a RWHS. More details of the app and its availability can be found here.. The outline of the article is as follows: In the next section (2) we set up the water balance equation and describe the algorithm used to calculate the model probabilities for the reliability of a given RWHS in meeting the user’s water needs. A critical look at the model and the manner in which the model probabilities are used in SimTanka is described in sec. (3). In sec. (4) we illustrate the use of SimTanka. We state our conclusions in the final section (5).
2 Water balance equation and the model probabilities
A RWHS with covered storage tank is characterized by three parameters: one, the size of the catchment area , secondly, the so-called runoff coefficient which determines the fraction of the rainwater that can be harvested from a given catchment area; and finally, by the volume of the storage tank. The question that we are interested in answering is how well this system can meet a given water demand. If we could know in advance the daily rainfall, then one can use a simple water balance equation to answer this question. In the absence of such knowledge we would like to develop a model that uses past daily rainfall records together with the water balance equation to generate model probabilities for the likelihood of the system meeting a given demand.
With this in mind we first set up the water balance equation for a RWHS. Let be the rainwater harvested on day which is related to the daily rainfall and the catchment area through
| (1) |
here is the runoff coefficient which characterizes the surface area. Using we can evolve the water in the tank on day from in the following manner: if is the volume of the storage tank and is the daily water demand for the day then we first calculate a variable
| (2) |
then we evolve the variable
| (3) |
Equation (2) implements the constraint that amount of water in the tank cannot be greater than the volume of the tank and (3) ensures that the water in the tank cannot be negative. Using these equation together with the given initial condition , the amount of water at the beginning of the simulation, we can evolve the amount of water in the tank. We will be interested in two scenarios, one in which , that is we start with an empty tank, and other in which the user provides us with the initial amount of water in the tank.
2.1 Estimating the reliability of the RWHS
We would like to estimate the likelihood of our RWHS meeting the given water demand. For this purpose we evolve the RWHS using eqs. (1-3) for the last five years with the initial condition and using the daily rainfall data from the historical time series of daily rainfall record for the past five years. Then we calculate the fraction of days for which ( 2) is greater than or equal to zero while the demand is not zero
| (4) |
A pseudo code that implements this calculation is show as Algorithm (1).
2.2 Model probability for the future performance of the RWHS
Similarly we can estimate the probability for meeting the daily demands for the next thirty days knowing the amount of water in the tank by evolving the system using last five years of daily rainfall record but now with the initial state of the system being provided by the user and evolving the system only for the next thirty days:
| probability | (5) |
The pseudo code for this is presented in Algorithm (2).
-
•
is the number of days in the past for which we have the daily rainfall record
-
•
is an array of elements for storing the amount of water in the storage tank at the end of the day.
-
•
is an array of which contains the water demand for the day. This array is provided by the user.
-
•
is a variable to store the number of days for which the RWHS is used.
-
•
is a variable to store the number of days for which the RWHS could meet the user’s demand.
-
•
is an array of for storing the amount of water harvested on the day and is given by
where is a dimensionless constant characterizing the catchment area and it value ranges from to , is the rainfall on the day and is the area of the surface from which the rainwater is harvested.
3 Motivation for the model and its use in SimTanka
The main purpose for developing this model was to facilitate the building, maintaining and using a RWHS. With this in mind the model has been implemented as an app called SimTanka for smartphones. There are various features of the model which are to an extent arbitrary. We comment on the rational behind these choices. The model assumes that the rainfall pattern at any location changes on a time scale which is greater than five years. The use of the past five years of daily rainfall records to estimate the future performance is an ad-hoc, but unfortunately, a necessary assumption in the absence of a dynamical model for predicting future rainfall with a useful precision. The choice of using past five years of daily rainfall records rather than say past ten years of rainfall records is a compromise between exposing the system to rare events and limiting the computation that can be done in real time on a smartphone.
Fortunately the ad-hoc nature of the model is to some degree mitigated by the manner in which the model is used. The model is used to answer two questions for the user:
-
1.
Will the reliability of my system improve if I increase the volume of the storage tank?
-
2.
Will the system be able to meet my water needs for the next thirty days and how much water will be there in the tank after that?
The model is used to answer these questions by using the following heuristic metric,
| (6) |
where is the model probability calculated using the above described algorithm.
4 Illustrative use of SimTanka
We present the results for the use of model probabilities for two different scenarios.
4.1 Domestic rainwater harvesting system in Bangalore, India
Banglore, like many other metropolitan cities is facing water shortage. For city like Bangalore, which has roughly six rainy months in an year (see Fig. (1)) rainwater harvesting can be a very attractive supplemental source of water.

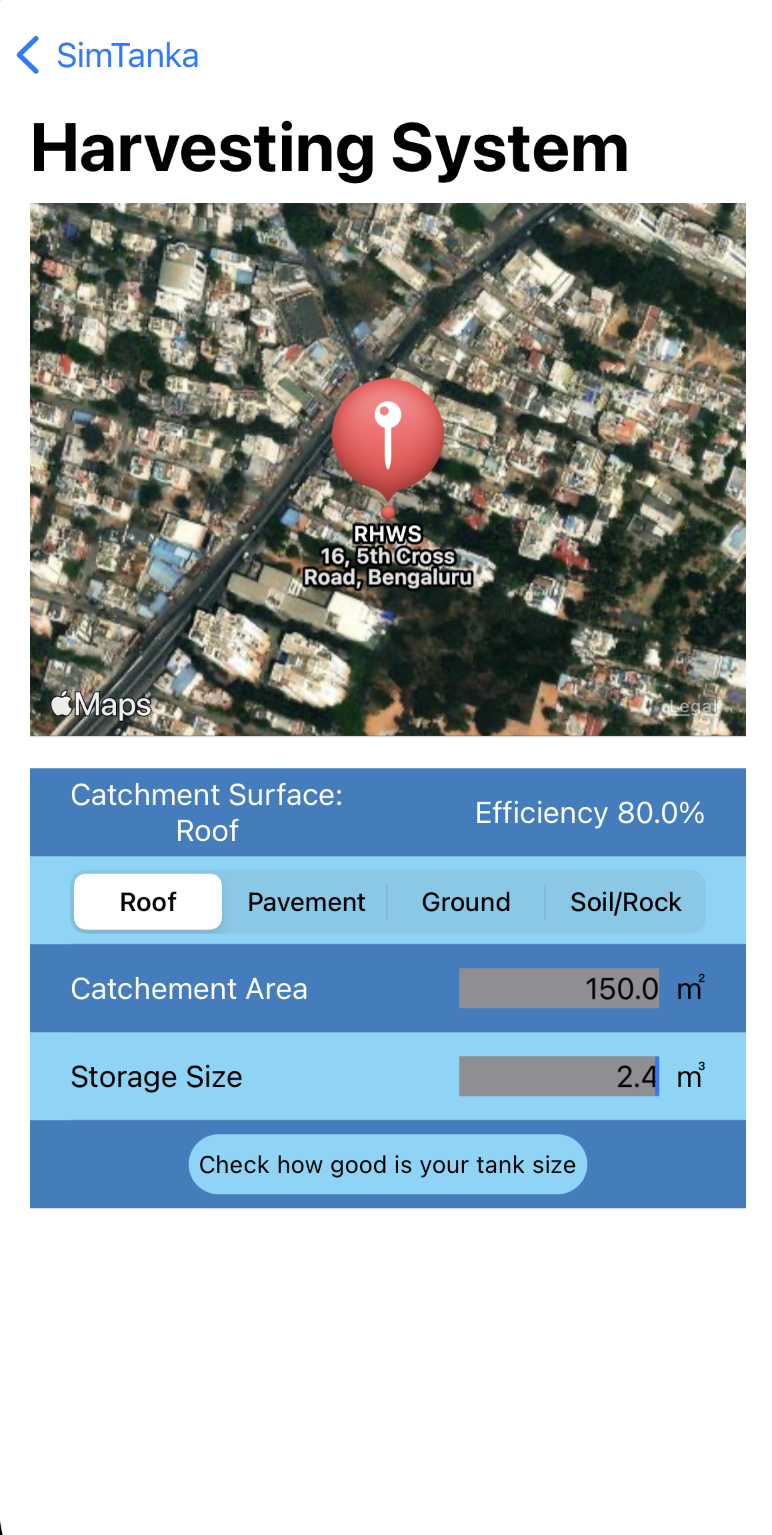
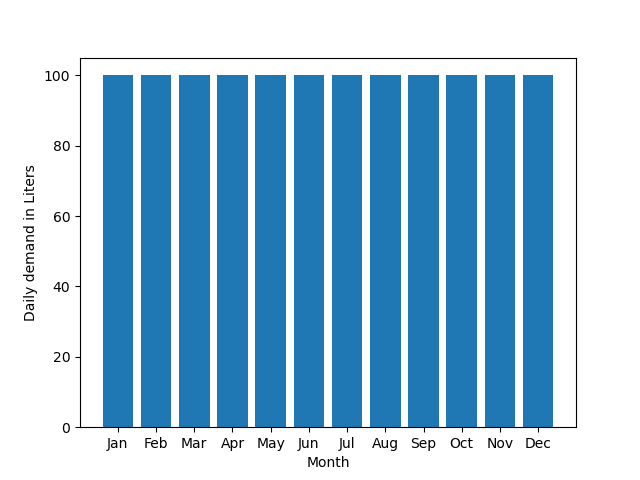
This has been recognized by the state government by requiring that all buildings with area larger than must construct a rainwater harvesting system444See the article: Harvesting and using rainwater, a must in Bengaluru. We consider a RWHS which is used through out the year for watering a garden in a residential house. The house has a catchment area of and for illustrative purpose daily water requirement of was assumed. The existing system has a tank size of . A natural question for a user to ask is “Is it worth increasing the tank size?”


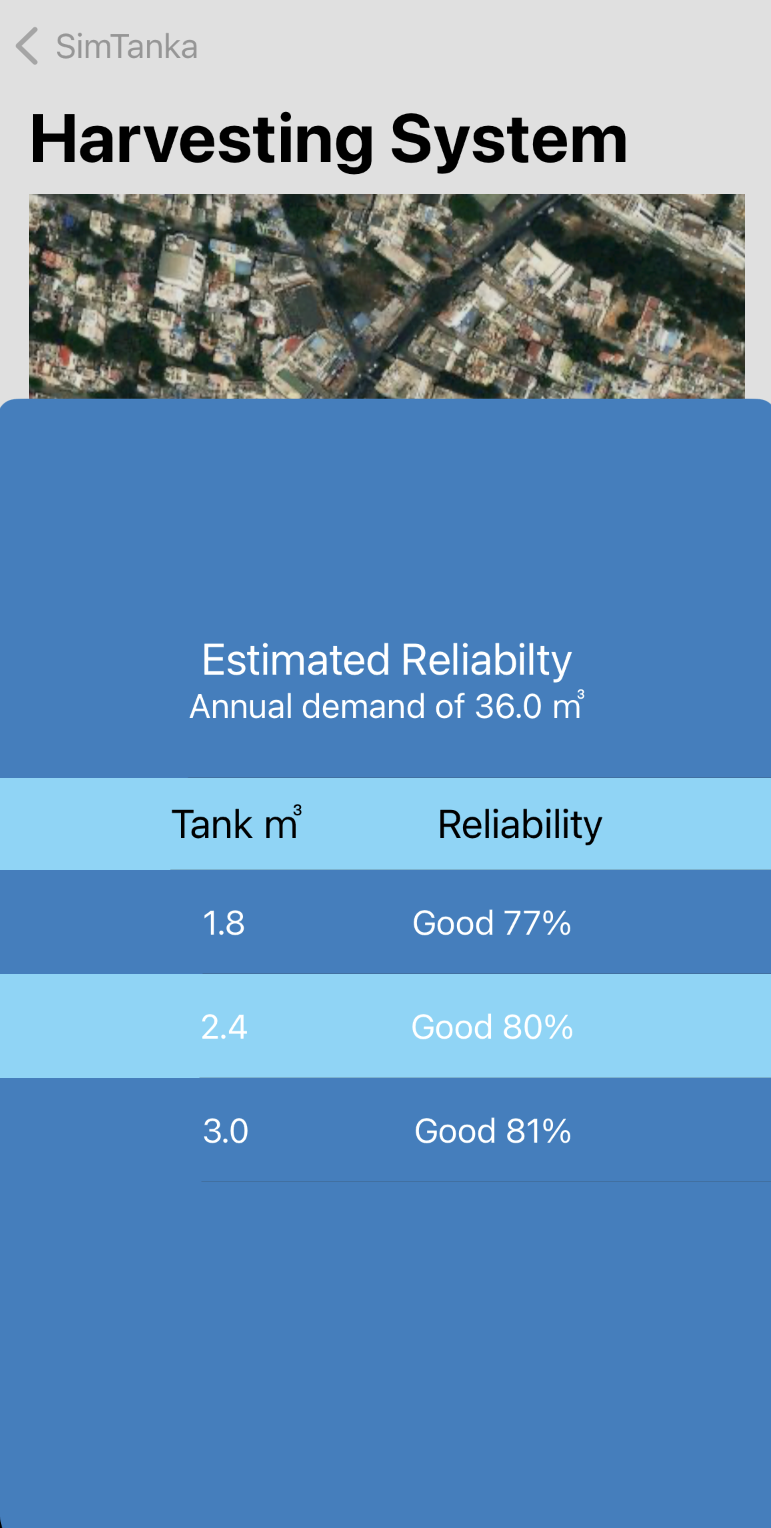
Such questions can be easily addressed using SimTanka. In Fig. (2) we show the screen shots of SimTanka exhibiting the performance for the original tank size of along with tank sizes which are smaller and larger. These simulations were done using daily rainfall data for Bangalore for the years 2018-22 [5]. We see that the estimated reliability of the users existing system is with not significant changes in reliability for the smaller and the larger tanks. In Fig. (3) we exhibit the performance for a scenario in which the user doubles the size of the storage tank to
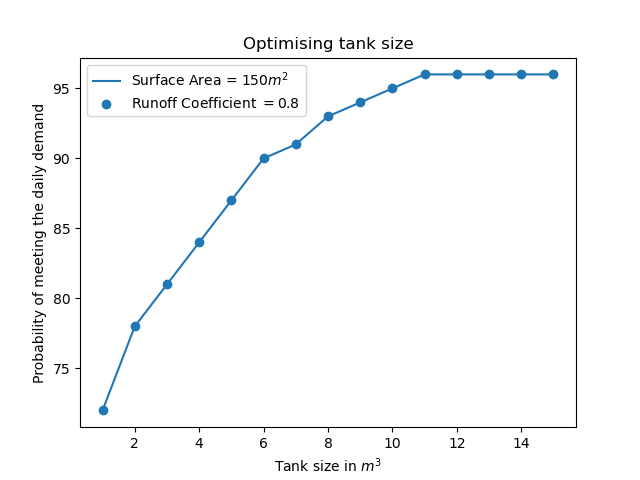
With a tank size of the reliability of the original system increases from to . For a RWHS which is used as a supplemental system this modest increase in reliability may not be worth the expense of an additional tank. But we can imagine a situation where the same RWHS is used as a main source of water and we may want to find the “optimum” tank size, namely the tank size which provides maximum reliability for the minimum storage size. Using SimTanka repeatedly one can answer such a question. The results from such repeated use of SimTanka are exhibited as a graph between the size of the storage tank and the reliability in Fig. (4). For the scenario under consideration the optimum tank size is approximately with a reliability of . It is important to emphasis that this optimum tank size is based on the user provided fixed daily water budget, and in real life situation adherence of a user to a fixed water budget may not always be possible.
4.2 Rainwater harvesting systems in Thar Desert, India
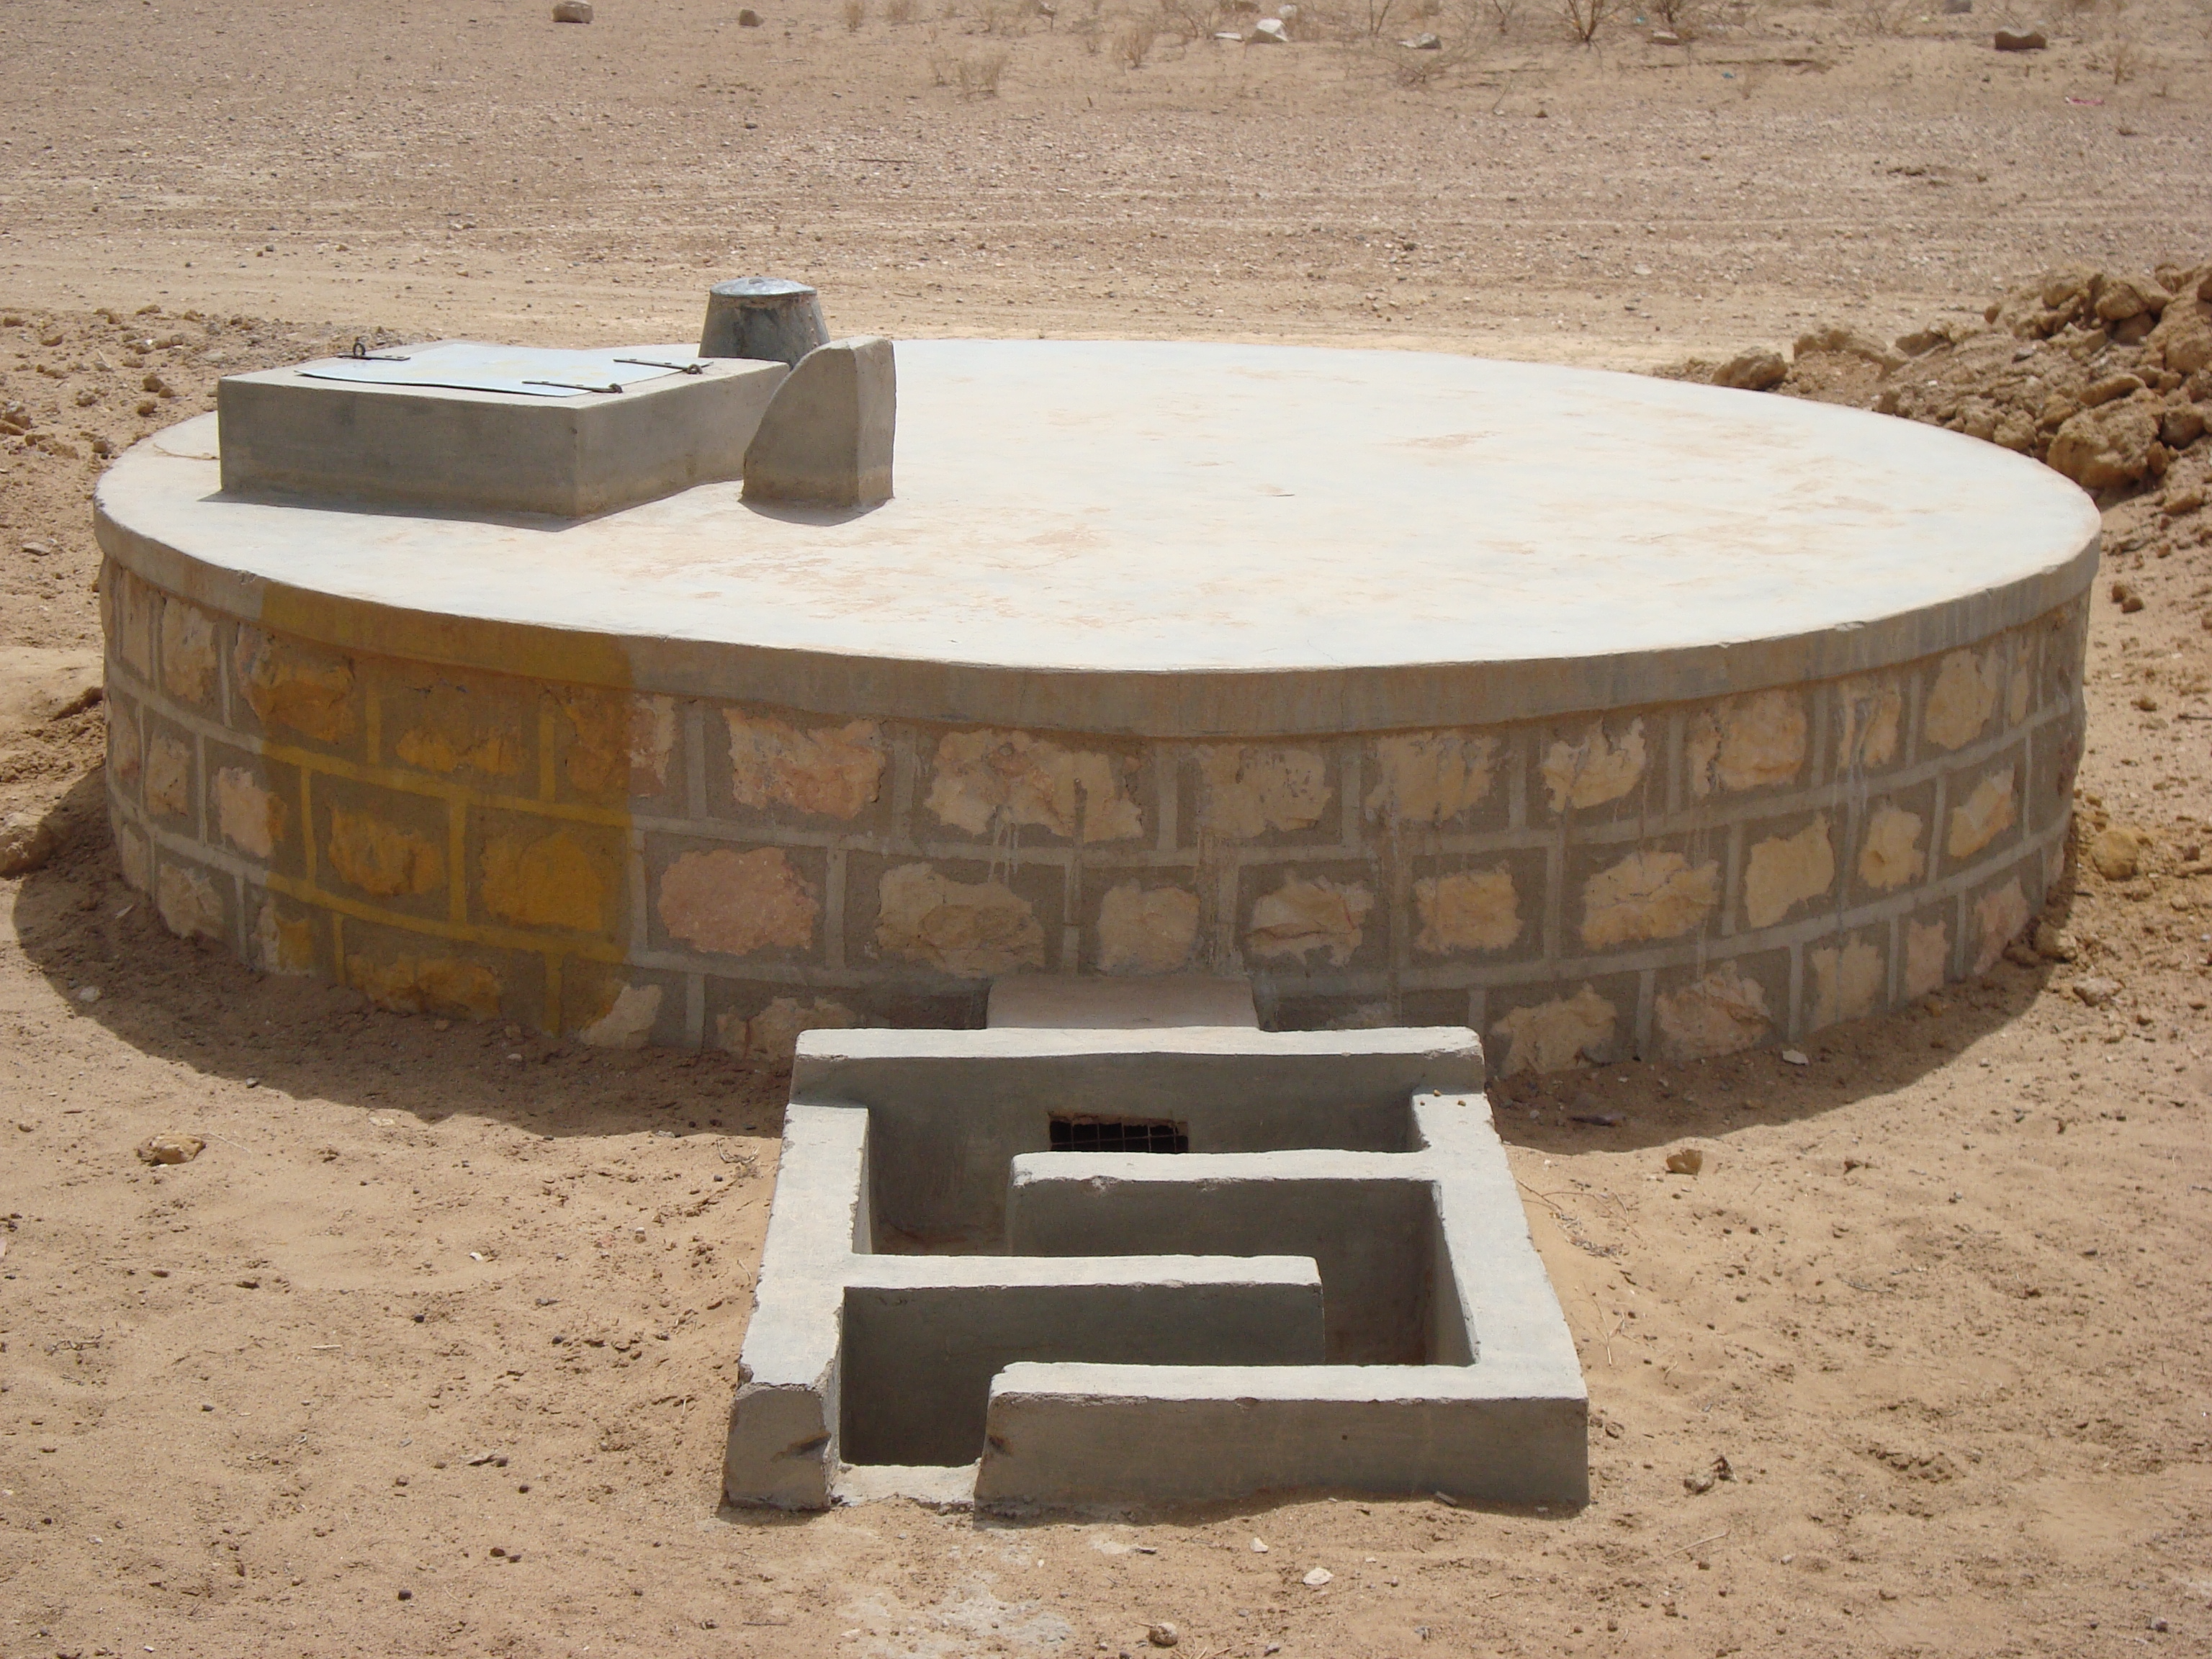
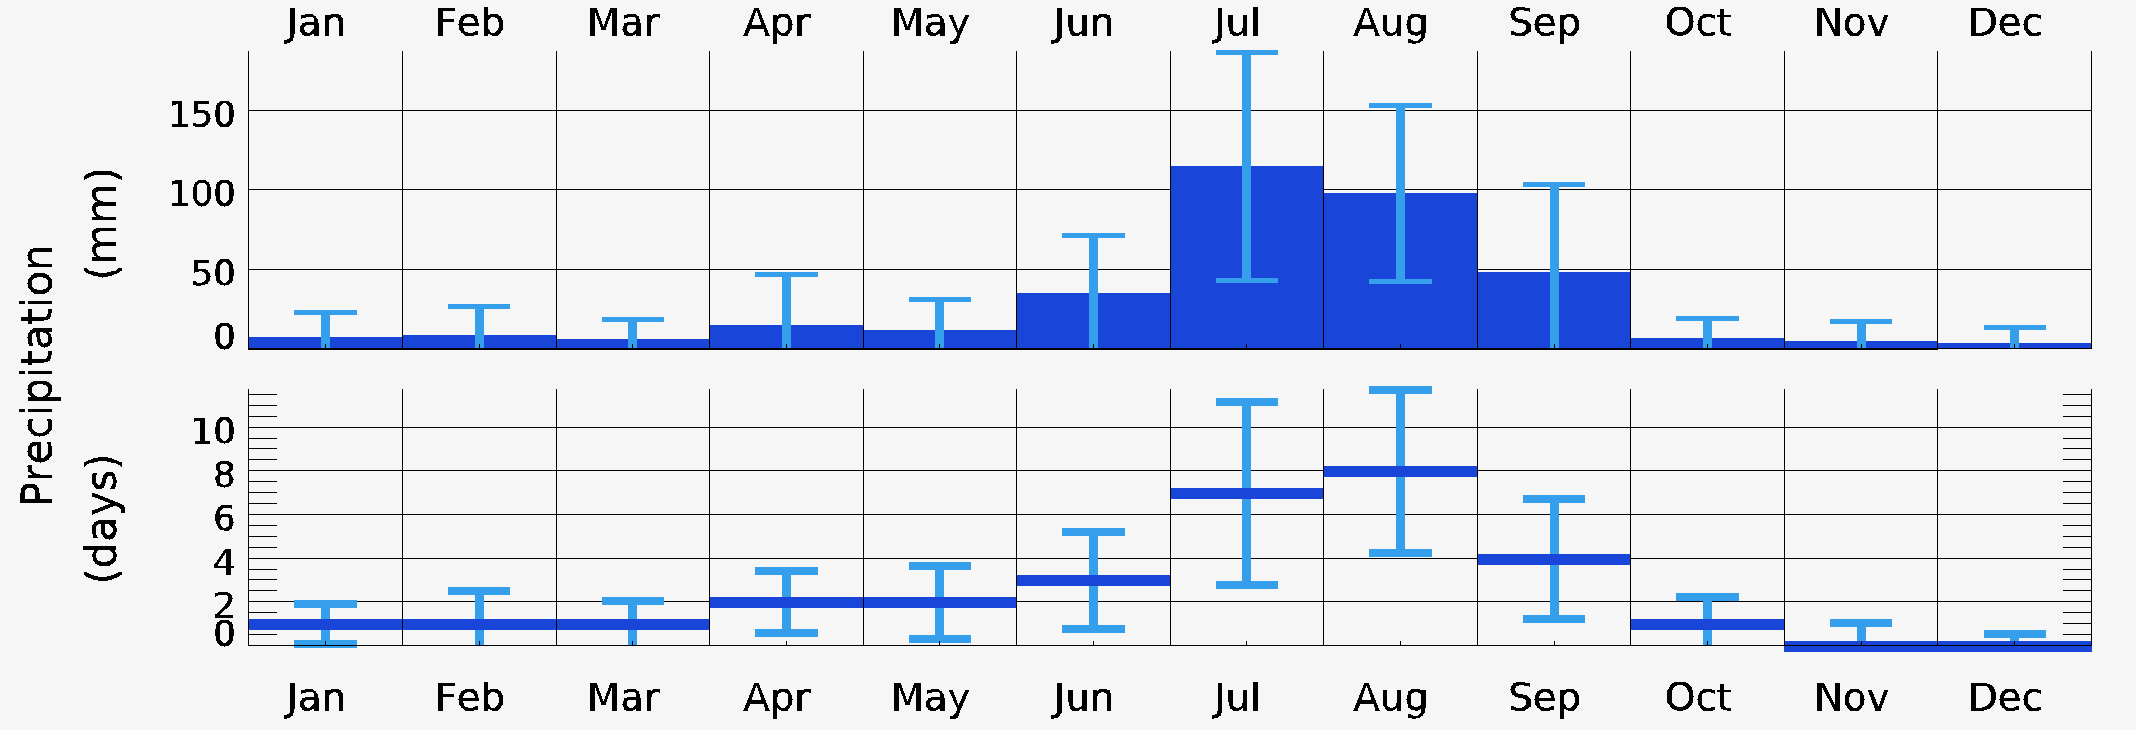
Traditional rainwater harvesting systems called Tanka555For more details see the wikipedia article Tanka , like the one shown in Fig. (5)), have played an important role for the communities living in Thar Desert of India (see for e.g. [6] and references there.) The rainfall pattern for Jodhpur which lies in Thar Desert is shown in Fig. (6). As is typical of a location in arid or semi-arid region, the rainfall is concentrated in two to three months in a year, further the rainfall is meager and erratic often leading to a drought like situation. We use SimTanka to explore two aspects of using RWHS in arid and semi-arid regions.
4.2.1 Estimating the effect of improving runoff coefficient
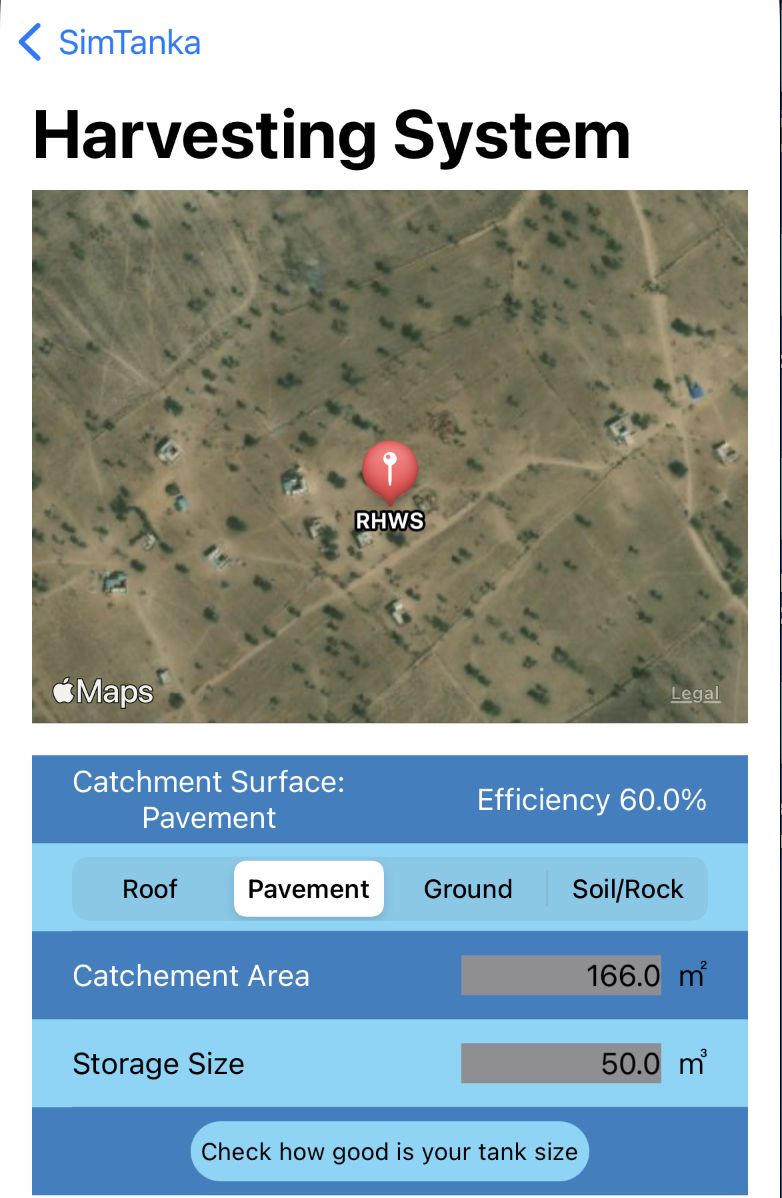
Tanka’s typically have a large catchment area, for the example we will consider the catchment area is , and their efficiency can be improved by treating the catchment area by making the surface more impervious and thus increasing the runoff coefficient. Such treatments are expensive, thus it is useful to estimate before hand the increase in the efficiency of the system and see if the extra investment is a worthwhile. We illustrate this for a RWHS located in a remote village of Bhaloo Rajwan (latitude: 26.56757, longitude: 72.46754) in Jodhpur district [6] .
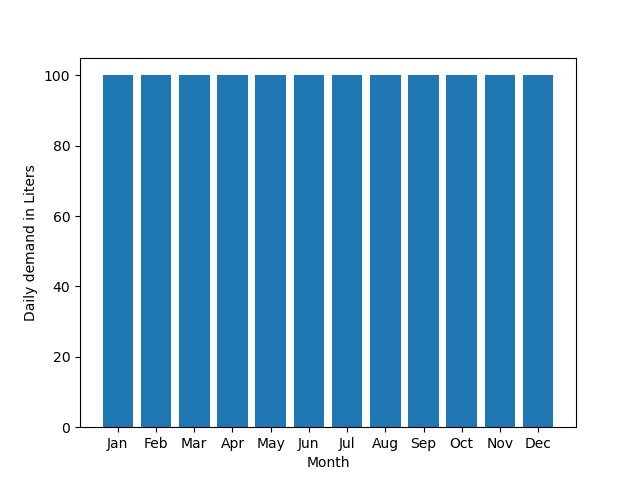
We consider a situation in which the user has a water budget of all through the year and exhibit the effect of improving the runoff coefficient from to in Fig. (7).
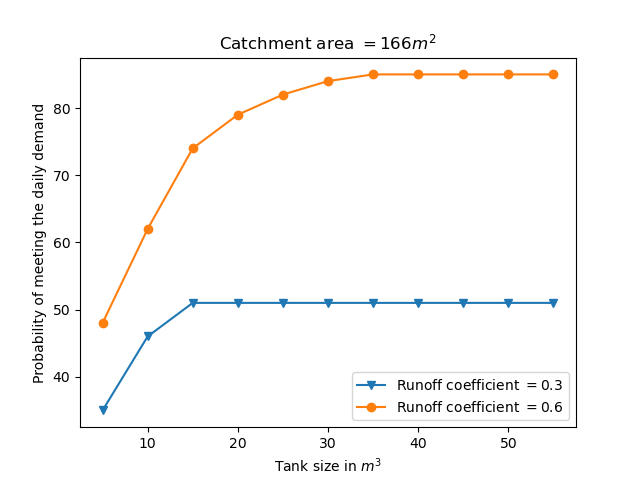
One can see a dramatic increasing the reliability of the system from to for the optimum tank size. Indicating that it might be worth while to make an investment in treating the catchment area. Simulations were done using daily rainfall records for the period of (2018-2022) [5]666For details of how Visual Crossing Weather supplements the observation weather data with data derived from remote sources, such as satellites and radar see their website. .
4.2.2 Devising strategies to meet water shortage
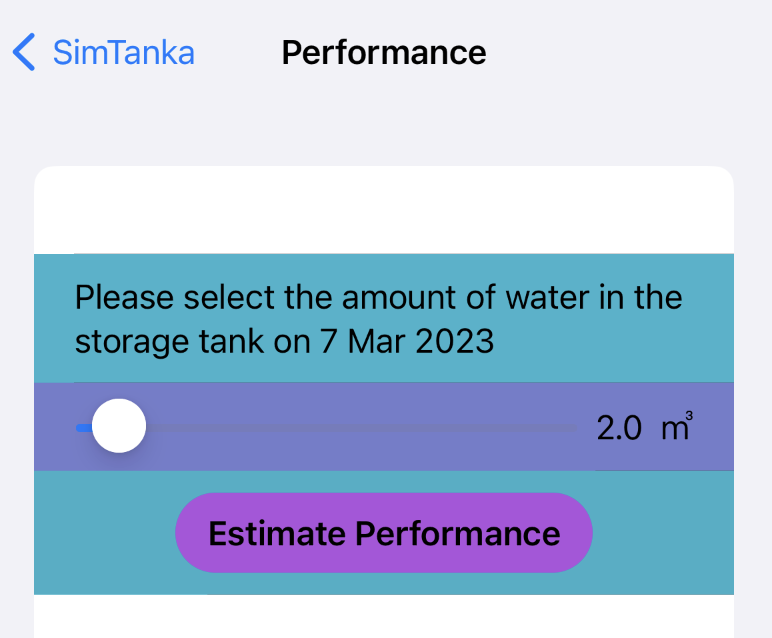
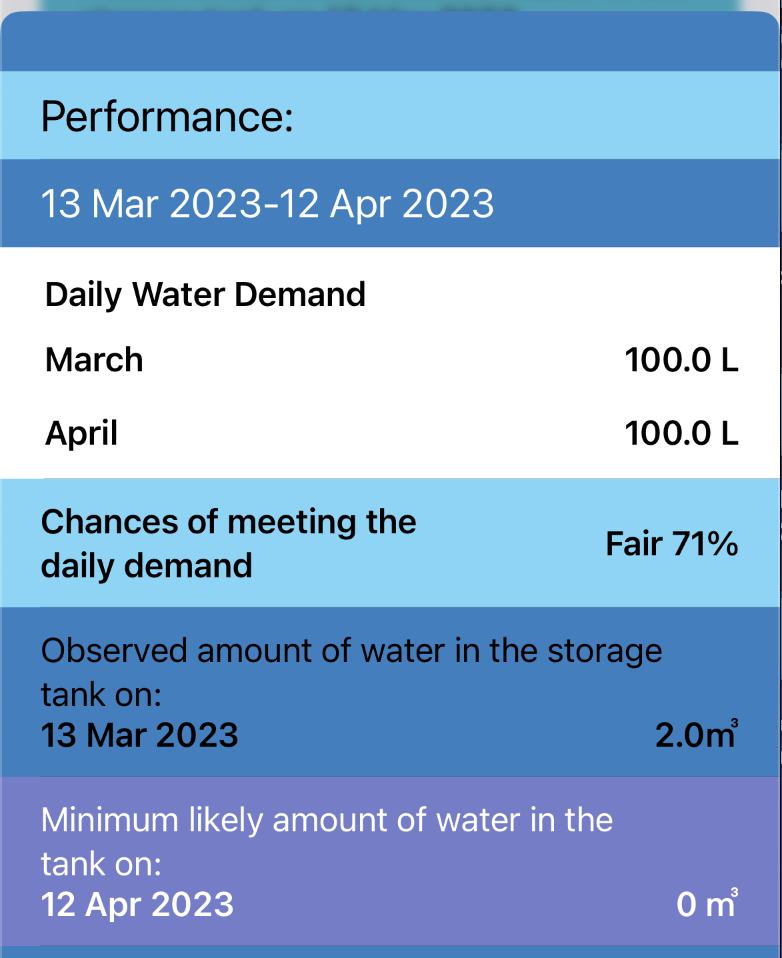
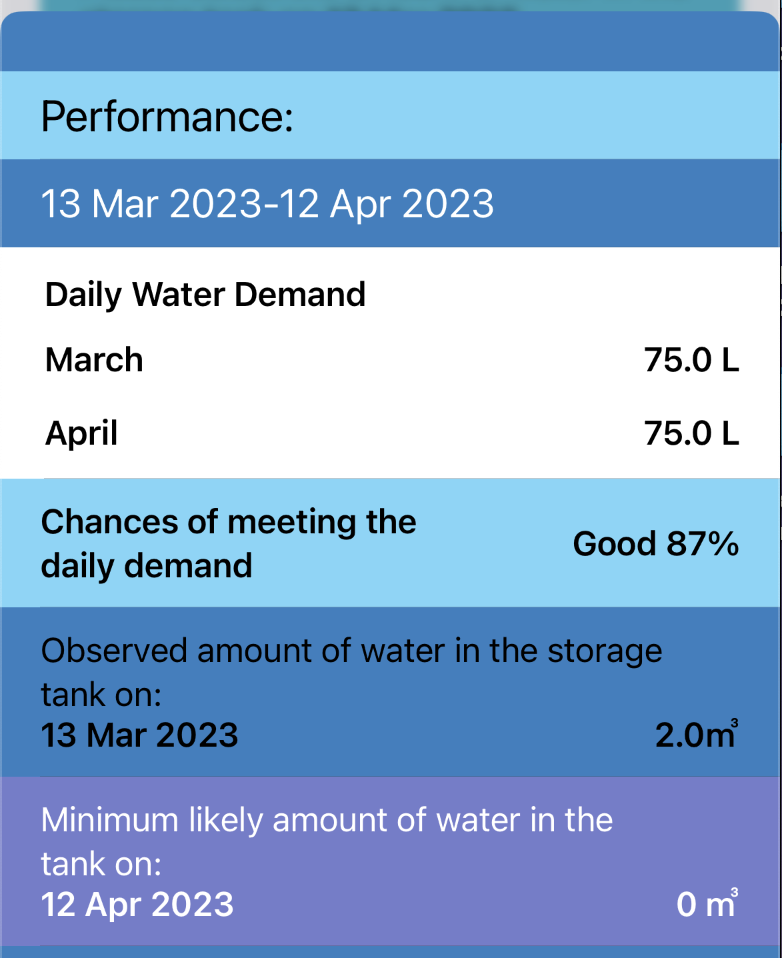
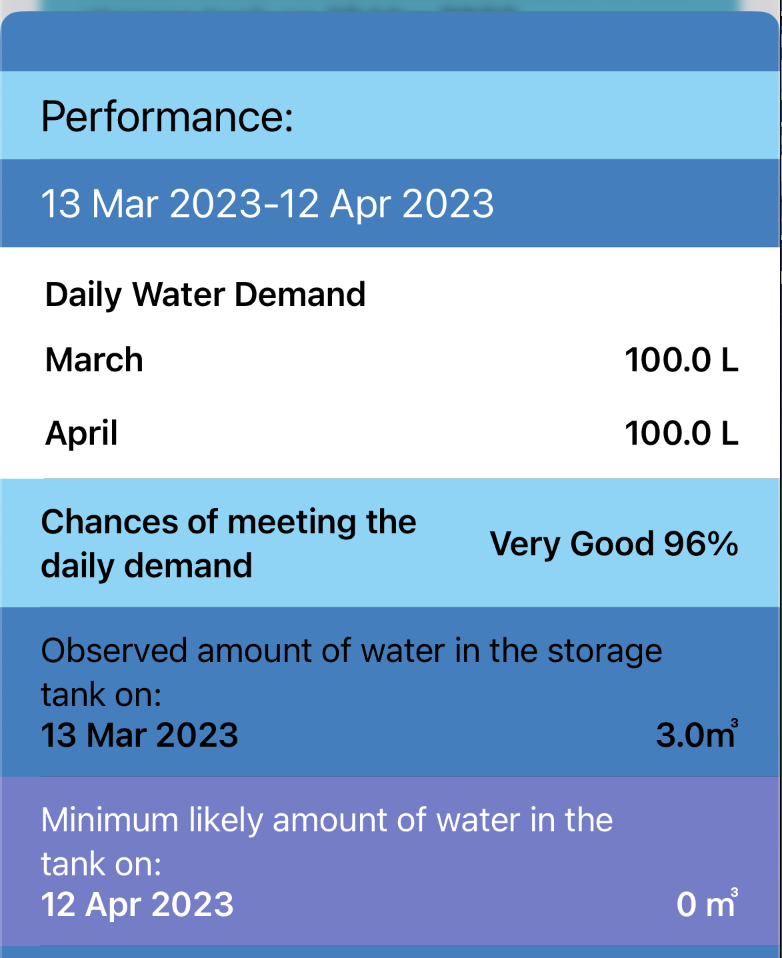
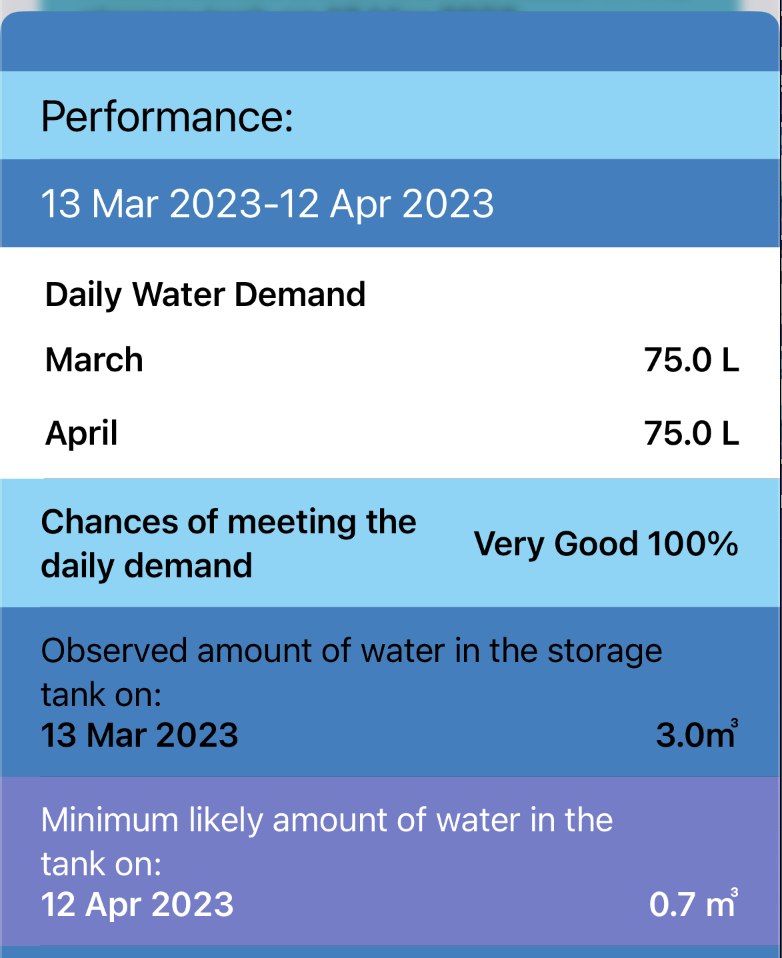
Often a user of RWHS will have to face water shortage, either because of more than planned use of water or because of draught like situation leading to inadequate harvesting of rainwater. In response to such a situation, the user can either try and reduce the daily water demand and or supplement harvested rainwater with water from other sources, including purchasing water from private suppliers. We can use SimTanka to estimate the efficacy of such strategies. We again consider a Tanka located in Thar Desert which is described in Fig. (8), and explore a hypothetical situation in which the user observes that the water in storage tank is , and then uses SimTanka to estimate if the system will be able to meet the water needs for the next thirty days. The result of this estimation are also shown in Fig. (8) and we see that there is a significant chance that the RWHS may not be able to meet the water needs of the user. In Fig. (9) we show the effect of various combinations of reducing water demand from to and of purchasing of water. Not surprisingly the greatest water security is obtained by purchasing of water and reducing the daily demand to .
5 Conclusion
RWHS are useful means of meeting the water needs in water scarce regions of the world. Their attractiveness is tempered by their potential unreliability as they depend on the vagaries of the daily rainfall. The aim of the model described here is to try and mitigate these uncertainties by using past daily rainfall records to estimate future reliability. The model has been implemented as an app SimTanka for smart phones. In the planning stage it can inform the user the extent to which the planned RWHS system will be able to meet the user’s water budget. Once the RWHS is build, or for existing RWHS, the app can be useful in developing strategies for meeting drought like situation. The app also allows the user to maintain monthly records that includes the amount of water in the storage tank at the beginning of the month and the potability of the water.
A natural question to ask is wether the probabilistic models described here can be replaced, or supplemented, by machine learning models. The present view of the experts seems to be less than sanguine on this possibility [7] but it is an attractive possibility particularly in conjunction with local automated rainfall measuring instruments and automated measurement of water in the storage tank. These two sets of information providing the necessary data for machine learning models.
Acknowledgments
I would like to thank Visual Crossing Weather for providing rainfall data for the SimTanka app. The development of SimTanka would not have been possible without the support and encouragement of Janaki Abraham and I am very grateful to her for that.
References
- [1] Wehner MF, Arnold JR, Knutson T, Kunkel KE, LeGrande AN. Droughts, floods, and wildfire. In: Wuebbles DJ, Fahey DW, Hibbard KA, Dokken DJ, Stewart BC, Maycock TK, editors. Climate Science Special Report: Fourth National Climate Assessment. Washington, DC, USA: U.S. Global Change Research Program; 2017. p. 1-9. Available from: https://science2017.globalchange.gov/chapter/8/.
- [2] Pendergrass AG, Knutti R, Lehner F, Deser C, Sanderson BM. Precipitation variability increases in a warmer climate. Scientific Reports. 2017;7(1):17966. Available from: https://doi.org/10.1038/s41598-017-17966-y.
- [3] Kishore P, Basha G, Venkat Ratnam M, AghaKouchak A, Sun Q, Velicogna I, et al. Anthropogenic influence on the changing risk of heat waves over India. Sci Rep. 2022 Feb;12(1):3337.
- [4] Vyas V. A Model for Simulating Rainwater Harvesting Systems with Closed Tanks. Ajit Foundation; 1995. Available from: https://www.ircwash.org/sites/default/files/213.2-95MO-14785.pdf.
- [5] Visual Crossing Corporation. Visual Crossing Weather (2017-2022);. Available from: https://www.visualcrossing.com/.
- [6] Konar M. Rainwater harvesting in rural India – taankas in the Thar Desert. Waterlines. 2007;25(4):22.
- [7] Hussein EA, Ghaziasgar M, Thron C, Vaccari M, Jafta Y. Rainfall Prediction Using Machine Learning Models: Literature Survey. Artificial Intelligence for Data Science in Theory and Practice. 2022:75-108. Available from: https://www.researchgate.net/publication/359750167_Rainfall_Prediction_Using_Machine_Learning_Models_Literature_Survey.