Detecting Out-Of-Distribution Earth Observation Images with Diffusion Models
Abstract
Earth Observation imagery can capture rare and unusual events, such as disasters and major landscape changes, whose visual appearance contrasts with the usual observations. Deep models trained on common remote sensing data will output drastically different features for these out-of-distribution samples, compared to those closer to their training dataset. Detecting them could therefore help anticipate changes in the observations, either geographical or environmental. In this work, we show that the reconstruction error of diffusion models can effectively serve as unsupervised out-of-distribution detectors for remote sensing images, using them as a plausibility score. Moreover, we introduce ODEED, a novel reconstruction-based scorer using the probability-flow ODE of diffusion models. We validate it experimentally on SpaceNet 8 with various scenarios, such as classical OOD detection with geographical shift and near-OOD setups: pre/post-flood and non-flooded/flooded image recognition. We show that our ODEED scorer significantly outperforms other diffusion-based and discriminative baselines on the more challenging near-OOD scenarios of flood image detection, where OOD images are close to the distribution tail. We aim to pave the way towards better use of generative models for anomaly detection in remote sensing.
1 Introduction

In recent years, deep learning has grown to be a staple of image understanding in computer vision, Earth Observation included. Deep neural networks have been for several years now the state of the art for many tasks, from biomass estimation to land cover segmentation [64]. Despite their impressive capacity for generalization, these models are still trained on finite datasets. For predictive models, it is critical to be able to detect when new observations fall outside of this training set, as model performance can drop sharply. This task called Out-Of-Distribution (OOD) detection [58], is a specific case of anomaly detection and represents a major challenge in improving the robustness of deep models.
Indeed, remote sensing imagery is facing a multitude of possible distribution shifts, from a change of acquisition sensor to a change of season to a change of geographical area. Being able to detect these OOD images is helpful to avoid considering degraded model predictions. In addition, disasters such as floods, forest fires, and storms are also unfrequent and catastrophic events, that are rarely observed in remote sensing datasets. While technically not always OOD, these events are “near” out-of-distribution observations as shown in Fig. 1, whose detection can be of great help for disaster management and surveillance. Identifying unusual observations can also help automate the curation of new datasets by eliminating outliers caused by cloud cover, sensor faults, or other artifacts.
Moreover, annotations are scarce in Earth Observation. The huge mass of available images remains largely unlabeled, due to the expert knowledge and time required to do so. For this reason, OOD detectors tailored to remote sensing data should be fully unsupervised, and be able to model the data distribution without labels. Generative models have been advanced as a way to model the distribution of the data and build likelihood estimators to detect OOD samples [60]. In particular, recent works in classical computer vision have established diffusion models as the new state-of-the-art to detect out-of-distribution images [17]. Diffusion models [51] are a family of unsupervised generative models that model the underlying distribution of training examples. They have outclassed previous models in image generation, such as Generative Adversarial Networks, due to their strong ability to model complex distributions without mode collapse. Promising new works have shown that diffusion models were applicable to Earth Observation imagery, e.g. for cloud removal [46] or image synthesis [29].
In this paper, we demonstrate the relevance of unconditional diffusion models for OOD detection in remote sensing. Several use cases are considered in our work: cloud detection, different geographical domains, pre- and post-disaster, and flooded/non-flooded images (cf. Fig. 1). We introduce a new ODEED specifically tailored to the latter use cases and show it outperforms all existing baselines.
2 Related Work
2.1 Diffusion models
Diffusion models are a powerful family of generative models that take inspiration from score-matching [22, 54, 50]. They were first derived in the discrete-time formulation as Markov chains [49, 20] before the introduction of continuous-time diffusion models building upon stochastic and ordinary differential equations [52, 25]. As generative models, it has been observed that denoising diffusion models produce high-quality samples both in unconditional [25, 52] and conditional image generation [26, 12, 45, 43] and outperform previous approaches, notably Generative Adversarial Networks (GANs) [12] as they do not exhibit mode collapse. Diffusion models proved their synthesis capabilities not only for images but also for video [7, 21], audio [32, 44, 31], text [3, 34], and protein design [59, 56]. In addition to the synthesis performances, diffusion models are now used for a variety of tasks, from image segmentation [1, 28] to inverse problems solving [27].
In remote sensing, the application of diffusion models to Earth Observation is relatively new. RSDiff [47] trains a cascade of a low-resolution diffusion model that feeds into a text-conditioned super-resolution diffusion model that synthesizes remote sensing images based on textual descriptions. SatDM [4] uses a conditional DDPM, conditioned on building footprints, to generate new labeled samples to train deep networks for building extractions. Espinosa and Crowley [13] extends this idea to a DDPM conditioned on semantic maps using ControlNet [61] to generate new synthetic aerial imagery of Scotland. While generating fake remote sensing imagery has limited practical applications, diffusion models have been adapted to solve classical EO tasks, such as change detection and cloud removal [46] and super-resolution [35, 19, 57]. In this work, we will leverage the modeling ability of diffusion models not to generate new data, but to estimate the plausibility of EO images and identify unusual observations, i.e. find images that are out of the distribution of “usual” acquisitions.
2.2 Out-of-distribution detection
Out-of-distribution (OOD) detection is a special case of anomaly detection. Early works focused on detecting OOD samples that fell outside the training dataset of machine learning models, to prevent failure in the predictions. The first approaches required a dataset of “unusual” samples in order to train OOD detectors in a supervised manner [33, 39]. These approaches restrict the definition of the OOD samples since we are not considering all possible OOD outside the distribution of interest [8, 55]. Recent approaches are post-hoc, i.e. they rely on features extracted from pre-trained models. In this way, we avoid retraining neural networks for the specific task of OOD detection and benefit from existing pretrained features. In general, the goal is to assign a score to an observation. If it is greater than a threshold, then the image is considered in-distribution, and OOD otherwise.
Numerous OOD scorers assume that there is a discriminative model, e.g. a classifier or a segmenter, that has been trained on some dataset. Post-hoc scorers try to discriminate between out-of-distribution and in-distribution samples based only on the predictions of a classifier or segmentation model. They assess the model certainty on its prediction and samples whose predictions have high uncertainty scores are considered OOD [36, 38]. However, there has recently been a surge in fully unsupervised OOD scorers, i.e. scorers that do not depend on a discriminative model. These scorers can therefore be used even on unlabeled datasets. For example, some post-hoc scorers have been introduced to work on the features learnt by self-supervised models [48, 40].
Similarly, reconstruction-based OOD scorers rely on generative models to reproduce an image given a corrupted version of it. The corruption can be e.g. downsampling for Autoencoders (AE) and Variational Autoencoders (VAE) [11, 63, 65] or noise for diffusion models [18, 15, 37]. In principle, the generative model has learned the training distribution and should have lower reconstruction errors on in-distribution samples (ID) than on OOD samples. The reconstruction error can be evaluated with different similarity metrics depending on the nature of the samples. For images, common metrics are the Mean-Squared Error (MSE) and the Learned Perceptual Image Patch Similarity (LPIPS), the latter being more aligned with human perception [62]. As diffusion models proved robust reconstruction faculty, several OOD scorers employ them in the context of images denoising [18, 15] or inpainting [37]. In addition, as diffusion models have a variational interpretation [30], Goodier and Campbell [17] proposed an OOD scorer based on diffusion models’ ELBO, linking the reconstruction error to the statistical likelihood.
In remote sensing, OOD detection has been a somewhat niche topic. To the best of our knowledge, the only works on detecting OOD remote sensing images are those from Gawlikowski et al. [16] and Coca et al. [10]. Gawlikowski et al. [16] introduced an OOD scorer based on a Dirichlet Prior Network linked to a classification model trained on remote sensing images to detect a shift in the classes, in sensor characteristics, or in geographical areas that would reduce classification accuracy. Coca et al. [10] later adapted this work to a self-supervised model to detect satellite images containing burned areas. As these images were rare in the training dataset, they were able to characterize them as OOD. We will show that this approach is a promising avenue to detect unusual events in remote sensing imagery.
3 Methods
In this work, we investigate diffusion models for OOD detection and focus on three diffusion-based scorers:
-
•
Diffusion loss scorer based on the time-truncated diffusion losses which average reconstruction errors;
-
•
One-step denoising scorer focusing on the denoising performances at fixed timestep;
-
•
ODEED (ODE Encoding Decoding) scorer, a new OOD scorer leveraging PF-ODE trajectory accuracy as a way to discriminate between in and out-of-distribution samples.
3.1 Background on Diffusion Models
Continuous-time diffusion models generalize discrete-time diffusion models to the infinite timesteps case. They do not rely on Markov chains but on Stochastic Differential Equations (SDEs) instead, both for the diffusion and the denoising processes. Let us consider a diffusion process , with fixed boundary conditions and , and denote the marginal density at time . This diffusion process is a solution to the following SDE:
| (1) |
where is the drift, is the diffusion coefficient and is the standard Wiener process (i.e. Brownian motion). This diffusion process corrupts the original image into a Gaussian noise . We know from [2] that the forward SDE in Eq. 1 admits a reverse SDE mapping to :
| (2) |
Moreover, these diffusion processes share the property of admitting a deterministic process preserving the same marginal distributions for all . It is described by the Probability Flow Ordinary Differential Equation (PF-ODE):
| (3) |
Then, the ODE allows encoding samples from the data distribution into the prior distribution by integrating Eq. 3 from to and vice-versa.
Both the backward SDE Eq. 2 and the PF-ODE Eq. 3 equations include the score function that has no known close form in practical cases. In this paper, we are embracing the diffusion framework proposed by [25], in which the score function derives from a perfect denoiser :
| (4) |
We approximate this denoiser with a neural network optimized to reduce the reconstruction loss at every time :
| (5) |
3.2 Detecting OOD with diffusion models
In addition to the generation abilities of continuous-time diffusion models, they can be used in the context of out-of-distribution detection. We leverage three scorers using diffusion models, based on their reconstruction performances.
First, we want to evaluate the effectiveness of the loss function as an OOD scorer. The intuition behind this is that diffusion models should generalize to in-distribution samples unseen during train but fail on OOD samples, resulting in a greater loss. Since in our case, both in and out-of-distribution are satellite images, we argue that the differences in reconstruction can be observed at small times. Indeed, diffusion models generate images by first placing the overall structure (large times) and then fill-in the details (small times) [6, 42]. Thus, we compute the reconstruction error Eq. 5 for several times below a given threshold . In other words, for a given image, we sample noise corrupted versions of it with increasing times , then we estimate the reconstructions with the learned diffusion model and compute the weighted average loss:
| (6) |
where and . We experiment with two different weighting functions : the training weighting function [25] and a linear weighting as in [17].
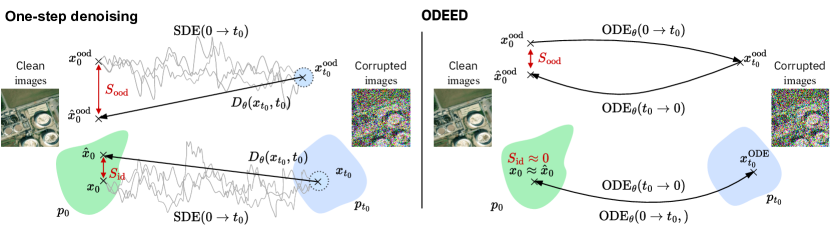
Second, as the learned diffusion model is a denoiser conditioned on time, we leverage its reconstruction performances in one-step denoising, as shown in Fig. 2 (left). For several values to , we investigate the ability of the model to reconstruct an initial image from a noised version . To do so, we sample several noises and average a reconstruction error across the samples, considering a single denoising step:
| (7) |
where is a similarity measure, e.g. MSE or LPIPS. In practice, we observe that the denoiser reconstructs well from noised versions of for small values of .
3.3 ODEED scorer for OOD detection
Due to the stochastic nature of the diffusion process using the forward SDE Eq. 1, proceeding to several integrations of the forward SDE from an initial image to time produces multiple . It is also true that reversing the diffusion process from a latent with the backward SDE Eq. 2 generates several denoised images. This means that stochastic samplers lead to various reconstructions that can be more or less distant from the initial image, depending on the level of stochasticity used, introducing estimation errors in the reconstruction scores.
In contrast, integrating the PF-ODE Eq. 3 from to encodes the initial image into a unique noisy latent . Conversely, integrating it from to allows us to get back to the exact initial image. In other words, the trajectory is fully deterministic. This property is fundamental in the context of reconstruction-based scorers, as diffusion models can propose exact reconstructions of the initial images.
Based on this observation, we introduce ODEED a novel reconstruction-based OOD scorer based on the PF-ODE trajectories (Fig. 2 right). To do so, we approximate the true score function in Eq. 3 with the diffusion model following Eq. 4. Let denote the operation of integrating the -approximated ODE from to with a numerical solver. Our scorer operates in two phases:
-
1.
Encoding: we encode the clean image into a unique noisy latent by integrating the ODE from the starting time to the intermediate time .
(8) -
2.
Decoding: we solve the ODE with decreasing times from to , i.e. denoising the latent to a clean image that is the reconstruction of the original sample.
(9)
Then, we define the OOD scorer from the similarity between the reconstructed and the original images.
| (10) |
Once again, this difference measures how well the diffusion model can reconstruct the clean observation . Compared to previous scorers, it is entirely deterministic and therefore should better represent whether belongs to the modeled distribution, without being influenced by the stochastic trajectories.
4 Experiments
4.1 Toy Problem: Cloud Cover Detection
To test the relevance of our approaches, we experiment with the simple task of discriminating between cloud-free images and cloudy images. Cloud detection can be achieved with well-designed features and deep learning techniques. Nevertheless, it is an easy use case on which we want to test the reconstruction-based approaches with diffusion models.
Experimental setup
For this task, we employ the pre-trained discrete-time diffusion model from [46], trained on 8000 pixels RGB cloud-free images from the Sentinel-2 Cloud Mask Catalogue dataset [14]. Cloud-free images are in-distribution samples and images with cloud coverage above 10% are OOD. Since the model was only trained on cloud-free images, we expect it to fail to reconstruct images with clouds. As the model is discrete time, we first consider only the one-step denoising scorers. We also use the mean pixel intensity as a naive scorer baseline.
| Method | AUC ↑ | FPR95% ↓ | ↑ |
|---|---|---|---|
| Image mean | 88.3 | 41.6 | 58.4 |
| Diffusion MSE | 85.1 | 29.1 | 49.4 |
| Diffusion LPIPS | 84.3 | 29.2 | 37.6 |
4.2 SpaceNet 8
We then extend our experiments to more challenging applications by considering the SpaceNet 8 dataset [23].
Dataset
SpaceNet 8 is a dataset of paired pre- and post-flooding images from East Louisiana and Germany. It is composed of 3-band RGB images from Maxar satellites. It includes segmentation masks for both the roads and the buildings while distinguishing between flooded and non-flooded objects. We downsample the original images by a factor of 2 to produce patches and apply overlap on the training set. We obtain 5864 pre and post-event pairs for the Germany subset and 17660 pairs for Louisiana.
Experimental setup
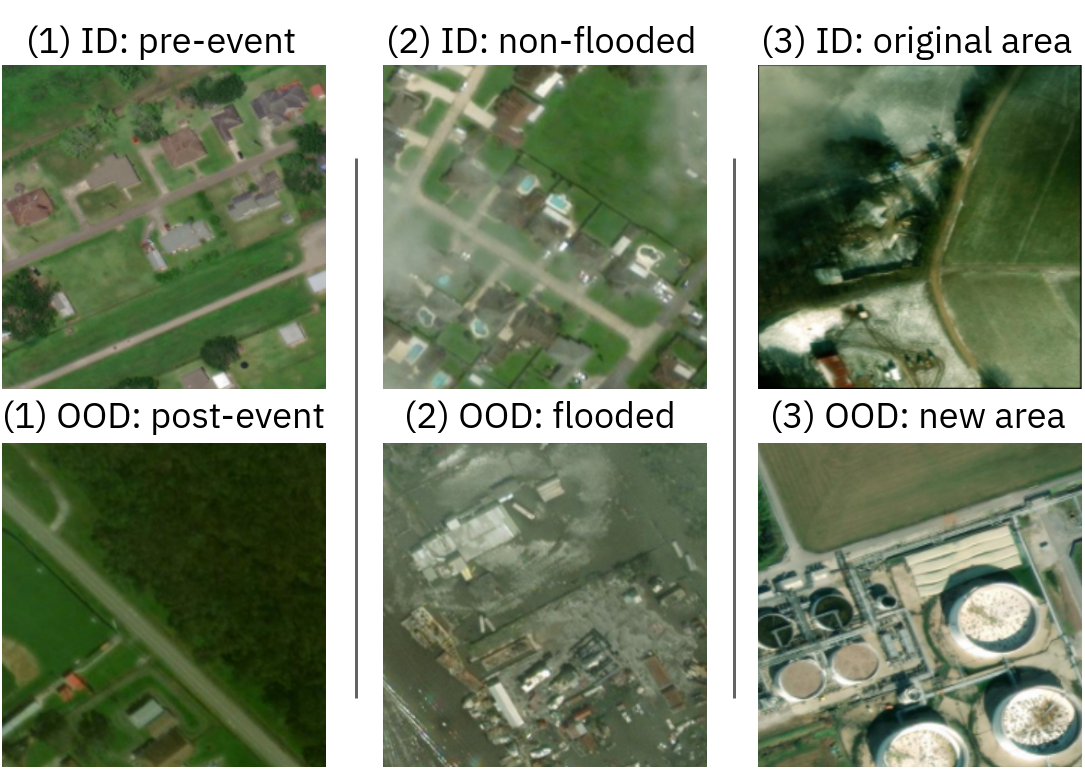
Using the images and annotations, we derive three different scenarios of OOD detection on SpaceNet 8, each using a different definition of OOD. This allows us to test the abilities of different OOD scorers to detect various types of “out-of-distribution”, shown in Fig. 3:
-
1.
Pre-flood vs Post-flood images: in this scenario, the OOD detector aims at discriminating between images prior to the flood (in-distribution samples) and images after the flood (out-of-distribution) within the same geographical domain (Germany or East-Louisiana).
-
2.
Flooded vs non-flooded areas images: in this scenario, the OOD detector should discriminate between images with no flood (in-distribution) and images with a visible flood (out-of-distribution). In-distribution images include post-event images that do not have a visible flood. The labeling is done based on the segmentation masks: an image is considered OOD if it contains pixels belonging to the “flooded building” or “flooded road” class in the ground truth.111Note that this proxy is perfectible and has some failure cases (i.e. flooded areas with no roads or buildings are considered “non-flooded”), which might inflate the number of false positives. FPR results for this setup should therefore be interpreted as a higher bound.
-
3.
Domain OOD: in this case, we want to detect a geographical shift, i.e. discriminating images taken in East Louisiana from images taken over Germany. We consider only pre-event images in this setting.
We want to highlight that in all scenarios, the diffusion models are trained on pre-event images only and without any annotations, nor post-event images.
| Pre-flood/Post-flood | Non-flooded/flooded | Domain OOD | |||||
| Method | Germany | Louisiana | Germany | Louisiana | Germany | Louisiana | |
|
Discriminative
Segmentation |
MPC | 52.6/98.9 | 41.1/98.4 | 67.4/80.0 | 61.0/94.3 | 69.8/93.4 | 47.7/95.5 |
| Neg-Entropy | 59.6/97.7 | 42.8/95.9 | 64.3/80/0 | 60.7/97.1 | 76.3/92.2 | 48.8/94.3 | |
| DeepKNN (k=5) | 51.9/80.7 | 76.4/38.9 | 70.1/86.7 | 54.3/100 | 93.6/28.7 | 80.9/38.6 | |
| Energy Logits | 67.9/88.6 | 67.9/88.6 | 56.4/80.0 | 60.9/97.1 | 84.7/70.9 | 50.4/92.0 | |
|
Generative
Diffusion Loss |
Training | 50.4/84.1 | 52.3/88.5 | 59.7/100 | 71.0/71.4 | 67.0/86.0 | 55.9/98.8 |
| Linear | 49.2/85.2 | 53.2/88.5 | 70.0/100 | 75.7/71.4 | 60.4/83.1 | 57.0/98.0 | |
| Reconstruction based | |||||||
| Autoencoder | MSE | 28.4/96.6 | 26.3/95.1 | 57.9/100 | 68.5/85.7 | 84.9/79.9 | 28.3/96.6 |
| LPIPS | 21.1/97.7 | 27.5/96.3 | 55.6/100 | 69.5/77.1 | 75.2/54.9 | 41.4/100 | |
| Mahalanobis | 48.9/95.1 | 30.8/97.1 | 51.4/94.9 | 72.5/90.6 | 49.6/95.0 | 52.0/94.8 | |
| 1-step denoising | MSE | 28.8/81.8 | 42,2/73.3 | 68.5/100 | 73.4/77.1 | 86.3/20.9 | 33.5/97.7 |
| LPIPS | 74.5/59.1 | 90.9/35.7 | 60.5/100 | 76.8/65.7 | 79.6/52.5 | 82.1/85.2 | |
| ODEED (Ours) | MSE | 65.6/76.1 | 69.0/80.3 | 83.6/33.3 | 86.9/42.9 | 41.2/97.1 | 60.9/95.4 |
| LPIPS | 87.9/20.5 | 94.5/24.6 | 75.3/73.3 | 64.1/85.7 | 54.3/97.5 | 68.3/70.4 | |
Baselines. We compare the diffusion models and ODEED with several well-established OOD detection techniques.
As a reconstruction-based baseline, we train an autoencoder on pre-event images for each geographical domain. We use either the MSE or the LPIPS distance on the reconstruction in image space as a score. We also consider the Mahalanobis distance in the latent space Eq. 11 and estimate the covariance matrix and the mean on the train set [11, 5]. The final score is then a linear combination of the latent space and image space distances:
| (11) | ||||
| (12) |
For exhaustiveness, we also compare our models to OOD scorers-based discriminative models, even though these models require to be trained on an annotated dataset in the first place. We train a segmentation model on SpaceNet 8 for each pre-event domain to predict the classes “background”, “roads” and “buildings”. We then extract OOD scores from this model using standard approaches from the literature:
- •
-
•
Negative Entropy: if the model is unconfident about its prediction then the probability mass will be spread across all classes, resulting in a high entropy:
(14) -
•
Energy-Logits (EL) [36] computes the free-energy on the logits distribution. We denote the sub-network of predicting the logits.
(15) -
•
DeepKNN [53], which applies a k-nearest neighbors algorithm to the features extracted from the last layer.
Diffusion models
Our diffusion models are trained based on Karras et al. [25], using the unconditional U-Net backbone from [52] with [64, 128, 128, 256, 256] channels in the downsampling blocks and the reverse for the upsampling blocks. Time information is sinusoidally embedded on 64 channels and then fed to a linear layer and SiLU activation. Models are trained for 40000 steps with a batch size of 80 (approximately 48 hours), a learning rate of , and AdamW optimizer. To improve training stability, we use gradient clipping and exponential moving average. We sample using the second-order Heun solver [25] with discretization steps except in the case of small noise levels (), where we integrate with 5 steps, as too many sampling steps hinder sampling quality. hyperparameter is tuned on a held-out validation set.
Autoencoders
For a fair comparison, we derive the AE architecture from the U-Net backbone of the diffusion model by removing the time embedders and skip connections. We train the autoencoders for 20000 steps with a batch size of 80, a learning rate of , and AdamW optimizer. We set for the latent space dimension as it achieved the best reconstruction results on the validation set. Coefficients and of the Mahalanobis distance Eq. 11 are tuned on the validation set to match the reciprocal of the standard deviation of their respective distance [11].
Segmentation models
We train DeepLabV3 segmentation models [9] for a maximum of 1400 steps with a batch size of 32 and use early stopping. We set the learning rate to and optimize the model’s parameters with AdamW.
5 Results
We evaluate our OOD detectors using two standard binary classification metrics, by varying the detection threshold: AUC (Area Under Curve) and FPR95% (False Positive Rate at Recall 0.95). For the latter, note that ID samples are considered as positives and OOD samples are negatives, i.e. FPR95% denote how many OOD samples are wrongly considered as in-distribution for a 95% recall of the ID samples.
5.1 Preliminary results: cloud cover
We report in Tab. 1 OOD detection results on the cloud cover dataset. We observe that the diffusion model’s reconstruction error is indeed higher on cloudy images, as shown by a high AUC using the diffusion + MSE score. This was expected as the model is trained only on cloud-free images. Diffusion-based methods produce competitive results in terms of AUC with respect to the naive baseline and achieve the best results in terms of FPR95% with a gain of 12.5 points for the diffusion MSE score against the naive baseline.
To evaluate the calibration of the scores, we perform a linear regression of the OOD score with the cloud coverage percentage. The naive baseline (mean pixel intensity) achieves the highest coefficient (more clouds implies more bright pixels). However, diffusion model scorers also correlate well with the cloud coverage, indicating that more cloudy images tend to be classified as “more OOD”. These first results show that diffusion-based scorers discriminate between in and out-of-distribution samples on the simple task of cloudy image detection. This suggests their effectiveness for use cases where no naive baselines exist.
5.2 Main results
| Pre-flood/Post-flood | Non-flooded/flooded | ||||||||
|---|---|---|---|---|---|---|---|---|---|
| Domain | Germany | Louisiana | Germany | Louisiana | |||||
| Model | G | L | L | G | G | L | L | G | |
|
1-step
denoising |
MSE | 28.8/81.8 | 26.2/100 | 42,2/73.3 | 23.2/98.0 | 68.5/100 | 65.6/100 | 73.4/77.1 | 71.9/74.3 |
| LPIPS | 74.5/59.1 | 76.8/51.1 | 90.9/35.7 | 87.5/31.6 | 60.5/100 | 64.5/100 | 76.8/65.7 | 77.4/71.4 | |
| ODEED | MSE | 65.6/76.1 | 61.0/70.5 | 69.0/80.3 | 80.8/30.7 | 83.6/33.3 | 70.0/60.0 | 86.9/42.9 | 76.0/51.4 |
| LPIPS | 87.9/20.5 | 84.0/18.2 | 94.5/24.6 | 94.6/06.1 | 75.3/73.3 | 45.8/80.0 | 64.1/85.7 | 60.8/60.0 | |
We report in Tab. 2 the OOD scorer’s performances on the Germany and Louisiana subsets of SpaceNet 8. In the near-OOD setting (pre-flood/post-flood and non-flooded/flooded), AE exhibits poor OOD detection abilities, with AUC well under the 0.5 random baseline. Discriminative OOD detectors fare better but still misclassify a lot of OOD images as in-distribution, as shown by the high FPR95. In contrast, the best AUC and FPR95% results are achieved with our ODEED method for the pre/post-event and the non-flooded/flooded scenarios. On the pre/post-event OOD setup, the combination of ODEED + LPIPS outperforms the best baseline by a margin of 13.4 points on the Germany dataset and 3.6 pts on the Louisiana dataset in terms of AUC. We notice a gain of -38.6pts of FPR95% on the pre/post-event Germany experiment when using the ODEED + LPIPS and a gain of -11.1 for the same setup on the Louisiana dataset. Interestingly, while best results are obtained with the pair ODEED + LPIPS for the pre/post-event setup on both areas, the MSE brings the ODE-encoding to top performances on the non-flooded/flooded scenarios with 83.6 AUC and 33.3 FPR95% on Germany and 86.9 AUC and 42.9 FPR95% on Louisiana. We hypothesize that this difference is linked to the difference between ID and OOD samples in the two scenarios: in the first scenario the satellite images have different global aspects, whereas floods are locally spatialized elements of the same global context.
For all setups, reconstruction-based methods based on diffusion models outperform the autoencoder-based ones.
The largest performance gap reaches 39.0 (87.9 vs. 48.9) and 63.7 pts (94.5 vs. 30.8) in AUC on the pre/post-flood scenario for respectively Germany and Louisiana. The narrowest gap is set on the Germany/Louisiana domain OOD case where autoencoder-based methods are on par with diffusion models (respectively 85.6 and 86.3 in top AUC).
Yet, the ODEED scorer performs poorly on the domain change detection. We suspect that the model generalizes enough to reconstruct images from other domains for small noise levels. This idea is reinforced by the decent performances of the one-step denoisers in this scenario: best AUC (82.1) with LPIPS on the Louisiana dataset and second best on the Germany dataset (86.3) with MSE, while achieving the best FPR95% (20.9). DeepKNN yields top results in domain OOD on the Germany dataset and second best on the Louisiana domain. This could indicate that segmentation models learn features that are more domain-specific than the reconstruction models, and therefore generalize worse when switching geographical areas. Finally, Tab. 2 shows that diffusion model losses, independently of the weighting function used, are poor likelihood estimators in our settings. The various dynamics of the reconstruction errors may explain the poor OOD detection performance of diffusion losses which average the latter over a large time range.
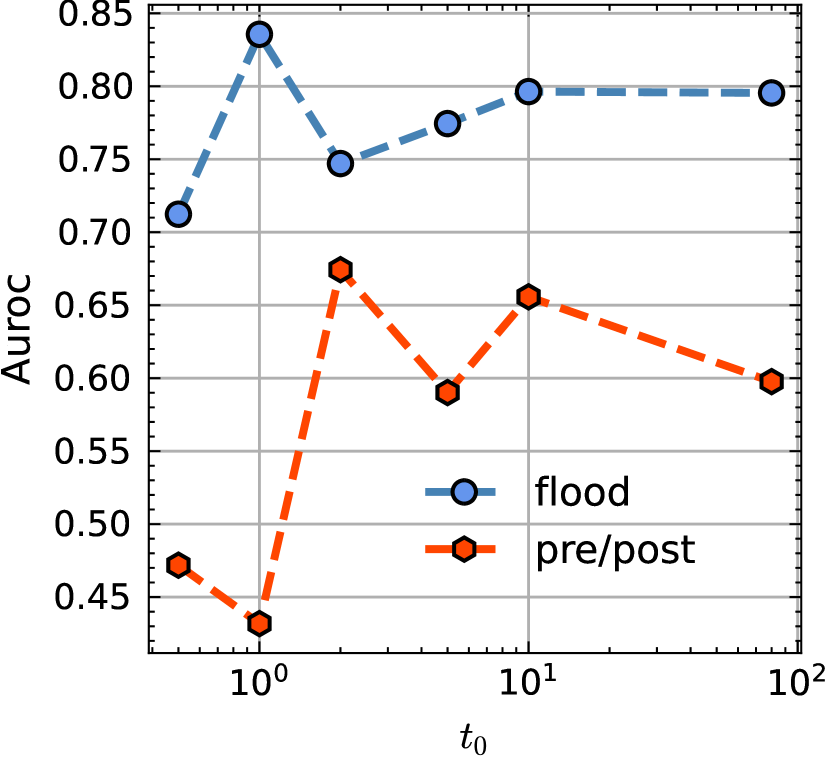
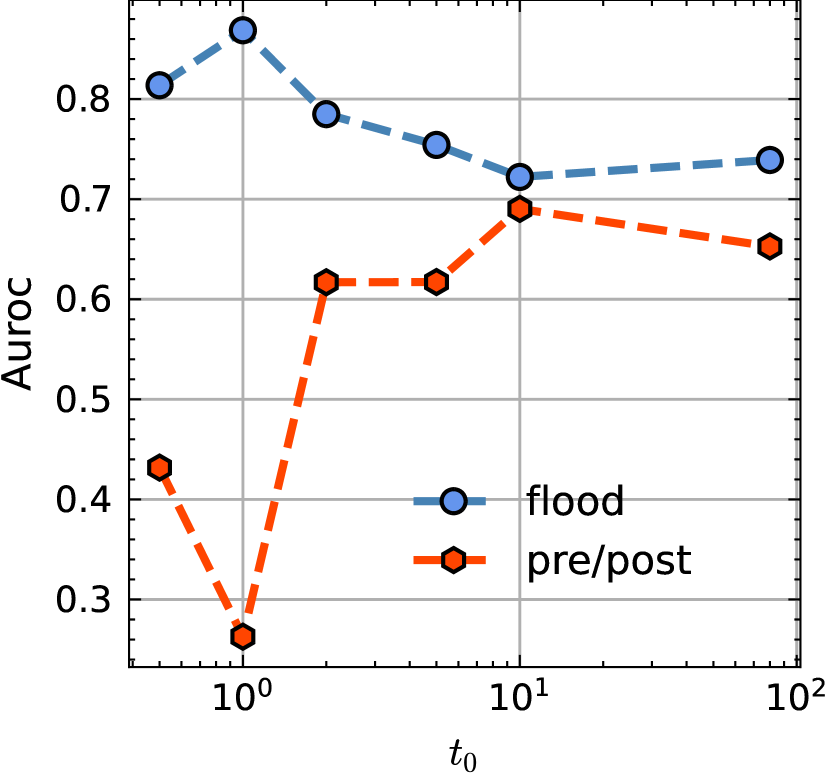
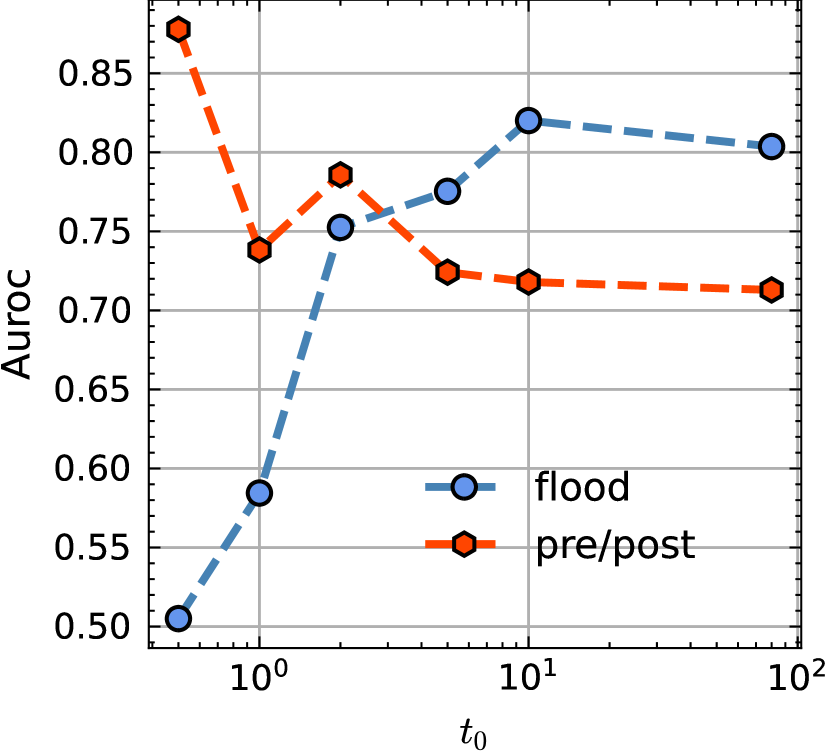
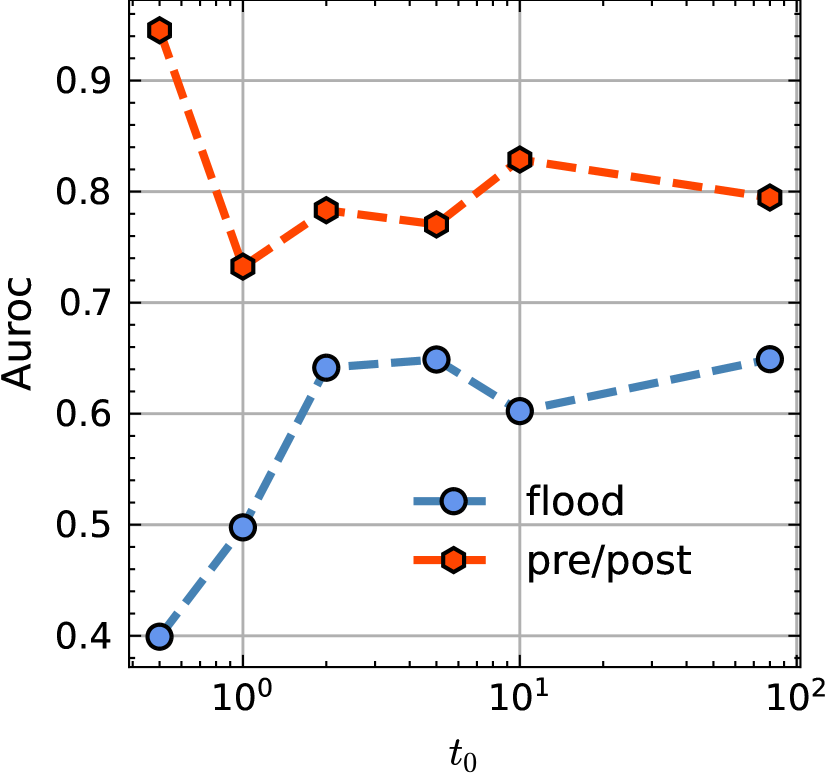
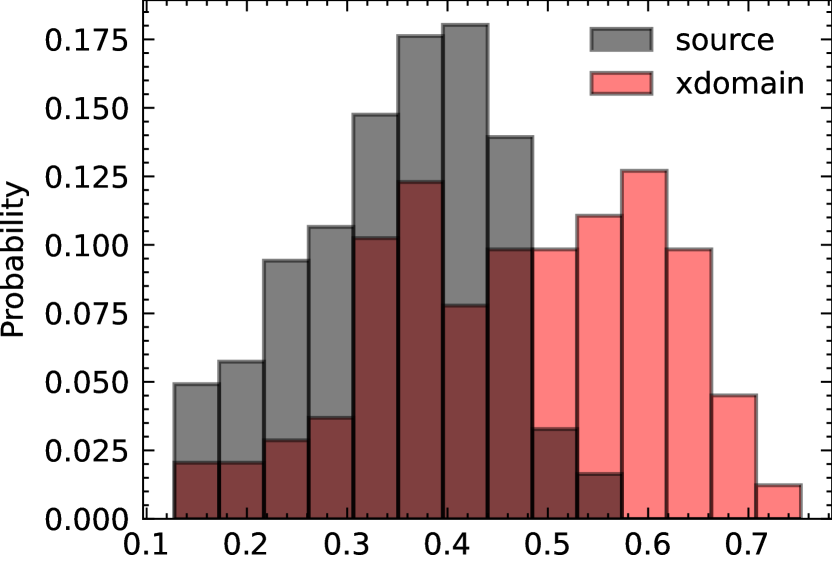
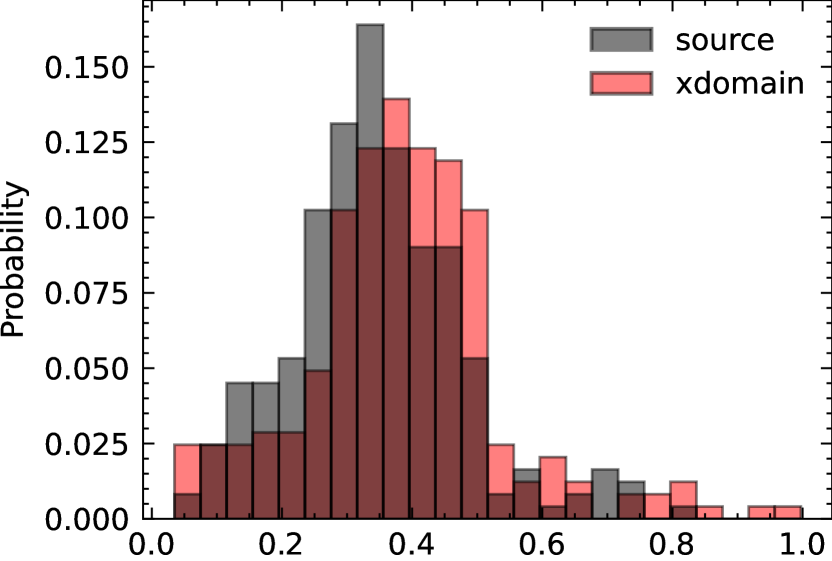
Effect of on OOD detection
We now evaluate the impact of the corruption time used in the ODEED method, as it can be tuned on a validation set. We observed experimentally that its effect on the OOD detection performances depends on the task and on the similarity measure considered. For example, Fig. 4 highlights that using the MSE as the score results in higher AUC scores for small in the flood OOD scenario, while it reaches the highest performance for medium intermediate times for the pre/post OOD setup. This might indicate that smaller should be preferred for more localised anomalies. On the contrary, Fig. 5 shows that the LPIPS ability to discriminate between the pre and post-event images is higher for early whereas giving the best results on non-flooded/flooded images for intermediate noise levels. We attribute this to the perceptual effect of LPIPS, where localised changes result in small LPIPS variations, and therefore need a higher to isolate flood events.
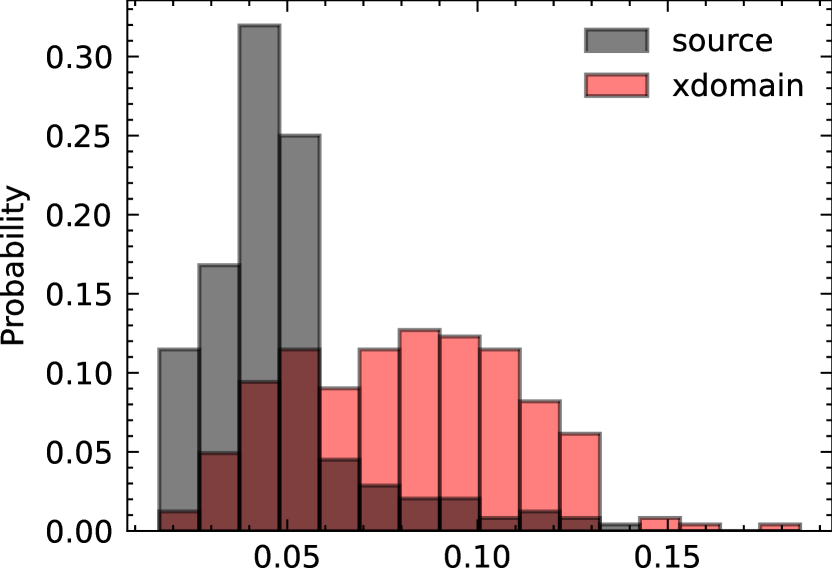
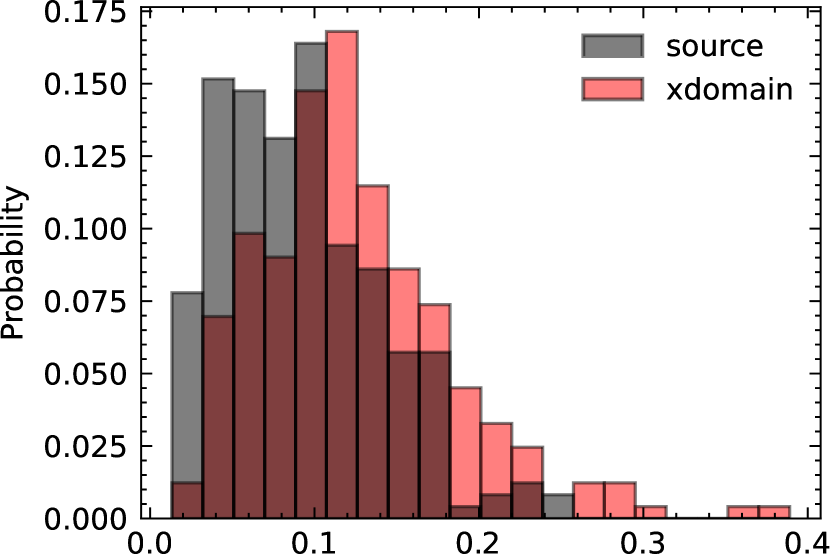
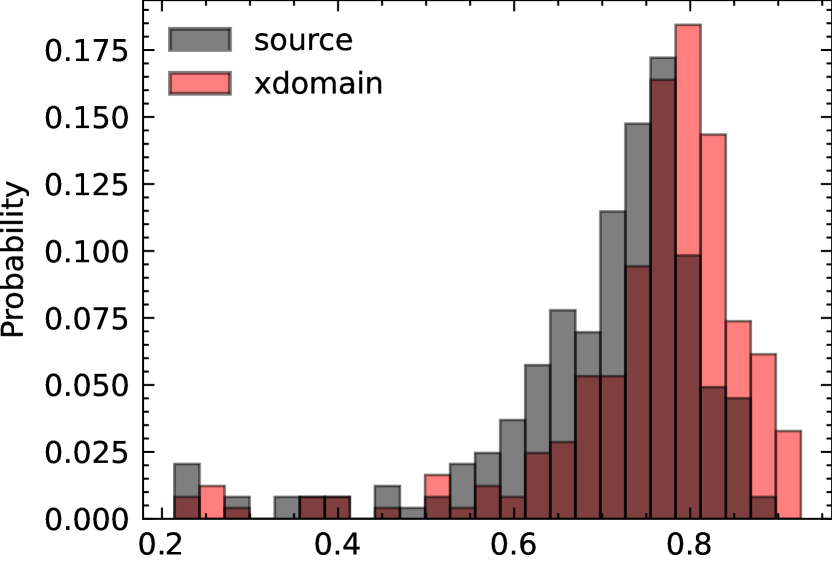
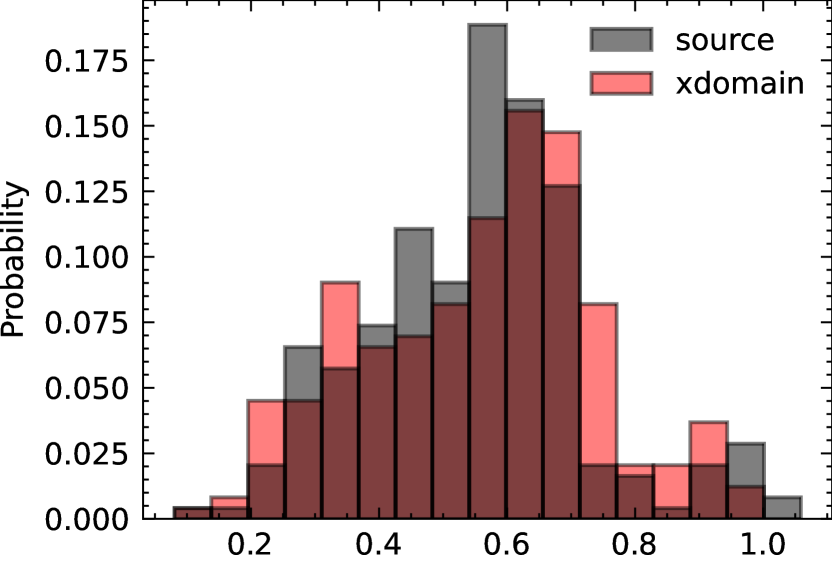
Cross domain performances
The poor results of ODEED on geographical domain OOD lead us to question the generalization of diffusion models to new areas. Tab. 3 shows that OOD detection performance remains close, even when switching the models’ domains. Naturally, reconstruction errors are higher on the domain for which the diffusion model has not been trained, i.e. Germany provides lower quality reconstruction on Louisiana images than Louisiana (and vice-versa). Nevertheless, we show in Fig. 6 that the distribution of the scores is shifted both for in and out-of-distribution samples. This means the detection threshold has also to be shifted, however, detection abilities are preserved, as illustrated by the similar AUC and FPR95% for the same-domain and cross-domain setups. This is promising for the detection of anomalies even under non-stationary data distributions.
6 Conclusion
In this work, we evaluated the effectiveness of diffusion models to detect out-of-distribution Earth Observation images. We introduced the ODEED scorer that leverages the deterministic reconstruction capabilities of continuous-time diffusion models. We evaluated these approaches for 1) cloud detection and 2) a challenging ensemble of OOD detection tasks on the Space-Net 8 dataset. We demonstrated that our ODEED scorer significantly outperforms baselines in the more challenging flood-related scenarios, showing the interest of diffusion models to detect “near-out-of-distribution” remote sensing imagery, such as images of floods. These findings open the door to new approaches to detect rare events from unlabeled EO data using generative modeling.
Acknowledgements
This research was conducted as part of the research project MAGE (ANR-22-CE23-0010) funded by the Agence Nationale de la Recherche. This work was granted access to the HPC resources of IDRIS under the allocation AD011014327 made by GENCI.
References
- Amit et al. [2021] Tomer Amit, Tal Shaharbany, Eliya Nachmani, and Lior Wolf. Segdiff: Image segmentation with diffusion probabilistic models. arXiv e-prints, pages arXiv–2112, 2021.
- Anderson [1982] Brian D.O. Anderson. Reverse-time diffusion equation models. Stochastic Processes and their Applications, 12(3):313–326, 1982.
- Austin et al. [2021] Jacob Austin, Daniel D Johnson, Jonathan Ho, Daniel Tarlow, and Rianne Van Den Berg. Structured denoising diffusion models in discrete state-spaces. Advances in Neural Information Processing Systems, 34:17981–17993, 2021.
- Baghirli et al. [2023] Orkhan Baghirli, Hamid Askarov, Imran Ibrahimli, Ismat Bakhishov, and Nabi Nabiyev. Satdm: Synthesizing realistic satellite image with semantic layout conditioning using diffusion models. arXiv preprint arXiv:2309.16812, 2023.
- Bandara et al. [2022] Wele Gedara Chaminda Bandara, Nithin Gopalakrishnan Nair, and Vishal M Patel. Ddpm-cd: Remote sensing change detection using denoising diffusion probabilistic models. arXiv preprint arXiv:2206.11892, 2022.
- Biroli et al. [2024] Giulio Biroli, Tony Bonnaire, Valentin de Bortoli, and Marc Mézard. Dynamical regimes of diffusion models. arXiv preprint arXiv:2402.18491, 2024.
- Blattmann et al. [2023] Andreas Blattmann, Robin Rombach, Huan Ling, Tim Dockhorn, Seung Wook Kim, Sanja Fidler, and Karsten Kreis. Align your latents: High-resolution video synthesis with latent diffusion models. In IEEE Conference on Computer Vision and Pattern Recognition (CVPR), 2023.
- Charpentier et al. [2020] Bertrand Charpentier, Daniel Zügner, and Stephan Günnemann. Posterior network: Uncertainty estimation without ood samples via density-based pseudo-counts. Advances in Neural Information Processing Systems, 33:1356–1367, 2020.
- Chen [2017] L-C Chen. Rethinking atrous convolution for semantic image segmentation. Computing Research Repository, 2017.
- [10] Mihai Coca, Iulia Coca Neagoe, and Mihai Datcu. Hybrid DNN-Dirichlet Anomaly Detection and Ranking: Case of Burned Areas Discovery. 60:1–16.
- Denouden et al. [2018] Taylor Denouden, Rick Salay, Krzysztof Czarnecki, Vahdat Abdelzad, Buu Phan, and Sachin Vernekar. Improving reconstruction autoencoder out-of-distribution detection with mahalanobis distance. CoRR, abs/1812.02765, 2018.
- Dhariwal and Nichol [2021] Prafulla Dhariwal and Alexander Nichol. Diffusion models beat gans on image synthesis. Advances in Neural Information Processing Systems, 34:8780–8794, 2021.
- Espinosa and Crowley [2023] Miguel Espinosa and Elliot J. Crowley. Generate your own scotland: Satellite image generation conditioned on maps. NeurIPS 2023 Workshop on Diffusion Models, 2023.
- Francis et al. [2020] Alistair Francis, John Mrziglod, Panagiotis Sidiropoulos, and Jan-Peter Muller. Sentinel-2 cloud mask catalogue, 2020.
- Gao et al. [2023] Ruiyuan Gao, Chenchen Zhao, Lanqing Hong, and Qiang Xu. Diffguard: Semantic mismatch-guided out-of-distribution detection using pre-trained diffusion models. In Proceedings of the IEEE/CVF International Conference on Computer Vision (ICCV), pages 1579–1589, 2023.
- Gawlikowski et al. [2021] Jakob Gawlikowski, Sudipan Saha, Anna Kruspe, and Xiao Xiang Zhu. Out-of-distribution detection in satellite image classification. In RobustML Workshop at ICLR 2021, pages 1–5. ICRL, 2021.
- Goodier and Campbell [2023] Joseph Goodier and Neill DF Campbell. Likelihood-based out-of-distribution detection with denoising diffusion probabilistic models. BMVC, 2023.
- Graham et al. [2023] Mark S. Graham, Walter H.L. Pinaya, Petru-Daniel Tudosiu, Parashkev Nachev, Sebastien Ourselin, and Jorge Cardoso. Denoising diffusion models for out-of-distribution detection. In Proceedings of the IEEE/CVF Conference on Computer Vision and Pattern Recognition (CVPR) Workshops, pages 2948–2957, 2023.
- Han et al. [2023] Lintao Han, Yuchen Zhao, Hengyi Lv, Yisa Zhang, Hailong Liu, Guoling Bi, and Qing Han. Enhancing remote sensing image super-resolution with efficient hybrid conditional diffusion model. Remote Sensing, 15(13), 2023.
- Ho et al. [2020] Jonathan Ho, Ajay Jain, and Pieter Abbeel. Denoising diffusion probabilistic models. Advances in Neural Information Processing Systems, 33:6840–6851, 2020.
- Ho et al. [2022] Jonathan Ho, Tim Salimans, Alexey Gritsenko, William Chan, Mohammad Norouzi, and David J Fleet. Video diffusion models. arXiv:2204.03458, 2022.
- Hyvärinen [2005] Aapo Hyvärinen. Estimation of non-normalized statistical models by score matching. Journal of Machine Learning Research, 6(24):695–709, 2005.
- [23] Ronny Hänsch, Jacob Arndt, Dalton Lunga, Matthew Gibb, Tyler Pedelose, Arnold Boedihardjo, Desiree Petrie, and Todd M. Bacastow. SpaceNet 8 - The Detection of Flooded Roads and Buildings. In 2022 IEEE/CVF Conference on Computer Vision and Pattern Recognition Workshops (CVPRW), pages 1471–1479.
- Jiang et al. [2018] Heinrich Jiang, Been Kim, Melody Guan, and Maya Gupta. To trust or not to trust a classifier. Advances in neural information processing systems, 31, 2018.
- Karras et al. [2022] Tero Karras, Miika Aittala, Timo Aila, and Samuli Laine. Elucidating the design space of diffusion-based generative models. Advances in Neural Information Processing Systems, 35:26565–26577, 2022.
- Kawar et al. [2022a] Bahjat Kawar, Michael Elad, Stefano Ermon, and Jiaming Song. Denoising diffusion restoration models. In Advances in Neural Information Processing Systems, 2022a.
- Kawar et al. [2022b] Bahjat Kawar, Roy Ganz, and Michael Elad. Enhancing diffusion-based image synthesis with robust classifier guidance. Transactions on Machine Learning Research, 2022b.
- Khani et al. [2023] Aliasghar Khani, Saeid Asgari, Aditya Sanghi, Ali Mahdavi Amiri, and Ghassan Hamarneh. Slime: Segment like me. In The Twelfth International Conference on Learning Representations, 2023.
- Khanna et al. [2024] Samar Khanna, Patrick Liu, Linqi Zhou, Chenlin Meng, Robin Rombach, Marshall Burke, David B. Lobell, and Stefano Ermon. Diffusionsat: A generative foundation model for satellite imagery. In The Twelfth International Conference on Learning Representations, 2024.
- Kingma et al. [2021] Diederik Kingma, Tim Salimans, Ben Poole, and Jonathan Ho. Variational diffusion models. Advances in neural information processing systems, 34:21696–21707, 2021.
- Koizumi et al. [2022] Yuma Koizumi, Heiga Zen, Kohei Yatabe, Nanxin Chen, and Michiel Bacchiani. Specgrad: Diffusion probabilistic model based neural vocoder with adaptive noise spectral shaping. 2022.
- Kong et al. [2020] Zhifeng Kong, Wei Ping, Jiaji Huang, Kexin Zhao, and Bryan Catanzaro. Diffwave: A versatile diffusion model for audio synthesis. arXiv preprint arXiv:2009.09761, 2020.
- Lee et al. [2018] Kimin Lee, Honglak Lee, Kibok Lee, and Jinwoo Shin. Training confidence-calibrated classifiers for detecting out-of-distribution samples. In International Conference on Learning Representations, 2018.
- Li et al. [2022] Xiang Li, John Thickstun, Ishaan Gulrajani, Percy S Liang, and Tatsunori B Hashimoto. Diffusion-lm improves controllable text generation. Advances in Neural Information Processing Systems, 35:4328–4343, 2022.
- Liu et al. [2022] Jinzhe Liu, Zhiqiang Yuan, Zhaoying Pan, Yiqun Fu, Li Liu, and Bin Lu. Diffusion model with detail complement for super-resolution of remote sensing. Remote Sensing, 14(19), 2022.
- Liu et al. [2020] Weitang Liu, Xiaoyun Wang, John Owens, and Yixuan Li. Energy-based out-of-distribution detection. Advances in neural information processing systems, 33:21464–21475, 2020.
- Liu et al. [2023] Zhenzhen Liu, Jin Peng Zhou, Yufan Wang, and Kilian Q. Weinberger. Unsupervised out-of-distribution detection with diffusion inpainting. In Proceedings of the 40th International Conference on Machine Learning. JMLR.org, 2023.
- Macêdo et al. [2021] David Macêdo, Tsang Ing Ren, Cleber Zanchettin, Adriano LI Oliveira, and Teresa Ludermir. Entropic out-of-distribution detection. In 2021 International Joint Conference on Neural Networks (IJCNN), pages 1–8. IEEE, 2021.
- Malinin and Gales [2018] Andrey Malinin and Mark Gales. Predictive uncertainty estimation via prior networks. Advances in neural information processing systems, 31, 2018.
- [40] Sina Mohseni, Mandar Pitale, J. B. S. Yadawa, and Zhangyang Wang. Self-Supervised Learning for Generalizable Out-of-Distribution Detection. 34(04):5216–5223.
- Nguyen et al. [2015] Anh Nguyen, Jason Yosinski, and Jeff Clune. Deep neural networks are easily fooled: High confidence predictions for unrecognizable images. In Proceedings of the IEEE conference on computer vision and pattern recognition, pages 427–436, 2015.
- Raya and Ambrogioni [2024] Gabriel Raya and Luca Ambrogioni. Spontaneous symmetry breaking in generative diffusion models. Advances in Neural Information Processing Systems, 36, 2024.
- Rombach et al. [2021] Robin Rombach, Andreas Blattmann, Dominik Lorenz, Patrick Esser, and Björn Ommer. High-resolution image synthesis with latent diffusion models. 2021.
- Rouard and Hadjeres [2021] Simon Rouard and Gaëtan Hadjeres. Crash: Raw audio score-based generative modeling for controllable high-resolution drum sound synthesis. arXiv preprint arXiv:2106.07431, 2021.
- Saharia et al. [2022] Chitwan Saharia, William Chan, Saurabh Saxena, Lala Li, Jay Whang, Emily Denton, Seyed Kamyar Seyed Ghasemipour, Burcu Karagol Ayan, S Sara Mahdavi, Rapha Gontijo Lopes, et al. Photorealistic text-to-image diffusion models with deep language understanding. arXiv preprint arXiv:2205.11487, 2022.
- Sanguigni et al. [2023] Fulvio Sanguigni, Mikolaj Czerkawski, Lorenzo Papa, Irene Amerini, and Bertrand Le Saux. Diffusion models for earth observation use-cases: from cloud removal to urban change detection. ArXiv, abs/2402.06684, 2023.
- Sebaq and ElHelw [2023] Ahmad Sebaq and Mohamed ElHelw. Rsdiff: Remote sensing image generation from text using diffusion model. arXiv preprint arXiv:2309.02455, 2023.
- [48] Vikash Sehwag, Mung Chiang, and Prateek Mittal. SSD: A Unified Framework for Self-Supervised Outlier Detection.
- Sohl-Dickstein et al. [2015] Jascha Sohl-Dickstein, Eric Weiss, Niru Maheswaranathan, and Surya Ganguli. Deep unsupervised learning using nonequilibrium thermodynamics. In Proceedings of the 32nd International Conference on Machine Learning, pages 2256–2265, Lille, France, 2015. PMLR.
- Song and Ermon [2019] Yang Song and Stefano Ermon. Generative modeling by estimating gradients of the data distribution. Advances in Neural Information Processing Systems, 32, 2019.
- Song and Ermon [2020] Yang Song and Stefano Ermon. Generative modeling by estimating gradients of the data distribution, 2020.
- Song et al. [2020] Yang Song, Jascha Sohl-Dickstein, Diederik P Kingma, Abhishek Kumar, Stefano Ermon, and Ben Poole. Score-based generative modeling through stochastic differential equations. In International Conference on Learning Representations, 2020.
- Sun et al. [2022] Yiyou Sun, Yifei Ming, Xiaojin Zhu, and Yixuan Li. Out-of-distribution detection with deep nearest neighbors. In International Conference on Machine Learning, pages 20827–20840. PMLR, 2022.
- Vincent [2011] Pascal Vincent. A connection between score matching and denoising autoencoders. Neural Computation, 23(7):1661–1674, 2011.
- Wang et al. [2022] Haoqi Wang, Zhizhong Li, Litong Feng, and Wayne Zhang. Vim: Out-of-distribution with virtual-logit matching. In Proceedings of the IEEE/CVF conference on computer vision and pattern recognition, pages 4921–4930, 2022.
- Wu et al. [2024] Kevin E Wu, Kevin K Yang, Rianne van den Berg, Sarah Alamdari, James Y Zou, Alex X Lu, and Ava P Amini. Protein structure generation via folding diffusion. Nature Communications, 15(1):1059, 2024.
- Xiao et al. [2023] Yi Xiao, Qiangqiang Yuan, Kui Jiang, Jiang He, Xianyu Jin, and Liangpei Zhang. Ediffsr: An efficient diffusion probabilistic model for remote sensing image super-resolution. IEEE Transactions on Geoscience and Remote Sensing, 2023.
- [58] Jingkang Yang, Kaiyang Zhou, Yixuan Li, and Ziwei Liu. Generalized Out-of-Distribution Detection: A Survey.
- Yim et al. [2023] Jason Yim, Brian L Trippe, Valentin De Bortoli, Emile Mathieu, Arnaud Doucet, Regina Barzilay, and Tommi Jaakkola. Se (3) diffusion model with application to protein backbone generation. arXiv preprint arXiv:2302.02277, 2023.
- [60] Lily Zhang, Mark Goldstein, and Rajesh Ranganath. Understanding Failures in Out-of-Distribution Detection with Deep Generative Models. In Proceedings of the 38th International Conference on Machine Learning, pages 12427–12436. PMLR.
- Zhang et al. [2023] Lvmin Zhang, Anyi Rao, and Maneesh Agrawala. Adding conditional control to text-to-image diffusion models. In Proceedings of the IEEE/CVF International Conference on Computer Vision (ICCV), pages 3836–3847, 2023.
- Zhang et al. [2018] Richard Zhang, Phillip Isola, Alexei A Efros, Eli Shechtman, and Oliver Wang. The unreasonable effectiveness of deep features as a perceptual metric. In Proceedings of the IEEE conference on computer vision and pattern recognition, pages 586–595, 2018.
- Zhou [2022] Yibo Zhou. Rethinking reconstruction autoencoder-based out-of-distribution detection. In 2022 IEEE/CVF Conference on Computer Vision and Pattern Recognition (CVPR), pages 7369–7377, 2022.
- [64] X. X. Zhu, D. Tuia, L. Mou, G. S. Xia, L. Zhang, F. Xu, and F. Fraundorfer. Deep Learning in Remote Sensing: A Comprehensive Review and List of Resources. 5(4):8–36.
- Zong et al. [2018] Bo Zong, Qi Song, Martin Renqiang Min, Wei Cheng, Cristian Lumezanu, Daeki Cho, and Haifeng Chen. Deep autoencoding gaussian mixture model for unsupervised anomaly detection. In International Conference on Learning Representations, 2018.