Direct measurement of energy transfer in strongly driven rotating turbulence
Abstract
A short, abrupt increase in energy injection rate into steady strongly-driven rotating turbulent flow is used as a probe for energy transfer in the system. The injected excessive energy is localized in time and space and its spectra differ from those of the steady turbulent flow. This allows measuring energy transfer rates, in three different domains: In real space, the injected energy propagates within the turbulent field, as a wave packet of inertial waves. In the frequency domain, energy is transferred non-locally to the low, quasi-geostrophic modes. In wavenumber space, energy locally cascades toward small wavenumbers, in a rate that is consistent with two-dimensionsal (2D) turbulence models. Surprisingly however, the inverse cascade of energy is mediated by inertial waves that propagate within the flow with small, but non-vanishing frequency. Our observations differ from measurements and theoretical predictions of weakly driven turbulence. Yet, they show that in strongly-driven rotating turbulence, inertial waves play an important role in energy transfer, even at the vicinity of the 2D manifold.
Introduction
Understanding the dynamics governing rotating turbulent flows is important in scientific fields such as geophysics, astrophysics and atmospheric sciences [1, 2, 3]. However, certain fundamental processes governing these flows remain unclear [4]. In particular, the relation between two competing views, that of quasi-two-dimensional (2D) turbulence and that of inertial-wave turbulence, is not clear [5, 6].
Rotating incompressible fluids are described by the rotating-frame Navier-Stokes equations (RNSE) and the incompressibility condition. In this work, we consider a system rotating at a constant rate around a vertical axis: ( marks a unit vector). The system’s vertical extent is comparable to its extent in the “horizontal” directions, perpendicular to the axis of rotation. Two dimensionless numbers characterize such systems, the Reynolds number, and Rossby number, , where and are the typical velocity and length scales, and is the kinematic viscosity. Rotating turbulence emerges when , indicating the dominance of nonlinear inertial effects over viscous effects, and , signifying the dominance of Coriolis acceleration over nonlinear inertial accelerations.
The inviscid linearized RNSE, obtained by dropping the inertial and viscous terms, has solutions of the form of plane inertial-waves [7]. These waves with frequency and a wave-vector obey the dispersion relation [8]:
| (1) |
i.e., the frequency does not depend on the magnitude of the wave vector, , but only on the angle, , between and the rotation axis (). The vertical component of the group velocity is given by:
| (2) |
Thus, for a given , wave packets centered around horizontal wave-vectors with transfer energy vertically with the highest speed.
Inertial waves, have been observed in experiments [9, 10, 11, 12, 13] and simulations [14, 13, 15] of rotating turbulence decay and build-up. [16, 17, 18, 19, 20, 15]. Theoretical descriptions of rotating turbulence that take into account interactions have been derived [21, 22, 14, 23]; they are typically limited to weak wave turbulence. Indeed, for weakly forced steady turbulence or when the geostrophic flow is suppressed, 3D inertial waves dominate the energy spectrum and energy transfer is mediated by three-wave resonant interactions. Such a behavior was predicted theoretically [21] and first shown in recent experimental work [10, 24]. It is also observed in our system, when driven weakly (see supplemental information [25], figure S2). Yet, at stronger driving, which is relevant to this work, the mode of energy transfer was changed, leading to dominance of the quasi-geostrophic flow.
Previous observations indicate that as the rate of rotation increases, the flow field becomes increasingly two-dimensional[4]. Under these conditions, some characteristics of the horizontal flow resemble those of 2D (non-rotating) turbulence [26, 23, 27, 28, 29, 30, 31], including the inverse cascade of energy from small to large scales. These characteristics, along with vertical uniformity of the flow, persist even when energy is injected locally in space [29], implying the existence of a mechanism homogenizing energy vertically. Motivated by these observations, models that focus on the energy transfer to the geostrophic component of the flow (flow in the 2D horizontal plane) were derived [32, 33, 14, 34, 23, 35, 36]. However, the precise mechanism underlying this homogenization process remains not fully understood.
These diverse results show that rotating turbulence is spectrally heterogeneous, energetically dominated by the geostrophic quasi-2D flow component, that coexists with the inertial-wave-dominated 3D flow [11, 37, 33, 38, 39, 12]. Still, the relationship between these components is not well understood. Specifically, the process by which energy is transferred from 3D to quasi-2D modes, and the role that inertial waves play in the strongly-driven turbulence regime, are currently not clear. Due to the flow’s three-dimensionality and anisotropy answers to these questions are associated with rates of energy transfer in real space, in the frequency domain and in the wavenumber domain. Measuring transfer rates in steady flows is challenging, and such multidimensional measurements have not been conducted yet.
In this work we perturb a rotating turbulent steady state and measure the evolution of the perturbation within a three-dimensional fluid domain. This measurement allows us to probe the energy transfer rate in the three variables mentioned above. In [40] we showed that an abrupt and short increase in the energy injection rate into existing turbulence (an injection pulse) generates wave-packets of intense turbulence that propagate for long times. In the current study, we demonstrate for the first time that the spectral components of these wave packets obey the dispersion relation of inertial waves. We observe two distinct processes of energy transfer: The first, which has not been measured before, is a rapid, non-local process. It transfers energy from 3D, high frequency waves to low frequency quasi-2D modes. The second, slower energy transfer, is the inverse energy cascade from short to long-wave modes in the quasi-geostrophic manifold. In spite of its similarity with inverse cascade in 2D turbulence, we observe that this process too, is mediated by inertial waves propagating with a small, but non-zero z component of their wave vector.
Experimental setup
The experimental setup is detailed in the supplementary material [25]. It is composed of a rotating plexiglass cylinder of 80 cm diameter and 90 cm height, placed on a rotating table (, with a maximum rotation rate of ).
The tank is filled with water and covered with a transparent flat lid. Energy is injected at the bottom of the tank by circulating the water through an array of outlets and inlets. The energy injection is concentrated at a central wavelength , which is a decreasing function of (see [40]) down to cm at high rotation rates.
Using a vertically scanning horizontal laser sheet, we measure the horizontal (- plain) velocity field, , inside a volume in the interior of the tank. Spatial resolution is cm horizontally and cm vertically, at a rate of Hz. In each experiment, the system is brought to steady state by running it for with an angular speed and a constant energy injection rate, obtaining a turbulent flow with and .
We then increase the pumping rate for a duration of 1.5 s, chosen as the time interval (), after which the injection strength returns to its previous constant value. We continually measure the velocity field until s. The total energy of the pulse is less than 10 percent of the tank’s total energy. Indeed, watching a video of the energy density field[41, 25], it is difficult to identify the moment of pulse injection. Each experiment is repeated six times, and the measurements are averaged over the repetitions.
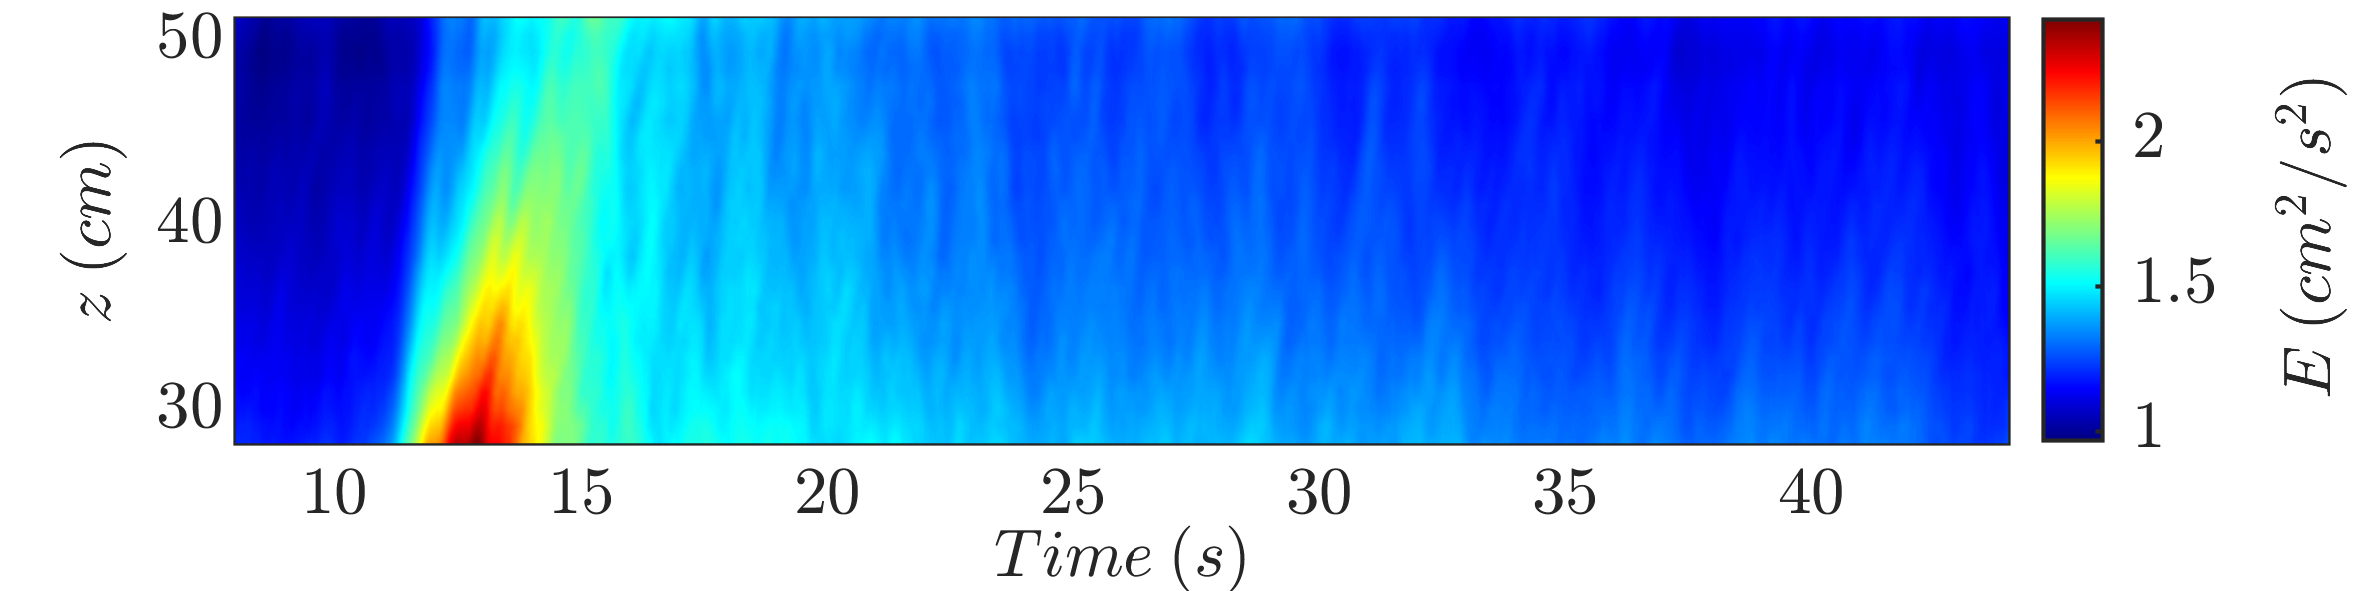
The short increase in energy-injection generates a pulse of fluid flow with an enhanced energy density at the bottom of the tank. The pulse propagates upwards on the background of the steady-state turbulent flow (Fig. 1). During its propagation, the pulse gradually broadens and decays, exciting the entire measurement volume. The flow returns to its steady state after approximately 30 seconds.
We now analyze the spectral properties of the pulse as it evolves in time. To confirm that the excess energy in the pulse is composed of inertial waves, we calculated the spectral energy distribution by applying a spatio-temporal Fourier transform to the velocity field. By subtracting the steady state energy density spectrum, we were able to project the excess energy onto the frequency-polar angle plane defined by the dispersion relation Eq. (1). Our results demonstrate that the excess energy is concentrated around the dispersion relation, providing strong evidence that these waves are indeed inertial waves (see supplemental video and supplementary material[42, 25]).
Frequency component analysis
We now calculate the frequency-filtered velocity field , applying a Gaussian band-pass filter of width centered at to the measured velocity field through.
The kinetic energy density of the filtered field is and we average it laterally in order to obtain - the energy contained in a given frequency at a given height and time. It is plotted as a function of and for three different values of in Fig. 2 (a-c). The high-frequency components (panels a,b) propagate vertically with a finite speed that agrees with the vertical group velocity Eq. (2) for the given frequency, and the injection wave-number , marked by the slopes of the gray lines in Fig.2. These modes lose their energy within a few seconds. Contrarily, the slow, quasi-geostrophic mode (panel c) does not propagate as a sharp front and its energy increases concurrently with the decay of the high-frequency modes. This suggests a nonlinear process of energy transfer in the frequency domain.
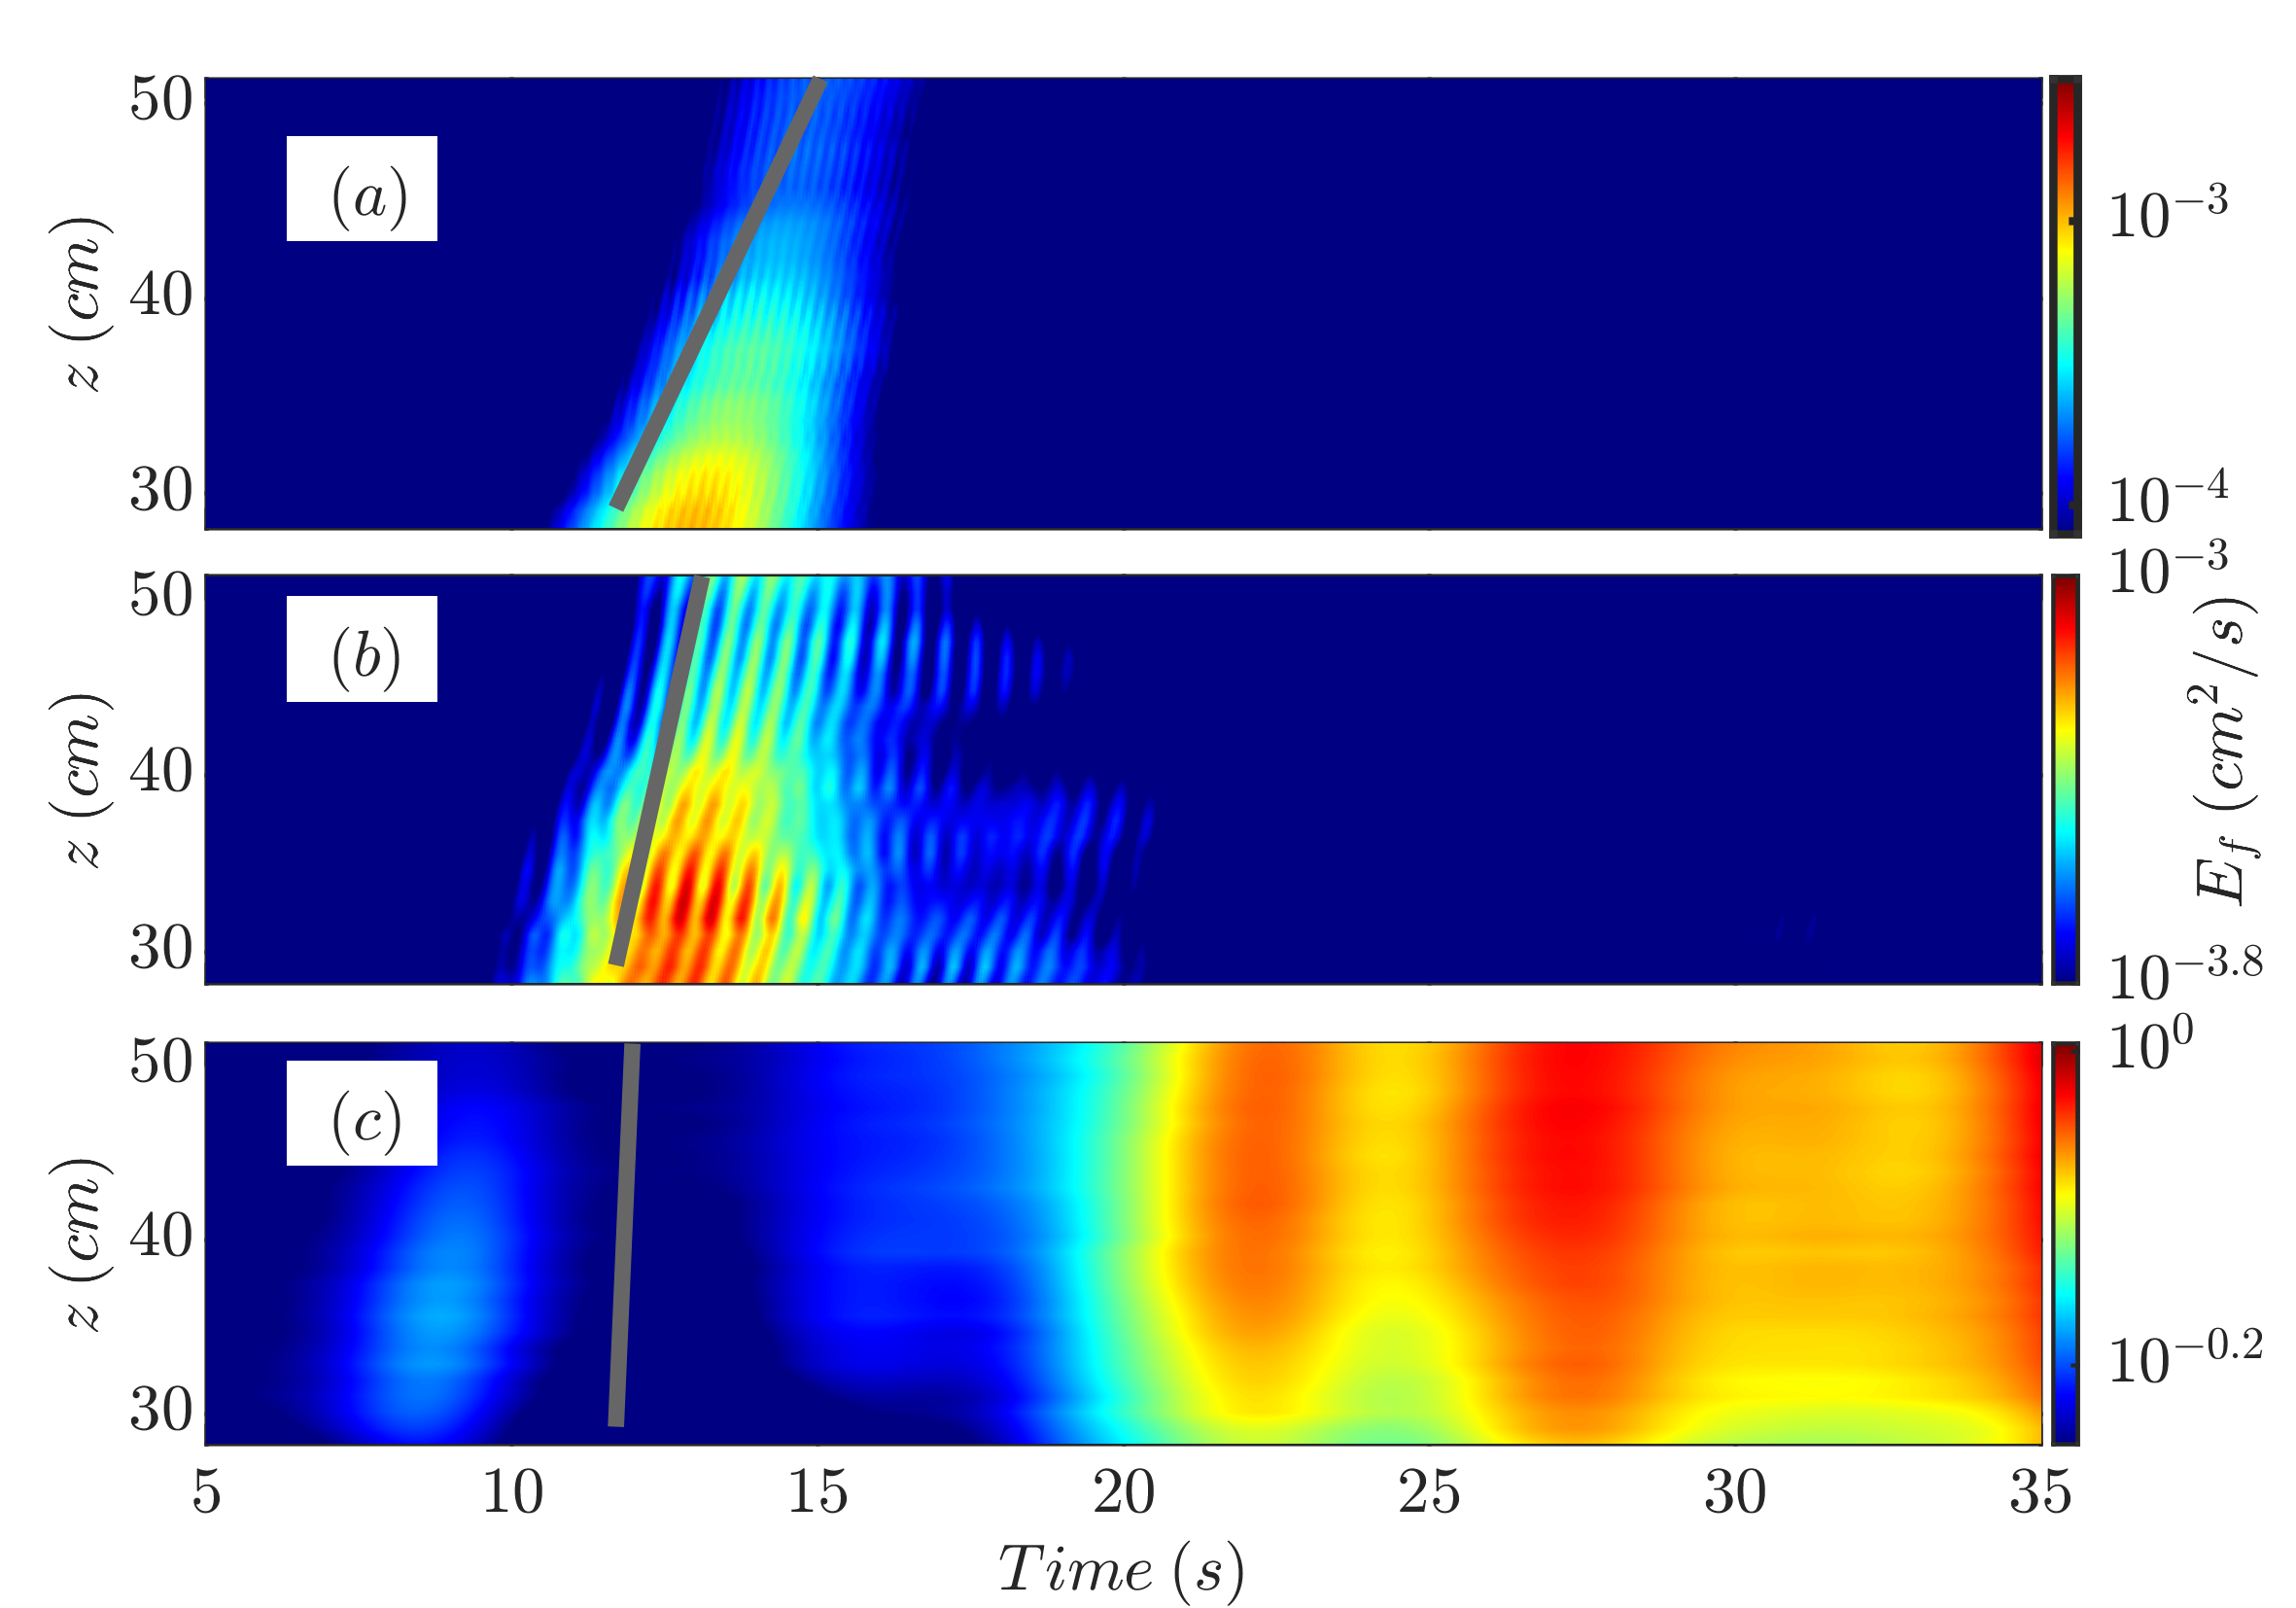
In order to gain insight to this process, we plot a spectrogram of the energy in the time domain, (Fig. 2 (d)). It is obtained via averaging along z (full spatial average) together with normalization [25].
The wave packet propagation is revealed by the arrival time of the energy pulse at the lowest measured plane cm above the injection plane. This dependence on is consistent with the predicted arrival time marked by the dashed gray line (derived from Eq. 2). This is an additional confirmation for the existence of the linear process of wave propagation, as observed above for the two frequencies studied in Fig. 2 (a,b), marked by the upper horizontal dotted lines on the spectrogram. Another key observation is that energy is transferred from the high-frequency directly to the low-frequency components. The rapid decay of the energy pulse, which is clearly evident for all frequency components higher than occurs concurrently with the increase in the energy of the quasi-geostrophic, low-frequency modes. There is no indication for a cascade, or a gradual transfer in the frequency (orientation) domain. The rapid decay of the high frequency modes occurs within a time-scale of s. Notably, this time-scale is consistent with indirect estimation of the dominant nonlinear time obtained by Yarom [37] for strongly-driven steady state flows. There, was deduced from the width of the energy spectrum. Performing similar analysis for our steady flows yields s.
Since the high-frequency part of the flow is dominated by inertial waves, while the low-frequency flow is quasi-geostrophic, we conclude that the energy injected by the pulse is spatially distributed by linear wave propagation. This is followed by a rapid, direct transfer of energy from modes with significant vertical wave vector components to quasi-geostrophic modes. We conjecture that this rapid process works analogously in the steady flow, forming the mechanism by which energy is fed from inertial waves and accumulates in the quasi-geostrophic flow.
Spatial spectral analysis
Next, we focus on the evolution of the energy density in wave-number. For this purpose we calculate the horizontal Fourier transform of the energy density , and its vertical average . Axial symmetry implies that the mean energy density depends only on the magnitude of the (horizontal) wave vector . The excess energy density due to the pulse and is obtained from and (respectively) by subtracting the mean steady-state energy-density.
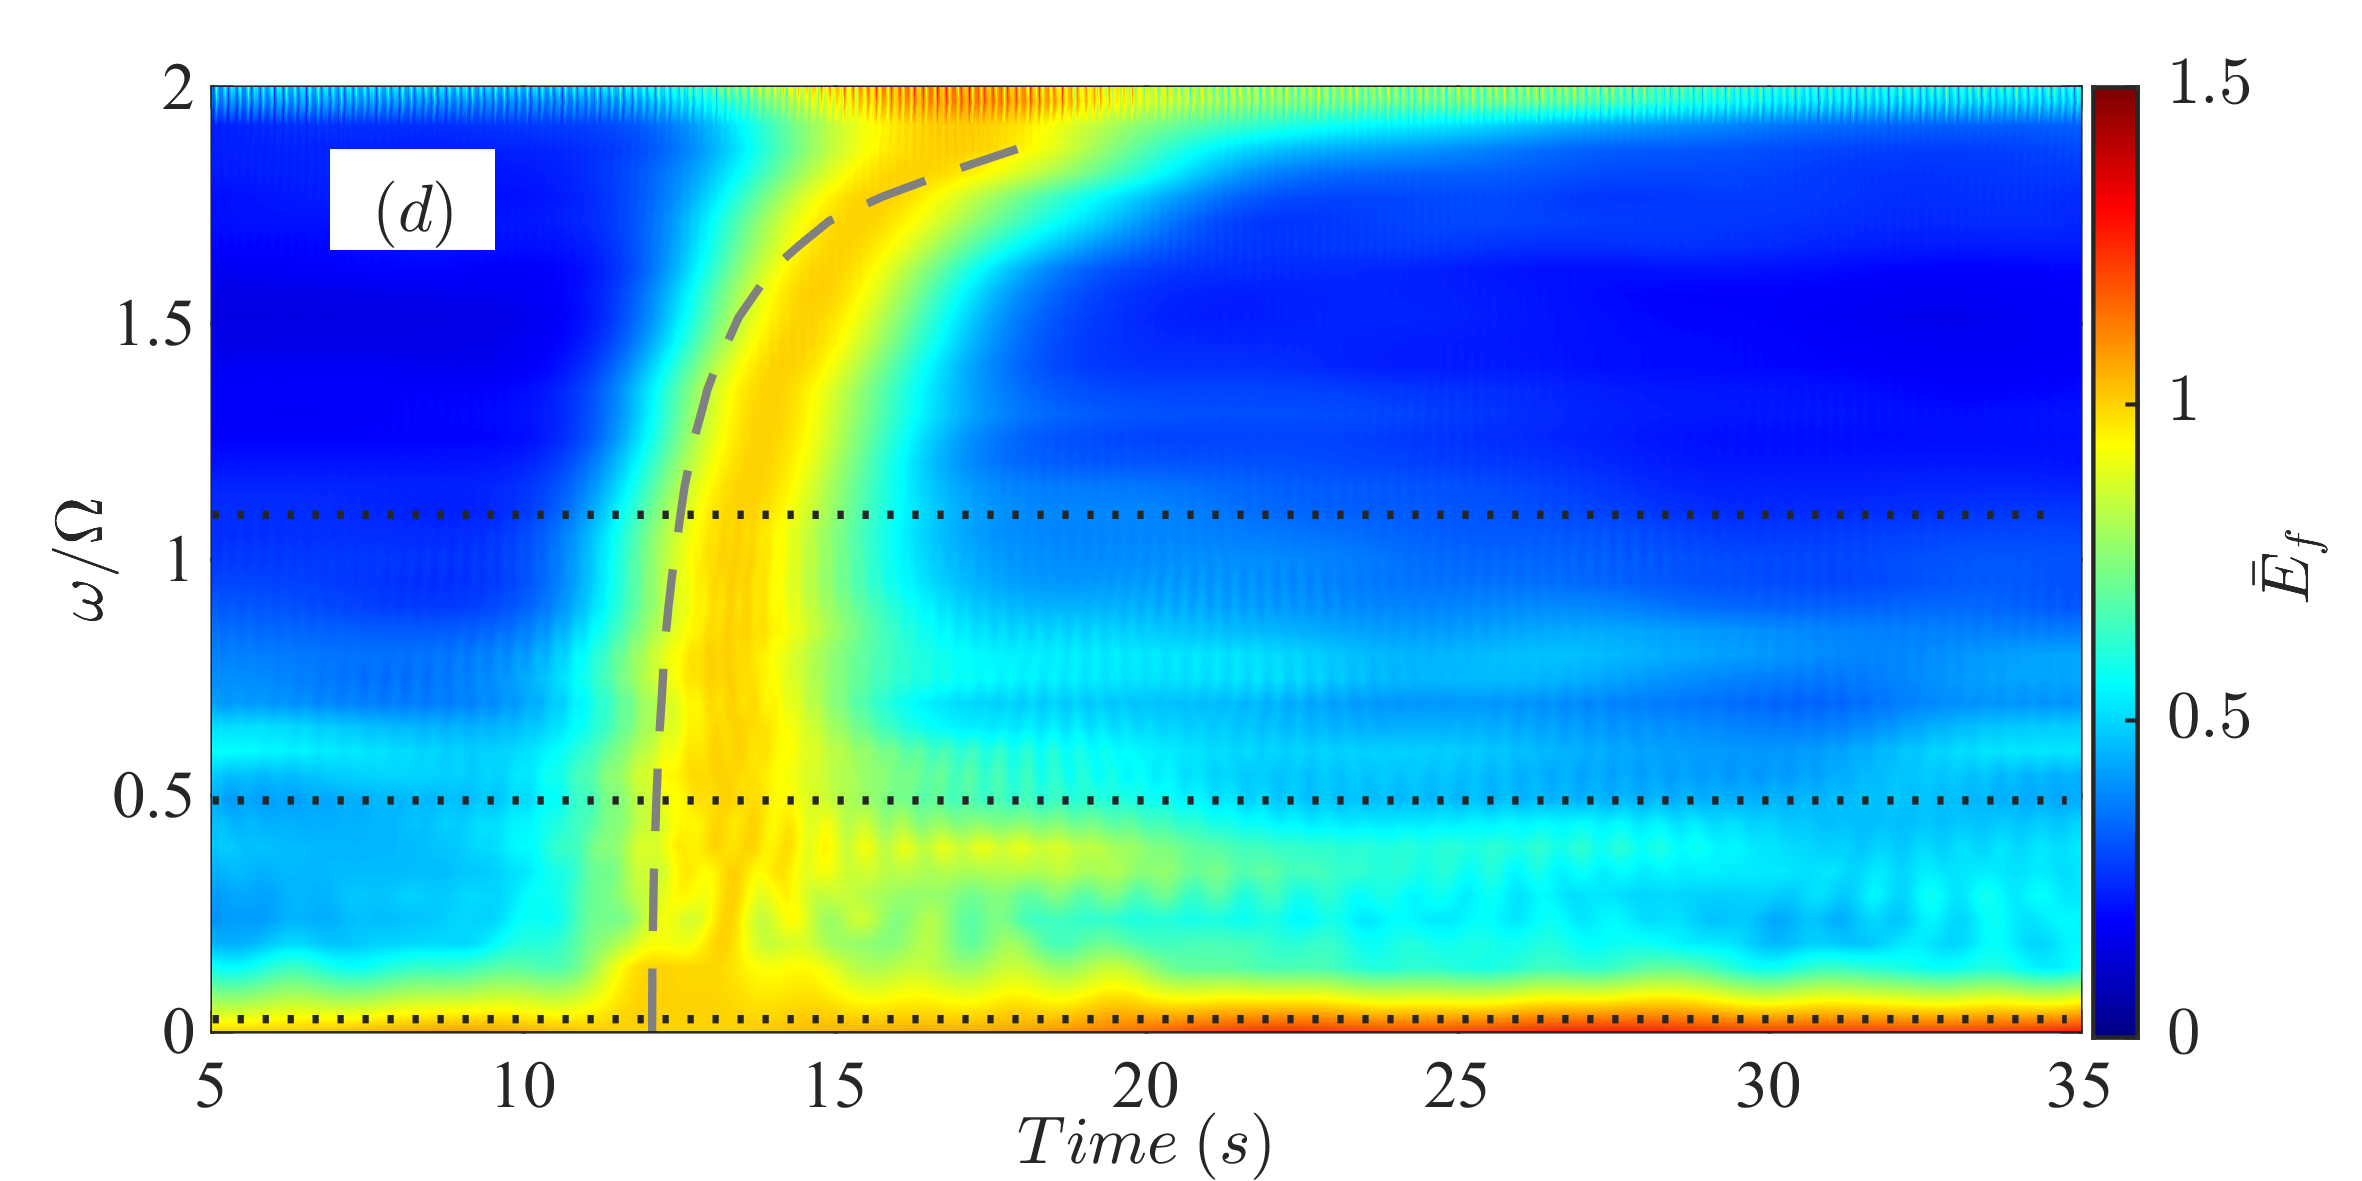
Experimental measurements of are presented in Fig. 3 (a) as a function of and , with the inset showing as a function of for three different times. Notably, the excess energy distribution in the quasi-geostrophic manifold gradually shifts to smaller wave-numbers (while the total excess energy decreases as the pulse is dissipating). The observations are consistent with a local transfer of energy from short to long-wave modes.
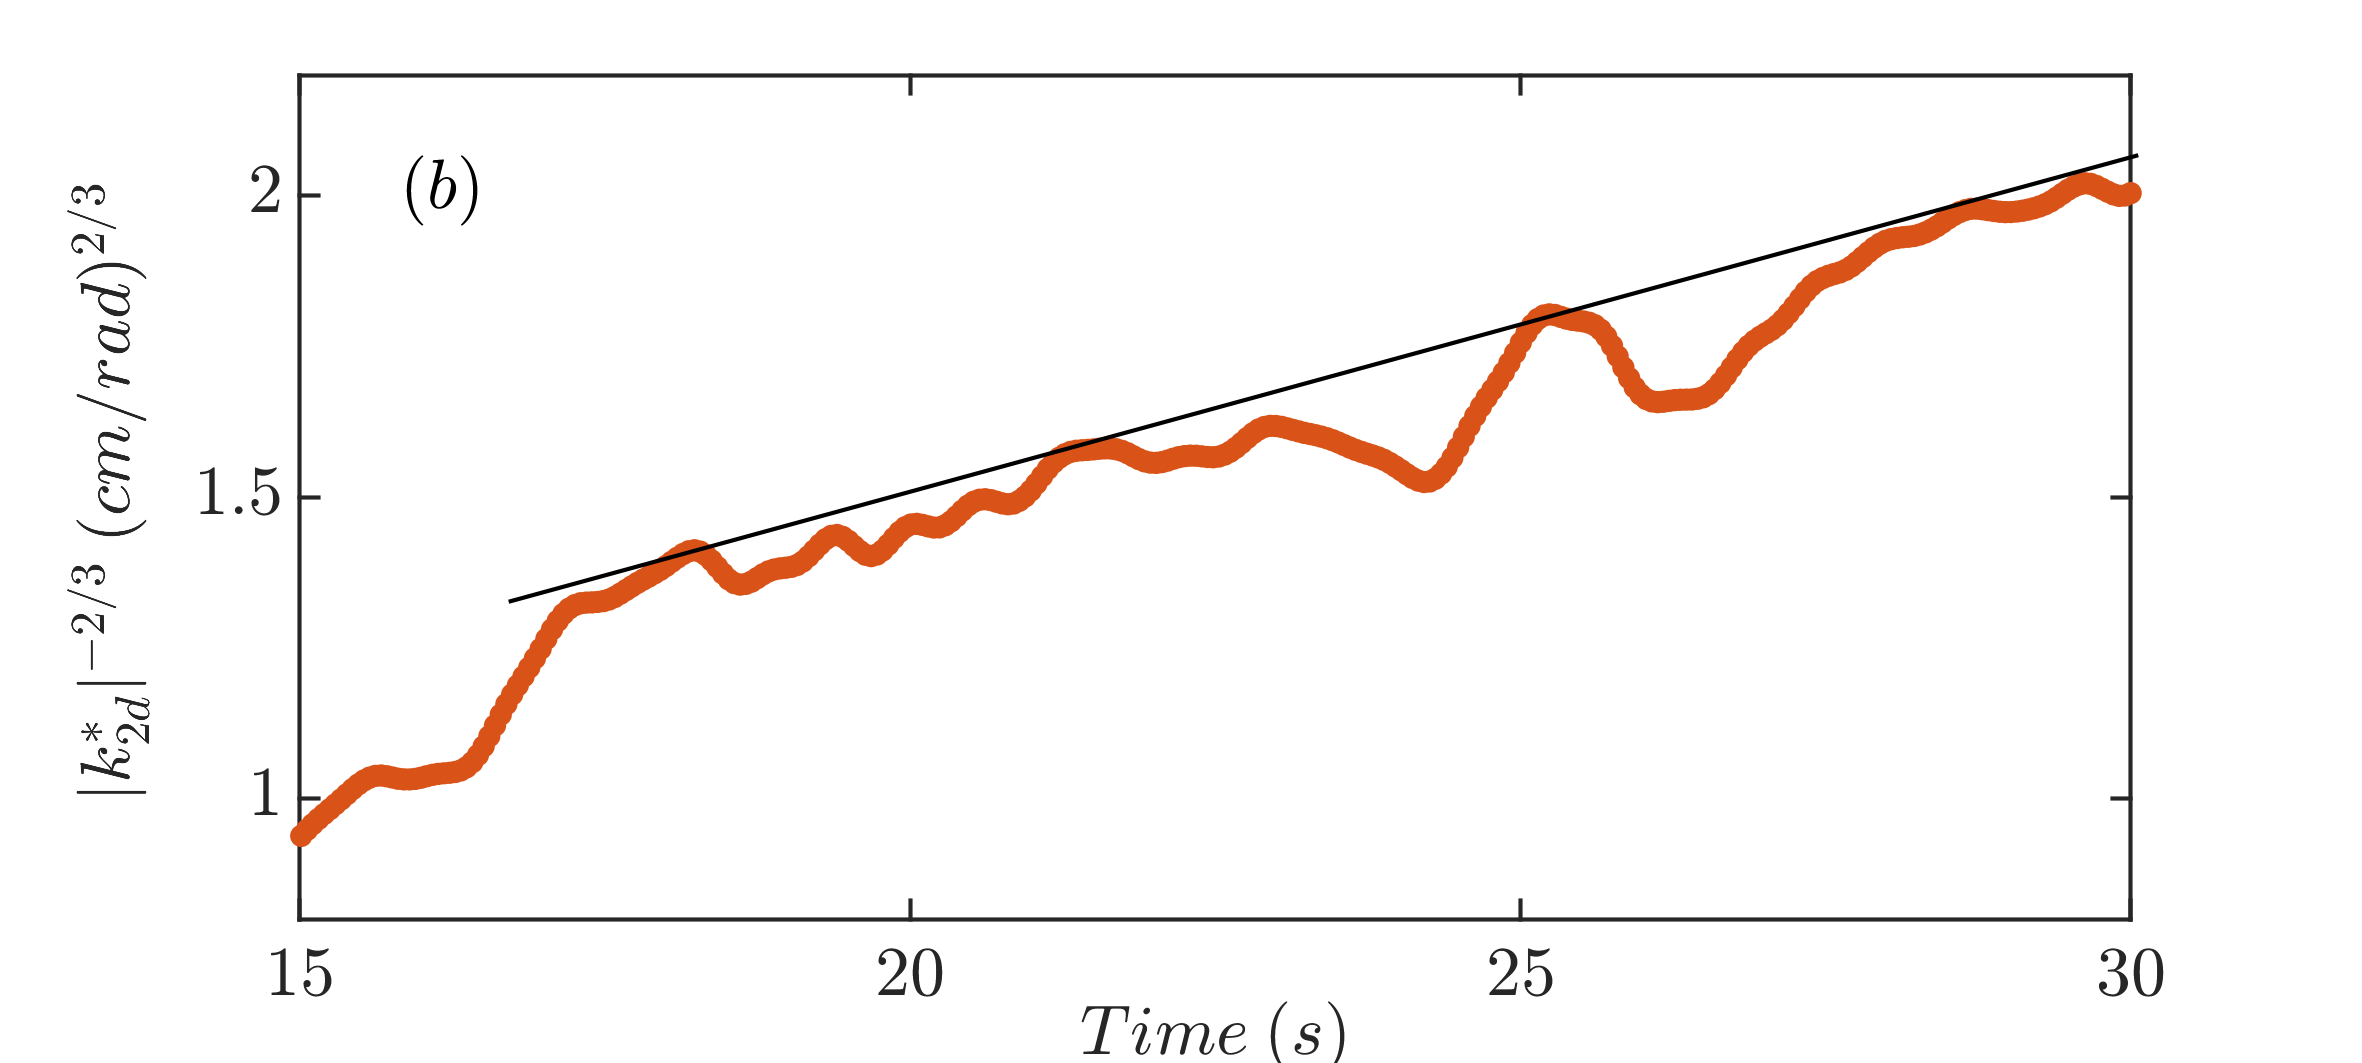
We quantitatively verify this scenario by following the time evolution of , the wave-number of the maximum of the averaged excess energy density (Fig. 3 (b)). The linear growth of is consistent with the filling by a constant energy flux of a spectrum, that characterizes 2D turbulence [43, 44, 45, 46], and was also observed in the energy spectrum of the geostrophic component of rotating turbulence [26].
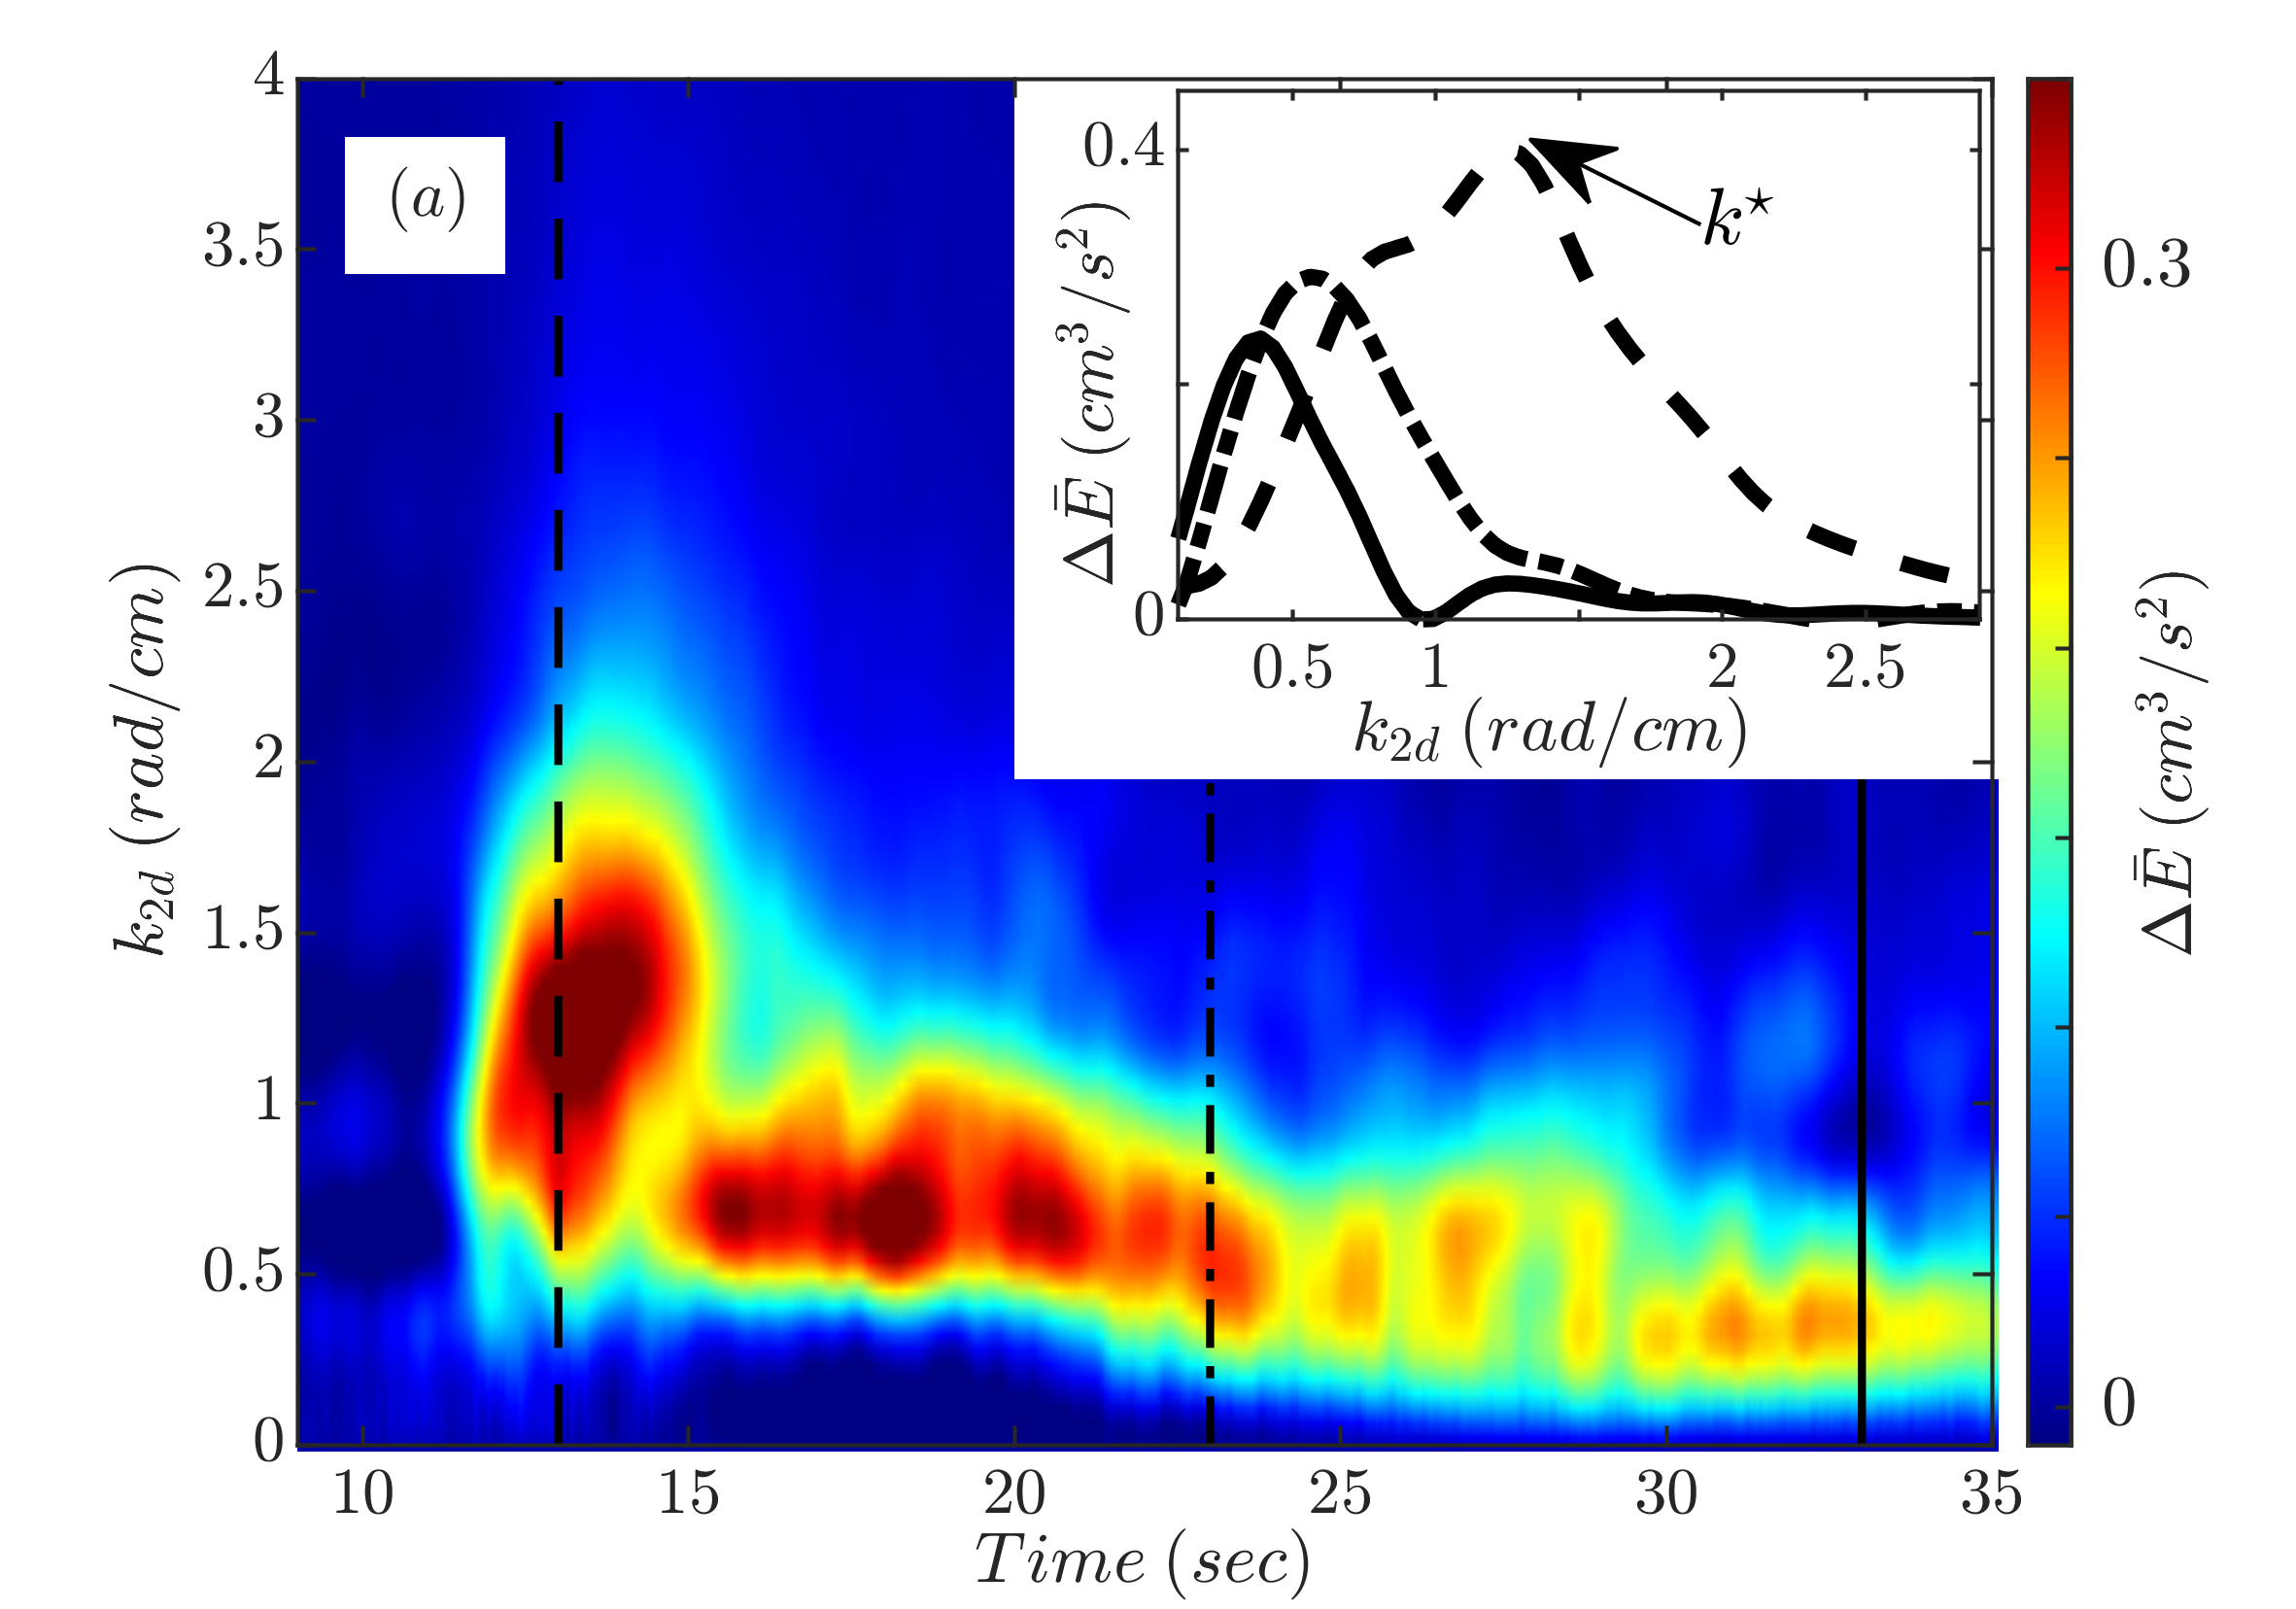
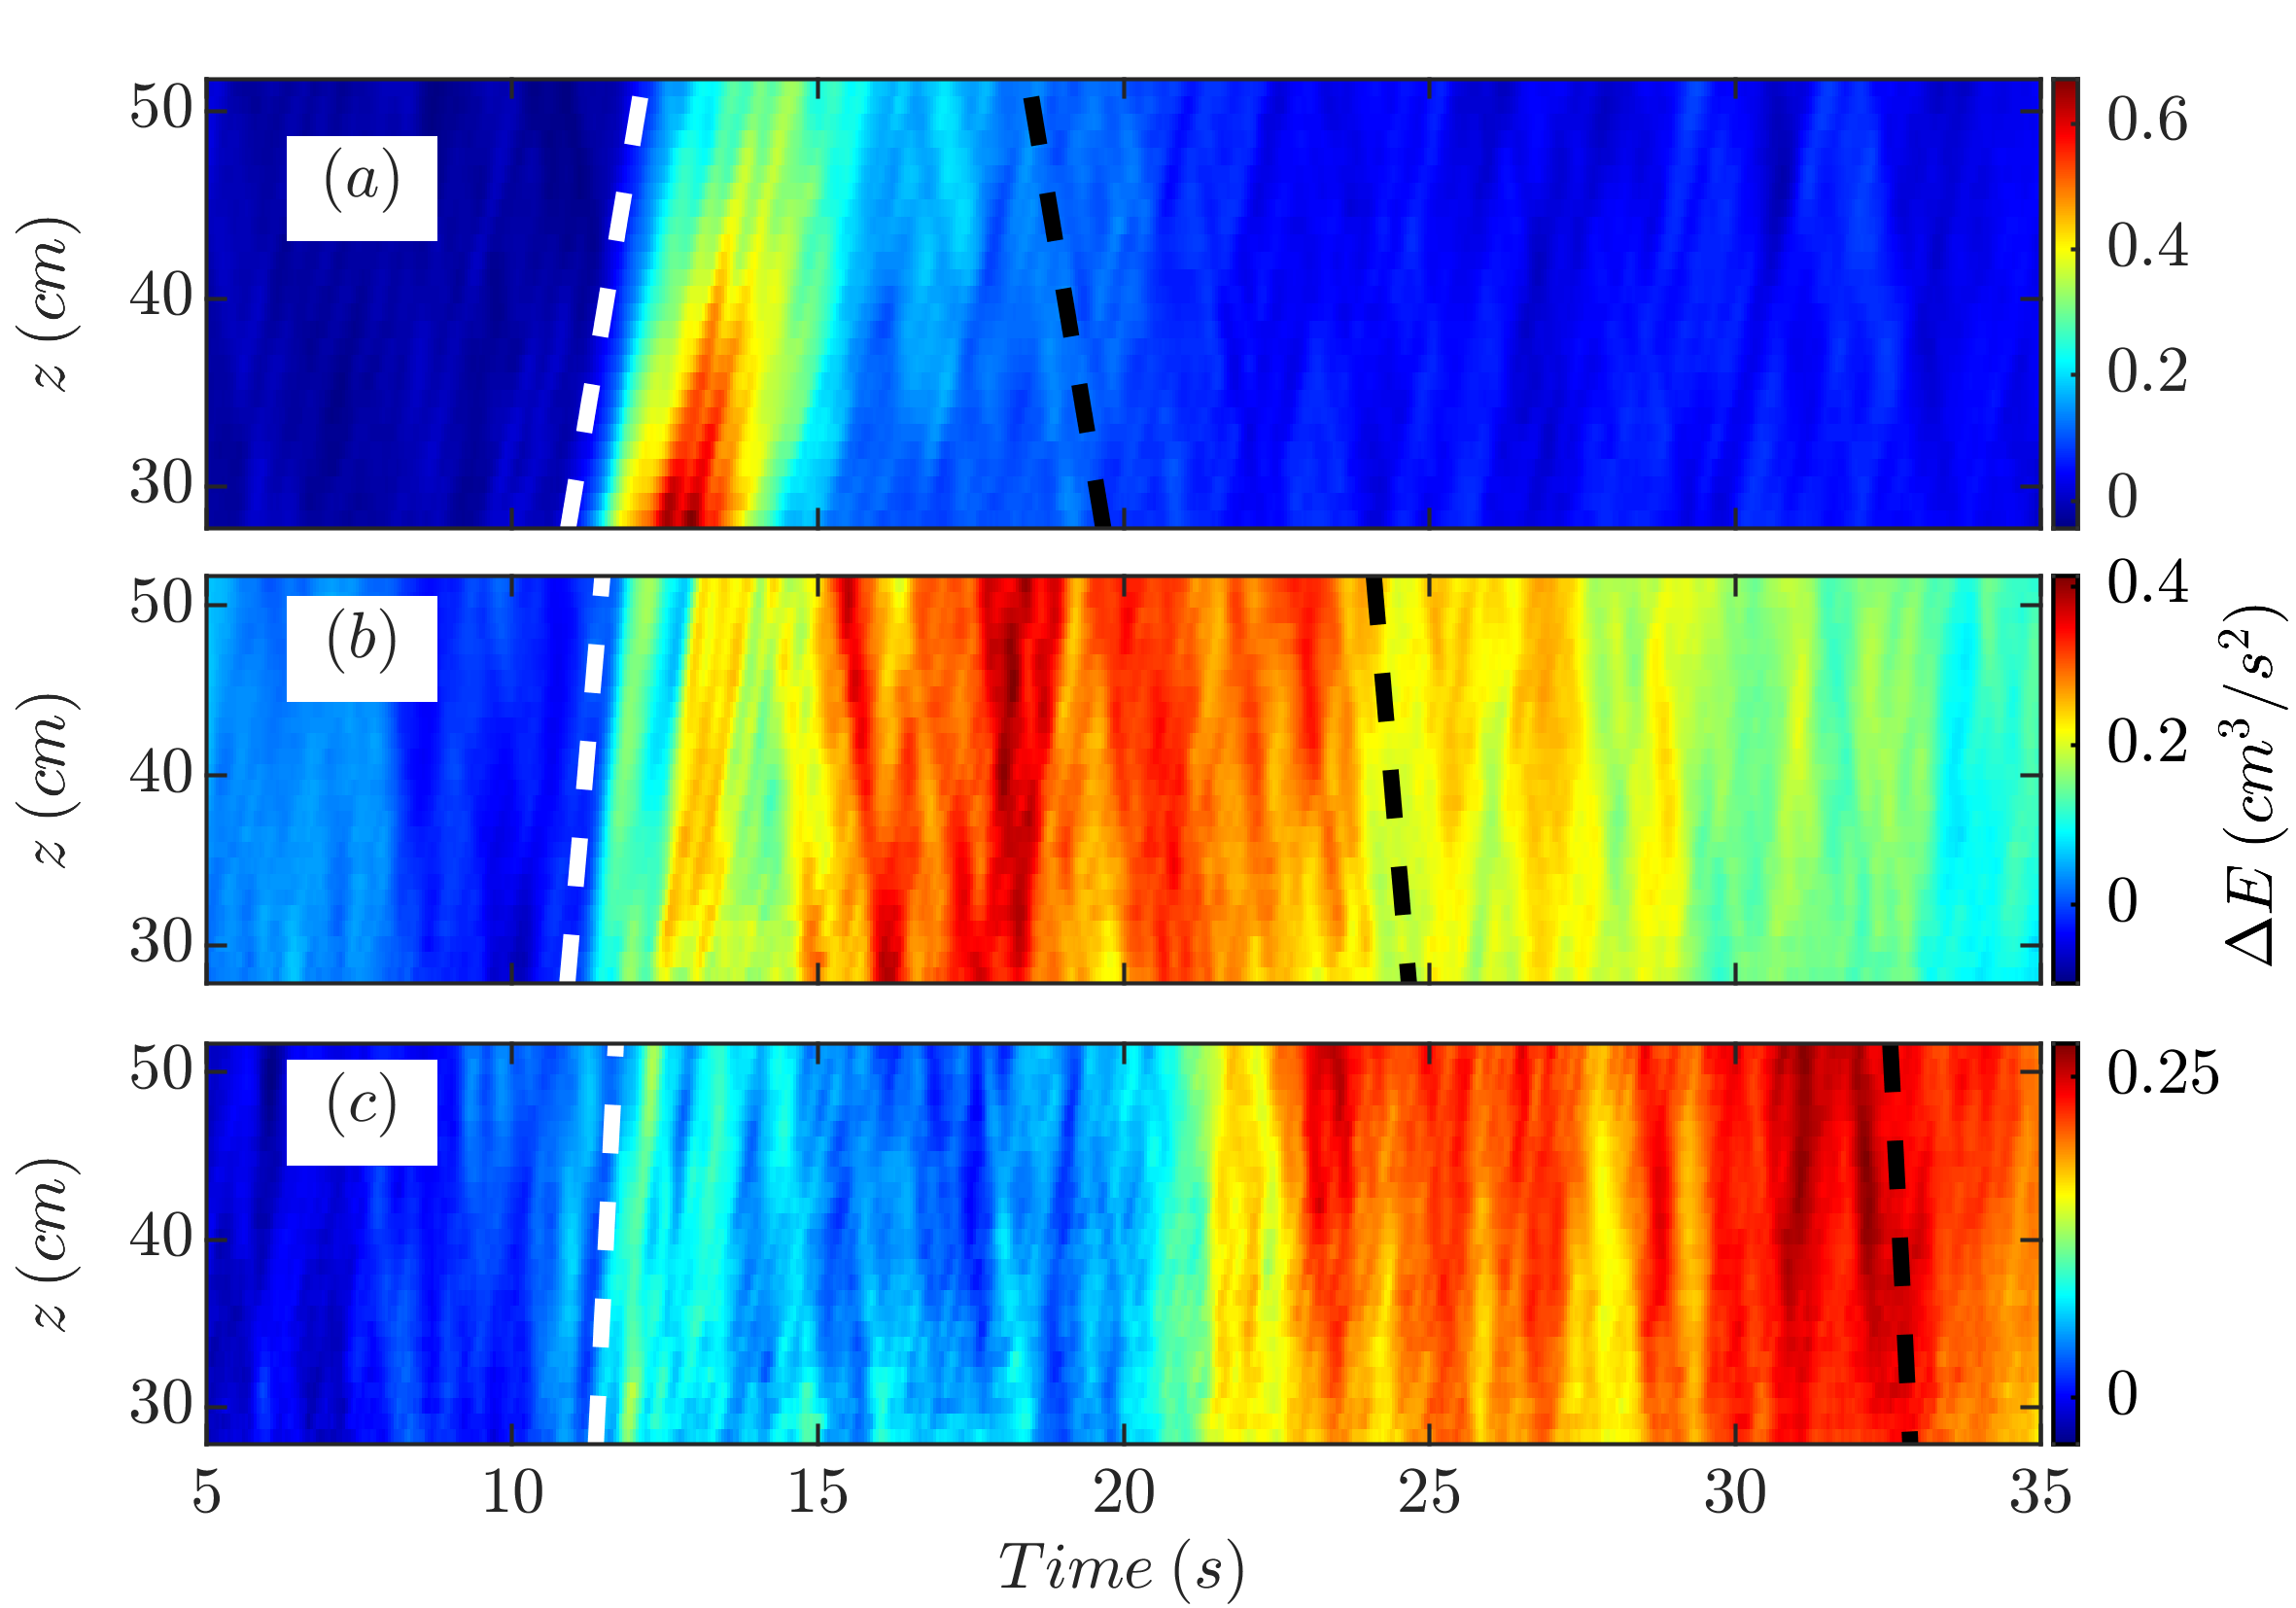
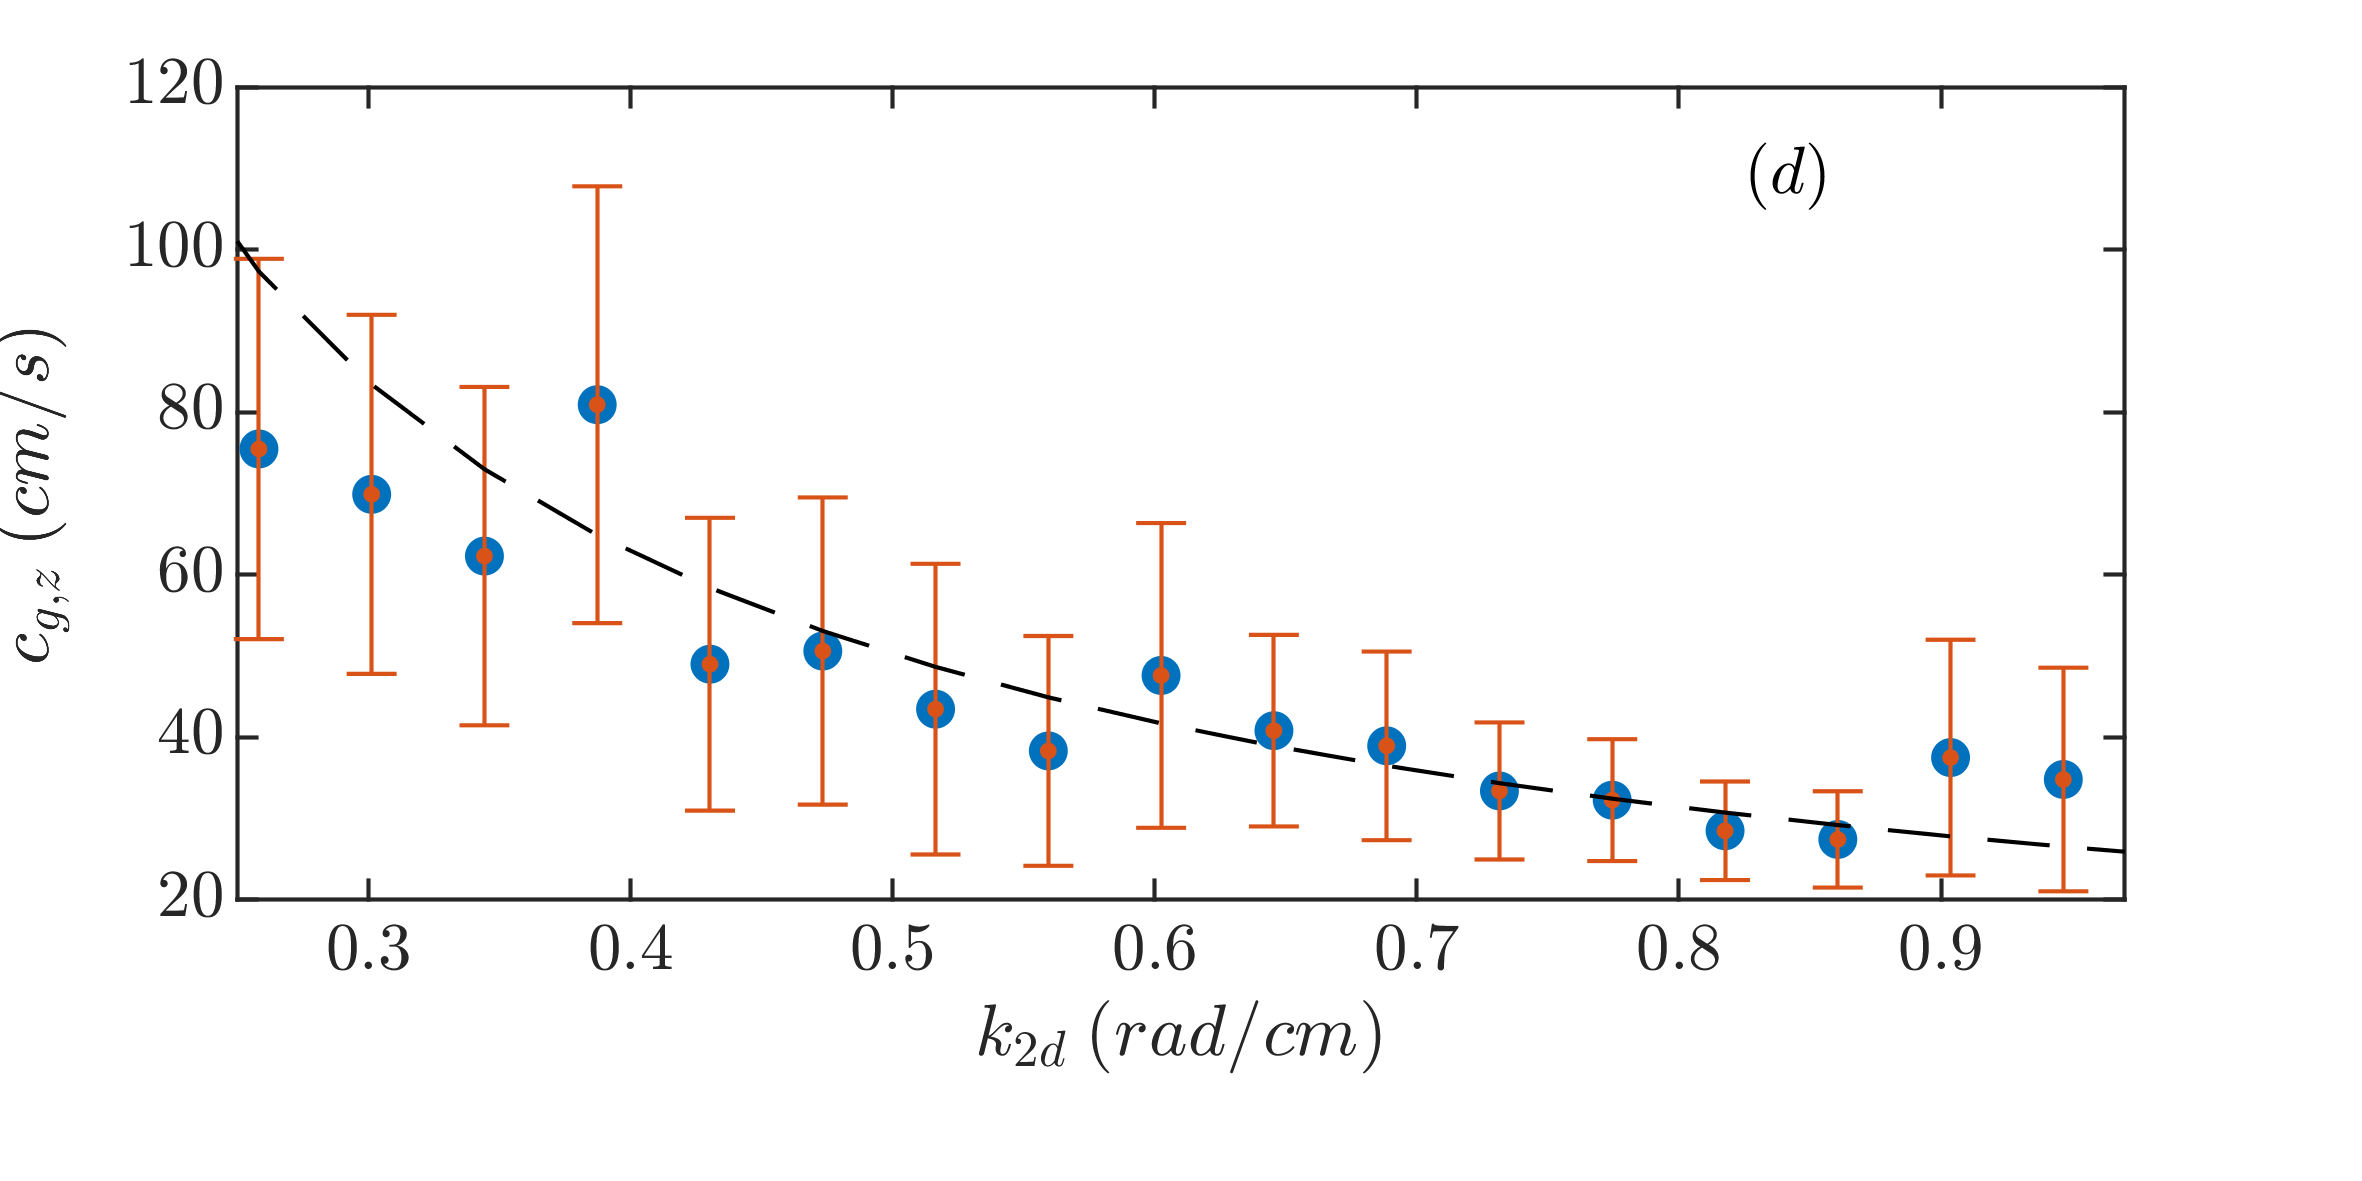
These observations seem to indicate that the physics of the geostrophic component of rotating turbulence is analogous to that of 2D turbulence. However, our measurement of the -dependent energy density, reveals a weak but significant vertical variation in . Indeed, the plots of as a function of for three fixed values of (Fig. 4 (a–c)) exhibit diagonal rather than vertical correlations, indicating that information travels vertically at a finite speed, while transferring energy to broader horizontal scales. Moreover, the propagation speed is given by the vertical group velocity component (2), evaluated at , with . These waves propagate upwards (white lines) as well as downwards (black lines). Evidence for inertial wave carrying the excess energy persists during the entire inverse energy cascade from the large wave-numbers in Fig. 4 (a), through intermediate (b) to small wave-numbers (c). These observations provide strong evidence that the energy that was shown to inversely cascade in Fig 3 consists of (nearly horizontal) inertial waves.
Using a Hough transform of the measured for each [25] we show that the vertical propagation velocity is consistent with the dependence of (Fig. 4 (d)).
Discussion
We used an injection pulse—a perturbation, localized in time and space, of the energy injection, in order to monitor energy transfer rates in developed rotating turbulence. Assuming that the kinetics that govern the pulse are similar to those of the statistically stationary steady state flow, these measurements facilitate experimental observation of three energy transfer processes: spatial homogenization, transfer of energy from high frequency 3D modes to low-frequency quasi-geostrophic modes, and the inverse cascade of energy within the quasi-geostrophic manifold, which carries the majority of energy in steady state.
The spatial homogenization of energy is achieved by inertial wave propagation, which is the fastest process in the system, and is well-described by linear inertial wave theory, even though the waves are strong and propagate on the background of a turbulent flow.
The injected energy is dominated by inertial waves with 3D wave-vectors. However, the resulting 3D flow field is a short-lived transient, whose energy is siphoned away towards the geostrophic flow. The depletion of the 3D modes occurs on a dynamical timescale determined by interaction of inertial waves with the geostrophic flow [32, 37, 40].
Energy flows directly from wave-vectors with arbitrary polar angles to quasi-geostrophic wave-vectors, bypassing intermediate ones (Fig.2). This strongly indicates that the energy transfer in the frequency (orientation) domain is not mediated by intermediate interactions or a cascade.
Once the pulse energy has reached the quasi-geostrophic manifold, it gradually flows to smaller wave-numbers in a manner consistent with an inverse cascade of energy. This observations seems consistent with dynamics analogous to the Kraichnan cascade of 2D turbulence [43, 45]. However, an analysis of the vertically resolved horizontal Fourier transform of the flow shows conclusively that the inverse cascade in Fourier space takes place in parallel with spatial propagation consistent with the linear dynamics of inertial waves. This shows that inertial waves participate in all known energy transfer processes, making the analogy between the rotating turbulence inverse cascade the Kraichnan cascade tenuous.
Some of our results are directly related to theoretical models of rotating turbulence. In this strongly-driven regime we find two nonlinear processes with different time-scales: rapid flattening and a slow inverse cascade, such observations are qualitatively consistent with theoretical predictions [36, 33, 23]. However, our data exclude energy cascade in the frequency domain (or orientation). This unambiguous result contradicts assumptions incorporated in some of theoretical models[4, 31]. In addition, to the best of our knowledge, the mediation of the inverse energy cascade by propagating waves was not discussed in theoretical modeling.
We are, therefore, left with several open questions that call for further work: Do the observed propagating modes play a central role in the inverse energy cascade, or are they 3D ”artifacts” of the inherently 2D process? Is the infinite (in ) medium case a singular limit of the problem? It is possible that the separation to 2D and 3D flow components, as well as the focusing on the exact 2D manifold, are not well determined in finite systems. We hope that further theoretical and experimental works will shed light on these important issues.
Acknowledgements.
This research was supported by the Israel Science Foundation Grant 2437/20.References
- Pedlosky et al. [1987] J. Pedlosky et al., Geophysical fluid dynamics, Vol. 710 (Springer, 1987).
- Davidson [2013] P. A. Davidson, Turbulence in rotating, stratified and electrically conducting fluids (Cambridge University Press, 2013).
- Davidson [2015] P. A. Davidson, Turbulence: an introduction for scientists and engineers (Oxford university press, 2015).
- Alexakis and Biferale [2018] A. Alexakis and L. Biferale, Cascades and transitions in turbulent flows, Physics Reports 767, 1 (2018).
- Scott [2014] J. F. Scott, Wave turbulence in a rotating channel, Journal of fluid mechanics 741, 316 (2014).
- van Kan and Alexakis [2020] A. van Kan and A. Alexakis, Critical transition in fast-rotating turbulence within highly elongated domains, Journal of Fluid Mechanics 899 (2020).
- Greenspan et al. [1968] H. P. Greenspan et al., The theory of rotating fluids (CUP Archive, 1968).
- [8] The dispersion relation for inertial waves has a symmetry with respect to the transformation and , so it is redundant to calculate the distribution of negative frequencies in time. we will assume that can be negative and is positive.
- Bordes et al. [2012] G. Bordes, F. Moisy, T. Dauxois, and P.-P. Cortet, Experimental evidence of a triadic resonance of plane inertial waves in a rotating fluid, Physics of Fluids 24, 014105 (2012).
- Brunet et al. [2020] M. Brunet, B. Gallet, and P.-P. Cortet, Shortcut to geostrophy in wave-driven rotating turbulence: the quartetic instability, Physical Review Letters 124, 124501 (2020).
- Yarom and Sharon [2014] E. Yarom and E. Sharon, Experimental observation of steady inertial wave turbulence in deep rotating flows, Nature Physics 10, 510 (2014).
- Campagne et al. [2015] A. Campagne, B. Gallet, F. Moisy, and P.-P. Cortet, Disentangling inertial waves from eddy turbulence in a forced rotating-turbulence experiment, Physical Review E 91, 043016 (2015).
- Duran-Matute et al. [2013] M. Duran-Matute, J.-B. Flór, F. S. Godeferd, and C. Jause-Labert, Turbulence and columnar vortex formation through inertial-wave focusing, Physical Review E 87, 041001 (2013).
- Cambon et al. [1997] C. Cambon, N. N. Mansour, and F. S. Godeferd, Energy transfer in rotating turbulence, Journal of Fluid Mechanics 337, 303 (1997).
- Godeferd and Moisy [2015] F. S. Godeferd and F. Moisy, Structure and dynamics of rotating turbulence: a review of recent experimental and numerical results, Applied Mechanics Reviews 67 (2015).
- Kolvin et al. [2009] I. Kolvin, K. Cohen, Y. Vardi, and E. Sharon, Energy transfer by inertial waves during the buildup of turbulence in a rotating system, Physical Review Letters 102, 014503 (2009).
- Davidson et al. [2006] P. Davidson, P. Staplehurst, and S. Dalziel, On the evolution of eddies in a rapidly rotating system, Journal of Fluid Mechanics 557, 135 (2006).
- Staplehurst et al. [2008] P. Staplehurst, P. Davidson, and S. Dalziel, Structure formation in homogeneous freely decaying rotating turbulence, Journal of Fluid Mechanics 598, 81 (2008).
- Bewley et al. [2007] G. P. Bewley, D. P. Lathrop, L. R. Maas, and K. Sreenivasan, Inertial waves in rotating grid turbulence, Physics of Fluids 19, 071701 (2007).
- Morize et al. [2005] C. Morize, F. Moisy, and M. Rabaud, Decaying grid-generated turbulence in a rotating tank, Physics of fluids 17, 095105 (2005).
- Galtier [2003] S. Galtier, Weak inertial-wave turbulence theory, Physical Review E 68, 015301 (2003).
- Nazarenko [2011] S. Nazarenko, Wave turbulence, Vol. 825 (Springer Science & Business Media, 2011).
- Smith and Waleffe [1999] L. M. Smith and F. Waleffe, Transfer of energy to two-dimensional large scales in forced, rotating three-dimensional turbulence, Physics of fluids 11, 1608 (1999).
- Monsalve et al. [2020] E. Monsalve, M. Brunet, B. Gallet, and P.-P. Cortet, Quantitative experimental observation of weak inertial-wave turbulence, Physical Review Letters 125, 254502 (2020).
- [25] Supplemental information, See Supplemental Information at URL will be inserted by publisher.
- Yarom et al. [2013] E. Yarom, Y. Vardi, and E. Sharon, Experimental quantification of inverse energy cascade in deep rotating turbulence, Physics of Fluids 25, 085105 (2013).
- Buzzicotti et al. [2018] M. Buzzicotti, P. Clark Di Leoni, and L. Biferale, On the inverse energy transfer in rotating turbulence, The European Physical Journal E 41, 1 (2018).
- Sen et al. [2012] A. Sen, P. D. Mininni, D. Rosenberg, and A. Pouquet, Anisotropy and nonuniversality in scaling laws of the large-scale energy spectrum in rotating turbulence, Physical Review E 86, 036319 (2012).
- Baroud et al. [2003] C. N. Baroud, B. B. Plapp, H. L. Swinney, and Z.-S. She, Scaling in three-dimensional and quasi-two-dimensional rotating turbulent flows, Physics of Fluids 15, 2091 (2003).
- Lamriben et al. [2011] C. Lamriben, P.-P. Cortet, and F. Moisy, Direct measurements of anisotropic energy transfers in a rotating turbulence experiment, Physical review letters 107, 024503 (2011).
- Campagne et al. [2014] A. Campagne, B. Gallet, F. Moisy, and P.-P. Cortet, Direct and inverse energy cascades in a forced rotating turbulence experiment, Physics of Fluids 26, 125112 (2014).
- di Leoni and Mininni [2016] P. C. di Leoni and P. D. Mininni, Quantifying resonant and near-resonant interactions in rotating turbulence, Journal of Fluid Mechanics 809, 821 (2016).
- Le Reun et al. [2020] T. Le Reun, B. Gallet, B. Favier, and M. Le Bars, Near-resonant instability of geostrophic modes: beyond greenspan’s theorem, Journal of Fluid Mechanics 900 (2020).
- Bellet et al. [2006] F. Bellet, F. Godeferd, J. Scott, and C. Cambon, Wave turbulence in rapidly rotating flows, Journal of Fluid Mechanics 562, 83 (2006).
- Gallet [2015] B. Gallet, Exact two-dimensionalization of rapidly rotating large-reynolds-number flows, Journal of Fluid Mechanics 783, 412 (2015).
- Nazarenko and Schekochihin [2011] S. V. Nazarenko and A. A. Schekochihin, Critical balance in magnetohydrodynamic, rotating and stratified turbulence: towards a universal scaling conjecture, Journal of Fluid Mechanics 677, 134 (2011).
- Yarom et al. [2017] E. Yarom, A. Salhov, and E. Sharon, Experimental quantification of nonlinear time scales in inertial wave rotating turbulence, Physical Review Fluids 2, 122601 (2017).
- Le Reun et al. [2017] T. Le Reun, B. Favier, A. J. Barker, and M. Le Bars, Inertial wave turbulence driven by elliptical instability, Physical Review Letters 119, 034502 (2017).
- Clark Di Leoni et al. [2014] P. Clark Di Leoni, P. J. Cobelli, P. D. Mininni, P. Dmitruk, and W. Matthaeus, Quantification of the strength of inertial waves in a rotating turbulent flow, Physics of Fluids 26, 035106 (2014).
- Salhov et al. [2019] A. Salhov, E. Yarom, and E. Sharon, Measurements of inertial wave packets propagating within steady rotating turbulence, EPL (Europhysics Letters) 125, 24003 (2019).
- vid [2023a] Online video: Energy density in time, shown on three planes of the volume and on a vertical plane (2023a).
- vid [2023b] Online video: excess energy spectrum, on the plane (2023b).
- Kraichnan [1967] R. H. Kraichnan, Inertial ranges in two-dimensional turbulence, The Physics of Fluids 10, 1417 (1967).
- Frisch and Sulem [1984] U. Frisch and P.-L. Sulem, Numerical simulation of the inverse cascade in two-dimensional turbulence, The Physics of fluids 27, 1921 (1984).
- Tabeling [2002] P. Tabeling, Two-dimensional turbulence: a physicist approach, Physics reports 362, 1 (2002).
- Paret and Tabeling [1997] J. Paret and P. Tabeling, Experimental observation of the two-dimensional inverse energy cascade, Physical review letters 79, 4162 (1997).