The 33 M⊙ black hole Gaia BH3 is part of the disrupted ED-2 star cluster
Abstract
Context. The Gaia Collaboration has recently reported the detection of a 33 M⊙ black hole in a wide binary system located in the Solar neighbourhood.
Aims. Here we explore the relationship between this black hole, known as Gaia BH3, and the nearby ED-2 halo stellar stream.
Methods. We study the orbital characteristics of the Gaia BH3 binary and present measurements of the chemical abundances of ED-2 member stars derived from high-resolution spectra obtained with the VLT.
Results. We find that the Galactic orbit of the Gaia BH3 system and its metallicity are entirely consistent with being part of the ED-2 stream. The characteristics of the stream, particularly its negligible spread in metallicity and in other chemical elements as well as its single stellar population, suggest that it originated from a disrupted star cluster of low mass. Its age is comparable to that of the globular cluster M92 that has been estimated to be as old as the Universe.
Conclusions. This is the first black hole unambiguously associated with a disrupted star cluster. We infer a plausible mass range for the cluster to be relatively narrow, between and . This implies that the black hole could have formed directly from the collapse of a massive very-metal-poor star, but that the alternative scenario of binary interactions inside the cluster environment also deserves to be explored.
Key Words.:
Stars: black holes – Stars: Population II - Stars: abundances - Galaxy: kinematics and dynamics – Galaxy: halo - globular clusters1 Introduction
The discovery of a 33 black hole (BH) was recently reported in the Gaia DR4 pre-release data (Gaia Collaboration: Panuzzo et al. 2024). This BH is in a wide binary system with a period of 11.6 years. Its visible companion (Gaia DR3 source_id 4318465066420528000) is a known high-proper motion star that is part of the Galactic halo. The low metallicity reported by Gaia Collaboration: Panuzzo et al. (2024) confirms the association with this Galactic component.
This discovery is especially exciting in light of the enormous advances made in the field of gravitational waves in recent years. Several tens of detections of gravitational waves due to merging binary BHs have been reported by the LIGO/VIRGO/KAGRA collaboration (Abbott et al. 2023a). The modelling of these events has revealed that the binary BH mass distribution follows a power-law, with peaks at chirp masses of and (Abbott et al. 2023b). The origin of the heavier BHs is not well understood. Because very massive stars of solar metallicity lose much of their mass via stellar winds, it has been argued that many of these BH could reside in metal-poor environments such as dwarf galaxies. An alternative pathway could be dynamical interactions in dense star clusters which may lead to hierarchical growth of BH via BH binary mergers (see e.g. Antonini & Gieles 2020; Fragione & Rasio 2023). In this context, it is important to shed more light on the origin of Gaia BH3.
Since Gaia BH3 has a very retrograde and relatively loosely bound orbit, Gaia Collaboration: Panuzzo et al. (2024) have argued for a possible association with the Sequoia accretion event (Myeong et al. 2019) identified using Gaia DR2 data. The better astrometry available in the subsequent Gaia (E)DR3, has however revealed that this region of integrals of motion (IoM) space, e.g. energy and angular momenta, contains several additional substructures besides Sequoia (e.g. Ruiz-Lara et al. 2022; Dodd et al. 2023). Some of these substructures appear to have distinct chemistry (Matsuno et al. 2019; Naidu et al. 2020).
Among the smaller of such retrograde structures first identified by Dodd et al. (2023) we highlight ED-2. This substructure has been shown to form a dynamically cold stellar stream crossing the solar neighbourhood (Balbinot et al. 2023, B23). Because of the dynamical properties of ED-2 (a cold but relatively wide stream) it was suggested that it could have originated from an ultra-faint dwarf galaxy. On the other hand, the tight distribution of its member stars in color-magnitude space and the relatively narrow (rms dex) metallicity distribution measured from LAMOST DR3 low resolution spectra (Li et al. 2018) for 7 stars, favoured a star cluster origin. Interestingly the mean metallicity of ED-2 stars is , suspiciously close to that of the companion of Gaia BH3.
In this Letter we demonstrate that Gaia BH3 is indeed associated with the cold stellar stream ED-2 and that ED-2 stems from a low-mass disrupted star cluster. Sec. 2 focuses on the dynamical association of Gaia BH3 with ED-2, and Sec. 3 presents chemical abundances from follow-up X-Shooter and UVES spectra of ED-2 members111These data had been requested in proposals 0111.D-0263(A) (PI:Dodd) and 112.25ZW.001 (PI:Balbinot), and hence submitted before the analyses that led to the discovery of Gaia BH3. The co-Is of both proposals are co-authors of this paper who are not members of the Gaia collaboration.. In Sec. 4 we discuss the implications of our findings and in Sec. 5 we present our conclusions.
2 Kinematics and stellar population
Fig. 1 shows the extinction corrected colour-magnitude diagram (CMD) for all ED-2 members (see B23 for details). The cross indicates the location of the Gaia BH3 companion star, (which due to the high RUWE value reported in Gaia (E)DR3, was left out of the analysis by Dodd et al. 2023). The error bars in this figure account for the effects of distance and extinction uncertainty. All ED-2 known member stars are within 2.5 kpc from the Sun and their relative distance errors are smaller than 20%. We compute the extinction at (where is the distance error) to conservatively estimate the error introduced in the 3D extinction maps of Lallement et al. (2022). These uncertainties are summed in quadrature with the photometric uncertainty. For comparison, we also plot members of the globular cluster M92 in the background. These were selected using the method of Vasiliev & Baumgardt (2021) and are at least 4′ away from the M92’s centre, to avoid crowding. The CMD of M92 has been extinction corrected following the recipe described above.
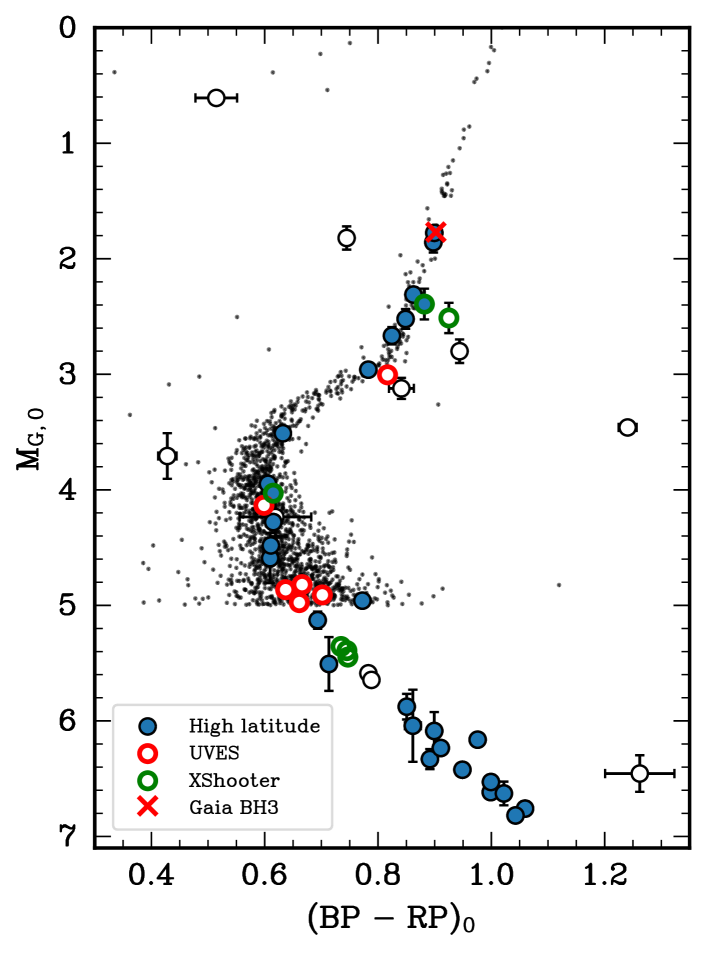
This comparison shows that ED-2 stars match well the CMD of M92, which is known to be one of the oldest and most metal-poor ([Fe/H]) globular clusters (GC) in the Galaxy (Ying et al. 2023), with an age of 13.80 0.75 Gyr. Since the main-sequence turn-off (MSTO) seems to be slightly fainter, ED-2 could potentially be even older, however, this is supported by only a single MSTO star in ED-2. In any case, we may conclude from this comparison that ED-2 formed more than 13 Gyr ago.
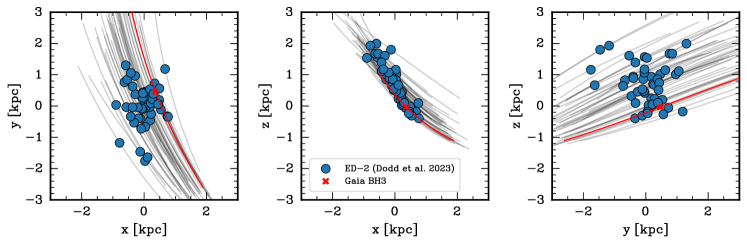
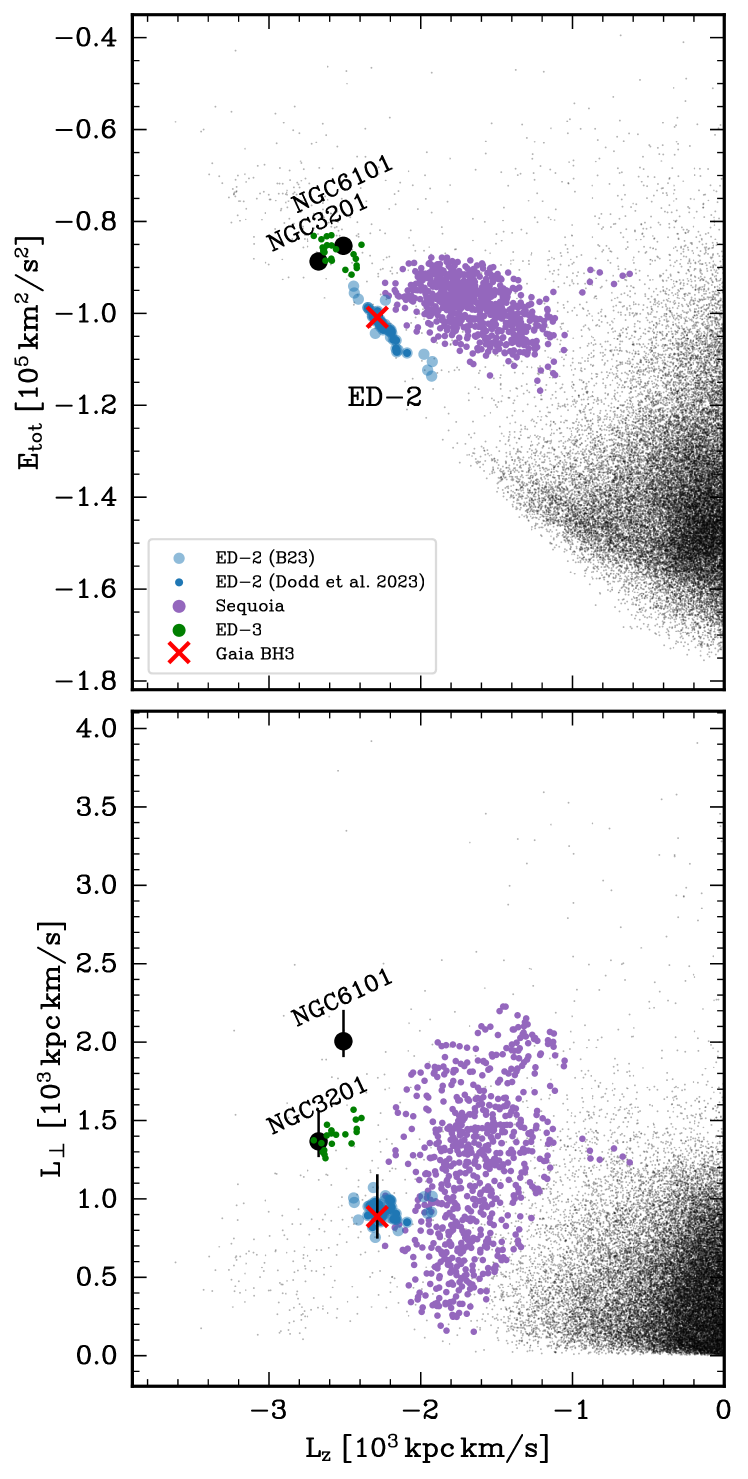
Figure 2 shows the distribution of ED-2 stars in IoM space: -angular momentum vs. energy (top panel), and vs. the perpendicular component of the angular momentum (bottom panel). The location of Gaia BH3 is indicated with a cross and falls right on top of the ED-2 stream members. Note that the values of the IoM were computed in the Milky Way potential of Dodd et al. (2023), which is slightly different from that used in Gaia Collaboration: Panuzzo et al. (2024). The Mahalanobis distance222The Mahalanobis distance between BH3 and ED-2 (Sequoia) is defined as where denotes the location of BH3 in IoM space and and are the mean and covariance matrix of the ED-2 (Sequoia) stars. between the centre of ED-2 and Gaia BH3 is 0.942, while that between Sequoia and Gaia BH3 is 2.718. In other words, only 17% of the members of ED-2 are closer to its centre than Gaia BH3, while it is in the outskirts of Sequoia as 94% of its stars have a smaller distance. This makes it much more likely that Gaia BH3 is associated to ED-2 than to Sequoia.
This is further illustrated by the trajectories followed by the stars in ED-2 and Gaia BH3 shown in Fig. 3, where there is no noticeable distinction between the different objects. It is interesting that BH3 is not at the centre of the distribution of stars. Whether this is real or due to incompleteness in the sample (i.e. the distance limit and the magnitude limit of the RVS dataset) should be scrutinised in-depth in further studies.
Given the size of the ED-2 structure in IoM space, which is rather comparable to that of other globular clusters, such as NCGC3201 and NGC6101 also shown in Fig. 2, we tentatively conclude that ED-2 stems from a GC-like progenitor. The good fit obtained from a single stellar population further supports this conclusion.
3 Chemical abundances
We obtained spectra for 3 stars as part of the follow-up of the ED-2 stream in period 111 (April – September 2023; proposal submitted in September 2022) with the optical spectrograph, UVES (Dekker et al. 2000) mounted at the Very Large Telescope (VLT) of the European Southern Observatory (ESO). We have also used ESO archival data for another ED-2 member, source_ID 4479226310758314496. Additionally, we observed 6 ED-2 core members with X-Shooter (Vernet et al. 2011) at the VLT in period 112 (October 2023 – March 2024; proposal submitted in March 2023). In all cases, we used the phase-3 data products provided by ESO for further analysis. In the Appendix we provide details of the observational set-ups, and we also describe the procedure used to derive the stellar parameters and chemical abundances of the UVES stars and the [Fe/H] for the X-Shooter targets. We list the results in Table 5 and Table 2 for the stars observed with UVES and X-shooter respectively.
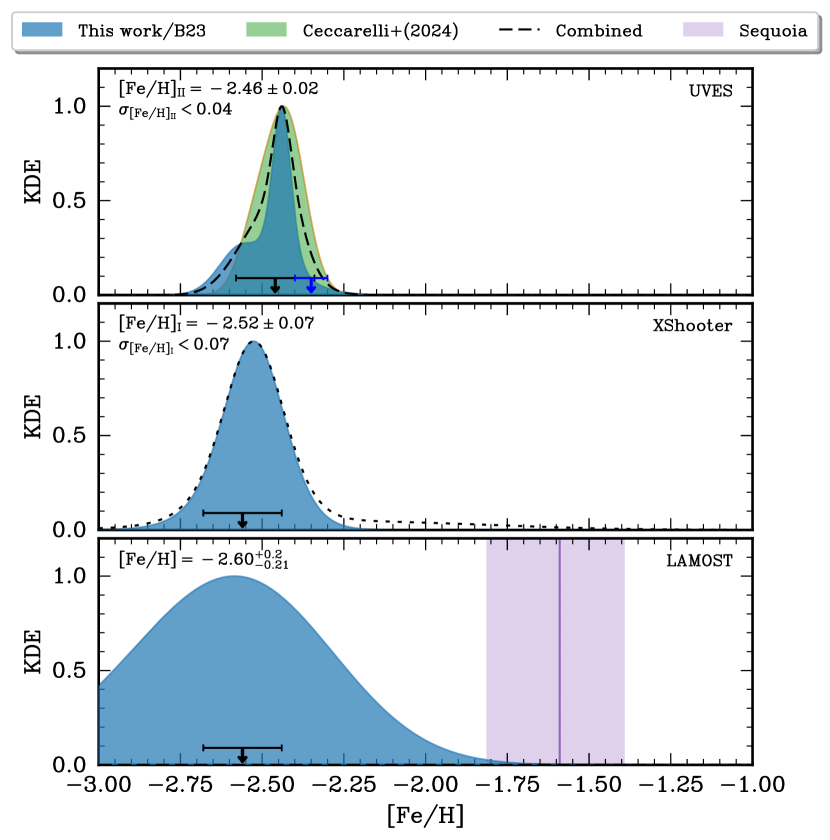
Fig. 4 shows the metallicity distribution derived for the ED-2 stars in our programs. The top panel corresponds to the UVES targets whose metallicity is measured from the Fe II lines, which are more reliable due to their small sensitivity to the adopted stellar parameters and non-LTE effects. The middle panels are for the X-Shooter stars, while the bottom panel shows the distribution derived by B23 compared to that of Sequoia as defined by Dodd et al. (2023), both using LAMOST spectra. The black arrow and errorbar show Gaia BH3 visible companion’s metallicity and its uncertainty. This figure confirms, now on the basis of the metallicity, that the black hole is a member of ED-2, and has a negligible probability to be part of Sequoia.
We measure the mean metallicity and metallicity dispersion () of ED-2 in the UVES and X-Shooter samples assuming a simple normal distribution with dispersion = + , i.e. the sum in quadrature of an intrinsic dispersion and the metallicity uncertainty in each -th data point. We use this distribution to maximize the likelihood of our model using emcee (Foreman-Mackey et al. 2013). For the UVES sample, we find a best-fit metallicity of and a metallicity dispersion . Similarly, for the X-Shooter sample, we find a best-fit metallicity of and a metallicity dispersion 333Although the star with source_ID 3757312745743087232 is more metal-rich than the remainder of the sample (see Table 2), it has very large uncertainties, and its inclusion has no effect in the derived mean and spread in metallicity.. The uncertainties in metallicity were computed from the standard deviation of the posterior distribution, while the upper limits in are the 67% quantile of the posterior. We thus find that the intrinsic metallicity dispersion of ED-2 is consistent with zero. This favours a star cluster origin as opposed to a dwarf galaxy, as even ultra-faint dwarfs have a scatter of at least 0.3 dex (Simon 2019).
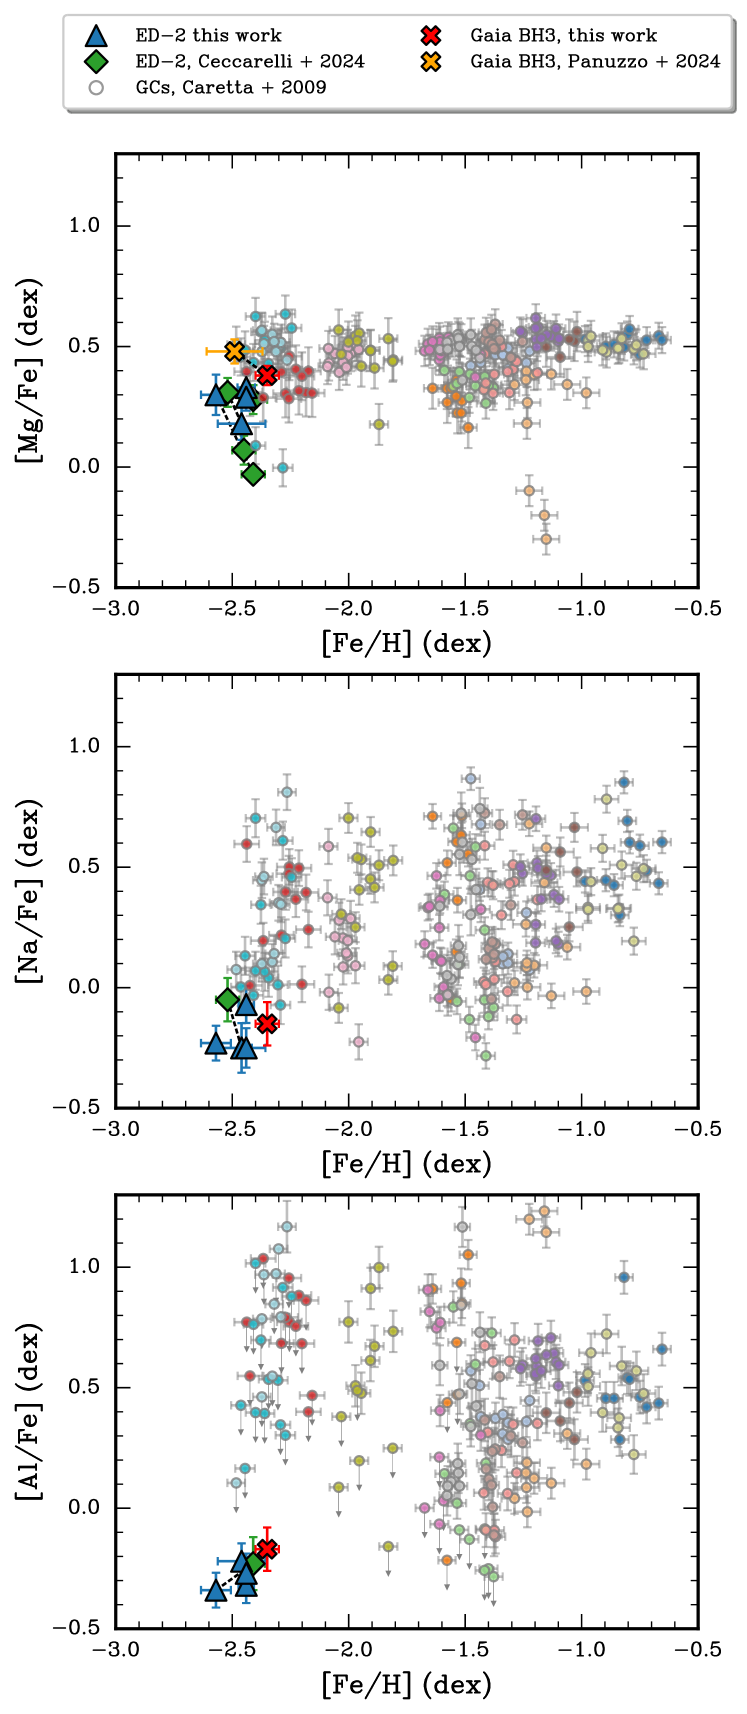
Fig. 5 shows the abundances of Mg, Na and Al with respect to Fe for the stars observed with UVES (blue triangles). The scatter in all elements is very small, again indicating that the ED-2 originated in a star cluster. Also the abundances measured for other ED-2 stars by Ceccarelli et al. (2024, green diamonds) show very comparable values. The measurements for the companion star of Gaia BH3 as provided by Gaia Collaboration: Panuzzo et al. (2024, in orange) and by our own analysis (in red) are shown with a cross symbol, and are fully consistent with those of the ED-2 stars. Also its measured [Eu/Fe]=0.52 is in excellent agreement with that of another star in ED-2, for which we could measure [Eu/Fe] = 0.61, a value that supports similar amounts of r-process enhancement across the system. ED-2’s mean abundance of [Ba/Fe] (and its small dispersion of dex) is consistent with that of other halo stars, but different from that seen in ultra-faint dwarf galaxies, which typically depict much larger or much lower values (Ji et al. 2019). In Fig. 5 we plotted for comparison the abundances of a set of GCs from Carretta et al. (2009, all of which are more metal-rich), which reveal a similar scatter in [Mg/Fe] as ED-2 members but larger in Na and Al.
The low [Al/Fe] and high [Mg/Mn] of the ED-2 stars and of the companion star of Gaia BH3 (see Table 5) places ED-2 members in a region of abundance-space that is referred to as “chemically unevolved” (Hawkins et al. 2015; Fernandes et al. 2023). This could hint at an accretion origin of ED-2 given also its highly retrograde orbit. However, care must be taken when interpreting this chemical space since its validity as an indicator of a possible accretion origin has not been firmly established for star clusters.
4 Discussion
Having established that Gaia BH3 formed in a star cluster, we now explore possible formation channels. We also attempt to infer some properties of the ED-2 parent cluster. Note that these findings naturally explain the “normal” chemical composition of its accompanying star, in the sense that the binary could easily have formed in the cluster after the BH was born.
The most straightforward formation scenario for BHs is through the collapse of a very massive star. The mass of such a BH is dictated by the star’s mass at the end of its evolution. Due to the details of the mass-loss process, this can differ significantly from its initial value. Using the single-star initial-final mass relations (IFMR) from Fryer et al. (2012) implemented in ssptools 444https://github.com/SMU-clusters/ssptools (Balbinot & Gieles 2018; Dickson et al. 2023) and a Kroupa initial mass function, we can infer how many stellar BHs of a given mass are likely to form as a function of the cluster mass. We find that the minimum mass for a star cluster to host at least 1 stellar BH of the size of Gaia BH3 or higher is . In this case, Gaia BH3 would be a first generation BH.
Alternative pathways to produce very massive BHs have been proposed that require binary evolution and dynamical hardening of these binary systems. These processes take place in dense stellar systems such as GCs (see e.g. Portegies Zwart & McMillan 2000), and see also the recent work on young star clusters by Rastello et al. (2023); Tanikawa et al. (2024); Di Carlo et al. (2024). Due to their stochastic nature, such processes can produce BH with a wide range of masses (see e.g. Antonini & Gieles 2020). In this case, Gaia BH3 could have formed via the mergers of subsequent generations of BHs.
The scatter in the Na and Al abundances seen in GCs is indicative of multiple stellar populations and has a dependence on both mass and metallicity (see e.g. Gratton et al. 2019). Fnx I, a GC in the Fornax dwarf spheroidal, has [Fe/H], and does show multiple populations, as well as scatter in [Na/Fe] (Letarte et al. 2006), and its initial mass has been estimated to be 4.2 by de Boer & Fraser (2016). Therefore, the (near) lack of such a scatter for ED-2 suggests its parent cluster was lighter in mass than Fnx I. We may also use the relationship by Pancino et al. (2017) between the spread in [Al/Fe], the mean [Fe/H] of the cluster and its mass: By randomly drawing [Al/Mg] for each star within the uncertainties, we obtain a distribution of [Al/Mg], and considering the uncertainties in the coefficients in a similar fashion, we can infer a distribution of possible cluster masses. We find a median value of , with the 25% and 75% quantiles of being 1.68 and 4.33 respectively. If the scatter is only due to errors, this estimate would be an upper limit. It is however based on an extrapolation of a relation determined for Galactic clusters whose metallicities are all higher than ED-2’s, and whose present-day masses could differ from their initial values by at least a factor of 2 (Anders et al. 2009). Nevertheless, it is reassuring that this upper limit is consistent with that provided by the comparison to Fnx I.
Further support for ED-2 having been a low-mass star cluster comes from the fact that the Gaia BH3 system is a relatively wide binary, with a period of 11.6 yr. Such long period binaries do not survive in massive GCs because they are either quickly disrupted or become tighter because of interactions within such systems (Ivanova et al. 2005, although its low mass-ratio enhances the chances of survival). Unlike NGC6101 or NGC3201, the two GC with similar orbits plotted in Fig. 2, ED-2 did not manage to survive as a star cluster until the present day. This could be due to its lower mass or a lower density. But also the retention of Gaia BH3 by the ED-2 cluster could have contributed in speeding-up its disruption (Gieles et al. 2021).
5 Conclusions
In this Letter, we have shown that the 33 black hole Gaia BH3 is associated to the ED-2 retrograde halo stellar stream. The BH’s orbit around the Galaxy is indistinguishable from that of ED-2 members. Using high-resolution spectra of ED-2 stars, we have determined that ED-2’s mean metallicity is entirely consistent with that of the companion of Gaia BH3, as are other chemical elemental abundances such as [Mg/Fe], [Eu/Fe] and [Ba/Fe]. Furthermore, we have shown that the metallicity spread in ED-2 is consistent with zero, indicating that it stems from a disrupted star cluster. This is entirely in-line with its colour-magnitude diagram, which is very well fit by an extremely old single stellar population, similar to that of the GC M92, indicating that the progenitor of Gaia BH3 formed more than 13 Gyr ago. The (near) lack of scatter in Na and Al suggests that ED-2’s parent system was a small cluster with mass smaller than . This would leave a small window for Gaia BH3 to be the direct result of the collapse of a massive star, since we have found that such a heavy BH can only form in a system more massive than . To shed more light on its formation channels, sophisticated dynamical models of the ED-2 parent cluster, including stellar evolution and binary interactions, and using as boundary conditions those inferred in this paper (e.g. mass range, metallicity, and orbit) are needed. Furthermore, the mapping of the ED-2 stream beyond the Solar neighbourhood would allow a reliable and independent determination of the initial cluster mass. Finally, detailed chemical abundances for more of its members would put a tighter constraint on the lack of a spread of light elements and constrain further the evolution of the system.
Acknowledgements.
The authors would like to thank Elena Pancino and Mark Gieles for the insightful discussion on GC chemistry and BH evolution, and Gijs Nelemans for useful references. We acknowledge support from a Spinoza prize from the Netherlands Organisation for Scientific Research (NWO). TM is supported by a Gliese Fellowship at the Zentrum für Astronomie, University of Heidelberg, Germany. This study was supported by the Klaus Tschira Foundation. We have made use of data from the European Space Agency (ESA) mission Gaia (https://www.cosmos.esa.int/gaia), processed by the Gaia Data Processing and Analysis Consortium (DPAC, https://www.cosmos.esa.int/web/gaia/dpac/consortium). Funding for the DPAC has been provided by national institutions, in particular the institutions participating in the Gaia Multilateral Agreement. Non-public data underlying this article will be shared on reasonable request to the authors. Based on observations made with ESO Telescopes at the La Silla Paranal Observatory under programme ID 112.25ZW.001 (PI: Balbinot), 111.2537.001 (PI: Dodd), and 106.21JJ.001 (PI: Matsuno). The following software packages where used in this publication: Astropy (Astropy Collaboration et al. 2013, 2018), dustmaps (Green 2018), IPython (Pérez & Granger 2007), matplotlib (Hunter 2007), numpy (Walt et al. 2011), scipy (Jones et al. 2001–), vaex (Breddels & Veljanoski 2018)References
- Abbott et al. (2023a) Abbott, R., Abbott, T. D., Acernese, F., et al. 2023a, Physical Review X, 13, 041039
- Abbott et al. (2023b) Abbott, R., Abbott, T. D., Acernese, F., et al. 2023b, Physical Review X, 13, 011048
- Anders et al. (2009) Anders, P., Lamers, H. J. G. L. M., & Baumgardt, H. 2009, A&A, 502, 817
- Andrae et al. (2023) Andrae, R., Rix, H.-W., & Chandra, V. 2023, arXiv e-prints, arXiv:2302.02611
- Antonini & Gieles (2020) Antonini, F. & Gieles, M. 2020, MNRAS, 492, 2936
- Astropy Collaboration et al. (2018) Astropy Collaboration, Price-Whelan, A. M., Sip őcz , B. M., et al. 2018, AJ, 156, 123
- Astropy Collaboration et al. (2013) Astropy Collaboration, Robitaille, T. P., Tollerud, E. J., et al. 2013, A&A, 558, A33
- Balbinot & Gieles (2018) Balbinot, E. & Gieles, M. 2018, MNRAS, 474, 2479
- Balbinot et al. (2023) Balbinot, E., Helmi, A., Callingham, T., et al. 2023, A&A, 678, A115
- Breddels & Veljanoski (2018) Breddels, M. A. & Veljanoski, J. 2018, A&A, 618, A13
- Carretta et al. (2009) Carretta, E., Bragaglia, A., Gratton, R., & Lucatello, S. 2009, A&A, 505, 139
- Casagrande & VandenBerg (2014) Casagrande, L. & VandenBerg, D. A. 2014, MNRAS, 444, 392
- Ceccarelli et al. (2024) Ceccarelli, E., Massari, D., Mucciarelli, A., et al. 2024, A&A, 684, A37
- Clementini et al. (2023) Clementini, G., Ripepi, V., Garofalo, A., et al. 2023, A&A, 674, A18
- de Boer & Fraser (2016) de Boer, T. J. L. & Fraser, M. 2016, A&A, 590, A35
- Dekker et al. (2000) Dekker, H., D’Odorico, S., Kaufer, A., Delabre, B., & Kotzlowski, H. 2000, in Society of Photo-Optical Instrumentation Engineers (SPIE) Conference Series, Vol. 4008, Optical and IR Telescope Instrumentation and Detectors, ed. M. Iye & A. F. Moorwood, 534–545
- Di Carlo et al. (2024) Di Carlo, U. N., Agrawal, P., Rodriguez, C. L., & Breivik, K. 2024, ApJ, 965, 22
- Dickson et al. (2023) Dickson, N., Hénault-Brunet, V., Baumgardt, H., Gieles, M., & Smith, P. J. 2023, MNRAS, 522, 5320
- Dodd et al. (2023) Dodd, E., Callingham, T. M., Helmi, A., et al. 2023, A&A, 670, L2
- Fernandes et al. (2023) Fernandes, L., Mason, A. C., Horta, D., et al. 2023, MNRAS, 519, 3611
- Foreman-Mackey et al. (2013) Foreman-Mackey, D., Hogg, D. W., Lang, D., & Goodman, J. 2013, PASP, 125, 306
- Fragione & Rasio (2023) Fragione, G. & Rasio, F. A. 2023, ApJ, 951, 129
- Fryer et al. (2012) Fryer, C. L., Belczynski, K., Wiktorowicz, G., et al. 2012, ApJ, 749, 91
- Gaia Collaboration: Panuzzo et al. (2024) Gaia Collaboration: Panuzzo, Mazeh, T., & et al., . 2024, A&A
- Gieles et al. (2021) Gieles, M., Erkal, D., Antonini, F., Balbinot, E., & Peñarrubia, J. 2021, Nature Astronomy, 5, 957
- Gratton et al. (2019) Gratton, R., Bragaglia, A., Carretta, E., et al. 2019, A&A Rev., 27, 8
- Green (2018) Green, G. 2018, The Journal of Open Source Software, 3, 695
- Green et al. (2019) Green, G. M., Schlafly, E., Zucker, C., Speagle, J. S., & Finkbeiner, D. 2019, ApJ, 887, 93
- Gustafsson et al. (2008) Gustafsson, B., Edvardsson, B., Eriksson, K., et al. 2008, A&A, 486, 951
- Hawkins et al. (2015) Hawkins, K., Jofré, P., Masseron, T., & Gilmore, G. 2015, MNRAS, 453, 758
- Hunter (2007) Hunter, J. D. 2007, Computing in Science and Engineering, 9, 90
- Ivanova et al. (2005) Ivanova, N., Belczynski, K., Fregeau, J. M., & Rasio, F. A. 2005, MNRAS, 358, 572
- Ji et al. (2019) Ji, A. P., Simon, J. D., Frebel, A., Venn, K. A., & Hansen, T. T. 2019, ApJ, 870, 83
- Jones et al. (2001–) Jones, E., Oliphant, T., Peterson, P., et al. 2001–, SciPy: Open source scientific tools for Python
- Kupka et al. (2011) Kupka, F., Dubernet, M. L., & VAMDC Collaboration. 2011, Baltic Astronomy, 20, 503
- Kurucz (2005) Kurucz, R. L. 2005, Memorie della Societa Astronomica Italiana Supplementi, 8, 14
- Lallement et al. (2022) Lallement, R., Vergely, J. L., Babusiaux, C., & Cox, N. L. J. 2022, A&A, 661, A147
- Letarte et al. (2006) Letarte, B., Hill, V., Jablonka, P., et al. 2006, A&A, 453, 547
- Li et al. (2018) Li, H., Tan, K., & Zhao, G. 2018, ApJS, 238, 16
- Lind et al. (2022) Lind, K., Nordlander, T., Wehrhahn, A., et al. 2022, A&A, 665, A33
- M. Kovalev et al. (2018) M. Kovalev, S. Brinkmann, M. Bergemann, & MPIA IT-department. 2018, NLTE MPIA web server, [Online]. Available: http://nlte.mpia.de Max Planck Institute for Astronomy, Heidelberg.
- Matsuno et al. (2019) Matsuno, T., Aoki, W., & Suda, T. 2019, ApJ, 874, L35
- Mucciarelli et al. (2021) Mucciarelli, A., Bellazzini, M., & Massari, D. 2021, A&A, 653, A90
- Myeong et al. (2019) Myeong, G. C., Vasiliev, E., Iorio, G., Evans, N. W., & Belokurov, V. 2019, MNRAS, 488, 1235
- Naidu et al. (2020) Naidu, R. P., Conroy, C., Bonaca, A., et al. 2020, ApJ, 901, 48
- Pancino et al. (2017) Pancino, E., Romano, D., Tang, B., et al. 2017, A&A, 601, A112
- Pérez & Granger (2007) Pérez, F. & Granger, B. E. 2007, Computing in Science and Engineering, 9, 21
- Portegies Zwart & McMillan (2000) Portegies Zwart, S. F. & McMillan, S. L. W. 2000, ApJ, 528, L17
- Rastello et al. (2023) Rastello, S., Iorio, G., Mapelli, M., et al. 2023, MNRAS, 526, 740
- Ruiz-Lara et al. (2022) Ruiz-Lara, T., Matsuno, T., Lövdal, S. S., et al. 2022, A&A, 665, A58
- Sbordone et al. (2004) Sbordone, L., Bonifacio, P., Castelli, F., & Kurucz, R. L. 2004, Memorie della Societa Astronomica Italiana Supplementi, 5, 93
- Schlegel et al. (1998) Schlegel, D. J., Finkbeiner, D. P., & Davis, M. 1998, ApJ, 500, 525
- Simon (2019) Simon, J. D. 2019, ARA&A, 57, 375
- Sneden (1973) Sneden, C. A. 1973, PhD thesis, University of Texas, Austin
- Tanikawa et al. (2024) Tanikawa, A., Cary, S., Shikauchi, M., Wang, L., & Fujii, M. S. 2024, MNRAS, 527, 4031
- Vasiliev & Baumgardt (2021) Vasiliev, E. & Baumgardt, H. 2021, MNRAS, 505, 5978
- Vernet et al. (2011) Vernet, J., Dekker, H., D’Odorico, S., et al. 2011, A&A, 536, A105
- Walt et al. (2011) Walt, S. v. d., Colbert, S. C., & Varoquaux, G. 2011, Computing in Science and Engg., 13, 22
- Ying et al. (2023) Ying, J. M., Chaboyer, B., Boudreaux, E. M., et al. 2023, AJ, 166, 18
Appendix A Derivation of stellar parameters and chemical abundances of ED-2 stars
We obtained spectra for 3 stars as part of the follow-up of the ED-2 stream in period 111 (April – September 2023; proposal submitted in September 2022; program 0111.D-0263(A), PI:Dodd) with the optical spectrograph, UVES mounted at the Very Large Telescope (VLT) of the European Southern Observatory. The observations were performed with UVES in Dichroic mode adopting the standard settings Dic 1 Blue Arm CD2 390 (326–454 nm) and Dic 1 Red Arm CD3 580 (476–684 nm) and with the 0.7” slit width, thus yielding a resolution of , and S/N 15 for the Blue Arm and S/N30 for the Red Arm on average. We have also used ESO archival data from the programs 0109.B-0522(A) and 167.D-0173(A), for another ED-2 member, source_ID 4479226310758314496. Additionally, we observed 7 ED-2 stars with X-Shooter at the VLT in period 112 (October 2023 – March 2024; proposal submitted in March 2023; program 112.25ZW.001; PI: Balbinot). In all cases, we used the phase 3 data products provided by ESO for further analysis.
For the UVES spectra we derived the chemical abundances of the stars using the 1D LTE spectral synthesis code MOOG (Sneden 1973) with the grid of MARCS model atmospheres (Gustafsson et al. 2008). Stellar parameters ( and ) were determined from dereddened photometry and astrometry; was obtained from the color using the relation from Mucciarelli et al. (2021), and was obtained from the magnitude together with the bolometric correction of Casagrande & VandenBerg (2014) and an assumption of a mass of . The extinction was taken from Green et al. (2019) where available and Schlegel et al. (1998) otherwise. We measured abundances of Mg and Fe through equivalent widths analysis and of Na, Al, Mn, Ba, and Eu through spectral synthesis with hyperfine structure splitting included, and applied non-LTE corrections of Lind et al. (2022) to the Na and Al abundances. We simply averaged the line-by-line abundances to obtain the final abundance of each element. We estimate the uncertainties from the sample standard deviation of the line-by-line abundances () and the number of lines () as when ; otherwise, we replace the with that of neutral iron. We additionally consider the uncertainties due to the stellar parameters. We report the measured abundances in Table 5.
For the X-Shooter spectra, we initially stack individual radial velocity corrected exposures. We assume atmospheric parameters from Andrae et al. (2023), with the exception of star 3757312745743087232, where Gaia XP spectra was used instead. We synthesised H and H non-local thermodynamic equilibrium (NLTE) line profiles using the tools provided by M. Kovalev et al. (2018). We find a that the adopted values for Teff and (g) adequately reproduce the wings of the Balmer lines. The spectra for each star was normalized assuming a = -2.5 template in the range between 330nm to 1100nm. Finally, while keeping the atmospheric parameters constant we derived Fe abundances using the SYNTHE transfer code (Sbordone et al. 2004), assuming the ATLAS 9 models (Kurucz 2005), and atomic data from Kupka et al. (2011). We do so by minimising the between observed and synthetic fluxes around a set of selected Fe features. We report the Fe abundances and their associated uncertainty in Table 2.
| source_id | |||||||||||
|---|---|---|---|---|---|---|---|---|---|---|---|
| – | [K] | – | – | – | – | – | – | – | – | ||
| 4245522468554091904 | 6657 | 4.30 | 1.68 | -2.48 0.05 | -2.46 0.10 | -0.25 0.10 | 0.18 0.07 | -0.22 0.07 | -0.45 0.12 | -0.13 0.15 | |
| 4479226310758314496 | 5974 | 4.53 | 1.12 | -2.70 0.05 | -2.57 0.06 | -0.23 0.07 | 0.30 0.08 | -0.34 0.07 | -0.52 0.09 | -0.35 0.10 | |
| 6632335060231088896 | 5620 | 3.60 | 1.32 | -2.54 0.05 | -2.44 0.04 | -0.07 0.08 | 0.33 0.06 | -0.32 0.07 | -0.41 0.06 | -0.17 0.08 | 0.61 0.08 |
| 6746114585056265600 | 6110 | 4.55 | 1.28 | -2.57 0.05 | -2.44 0.02 | -0.25 0.08 | 0.29 0.06 | -0.27 0.08 | -0.43 0.06 | -0.24 0.09 | |
| 4318465066420528000 a𝑎aa𝑎aWe note that the difference between the two studies is due to different extinction maps used and is responsible for the relatively large difference in . The differences in the other ratios are likely due to systematic errors that are not accounted for in the quoted uncertainties, as the abundance ratios are rather insensitive to the choice of . Sources for such systematic uncertainties include the use of different linelists, radiative transfer codes, and atmospheric models. | 5445 | 3.04 | 1.60 | -2.33 0.05 | -2.35 0.05 | -0.15 0.09 | 0.38 0.04 | -0.17 0.09 | -0.14 0.10 | -0.04 0.10 | 0.58 0.10 |
| 4318465066420528000∗a𝑎aa𝑎aWe note that the difference between the two studies is due to different extinction maps used and is responsible for the relatively large difference in . The differences in the other ratios are likely due to systematic errors that are not accounted for in the quoted uncertainties, as the abundance ratios are rather insensitive to the choice of . Sources for such systematic uncertainties include the use of different linelists, radiative transfer codes, and atmospheric models. | 5211 | 2.93 | 1.19 | -2.56 0.12 | -2.49 0.12 | 0.48 0.05 | 0.11 0.13 | 0.52 0.05 |
| source_id | |||
|---|---|---|---|
| – | [K] | – | – |
| 3549718318990080896 | 5319 | 3.3 | -2.52 0.08 |
| 3869876996687740032* | 5372 | 3.4 | -2.50 0.10 |
| 6747065215934660608 | 5535 | 4.3 | -2.53 0.08 |
| 6646097819069706624 | 5653 | 4.4 | -2.54 0.10 |
| 3473979147705211776 | 5733 | 4.4 | -2.57 0.14 |
| 3757312745743087232 | 6591 | 4.2 | -2.23 0.41 |