PEARLS: Discovery of Point-Source Features Within Galaxies in the North Ecliptic Pole Time Domain Field
Abstract
The first public 0.9–4.4 m NIRCam images of the North Ecliptic Pole (NEP) Time Domain Field (TDF) uncovered many galaxies that display point-source features in their cores as seen in the longer wavelength filters. We visually identified a sample of 66 galaxies (1 galaxy per arcmin2) with point-like cores and fit their spectral energy distributions (SED)s using EAZY and CIGALE to characterize the sample’s active galactic nucleus (AGN) and host galaxy parameters. Single-template fitting best fits of the sample with a Seyfert-blended SED. With CIGALE we compute the median fractional AGN contribution to the 0.1–30.0 m flux to be , and that 56% of the 66 galaxies have star-formation rates in the starburst range whereas the remainder are near the star-formation main sequence. There are Very Large Array (VLA) 3 GHz detections for 24/66 galaxies, implying some combination of AGN emission and vigorous star formation. We present a novel sample selection procedure in tandem to the morphological sample selection based on objects’ light profiles at 4.4 m. This procedure identifies a parameter space which probes point-source features and automatically recovers our visual sample with minimal contamination from both stars and brighter galaxies. This procedure may be used in other extant and future NIRCam images to streamline the search for galaxies with point-like cores. The morphological approach to recognizing AGN is being resurrected by the James Webb Space Telescope (JWST) by virtue of its superb angular resolution at infrared wavelengths.
1 Introduction
More than eighty years ago, Carl Seyfert (1943) drew attention to 6 “extragalactic nebulae” with broad emission lines and “exceedingly luminous stellar or semistellar” nuclei. Galaxies of this type became known as “Seyfert galaxies” (Burbidge et al., 1963), and they are now recognized (e.g., Osterbrock, 1993) as members of the low-luminosity end of the population of active galactic nuclei (AGN).
AGN are now thought to consist of an accretion disk around a supermassive black hole (SBMH) within a wider, optically thick dust torus (e.g., Antonucci & Miller, 1985). This central engine can achieve enormous luminosities and can even outshine the entire host galaxy (e.g., Padovani et al., 2017). Modern studies of AGN probe the relationship with their host galaxies and intergalactic environments along with properties of the central SMBHs (e.g., Bollati et al., 2023; Costa-Souza et al., 2023; Sampaio et al., 2023).
AGN emit energy across the entire electromagnetic spectrum, and identification and classifications of AGN are based on X-ray (e.g., Elvis et al., 1978), UV–visible (e.g., Seyfert, 1943), infrared (e.g., Stern et al., 2005), and radio (e.g., Fanaroff & Riley, 1974) observations. AGN are most often identified via their spectral energy distributions (SED)s (e.g., Li et al., 2023; Lyu et al., 2023; Yang et al., 2023), their colors (e.g., Stern et al., 2005; Hwang et al., 2021; Juodžbalis et al., 2023; Furtak et al., 2023), spectroscopy (e.g., Mehdipour et al., 2024; Burke et al., 2024), variability (e.g., Pouliasis et al., 2019; O’Brien et al., 2024), radio (e.g., Hyun et al., 2023), or X-ray emission (e.g., Masini et al., 2020; Zhao et al., 2021). Identifying AGN by visual morphology has fallen out of favor in the “big data” era of advanced instrumentation and vast surveys such as the Sloan Digital Sky Survey (York et al., 2000). This is largely because dust obscuration can hide the active nucleus (Hickox & Alexander, 2018) and at infrared wavelengths, where the dust extinction is lower, wide-field surveys can only be done from space. Until now, the angular resolution of infrared space observatories has been low.
The James Webb Space Telescope (JWST), with its unprecedented resolution in the infrared (e.g., Davies et al., 2024; Li et al., 2023; Yang et al., 2023), offers the chance to revisit morphological AGN selection and analysis. This paper is an initial exploration of the possibilities via characteristic diffraction spikes of the telescopes’s PSF in the 0.9–4.4µm wavelengths that suggest near-pointlike galaxy cores.
The North Ecliptic Pole (NEP) Time Domain Field (TDF) (Jansen & Windhorst, 2018) is located within JWST’s continuous viewing zone, making it a prime target for AGN variability and other time-domain science. Because the ultimate goal will be to compare morphological selection with other methods, we used the now-public JWST NEP TDF images (Windhorst et al., 2023) to visually search for galaxies with point-like features in their center, i.e., potential AGN, following the core morphology and Seyfert class relationship (e.g., Windhorst & Cohen, 2010; Rutkowski et al., 2013).
Section 2 describes the observations and construction of a morphologically selected AGN catalog. Section 3 discusses the results, and Section 4 gives a summary. All magnitudes are in AB units (Oke & Gunn, 1983). Where relevant, we adopt a flat CDM cosmology with km s-1 Mpc-1, , and (Planck Collaboration et al., 2016, 2020).
2 Data & Cataloging
2.1 Observations
The JWST NEP TDF is centered at (RA, DEC)J2000 = (17:22:47.896, +65:49:21.54) (Jansen & Windhorst, 2018). The TDF was observed with JWST as part of the Prime Extragalactic Areas for Reionization and Lensing Science (PEARLS) GTO program (Windhorst et al., 2023) in eight filters: F090W, F115W, F150W, F200W, F277W, F356W, F410M, and F444W. The observations consisted of four orthogonal spokes (illustrated by Figure 1 of both Willmer et al. 2023 and O’Brien et al. 2024) observed between 2022 Aug 25 and 2023 May 30. The NIRCam image quality is diffraction-limited (Rigby et al., 2023; Windhorst et al., 2023) at wavelengths 1.3 µm with point source FWHM values ranging from 60–160 milliarcseconds (mas) at wavelengths of 1.3–4.8m.
Point-source sensitivities in an aperture radius of 80 mas range from 28.1 to 29.1 mag (5), depending on the filter, and 29.0 mag in F200W specifically. The images were drizzled on a 30 mas pixel scale. The parameters per filter, the data reduction pipeline process, and further details are given by Windhorst et al. (2023).
We used SExtractor (Bertin & Arnouts, 1996) to generate catalogs. The detection threshold required 9 contiguous pixels 1.5 above the background. We used 32 deblending sub-thresholds with a 0.06 minimum contrast necessary for object deblending. We ran SExtractor on all eight filters in dual-image mode using F444W as the detection filter to produce position-matched catalogs. Magnitudes are MAG_AUTO except where indicated otherwise.
For an initial comparison with other wavelengths, we used the VLA 3 GHz radio observations detailed by Hyun et al. (2023, their Appendix A).


2.2 Visual Sample Selection
ROIII visually inspected an 8-filter color-composite of all NIRCam observations within the JWST NEP TDF to identify resolved galaxies with unresolved point-like features in their cores. The color-composite was constructed according to the Trilogy111https://www.stsci.edu/dcoe/trilogy prescription (Coe et al., 2012). This visual inspection process involved observing each SExtractor-detected galaxy in the four spokes of the NEP TDF by eye, and determining whether there was a PSF effect in the galaxy core or an unresolved point source within the galaxy. This identified 66 galaxies222We verified that no objects in the sample are stars by applying a FWHM and magnitude cut similar to that used by Windhorst et al. (2023) and/or by computing ., which we refer as “CPGs” (central point-source galaxies) hereafter. Figure 1 shows the sample and highlights the qualitative criteria, diversity, and similarities of the CPGs. Several of objects within the CPG sample display obvious point-like features in their cores (i.e., IDs 1/14/28/48), whereas the vast majority show less distinct features of the characteristic PSF from JWST.
The NIRCam images of the NEP TDF sampled an area of 65.4 arcmin2, and hence our sample of 66 CPGs corresponds to 1 galaxy per arcmin2 to AB mag. This is comparable to the WISE (W1–W2) color-selected AGN density (e.g., Assef et al., 2013, their Table 1), 0.5 AGN per arcmin2 to AB mag.
2.3 Automated Sample Selection
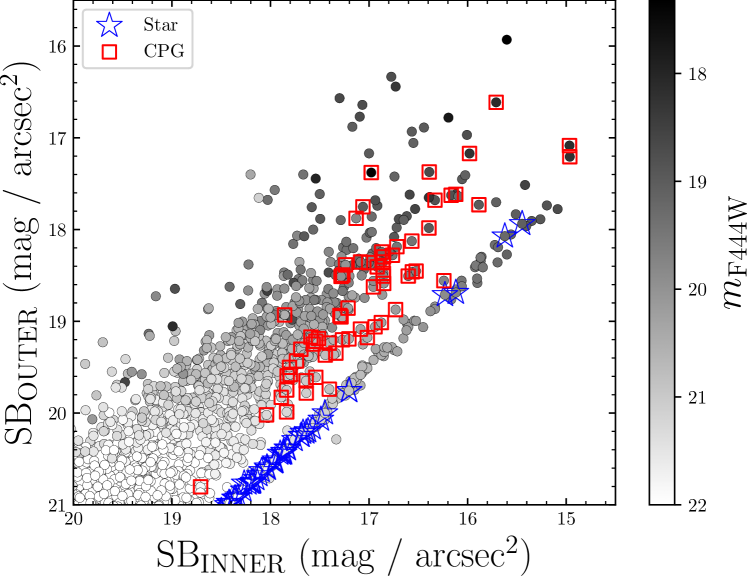
While our initial sample was obtained through qualitative visual selection, it would be useful to find a quantitative way to identify objects similar to CPGs. The concentration index (e.g., Conselice, 2003) is one measure, but its simple ratio finds sources that are peaky but not necessarily pointlike. Instead, we used SExtractor to measure magnitudes in apertures at the cores of objects in the JWST NEP TDF. We ran SExtractor on the F444W image to compute magnitudes in circular apertures with radii of 6, 8, and 10 pixels, corresponding to radii 018, 024, and 030, respectively. We adopted these apertures to probe the surface brightness near the core of the CPGs and identify objects that are morphologically similar to stars out to a certain radius. We used the smallest aperture to measure the average surface brightness within an inner area of 0.1 arcsec2 (SBINNER) and used the two other apertures to measure the average surface brightness within an outer annulus (SBOUTER), which has an area equal to that within the inner circular aperture. Multiple aperture radii for SBINNER and SBOUTER were tested, and the ones adopted provided the most effective way to probe point-source features in galaxies with a productive CPG isolation.
Figure 2 plots SBINNER against SBOUTER. Stars are identified as straddling the NIRCam diffraction limit with with mag (Windhorst et al., 2023). CPGs near the stars in Figure 2 are IDs 14/28/48. (ID 1 probably belongs in this group, but its nucleus is saturated in the F444W observation). These objects prove that there exists a parameter space where we can probe point sources within galaxies, barring contamination from other stars. The longer wavelengths of the near-infrared regime can probe both optically obscured and unobscured AGN (e.g., Assef et al., 2013) and both star-forming galaxies and weak-AGN (e.g., Kim et al., 2019) via redder colors in the 3.5–3.6 µm and 4.4–4.5 µm bands. The angular resolution of JWST allows aperture photometry to be effective at probing morphological signatures of AGN at these wavelengths, thus giving the prominent separation from brighter galaxies. Obscured AGN in the UV–visible are likely showing up in these images because of the much smaller dust extinction at these wavelengths, and AGN are likely to be the point-like features in our infrared CPGs.
The above prototype procedure provides a robust star–CPG separation and a CPG separation from brighter galaxies that automatically recovers our CPG sample and finds objects similar to it. Identifying galaxies that straddle the morphology of stars without contamination would allow the search of CPG-like galaxies in any JWST/NIRCam image. We recognize that the automated method does not pick up all of the weak-Seyferts in the JWST NEP TDF; there will be some that require higher signal-to-noise data to be identified by this procedure. For the brighter galaxies that plot similar to our visual sample but were not visually identified as CPGs in Figure 2, we defer work with two-dimensional light profiling and/or NIRISS spectroscopy to classify what our visual identification may have missed.
3 Results & Discussion
3.1 Seyfert Template Fitting with EAZY
In order to estimate AGN fractions and derive photometric redshifts, we used EAZY333https://github.com/gbrammer/eazy-photoz (Brammer et al., 2008) to fit the eight NIRCam magnitudes for each sample galaxy. For this single-component template fitting procedure, we ran EAZY twice: one run allowing a single-component fit from the 12 EAZY tweak_fsps_QSF_12_v3 templates, and a second run fitting the AGN-ATLAS SEDs. The former templates are galaxy templates used for stellar population synthesis and the latter templates (Brown et al., 2019) are blends of AGN and host-galaxy SEDs covering 0.09–30.0 µm. The host/AGN ratios available are powers of two from 0.5 to 64 normalized at 0.6 µm.
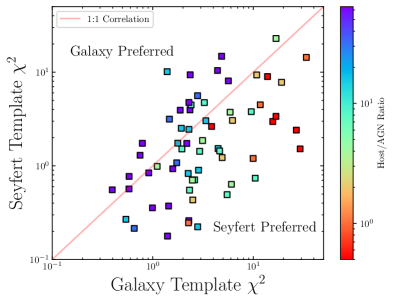
As shown in Figure 3, 70% of the CPGs prefer an AGN-ATLAS template over a standard EAZY template. Generally, the fits with the lower host/AGN ratios (templates with the highest AGN contributions to the total SED) are still fairly well fit with an AGN-Atlas SED, i.e., with no AGN at all (See 4). Even when an AGN is indicated, for most galaxies in the sample, the host galaxy outshines AGN emission. The fitting does not prove that our sample galaxies are Seyferts. Offering more SED templates could just be adding free parameters resulting in better fits. Nevertheless, the fitting done here is consistent with the morphological selection.
The photometric redshifts generated from the AGN-ATLAS and standard EAZY templates in this procedure show reasonable scatter, (Eq. 7 of Brammer et al., 2008). This likely arises from the relatively small wavelength range covered by the existing observations combined with the wide wavelength range of the AGN SEDs having few spectral features that can indicate redshift (e.g., Brown et al., 2019). This makes it more difficult to constrain photometric redshifts for objects with an AGN (e.g., Assef et al., 2013).
3.2 SED Parameter Estimation with CIGALE
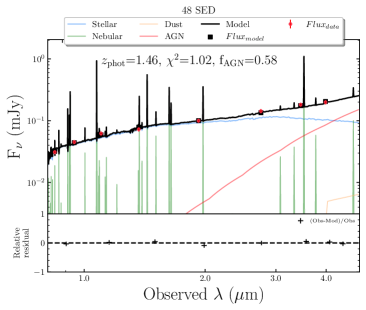
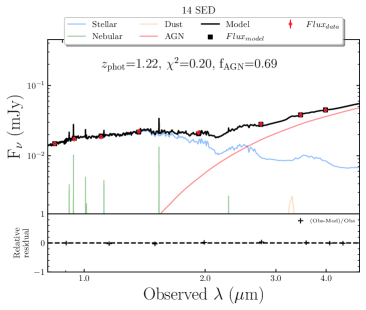
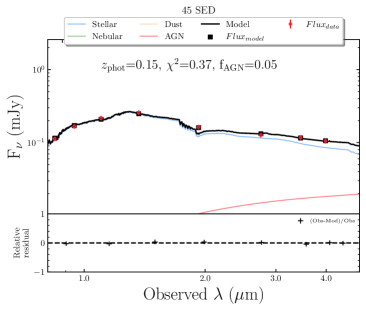
To infer the galaxies’ physical properties, we used CIGALE444https://cigale.lam.fr/ (Boquien et al., 2019), an SED-fitting code relying on energy balance between the ultraviolet and infrared. The fitting parameters incorporated a stellar continuum component from Bruzual & Charlot (2003) models, a dust component from Dale et al. (2014) templates, a Calzetti et al. (2000) dust attenuation law, nebular emission templates from Inoue (2011), and a clumpy two-phase torus model from Stalevski et al. (2016). We use CIGALE generated photometric redshift for the fits. The fits are good, as expected with so many free parameters and so few photometric points, with 98.5% of the fits having . The online version of this paper includes a Figure Set of all 66 CIGALE fits, and Figure 4 shows three examples.
We verified the consistency of photometric redshifts generated from CIGALE with photometric redshifts generated from single-component fits in §3.1. between photometric redshifts from CIGALE and EAZY tweak_fsps_QSF_12_v3 templates. between photometric redshifts from CIGALE and AGN-ATLAS templates.
A CIGALE output parameter of immediate interest is , the fractional contribution of AGN emission to the bolometric luminosity. We tuned CIGALE to compute based on AGN emission from 0.1 to 30 µm following Assef et al. (2013, their Eq. 1) considering our NIRCam photometry. The CPG median with a median absolute deviation 0.06. A control sample of the galaxy nearest in magnitude to each CPG has with a median absolute deviation 0.09. The formal statistical separation here is only at the 1 level, though our result suggests the CPG sample has measurable AGN emission in the infrared. can be better constrained with additional photometry in future work, particularly in the UV and sub-mm (see, e.g., Ciesla et al., 2015).
Fig. Set1. CPG CIGALE SEDs
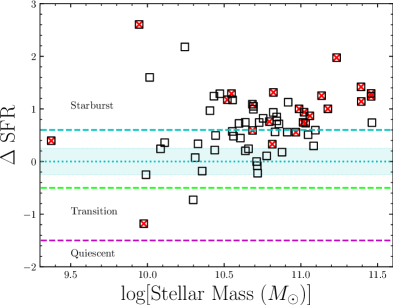
CIGALE also provides estimated stellar masses and star-formation rates (SFR)s, which provide context for the CPGs. Typical galaxies fall on the star-formation main sequence, which depends on both redshift and stellar mass (Speagle et al., 2014, Eq. 28). As Figure 5 shows, the majority of our sample, 56%, lies at or above the starburst boundary given by Rodighiero et al. (2011), and the remainder of the sample lies near the star-formation main sequence. An independent SFR estimate comes from radio observations (e.g., Condon, 1992; Tabatabaei et al., 2017). Positions for 24 CPGs match sources in the VLA 3 GHz catalog (Hyun et al., 2023) (Table 1 identifies which CPGs have radio counterparts). The most massive and highest-SFR CPGs are the ones having radio detections. This could be attributed to either the synchrotron radiation produced from remnants of Type II supernovae (e.g., Chevalier, 1982), i.e., star formation, or radio emission from the AGN (e.g., Kellermann, 1987), or both. However, Willner et al. (2023, their Fig. 11) showed that few radio sources in the TDF are in the starburst range.
The visual selection of these 66 CPGs is biased towards massive galaxies because only bright galaxies could be examined for morphology. The CPGs’ active star formation, high stellar mass, and frequent radio loudness all suggest that the near-infrared central point source is an AGN.
3.3 (–) Colors
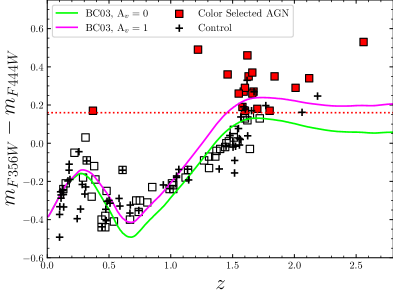
Another standard AGN selection method is red (–) color (e.g., Stern et al., 2005). The NIRCam F356W and F444W filters are close to the WISE W1 and W2 filters (Wright et al., 2010) and can replicate the (W1–W2) 0.8 (Vega magnitudes) AGN color selection (e.g., Stern et al., 2012). There are 19 CPGs with (– as shown in Figure 6. (Table 1 gives the CPG colors). Other CPGs and all galaxies in the control sample have integrated colors consistent with a pure stellar population that formed early and evolved passively. However, these colors do not preclude a modest AGN or star-formation contribution. At best, reddening in Figure 6 can be attributed to dust.
4 Summary & Future Prospects
The superb angular resolution of JWST/NIRCam reveals galaxies (“CPGs”) with pointlike cores at the redder wavelengths. Best-fit SEDs for 66 such galaxies in the JWST NEP TDF field suggest that the CPGs are massive and luminous, and in most cases, the extended galaxy outshines the unresolved core. The SEDs are well-characterized with AGN components, but the galaxies themselves appear massive and star-forming. Photometry at additional wavelengths and spectroscopy would aid in classifying these objects, confirming AGN presence, constraining host-galaxy parameters, and characterizing the mechanisms driving the semistellar galaxy cores. Additionally, cross correlation of our CPG with X-ray detections will confirm their AGN nature and measure the nuclear luminosity and absorption.
The initial visual sample selection revives the classical approach to AGN identification via a bright, star-like nucleus. This simple selection method is possible because of JWST’s superb angular resolution at long wavelengths, where extinction is much lower than in visible light. Taking advantage of the near-infrared surface brightness and morphology of our CPG sample made it possible to quantify and automate the morphological approach. This automated sample selection of brighter galaxies with point-source features streamlines the search and analysis of CPG-like galaxies in current and future JWST/NIRCam imaging.
References
- Antonucci & Miller (1985) Antonucci, R. R. J., & Miller, J. S. 1985, ApJ, 297, 621, doi: 10.1086/163559
- Assef et al. (2013) Assef, R. J., Stern, D., Kochanek, C. S., et al. 2013, ApJ, 772, 26, doi: 10.1088/0004-637X/772/1/26
- Astropy Collaboration et al. (2013) Astropy Collaboration, Robitaille, T. P., Tollerud, E. J., et al. 2013, A&A, 558, A33, doi: 10.1051/0004-6361/201322068
- Astropy Collaboration et al. (2018) Astropy Collaboration, Price-Whelan, A. M., Sipőcz, B. M., et al. 2018, AJ, 156, 123, doi: 10.3847/1538-3881/aabc4f
- Astropy Collaboration et al. (2022) Astropy Collaboration, Price-Whelan, A. M., Lim, P. L., et al. 2022, ApJ, 935, 167, doi: 10.3847/1538-4357/ac7c74
- Bertin & Arnouts (1996) Bertin, E., & Arnouts, S. 1996, A&AS, 117, 393, doi: 10.1051/aas:1996164
- Bollati et al. (2023) Bollati, F., Lupi, A., Dotti, M., & Haardt, F. 2023, On the connection between AGN radiative feedback and massive black hole spin. https://arxiv.org/abs/2311.07576
- Boquien et al. (2019) Boquien, M., Burgarella, D., Roehlly, Y., et al. 2019, A&A, 622, A103, doi: 10.1051/0004-6361/201834156
- Brammer et al. (2008) Brammer, G. B., van Dokkum, P. G., & Coppi, P. 2008, ApJ, 686, 1503, doi: 10.1086/591786
- Brown et al. (2019) Brown, M. J. I., Duncan, K. J., Landt, H., et al. 2019, MNRAS, 489, 3351, doi: 10.1093/mnras/stz2324
- Bruzual & Charlot (2003) Bruzual, G., & Charlot, S. 2003, MNRAS, 344, 1000, doi: 10.1046/j.1365-8711.2003.06897.x
- Burbidge et al. (1963) Burbidge, E. M., Burbidge, G. R., & Prendergast, K. H. 1963, ApJ, 138, 375, doi: 10.1086/147652
- Burke et al. (2024) Burke, C. J., Liu, X., & Shen, Y. 2024, MNRAS, 527, 5356, doi: 10.1093/mnras/stad3592
- Calzetti et al. (2000) Calzetti, D., Armus, L., Bohlin, R. C., et al. 2000, ApJ, 533, 682, doi: 10.1086/308692
- Chevalier (1982) Chevalier, R. A. 1982, ApJ, 259, 302, doi: 10.1086/160167
- Ciesla et al. (2015) Ciesla, L., Charmandaris, V., Georgakakis, A., et al. 2015, A&A, 576, A10, doi: 10.1051/0004-6361/201425252
- Coe et al. (2012) Coe, D., Umetsu, K., Zitrin, A., et al. 2012, ApJ, 757, 22, doi: 10.1088/0004-637X/757/1/22
- Condon (1992) Condon, J. J. 1992, ARA&A, 30, 575, doi: 10.1146/annurev.aa.30.090192.003043
- Conselice (2003) Conselice, C. J. 2003, ApJS, 147, 1, doi: 10.1086/375001
- Costa-Souza et al. (2023) Costa-Souza, J. H., Riffel, R. A., Dors, O. L., Riffel, R., & da Rocha-Poppe, P. C. 2023, Spatially resolved observations of the peculiar galaxy NGC 232: AGN winds and stellar populations. https://arxiv.org/abs/2310.15842
- Dale et al. (2014) Dale, D. A., Helou, G., Magdis, G. E., et al. 2014, ApJ, 784, 83, doi: 10.1088/0004-637X/784/1/83
- Davies et al. (2024) Davies, R. L., Belli, S., Park, M., et al. 2024, MNRAS, 528, 4976, doi: 10.1093/mnras/stae327
- Elvis et al. (1978) Elvis, M., Maccacaro, T., Wilson, A. S., et al. 1978, MNRAS, 183, 129, doi: 10.1093/mnras/183.2.129
- Fanaroff & Riley (1974) Fanaroff, B. L., & Riley, J. M. 1974, MNRAS, 167, 31P, doi: 10.1093/mnras/167.1.31P
- Furtak et al. (2023) Furtak, L. J., Labbé, I., Zitrin, A., et al. 2023, arXiv e-prints, arXiv:2308.05735, doi: 10.48550/arXiv.2308.05735
- Hickox & Alexander (2018) Hickox, R. C., & Alexander, D. M. 2018, ARA&A, 56, 625, doi: 10.1146/annurev-astro-081817-051803
- Hwang et al. (2021) Hwang, Y.-H., Wang, W.-H., Chang, Y.-Y., et al. 2021, ApJ, 913, 6, doi: 10.3847/1538-4357/abf11a
- Hyun et al. (2023) Hyun, M., Im, M., Smail, I. R., et al. 2023, ApJS, 264, 19, doi: 10.3847/1538-4365/ac9bf4
- Inoue (2011) Inoue, A. K. 2011, MNRAS, 415, 2920, doi: 10.1111/j.1365-2966.2011.18906.x
- Jansen & Windhorst (2018) Jansen, R. A., & Windhorst, R. A. 2018, PASP, 130, 124001, doi: 10.1088/1538-3873/aae476
- Juodžbalis et al. (2023) Juodžbalis, I., Conselice, C. J., Singh, M., et al. 2023, MNRAS, 525, 1353, doi: 10.1093/mnras/stad2396
- Kellermann (1987) Kellermann, K. I. 1987, in Observational Evidence of Activity in Galaxies, ed. E. E. Khachikian, K. J. Fricke, & J. Melnick, Vol. 121, 273
- Kim et al. (2019) Kim, D., Jansen, R. A., Windhorst, R. A., Cohen, S. H., & McCabe, T. J. 2019, ApJ, 884, 21, doi: 10.3847/1538-4357/ab385c
- Li et al. (2023) Li, Q., Conselice, C. J., Adams, N., et al. 2023, EPOCHS VIII. An Insight into MIRI-selected Galaxies in SMACS-0723 and the Benefits of Deep MIRI Photometry in Revealing AGN and the Dusty Universe. https://arxiv.org/abs/2309.06932
- Lyu et al. (2023) Lyu, J., Alberts, S., Rieke, G. H., et al. 2023, arXiv e-prints, arXiv:2310.12330, doi: 10.48550/arXiv.2310.12330
- Masini et al. (2020) Masini, A., Hickox, R. C., Carroll, C. M., et al. 2020, ApJS, 251, 2, doi: 10.3847/1538-4365/abb607
- Mehdipour et al. (2024) Mehdipour, M., Kriss, G. A., Kaastra, J. S., et al. 2024, ApJ, 962, 155, doi: 10.3847/1538-4357/ad1bcb
- O’Brien et al. (2024) O’Brien, R., Jansen, R. A., Grogin, N. A., et al. 2024, arXiv e-prints, arXiv:2401.04944, doi: 10.48550/arXiv.2401.04944
- Oke & Gunn (1983) Oke, J. B., & Gunn, J. E. 1983, ApJ, 266, 713, doi: 10.1086/160817
- Osterbrock (1993) Osterbrock, D. E. 1993, Rev. Mexicana Astron. Astrofis., 26, 65
- Padovani et al. (2017) Padovani, P., Alexander, D. M., Assef, R. J., et al. 2017, A&A Rev., 25, 2, doi: 10.1007/s00159-017-0102-9
- Planck Collaboration et al. (2016) Planck Collaboration, Ade, P. A. R., Aghanim, N., et al. 2016, A&A, 594, A13, doi: 10.1051/0004-6361/201525830
- Planck Collaboration et al. (2020) Planck Collaboration, Aghanim, N., Akrami, Y., et al. 2020, A&A, 641, A6, doi: 10.1051/0004-6361/201833910
- Pouliasis et al. (2019) Pouliasis, E., Georgantopoulos, I., Bonanos, A. Z., et al. 2019, MNRAS, 487, 4285, doi: 10.1093/mnras/stz1483
- Renzini & Peng (2015) Renzini, A., & Peng, Y.-j. 2015, ApJ, 801, L29, doi: 10.1088/2041-8205/801/2/L29
- Rigby et al. (2023) Rigby, J., Perrin, M., McElwain, M., et al. 2023, PASP, 135, 048001, doi: 10.1088/1538-3873/acb293
- Rodighiero et al. (2011) Rodighiero, G., Daddi, E., Baronchelli, I., et al. 2011, ApJ, 739, L40, doi: 10.1088/2041-8205/739/2/L40
- Rutkowski et al. (2013) Rutkowski, M. J., Hegel, P. R., Kim, H., Tamura, K., & Windhorst, R. A. 2013, Astron. J., 146, 11, doi: 10.1088/0004-6256/146/1/11
- Sampaio et al. (2023) Sampaio, V. M., Aragón-Salamanca, A., Merrifield, M. R., et al. 2023, MNRAS, 524, 5327, doi: 10.1093/mnras/stad2211
- Seyfert (1943) Seyfert, C. K. 1943, ApJ, 97, 28, doi: 10.1086/144488
- Speagle et al. (2014) Speagle, J. S., Steinhardt, C. L., Capak, P. L., & Silverman, J. D. 2014, ApJS, 214, 15, doi: 10.1088/0067-0049/214/2/15
- Stalevski et al. (2016) Stalevski, M., Ricci, C., Ueda, Y., et al. 2016, MNRAS, 458, 2288, doi: 10.1093/mnras/stw444
- Stern et al. (2005) Stern, D., Eisenhardt, P., Gorjian, V., et al. 2005, ApJ, 631, 163, doi: 10.1086/432523
- Stern et al. (2012) Stern, D., Assef, R. J., Benford, D. J., et al. 2012, ApJ, 753, 30, doi: 10.1088/0004-637X/753/1/30
- Tabatabaei et al. (2017) Tabatabaei, F. S., Schinnerer, E., Krause, M., et al. 2017, ApJ, 836, 185, doi: 10.3847/1538-4357/836/2/185
- Willmer et al. (2023) Willmer, C. N. A., Ly, C., Kikuta, S., et al. 2023, ApJS, 269, 21, doi: 10.3847/1538-4365/acf57d
- Willner et al. (2023) Willner, S. P., Gim, H. B., del Carmen Polletta, M., et al. 2023, ApJ, 958, 176, doi: 10.3847/1538-4357/acfdfb
- Windhorst & Cohen (2010) Windhorst, R., & Cohen, S. 2010, 1294, doi: 10.1063/1.3518858
- Windhorst et al. (2023) Windhorst, R. A., Cohen, S. H., Jansen, R. A., et al. 2023, AJ, 165, 13, doi: 10.3847/1538-3881/aca163
- Wright et al. (2010) Wright, E. L., Eisenhardt, P. R. M., Mainzer, A. K., et al. 2010, AJ, 140, 1868, doi: 10.1088/0004-6256/140/6/1868
- Yang et al. (2023) Yang, G., Caputi, K. I., Papovich, C., et al. 2023, ApJ, 950, L5, doi: 10.3847/2041-8213/acd639
- York et al. (2000) York, D. G., Adelman, J., Anderson, John E., J., et al. 2000, AJ, 120, 1579, doi: 10.1086/301513
- Zhao et al. (2021) Zhao, X., Civano, F., Fornasini, F. M., et al. 2021, MNRAS, 508, 5176, doi: 10.1093/mnras/stab2885
Table 1 is the catalog of our morphologically identified CPG in the JWST NEP TDF.
| ID | R.A. | Decl. | F090W | F115W | F150W | F200W | F277W | F356W | F410M | F444W | (356–444) | H23 ID | ||
|---|---|---|---|---|---|---|---|---|---|---|---|---|---|---|
| (∘) | (∘) | ——————————————AB mag—————————————– | AB mag | |||||||||||
| 1 | 260.671752 | 65.711688 | 16.69 | 17.07 | 17.05 | 17.32 | 0.48 | 0.08 | 0.39 | 194 | ||||
| 2 | 260.756207 | 65.713177 | 23.11 | 22.16 | 21.61 | 21.44 | 20.92 | 20.72 | 20.46 | 20.37 | 1.63 | 0.44 | 0.99 | 314 |
| 3 | 260.694024 | 65.716929 | 20.74 | 20.14 | 19.63 | 19.27 | 19.15 | 19.66 | 19.78 | 19.78 | 0.38 | 0.09 | 0.52 | |
| 4 | 260.751425 | 65.735378 | 19.21 | 18.90 | 18.71 | 18.61 | 19.13 | 19.50 | 19.63 | 19.74 | 0.13 | 0.02 | 0.40 | 308 |
| 5 | 260.690857 | 65.738085 | 22.90 | 21.76 | 21.22 | 20.80 | 20.29 | 20.15 | 20.06 | 20.08 | 1.51 | 0.33 | 0.71 | 218 |
| 6 | 260.701250 | 65.776180 | 22.79 | 22.02 | 21.52 | 21.14 | 20.59 | 20.26 | 19.99 | 19.91 | 1.84 | 0.50 | 0.99 | 232 |
| 7 | 260.697887 | 65.777933 | 24.22 | 22.84 | 21.98 | 21.31 | 20.89 | 20.57 | 20.34 | 20.20 | 1.66 | 0.46 | 1.01 | |
| 8 | 260.659521 | 65.784555 | 20.74 | 20.18 | 19.78 | 19.41 | 19.18 | 19.19 | 19.32 | 19.55 | 0.74 | 0.18 | 0.28 | |
| 9 | 260.695583 | 65.784352 | 23.31 | 22.80 | 22.43 | 21.92 | 21.55 | 21.22 | 21.04 | 20.88 | 2.12 | 0.46 | 0.98 | 223 |
| 10 | 260.746297 | 65.784221 | 25.07 | 23.94 | 22.74 | 22.13 | 21.58 | 21.11 | 20.94 | 20.82 | 2.01 | 0.49 | 0.93 | 300 |
| 11 | 260.719022 | 65.786260 | 22.53 | 21.59 | 21.15 | 20.81 | 20.48 | 20.34 | 20.28 | 20.36 | 1.44 | 0.32 | 0.62 | |
| 12 | 260.773037 | 65.785647 | 21.27 | 20.79 | 20.45 | 20.14 | 19.98 | 20.16 | 20.52 | 20.60 | 0.44 | 0.10 | 0.20 | |
| 13 | 260.641043 | 65.787557 | 23.04 | 22.02 | 21.45 | 21.02 | 20.65 | 20.45 | 20.46 | 20.52 | 1.36 | 0.31 | 0.57 | |
| 14 | 260.536970 | 65.795297 | 20.97 | 20.80 | 20.73 | 20.53 | 20.58 | 20.27 | 19.95 | 19.78 | 1.22 | 0.69 | 1.13 | |
| 15 | 260.733993 | 65.798508 | 19.04 | 18.64 | 18.29 | 18.06 | 18.17 | 18.59 | 18.66 | 18.56 | 0.31 | 0.11 | 0.67 | 283 |
| 16 | 260.758634 | 65.800809 | 18.11 | 17.84 | 17.67 | 17.52 | 17.94 | 18.06 | 17.95 | 18.11 | 0.22 | 0.10 | 0.59 | 319 |
| 17 | 260.639149 | 65.799387 | 20.00 | 19.53 | 19.21 | 18.87 | 18.67 | 18.55 | 18.66 | 18.79 | 1.02 | 0.25 | 0.40 | 141 |
| 18 | 260.507214 | 65.799489 | 22.30 | 21.64 | 21.13 | 20.64 | 20.31 | 20.43 | 20.58 | 20.73 | 0.72 | 0.18 | 0.34 | |
| 19 | 260.684968 | 65.799834 | 22.16 | 21.56 | 21.09 | 20.69 | 20.42 | 20.52 | 20.74 | 20.92 | 0.67 | 0.15 | 0.24 | |
| 20 | 260.722957 | 65.804355 | 19.41 | 18.95 | 18.56 | 18.30 | 18.28 | 18.71 | 18.93 | 18.99 | 0.36 | 0.06 | 0.36 | |
| 21 | 260.473516 | 65.803032 | 21.35 | 20.85 | 20.50 | 20.19 | 19.98 | 20.22 | 20.46 | 20.60 | 0.47 | 0.11 | 0.26 | |
| 22 | 260.536763 | 65.805280 | 22.70 | 21.89 | 21.33 | 20.90 | 20.59 | 20.46 | 20.56 | 20.60 | 1.14 | 0.28 | 0.50 | 64 |
| 23 | 260.456228 | 65.807676 | 22.62 | 21.55 | 21.08 | 20.70 | 20.35 | 20.26 | 20.24 | 20.29 | 1.40 | 0.30 | 0.61 | |
| 24 | 260.524706 | 65.809982 | 22.34 | 21.23 | 20.74 | 20.36 | 20.00 | 19.89 | 19.82 | 19.89 | 1.45 | 0.31 | 0.64 | |
| 25 | 260.483404 | 65.811818 | 23.52 | 22.87 | 22.22 | 21.37 | 20.82 | 21.15 | 21.03 | 20.88 | 1.59 | 0.37 | 0.91 | |
| 26 | 260.486571 | 65.816233 | 20.15 | 19.64 | 19.24 | 18.91 | 18.71 | 18.99 | 19.34 | 19.39 | 0.44 | 0.09 | 0.24 | |
| 27 | 260.531751 | 65.815627 | 22.60 | 21.85 | 21.12 | 20.57 | 20.01 | 19.76 | 19.72 | 19.79 | 1.64 | 0.33 | 0.61 | 63 |
| 28 | 260.896667 | 65.817463 | 20.54 | 19.84 | 19.54 | 19.11 | 18.67 | 18.49 | 18.33 | 18.22 | 1.67 | 0.39 | 0.91 | 497 |
| 29 | 260.905043 | 65.817563 | 18.72 | 19.31 | 19.45 | 19.50 | 0.39 | 0.05 | 0.45 | |||||
| 30 | 260.814880 | 65.821168 | 24.78 | 23.62 | 22.99 | 22.60 | 22.18 | 22.04 | 21.96 | 21.87 | 1.60 | 0.36 | 0.81 | |
| 31 | 260.851755 | 65.824977 | 20.05 | 19.60 | 19.27 | 18.96 | 18.74 | 18.90 | 19.16 | 19.31 | 0.54 | 0.12 | 0.23 | |
| 32 | 260.898138 | 65.821819 | 23.92 | 22.53 | 21.99 | 21.69 | 21.33 | 21.25 | 21.14 | 21.10 | 1.64 | 0.35 | 0.79 | |
| 33 | 260.423208 | 65.823911 | 22.44 | 21.63 | 21.18 | 20.82 | 20.44 | 20.33 | 20.25 | 20.32 | 1.47 | 0.33 | 0.65 | |
| 34 | 260.768572 | 65.826200 | 23.12 | 21.65 | 21.05 | 20.73 | 20.37 | 20.18 | 20.08 | 20.06 | 1.62 | 0.36 | 0.76 | |
| 35 | 260.538451 | 65.827557 | 22.05 | 21.51 | 21.19 | 20.85 | 20.53 | 20.42 | 20.44 | 20.49 | 1.31 | 0.32 | 0.57 | |
| 36 | 260.942294 | 65.827685 | 21.87 | 21.19 | 20.73 | 20.34 | 20.03 | 20.09 | 20.21 | 20.39 | 0.75 | 0.20 | 0.34 | |
| 37 | 260.924988 | 65.829837 | 19.69 | 19.22 | 18.86 | 18.62 | 18.74 | 19.31 | 19.45 | 19.49 | 0.29 | 0.04 | 0.46 | |
| 38 | 260.919468 | 65.831341 | 20.38 | 20.03 | 19.72 | 19.52 | 19.56 | 19.92 | 19.88 | 19.75 | 0.37 | 0.17 | 0.81 | 528 |
| 39 | 260.965050 | 65.834642 | 20.87 | 20.34 | 20.03 | 19.68 | 19.46 | 19.60 | 19.72 | 19.74 | 0.61 | 0.22 | 0.50 | |
| 40 | 260.661331 | 65.832686 | 23.97 | 22.52 | 21.86 | 21.42 | 21.01 | 20.81 | 20.67 | 20.68 | 1.60 | 0.36 | 0.77 | |
| 41 | 260.886193 | 65.833875 | 22.27 | 21.59 | 21.08 | 20.64 | 20.28 | 20.32 | 20.40 | 20.55 | 0.85 | 0.23 | 0.41 | |
| 42 | 260.498867 | 65.833758 | 22.56 | 22.07 | 21.71 | 21.42 | 21.13 | 21.00 | 20.86 | 20.71 | 1.60 | 0.44 | 0.93 | |
| 43 | 260.661990 | 65.841400 | 21.45 | 20.29 | 19.84 | 19.51 | 19.14 | 18.98 | 18.86 | 18.95 | 1.51 | 0.33 | 0.67 | |
| 44 | 260.673587 | 65.837855 | 22.42 | 21.72 | 21.20 | 20.80 | 20.50 | 20.36 | 20.49 | 20.58 | 1.02 | 0.25 | 0.42 | |
| 45 | 260.894292 | 65.841649 | 18.77 | 18.35 | 18.06 | 17.87 | 18.37 | 18.64 | 18.73 | 18.85 | 0.15 | 0.05 | 0.43 | 492 |
| 46 | 260.679864 | 65.844673 | 21.20 | 20.56 | 20.11 | 19.69 | 19.36 | 19.25 | 19.34 | 19.46 | 1.01 | 0.25 | 0.43 | 205 |
| 47 | 260.745630 | 65.842305 | 21.31 | 20.67 | 20.19 | 19.69 | 19.31 | 19.20 | 19.26 | 19.44 | 0.99 | 0.24 | 0.40 | 299 |
| 48 | 260.639560 | 65.844960 | 20.17 | 19.76 | 19.42 | 19.25 | 18.90 | 18.51 | 18.25 | 18.15 | 1.46 | 0.58 | 1.00 | 142 |
| 49 | 260.626602 | 65.852172 | 21.51 | 20.75 | 20.23 | 19.82 | 19.52 | 19.39 | 19.52 | 19.61 | 1.02 | 0.25 | 0.42 | 124 |
| 50 | 260.756515 | 65.849021 | 21.63 | 21.00 | 20.64 | 20.34 | 20.10 | 19.98 | 20.08 | 20.16 | 1.12 | 0.27 | 0.46 | |
| 51 | 260.692874 | 65.861906 | 18.89 | 18.41 | 17.98 | 17.64 | 17.74 | 18.15 | 18.20 | 18.24 | 0.32 | 0.10 | 0.55 | 222 |
| 52 | 260.624274 | 65.867878 | 20.75 | 20.16 | 19.66 | 19.15 | 18.79 | 18.56 | 18.59 | 18.69 | 1.31 | 0.30 | 0.51 | 121 |
| 53 | 260.681038 | 65.869282 | 22.22 | 21.58 | 21.01 | 20.43 | 19.94 | 19.50 | 19.19 | 18.97 | 2.56 | 0.67 | 1.17 | 207 |
| 54 | 260.701071 | 65.876123 | 21.86 | 21.33 | 20.93 | 20.62 | 20.39 | 20.61 | 20.94 | 21.05 | 0.47 | 0.10 | 0.20 | |
| 55 | 260.738030 | 65.902876 | 24.04 | 22.76 | 22.16 | 21.71 | 21.23 | 20.97 | 20.73 | 20.51 | 1.62 | 0.49 | 1.10 | |
| 56 | 260.708784 | 65.876954 | 24.01 | 22.44 | 21.85 | 21.55 | 21.26 | 21.15 | 21.10 | 21.02 | 1.72 | 0.35 | 0.77 | |
| 57 | 260.651265 | 65.893590 | 23.50 | 22.60 | 22.07 | 21.68 | 21.37 | 21.24 | 21.27 | 21.33 | 1.27 | 0.30 | 0.55 | |
| 58 | 260.668029 | 65.877818 | 23.65 | 22.46 | 21.76 | 21.16 | 20.62 | 20.29 | 20.15 | 20.03 | 1.66 | 0.41 | 0.90 | 187 |
| 59 | 260.665718 | 65.877257 | 24.78 | 23.24 | 22.31 | 21.92 | 21.59 | 21.42 | 21.32 | 21.25 | 1.80 | 0.38 | 0.81 | |
| 60 | 260.690274 | 65.899640 | 22.37 | 21.40 | 20.99 | 20.67 | 20.29 | 20.24 | 20.23 | 20.28 | 1.37 | 0.30 | 0.60 | |
| 61 | 260.668589 | 65.880723 | 21.78 | 21.16 | 20.74 | 20.43 | 20.04 | 19.88 | 19.83 | 19.87 | 1.54 | 0.34 | 0.65 | |
| 62 | 260.709682 | 65.880570 | 24.22 | 23.03 | 22.44 | 21.95 | 21.43 | 21.23 | 21.05 | 21.04 | 1.58 | 0.37 | 0.83 | |
| 63 | 260.629030 | 65.874101 | 24.68 | 23.15 | 22.42 | 21.91 | 21.40 | 21.17 | 21.00 | 21.03 | 1.60 | 0.38 | 0.78 | |
| 64 | 260.649498 | 65.870951 | 22.85 | 21.98 | 21.72 | 21.58 | 21.39 | 21.21 | 21.02 | 20.95 | 1.55 | 0.42 | 0.90 | |
| 65 | 260.739964 | 65.925101 | 21.89 | 21.15 | 20.62 | 20.04 | 19.59 | 19.68 | 19.93 | 19.99 | 0.81 | 0.19 | 0.33 | 292 |
| 66 | 260.672783 | 65.911116 | 24.73 | 23.24 | 22.45 | 21.93 | 21.51 | 21.38 | 21.29 | 21.20 | 1.70 | 0.37 | 0.82 | |
Note. — Columns show ID number, J2000 positions, AB mag in eight JWST/NIRCam filters, photometric redshift () as measured by CIGALE, from CIGALE, (–) color, and counterpart ID in the Hyun et al. (2023) (H23) VLA 3 GHz source catalog.