Clustering and Data Augmentation to Improve Accuracy of Sleep Assessment and Sleep Individuality Analysis
Abstract
Recently, growing health awareness, novel methods allow individuals to monitor sleep at home. Utilizing sleep sounds offers advantages over conventional methods like smartwatches, being non-intrusive, and capable of detecting various physiological activities. This study aims to construct a machine learning-based sleep assessment model providing evidence-based assessments, such as poor sleep due to frequent movement during sleep onset. Extracting sleep sound events, deriving latent representations using VAE, clustering with GMM, and training LSTM for subjective sleep assessment achieved a high accuracy of 94.8% in distinguishing sleep satisfaction. Moreover, TimeSHAP revealed differences in impactful sound event types and timings for different individuals.
1 Introduction
Sleep plays an extremely important role in human health. Ensuring an adequate amount of high-quality sleep is essential for maintaining physical health and psychological balance. Professional measurement of sleep state is mainly conducted through Polysomnography (PSG) [1]. However, PSG involves a significant physical burden on the subjects and is difficult to measure without specialized facilities or hospitals. In recent years, evaluation methods utilizing wearable devices have been developed with the aim of facilitating sleep assessment [2]. However, the information that can be obtained through a smartwatch is limited, typically encompassing data such as acceleration and heart rate. While EEG-based sleep monitoring offers high accuracy, the requirement to wear headgear, even for a single-channel EEG headset [3], presents a significant burden.
Unlike EEG [4] or pressure sensors [5], sound-based method is non-contact and easily collectible. Sleep sounds refer to the sounds related to biological activities such as snoring, body movements, coughing, and environmental noises emitted during sleep. Methods using sleep sounds have advantages over conventional methods, such as being non-contact and capable of detecting many biological activities. Traditionally, sleep evaluation based on sleep sounds has primarily focused on the detection of sleep apnea syndrome[6, 7], and there is still limited research regarding the evaluation of sleep quality.
In existing deep learning-based sleep quality estimation using sleep sounds [8, 9], the basis of evaluation was a black box. Therefore, in this study, we propose a sleep quality classification model based on machine learning using sleep sounds that can provide rationales such as “poor sleep due to frequent tossing and turning during sleep”. By providing rationales, it may be possible to contribute to improving the user’s sleep quality.
In the previous studies [8, 9], the feature representation of sleep sound events was obtained using Variational AutoEncoder (VAE) [10], and the classification of sleep quality was based on Long Short-Term Memory (LSTM) [11]. In this study, we have extended these methods. The novelty and advantages of the proposed approach are as follows:
-
•
Clustering of sleep sound events using Gaussian Mixture Model (GMM) makes it easier to interpret sleep sound events by humans.
-
•
By using the membership probabilities of clusters as representations of sleep sound events, the dimensionality of LSTM is reduced, allowing for an increase in the amount of training data through the proposed data augmentation. As a result, the generalization performance of the model improves.
-
•
With TimeSHAP [12], it becomes possible to analyze important sleep sound events for sleep quality classification and individual-specific features.
2 Related Works
Wu et al. [13] proposed a method based on Kernel Self-Organizing Map to visualize patterns of sleep personalities. In this study, they confirmed the relationship between sleep stages and sleep sounds through comparison with PSG data, demonstrating the validity of sleep evaluation using sleep sounds. Here, sleep stages refer to the depth of sleep (such as REM sleep or non-REM sleep) corresponding to different states of sleep. Furthermore, Wu et al. [14] trained a time-series model of sleep patterns using Hidden Markov Model (HMM) based on sleep sound data recorded at home and performed sleep quality classification using Support Vector Machine (SVM).
Ishimaru et al. [8] proposed a sleep evaluation method considering individual differences using a combination of Variational Domain Adversarial Neural Network with VAE and Domain Adaptation, and LSTM based on sleep sound data recorded at home. Chen et al. [9] performed sleep quality classification considering not only sleep sounds but also external factors such as light and humidity, as well as internal factors such as BMI and health status, using VAE and LSTM. Additionally, in this study, they examined the impact of each factor on sleep by weighting external and internal factors with Gated Residual Network.
These studies [8, 9] had a common issue where the basis of evaluation was considered a black box, making it difficult to understand the extent to which kind of sleep sound event influences the evaluation. In Chen et al.’s study [9], although they investigated the impact of external and internal factors on sleep, they were unable to evaluate the influence of each sleep sound event. Additionally, Wu et al. [14] revealed significant differences in transition probabilities in HMM depending on the quality of sleep, demonstrating the basis for sleep quality classification, but they did not specifically identify important sleep sound events.
In this study, we address this issue by clustering sleep sound events and using TimeSHAP to analyze the SHAP values [15] of each cluster. This allows us to interpret the interpretation of sleep quality classification for a night’s sleep and identify important sleep sound events and individual-specific features, thus resolving this problem.
Another issue arises in the targets of sleep status estimation. Many studies focus on estimating a sequence of “sleep stages” throughout the night [4, 5, 16, 17], including based on sound [18, 19]. Sleep stages serve as the gold standard for sleep research and the diagnosis of sleep disorders in clinical settings. However, we believe that sleep stages may not be an adequate metric for daily-life sleep monitoring, especially when presented to non-experts. The depth of sleep does not necessarily directly reflect the quality of sleep. As there is no widely accepted common definition of sleep quality [20], we propose relying on subjective sleep satisfaction as a metric for daily-life monitoring, rather than sleep stages, or WASSO (Wakefulness After Sleep Onset) and Sleep Efficiency, which are induced by sleep stages.
3 The Proposed Method
3.1 Overview
In this study, building upon existing research [8, 9], we introduce a novel approach by incorporating clustering of sleep sound events to propose a highly accurate and interpretable method for sleep quality classification. Clustering of sleep sound events facilitates the interpretation of each event, enabling the identification of important events for sleep quality classification. By clustering sleep sound events, it becomes easier to assign meaning to each event, allowing for the identification of crucial events for sleep quality classification.
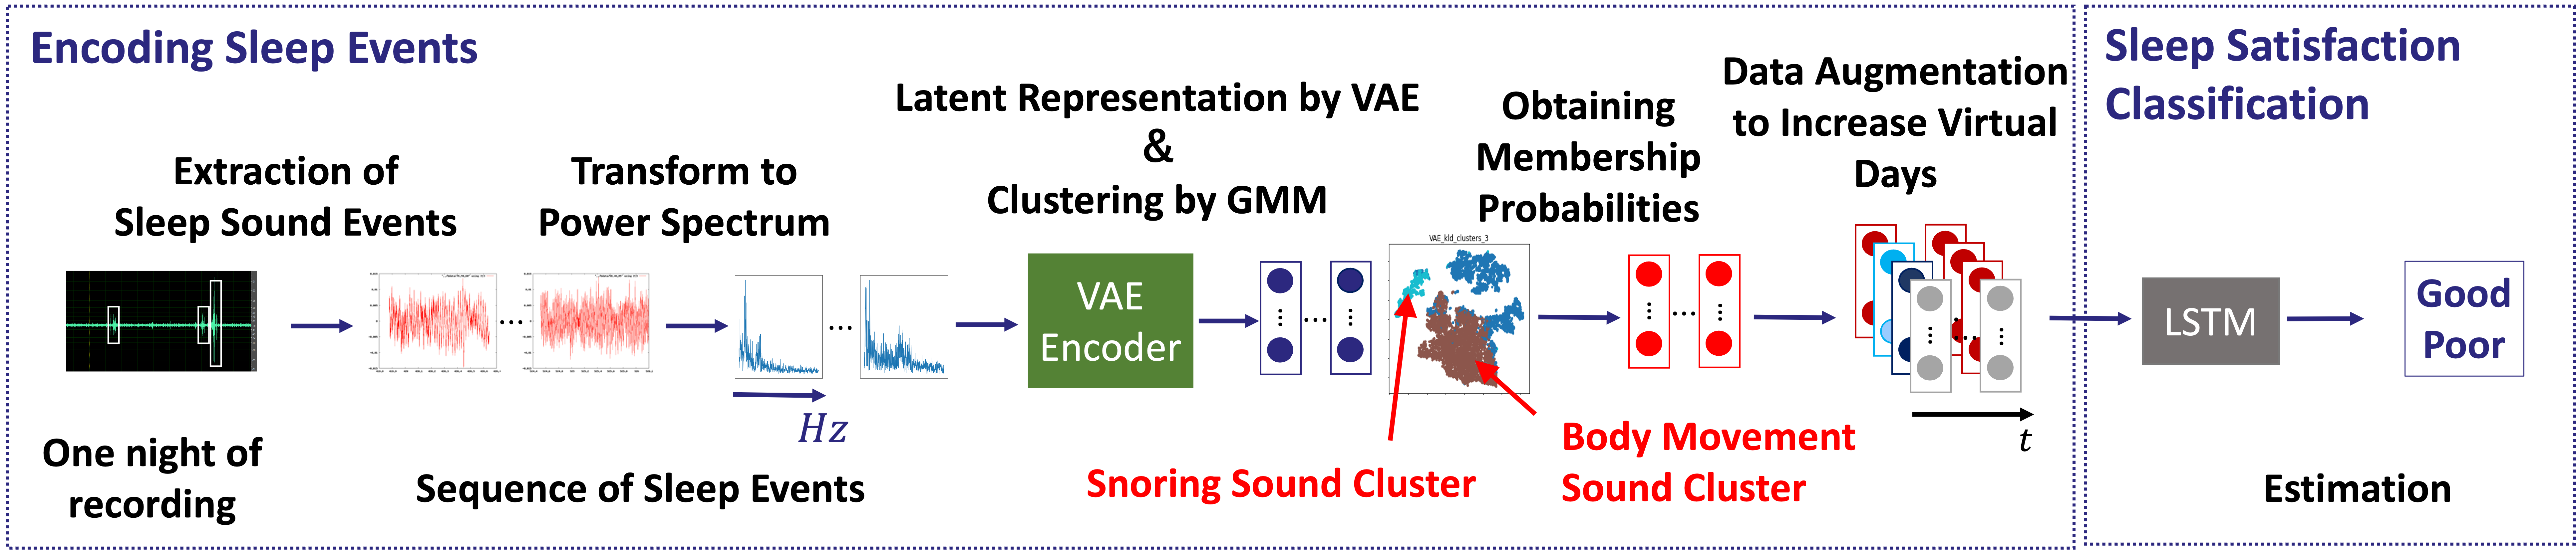
The following is an overview of the proposed method as illustrated in Figure 1. First, sleep sound events are extracted from overnight recordings, and then transformed into the frequency domain using Fast Fourier Transform (FFT). Next, the power spectrum of these sleep sound events serves as input to obtain latent representations through Variational AutoEncoder (VAE). Subsequently, the latent representations of these sleep sound events are clustered using Gaussian Mixture Model (GMM), and the membership probabilities to each cluster are determined. Data augmentation is performed by sampling events multiple times per night to simulate an increase in the number of nights. Then, the probabilities of belonging to each cluster, data augmentation, are fed into an LSTM for sleep quality classification. Finally, TimeSHAP is applied to the trained LSTM model to analyze the SHAP values of each cluster, allowing for the interpretation of important sleep sound events and individual-specific features for sleep quality classification throughout a night.
3.2 Preprocessing
First, sleep sound events are extracted from the audio recorded continuously overnight. Similar to previous studies [8, 9], we employed Kleinberg’s burst extraction method [21] to extract sleep sound events. The burst extraction method is based on the assumption that the amplitude of the waveform follows a normal distribution. It identifies segments that are estimated to be generated persistently from a normal distribution with a larger variance compared to stationary noise.
The extracted sounds are transformed into the frequency domain by applying the Fast Fourier Transform (FFT), and the power spectrum is used as the input vector for the Variational AutoEncoder (VAE). Here, the input vector consists of a 2,400-dimensional vector, with discrete points discretized at 10 Hz intervals ranging from 10 Hz to 24,000 Hz.
Furthermore, due to the characteristics of the burst extraction method, even continuous sounds may be fragmented and extracted separately. Therefore, similar to previous research [8], in this study, we performed subsampling of sleep sound events by setting a threshold on the time interval between the occurrences of sleep sound events.
3.3 Sleep Sound Event Clustering
The Variational AutoEncoder (VAE) learns a latent representation by training on the set of sleep sound events as input. Typically, the mean squared error (MSE) is used as the reconstruction error term in VAE. However, MSE treats each discretized point of the spectrum independently when measuring the error, neglecting the shape of the power spectrum and failing to capture subtle differences between similar sleep sound events [8]. Therefore, similar to previous research [8, 9], in this study, we normalized the power spectrum so that its sum equals one, treating it as a probability distribution, and employed the Kullback-Leibler divergence (KLD) as the reconstruction error term in VAE. By measuring the error as a probability distribution, we aim to acquire latent representations that minimize the distance between similar spectrum in the latent space.
After training the VAE, we use the encoder to obtain the latent representation of the sleep sound event . In this process, only the mean vector is used from the latent representation.
| (1) |
Next, we cluster the set of latent representations of sleep sound events using Gaussian Mixture Model (GMM) and obtain the membership probabilities for the clusters.
3.4 Data Augmentation to Virtually Increasing the Number of Days
Based on the membership probabilities to each cluster obtained through clustering, we construct the event sequence data for a night as the input data for LSTM, denoted as , where represents the number of events in a night. As the number of events in a night ranges from approximately 200 to 4,000, inputting the entire sequence of sleep sound events for a night would result in a sequence length that is too long for LSTM input.
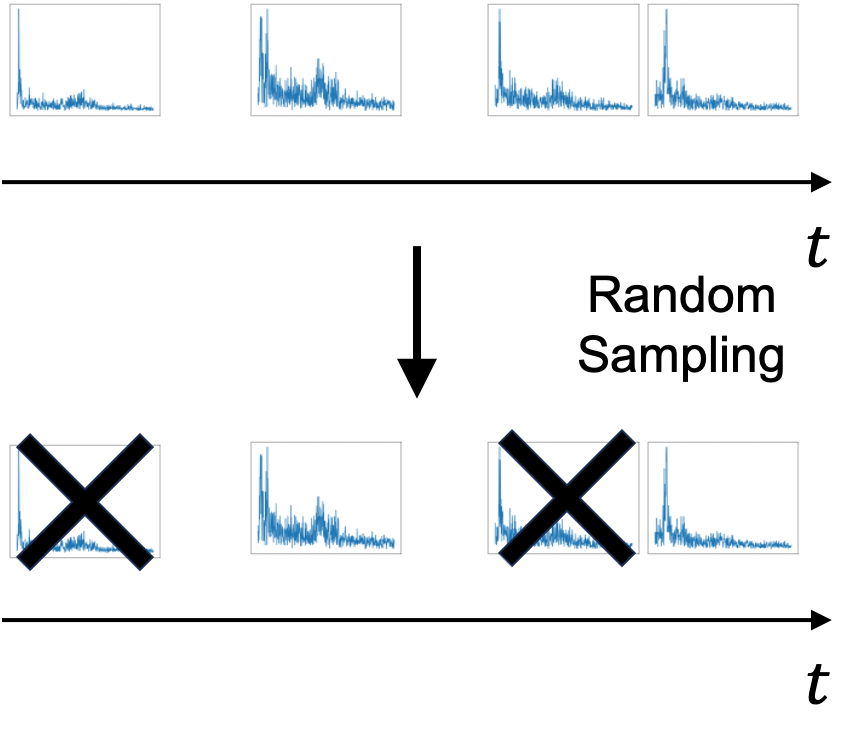
Therefore, similar to previous studies [8, 9], we randomly sample the event sequences at the event level (as shown in Figure 2) and utilize them as inputs for LSTM. In this process, the order of event sequences is preserved. The number of sampling events is set individually for each subject. Furthermore, this study proposes data augmentation to virtually increase the number of days. By performing multiple random samplings, different event sequences are generated, effectively expanding the virtual number of days. This augmentation process is applied to all days.
3.5 Sleep Satisfaction Classification by LSTM
We train an LSTM for subjective evaluation estimation using a sequence-to-one approach to perform sleep quality classification. The subjective evaluation to be estimated is “satisfaction”, which is a binary classification between “satisfied” and “unsatisfied”, excluding “neutral”. Here, sleep satisfaction significantly influences all aspects of subjective evaluations related to daytime activities [22]. Therefore, considering the subjective satisfaction as the supervisory information representing sleep quality is reasonable.
3.6 Interpretation of Sleep Satisfaction Classification by TimeSHAP
Finally, we apply TimeSHAP to the trained LSTM to interpret the sleep quality classification for each level of satisfaction. TimeSHAP extends the SHapley Additive exPlanations (SHAP) method [15] to interpret sequences of events. By analyzing the SHAP values of each cluster and the interpretation of representative clusters, we can identify important sleep sound events, time periods, and individual characteristics. The interpretation of clusters was conducted by randomly selecting sound events, listening to the actual sounds, and estimating the types of events.
4 Experiments
4.1 Dataset
In this study, data collected with the cooperation of participants from a wide range of age groups was utilized. The data collection was conducted with the approval of the Ethics Committee of SANKEN, Osaka University. Participants were asked to record their sleep sounds in their private bedrooms at home for one month. Recording was done using a smartphone (Zenfone Live Android 7.0). Additionally, participants filled out questionnaires. Before bedtime, they provided answers regarding their physical and mental fatigue, presence of illnesses or injuries, etc. After waking up, they rated their sleep satisfaction and the indoor environment during sleep. Sleep satisfaction was rated on a five-point scale: “very satisfied,” “satisfied,” “neutral,” “unsatisfied,” and “very unsatisfied.” Moreover, participants’ profiles such as age and gender were recorded.
In the experiments of this study, data from days without the use of air conditioning equipment such as air conditioners or fans, based on questionnaire responses to ensure minimal noise in sleep sounds, were selected. Additionally, data from participants who had a cold or injury were excluded. From the selected participants, three individuals were chosen based on having a high number of days with satisfied or unsatisfied sleep. Table 1 presents the profiles of the three selected participants and the number of days with satisfied and unsatisfied.
In prior studies [8, 9], a common model was trained on the participants group, whereas this study trains individual models for each person. Since each participant contributed data for approximately 20 days, we consider this to be a sufficient number of days for training individual models.
| subject ID | age | gender | # satisfied days | # unsatisfied days |
|---|---|---|---|---|
| 1 | 43 | F | 8 | 10 |
| 2 | 23 | M | 12 | 8 |
| 3 | 21 | F | 10 | 11 |
4.2 Classification Result of Sleep Satisfaction
In this experiment, we conducted sleep quality classification using the proposed method and examined its classification accuracy. First, we trained the LSTM with varying conditions, the dimensionality of VAE latent space, and the number of clusters in GMM. The LSTM had a single hidden layer with 50 nodes, and a dropout rate of 0.2 was applied between the hidden and output layers. The output layer utilized a Sigmoid activation function. We employed the Adam optimizer [23] with a learning rate of 0.001. The sampling size of the sound events used in LSTM training was set according to the number of events for each participant. The multiplying factor of the augmentation was set to 5,000 for all participants. To prevent overfitting, we employed Early Stopping if the loss on the test data did not improve for more than 5 epochs. To increase the number of trials, we performed 4-Fold Cross Validation five times with different random seeds to determine the optimal conditions for each participant. The results are presented in Tables 2, 3, and 4. It was observed that the optimal conditions for the dimensionality of VAE latent space and the number of clusters for achieving high accuracy varied among participants.
| # clusters \VAE dim. | 20 | 100 | 150 |
|---|---|---|---|
| 3 | 0.698±0.058 | 0.705±0.056 | 0.640±0.058 |
| 6 | 0.892±0.036 | 0.818±0.058 | 0.813±0.080 |
| 9 | 0.782±0.070 | 0.748±0.056 | 0.838±0.076 |
| # clusters \VAE dim. | 20 | 100 | 150 |
|---|---|---|---|
| 3 | 0.710±0.066 | 0.826±0.061 | 0.640±0.037 |
| 6 | 0.763±0.085 | 0.740±0.097 | 0.782±0.091 |
| 9 | 0.740±0.020 | 0.720±0.081 | 0.690±0.058 |
| # clusters \VAE dim. | 20 | 100 | 150 |
|---|---|---|---|
| 3 | 0.772±0.040 | 0.732±0.095 | 0.783±0.096 |
| 6 | 0.862±0.060 | 0.795±0.042 | 0.948±0.050 |
| 9 | 0.857±0.070 | 0.895±0.064 | 0.842±0.071 |
Next, we investigated the effectiveness of the proposed data augmentation and the impact of multiplying factor on accuracy. The multiplying factor ranged from 200 to 5,000, and we compared the obtained accuracies at each factor. The dimensionality of the VAE latent space and the number of clusters for each participant were set to the optimal parameters determined in the aforementioned experiments. The results are presented in Table 5. It is evident from the results that the accuracy significantly improved with data augmentation for all participants. Thus, it can be concluded that the proposed method enables accurate classification of sleep quality for a night. Moreover, it is observed that higher multiplying factors tend to result in higher accuracy compared to lower factors.
| multiplying factor \subject ID | 1 | 2 | 3 |
|---|---|---|---|
| None | 0.800±0.044 | 0.600±0.00 | 0.717±0.066 |
| 200 | 0.845±0.075 | 0.740±0.102 | 0.858±0.068 |
| 500 | 0.818±0.053 | 0.730±0.129 | 0.827±0.076 |
| 1,000 | 0.845±0.075 | 0.780±0.081 | 0.867±0.100 |
| 2,000 | 0.903±0.040 | 0.840±0.073 | 0.893±0.048 |
| 5,000 | 0.893±0.036 | 0.826±0.061 | 0.948±0.050 |
For each participant, the highest accuracy achieved was 90.3% for subject 1, 84.0% for subject 2, and 94.8% for subject 3. These results demonstrate that the proposed method achieves sufficiently high accuracy for sleep quality classification.
4.3 Interpretation of Sleep Satisfaction Classification
In this experiment, we applied TimeSHAP to the trained LSTM model to interpret the classification of sleep satisfaction for a night’s sleep. First, we examined the clusters that are important for sleep satisfaction classification across the entire sleep period. We calculated SHAP values for days with satisfied and unsatisfied ratings and compared the magnitude of SHAP values and differences in important clusters. Here, we interpreted days with satisfied ratings by focusing on the positive side and days with unsatisfied ratings by focusing on the negative side of the SHAP values.
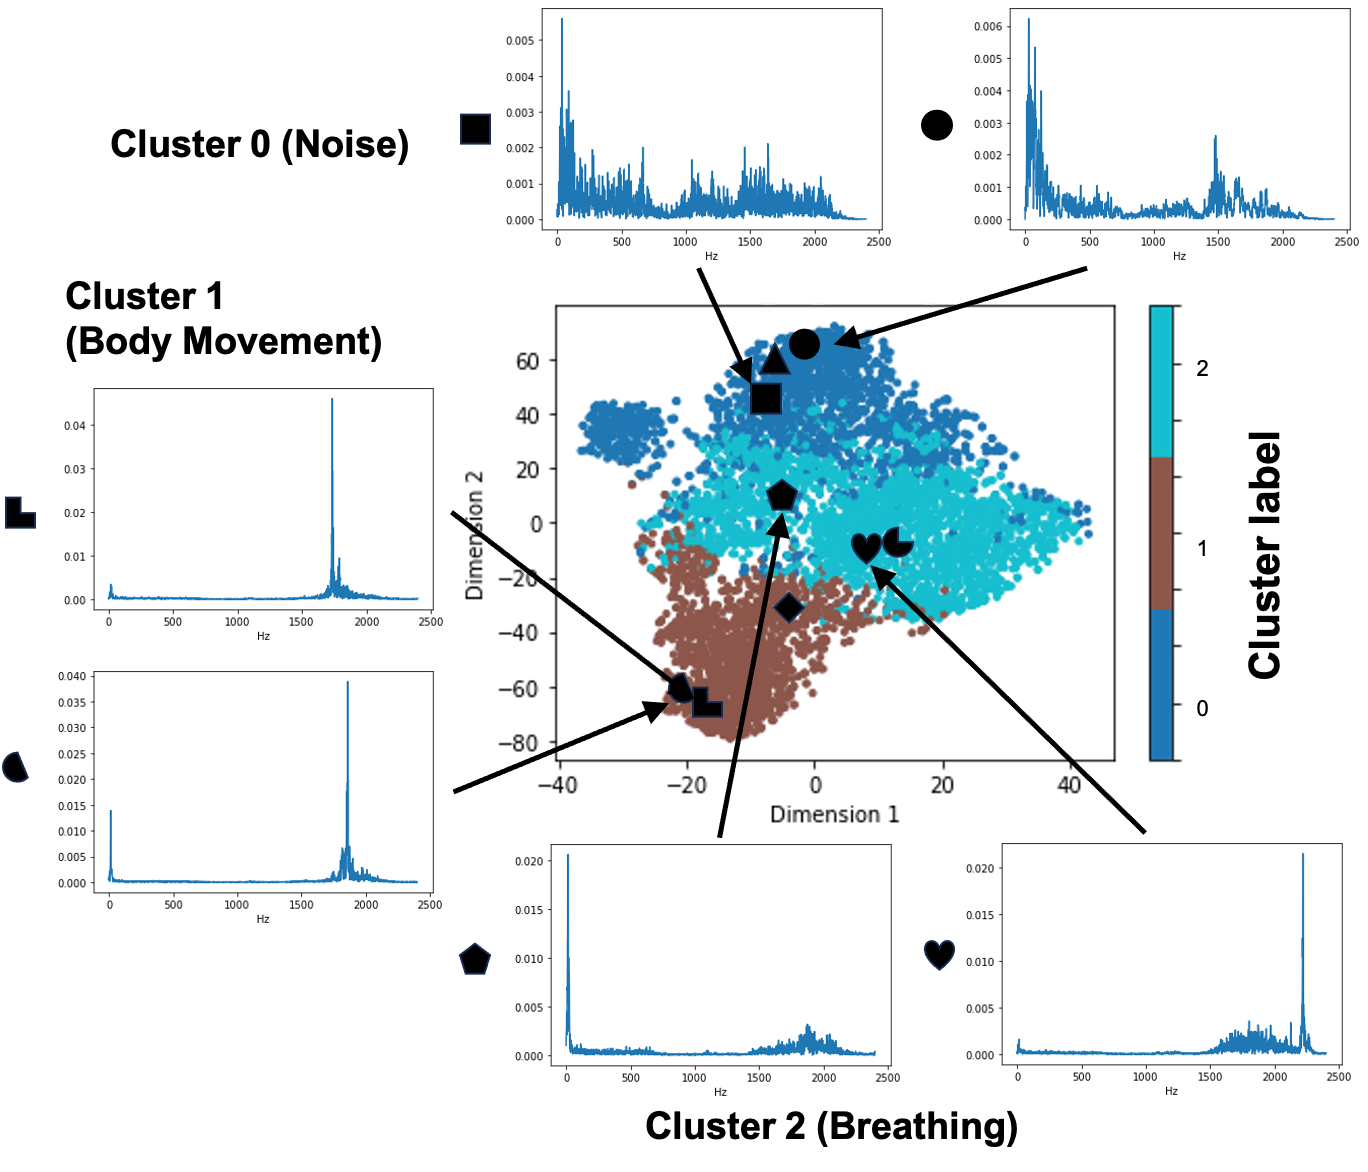
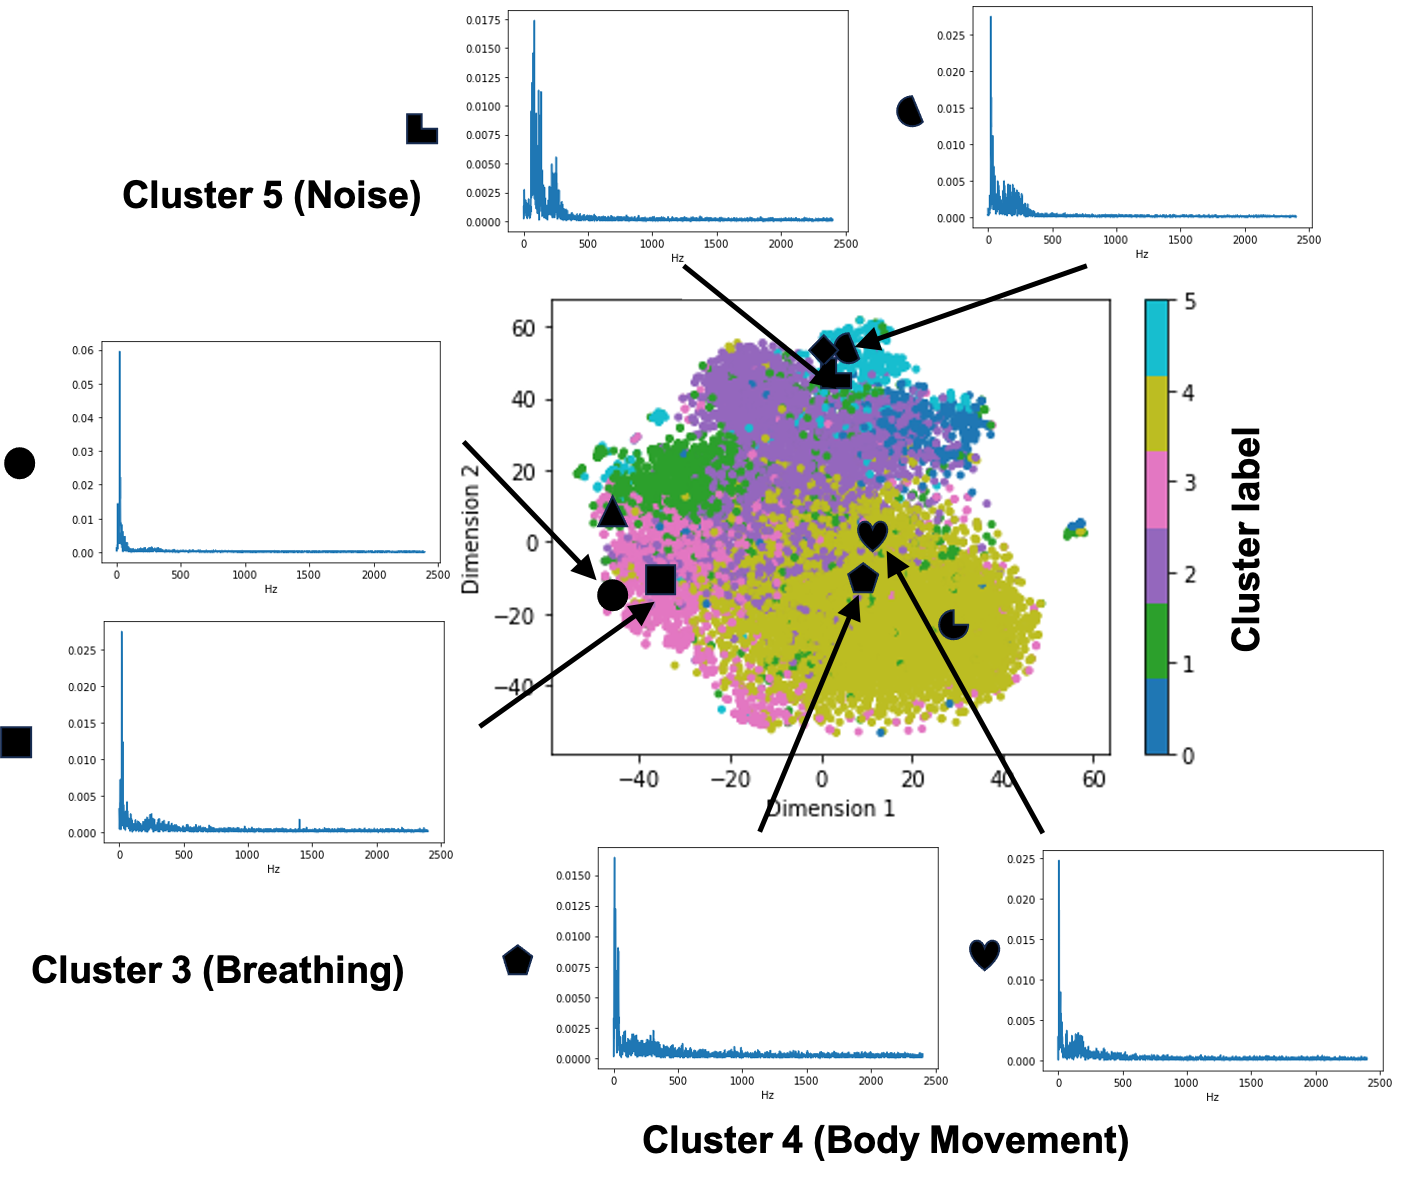
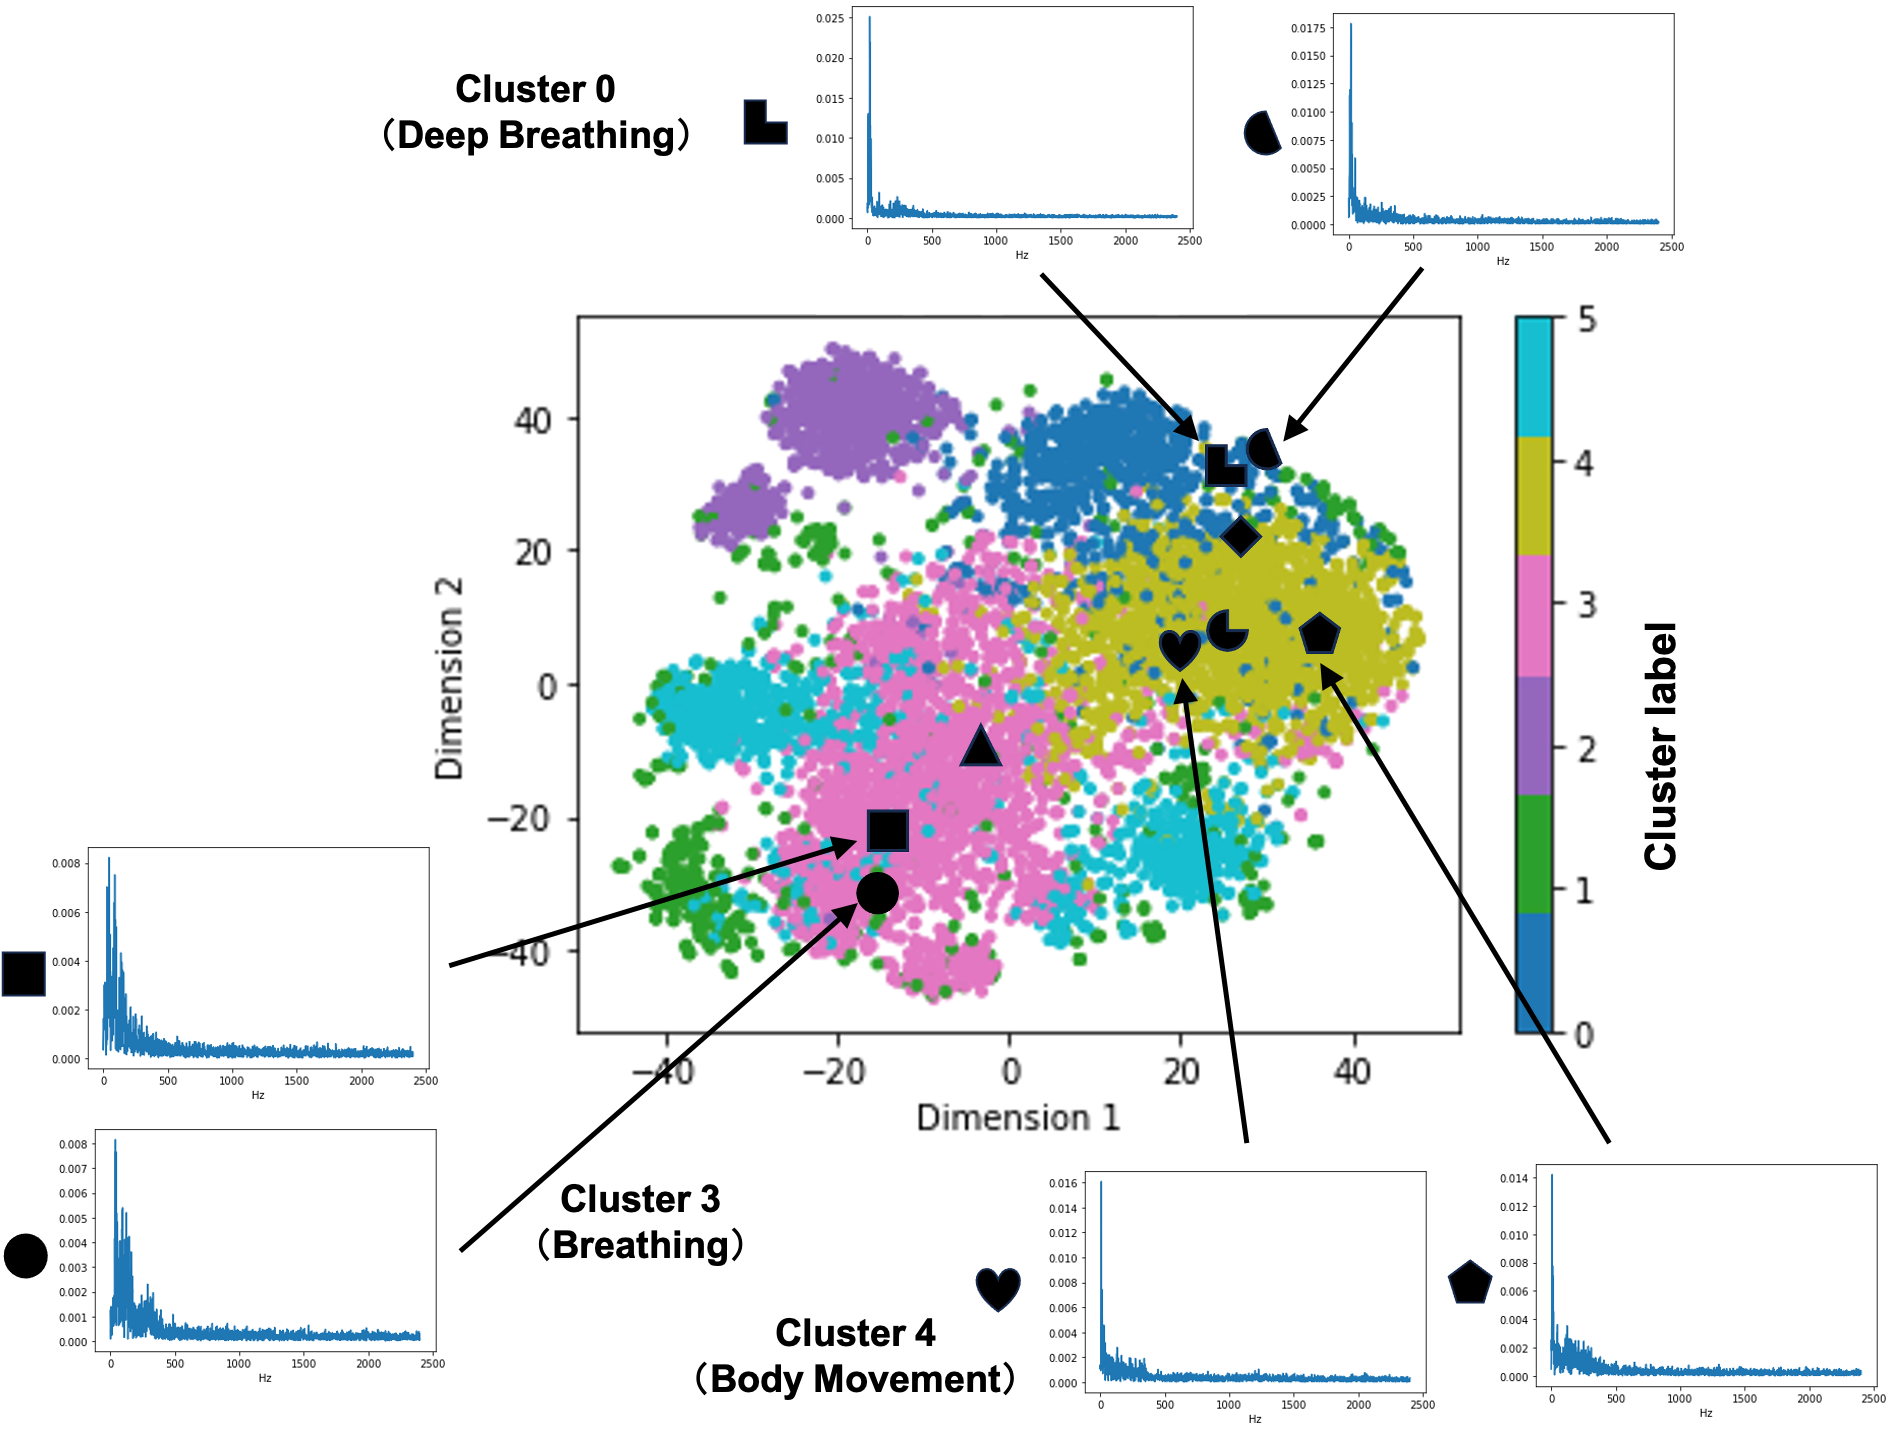
For each subject, we examined the sleep sound events belonging to the clusters with the largest positive, second-largest positive, and the largest negative SHAP values. While some sounds were impossible to identify upon listening, it was found that in all participants, clusters with large positive SHAP values had a higher proportion of body movement sounds and breathing sounds, indicating their importance on days with high satisfaction. Conversely, clusters with relatively large negative SHAP values had a higher proportion of noise such as deep breathing for Subject 1, and sounds like cars or motorcycles for Subjects 2 and 3, indicating their importance on days with low satisfaction. Furthermore, the ranking of importance for these sleep sound events varied among subjects. As an illustration, Figure 3 shows the correspondence between sleep sound events and the latent space plots for important clusters using t-SNE for Subject 1.
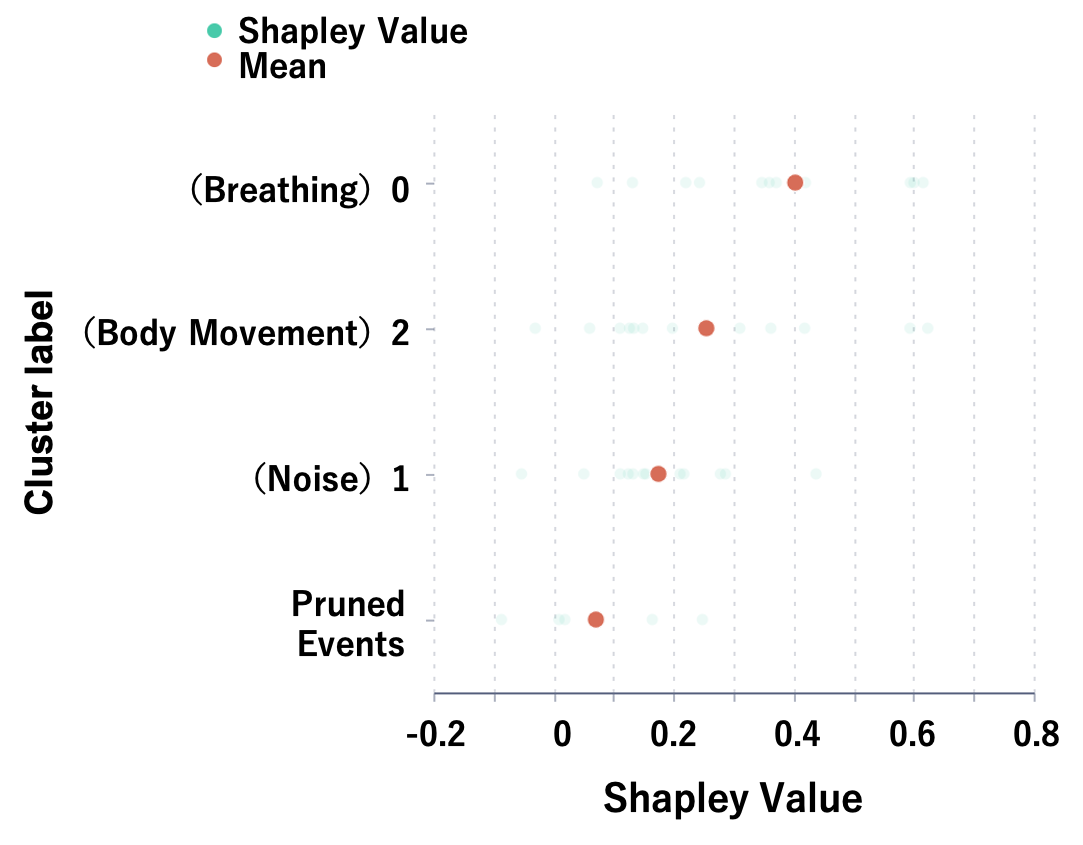
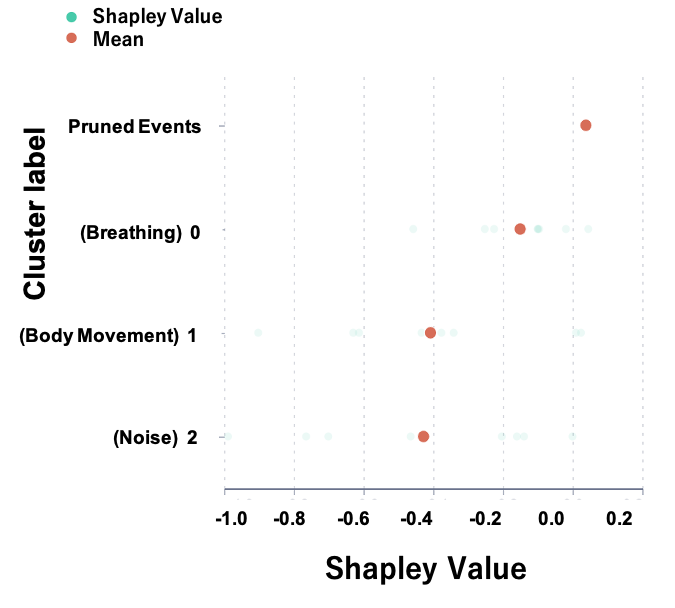
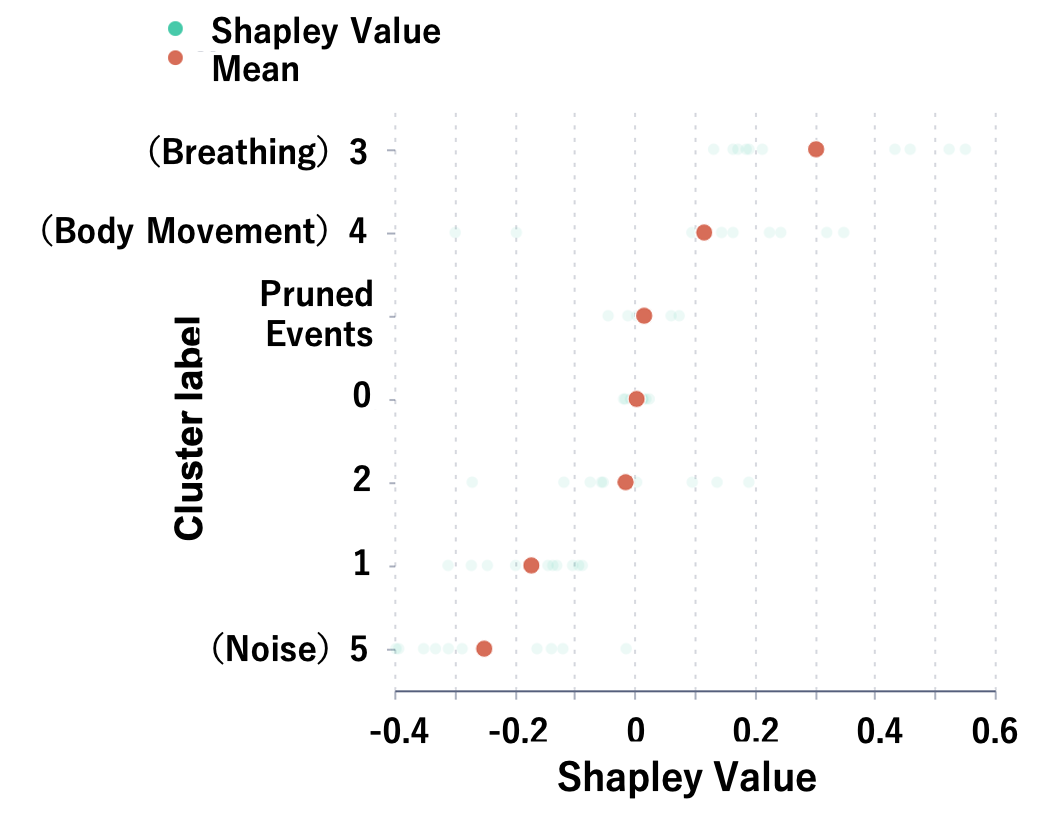
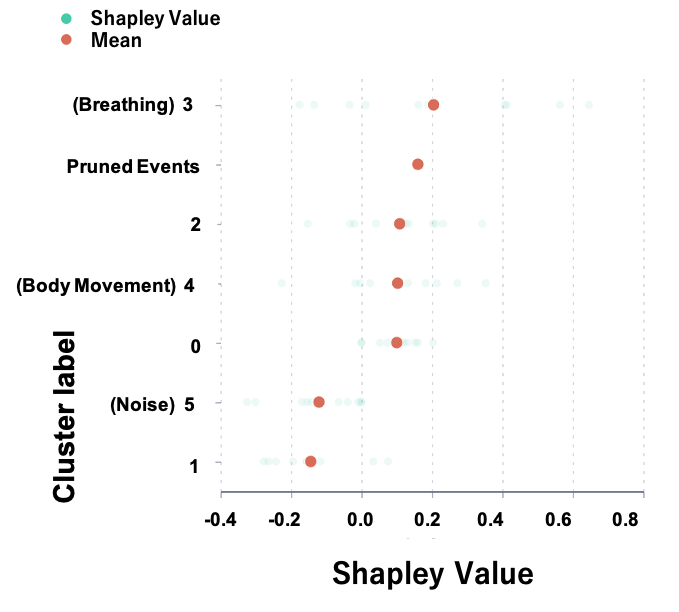
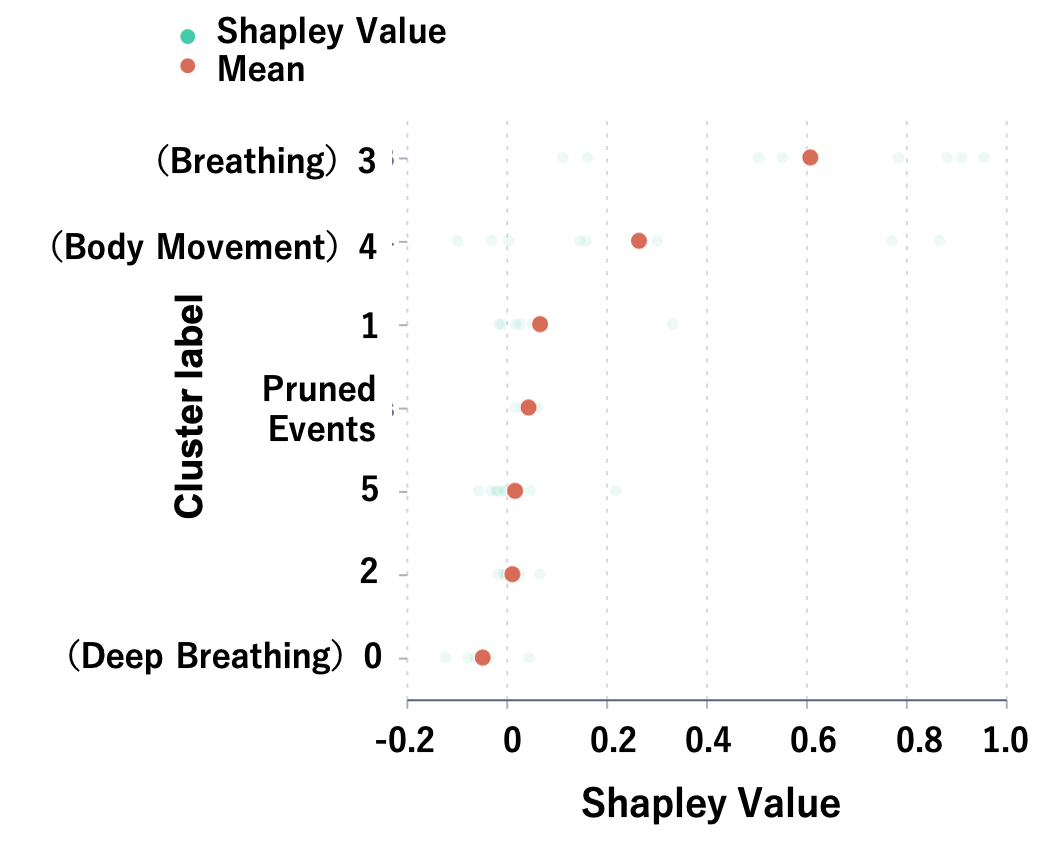
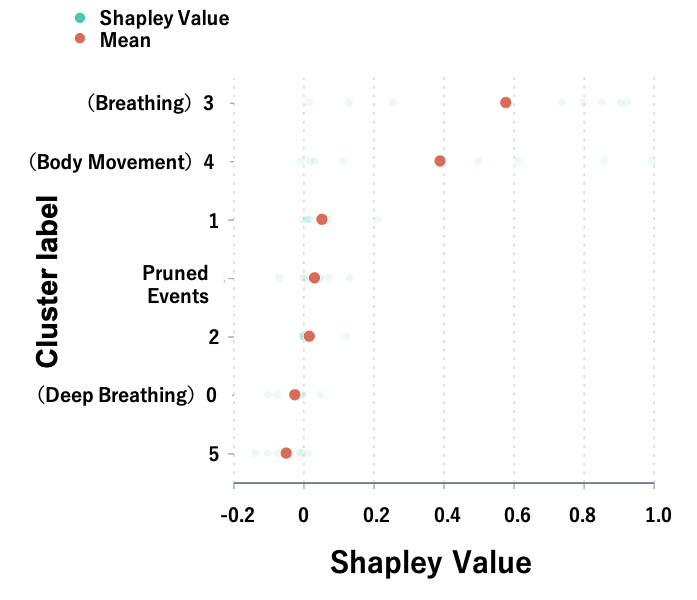
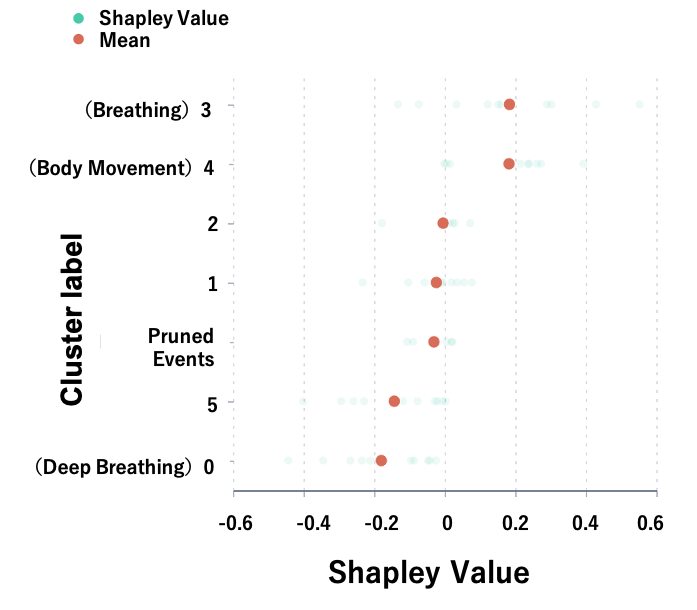
As a representative example, the results of applying TimeSHAP to Subject 1 are shown in Figure 4. Results for Subjects 2 and 3 are provided in the appendix. Here, “Pruned Events” represent features from past events that have been pruned in the direction of sequence events to reduce computational complexity. On days with satisfied, Cluster 3 (breathing sounds) stands out with significantly large SHAP values. Conversely, on days with low satisfaction, only Cluster 0 (deep breathing sounds) has a negative value, but the difference in SHAP values between clusters is not substantial. This indicates that for Participant 1, days with high satisfaction are characterized by a high importance of breathing sounds, while days with low satisfaction are characterized by a relatively higher importance of deep breathing sounds. It is conjectured that these deep breathing sounds occur after apnea, followed by a deep breathing.
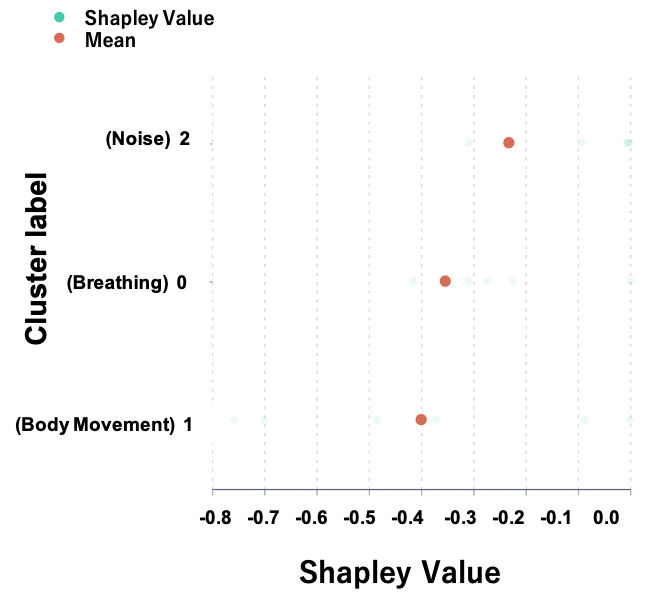
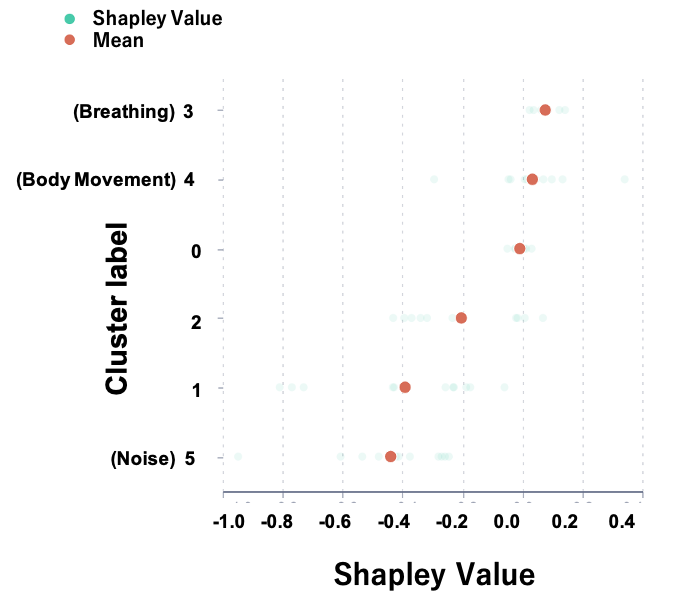
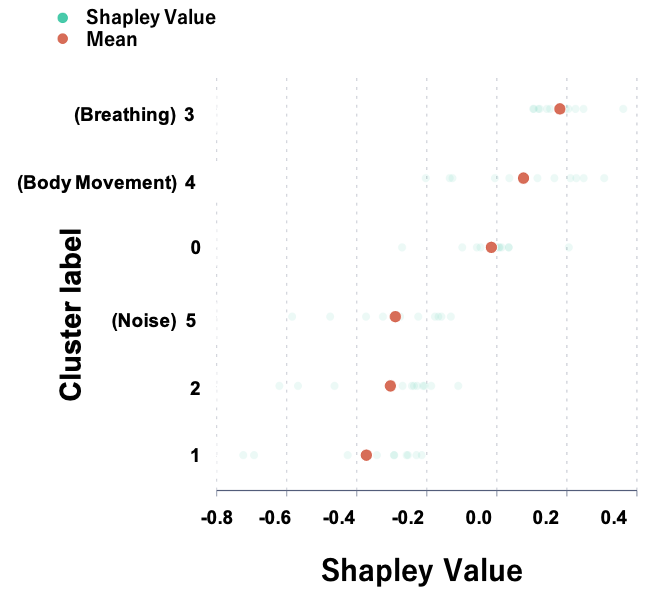
Next, we examined the importance of time periods and their respective features for sleep quality assessment, considering the time series aspect. Since TimeSHAP aggregates earlier parts of the sequence into pruned events to reduce computational complexity, applying TimeSHAP to a model trained on data from an entire night of sleep does not allow us to assess the importance of the early stages of sleep. Therefore, we divided the sequence data into three equal parts based on the sequence of events: early, middle, and late stages of sleep, and compared the magnitudes of SHAP values and differences in important clusters. The model to which TimeSHAP was applied was trained on data divided into these three segments according to the sequence of sound events.
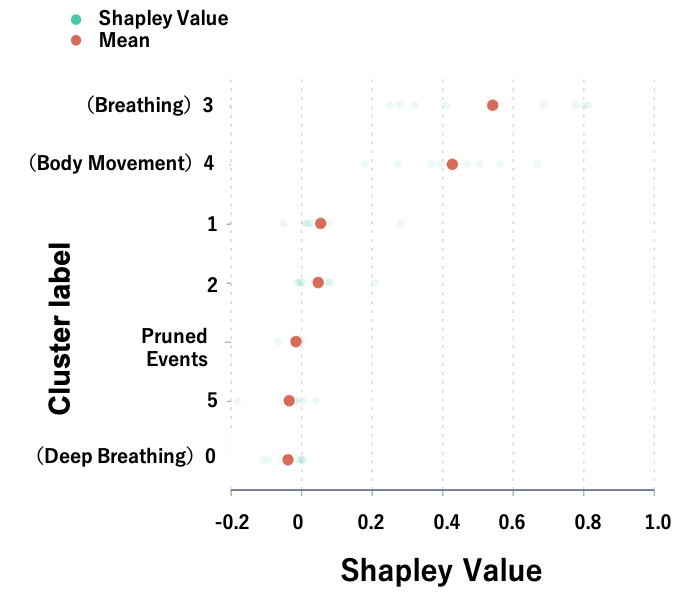
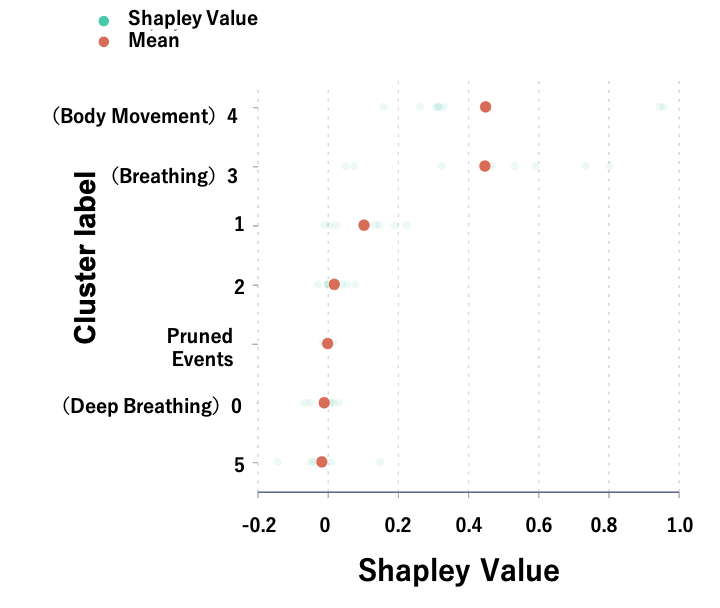
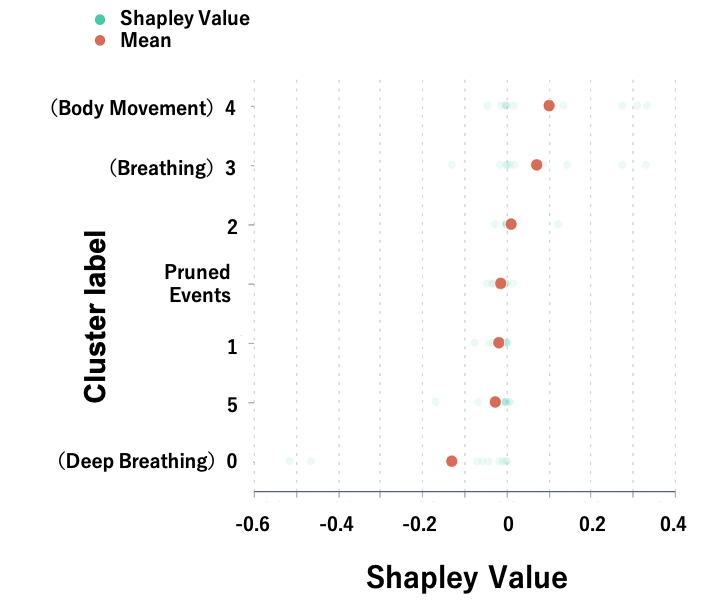
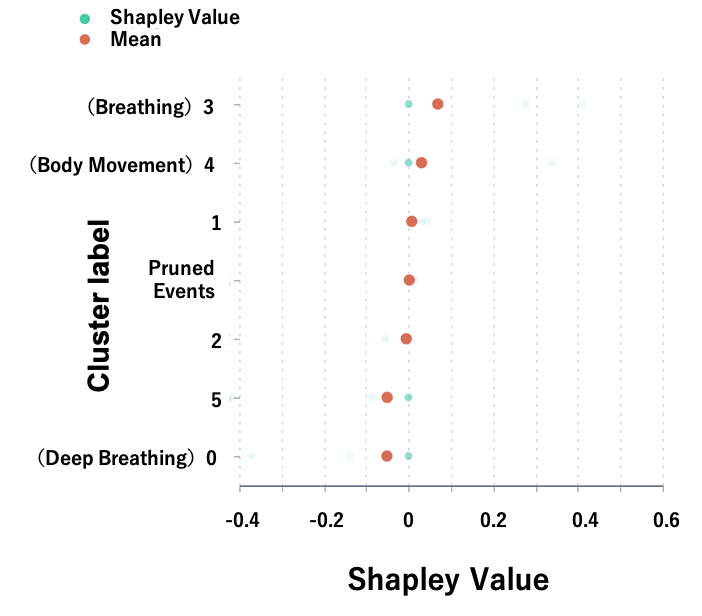
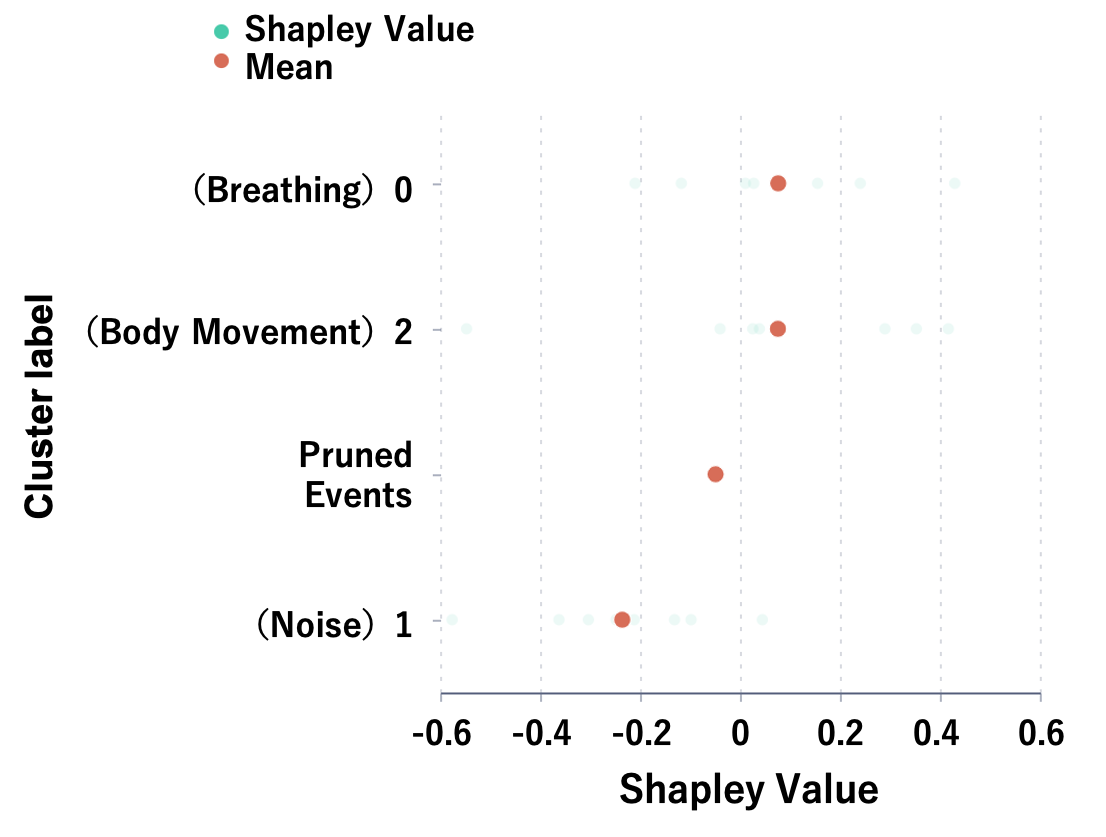
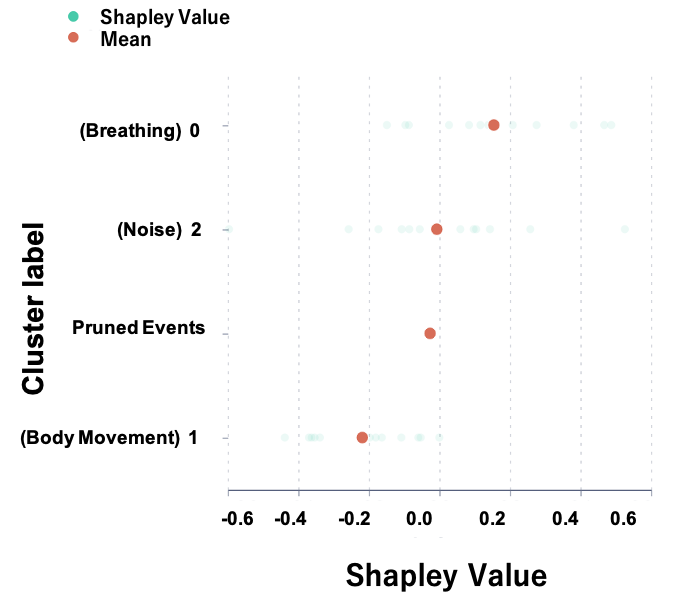
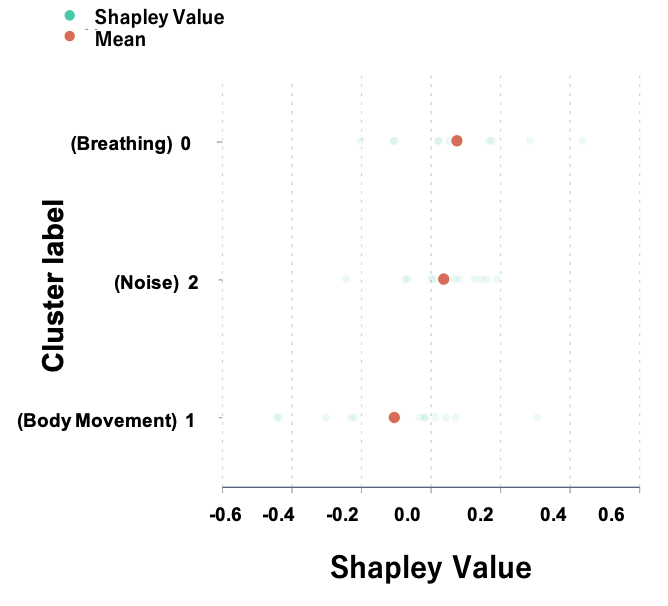
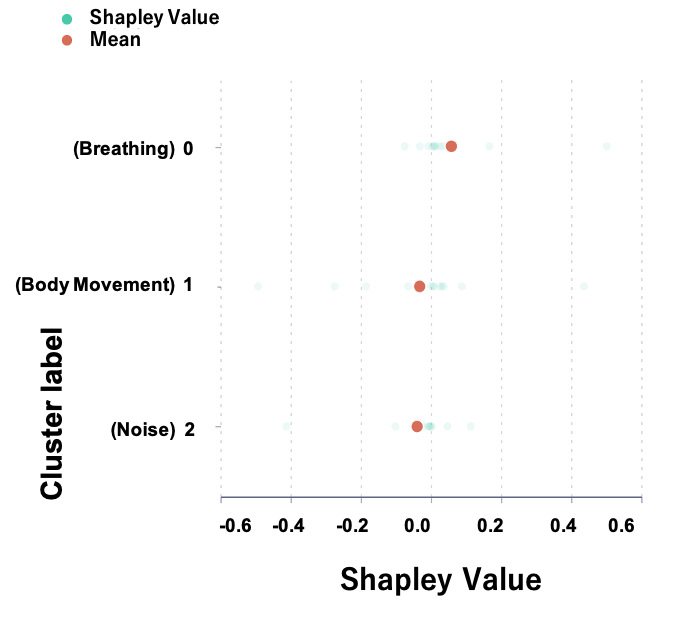
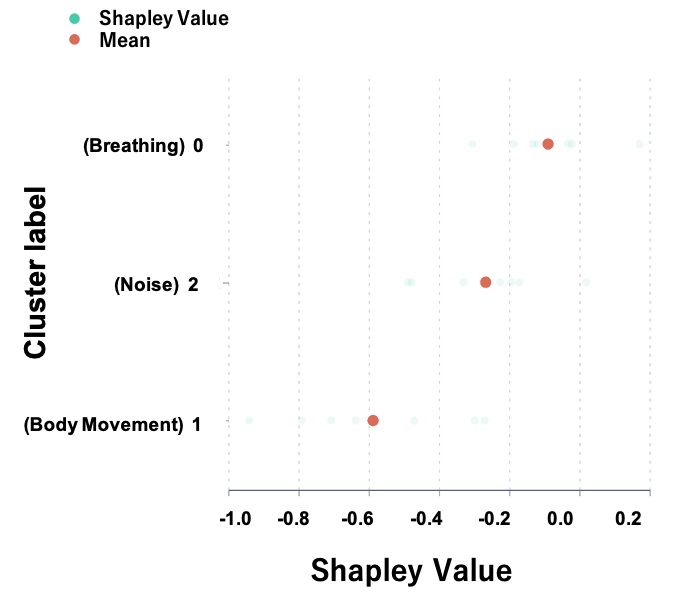
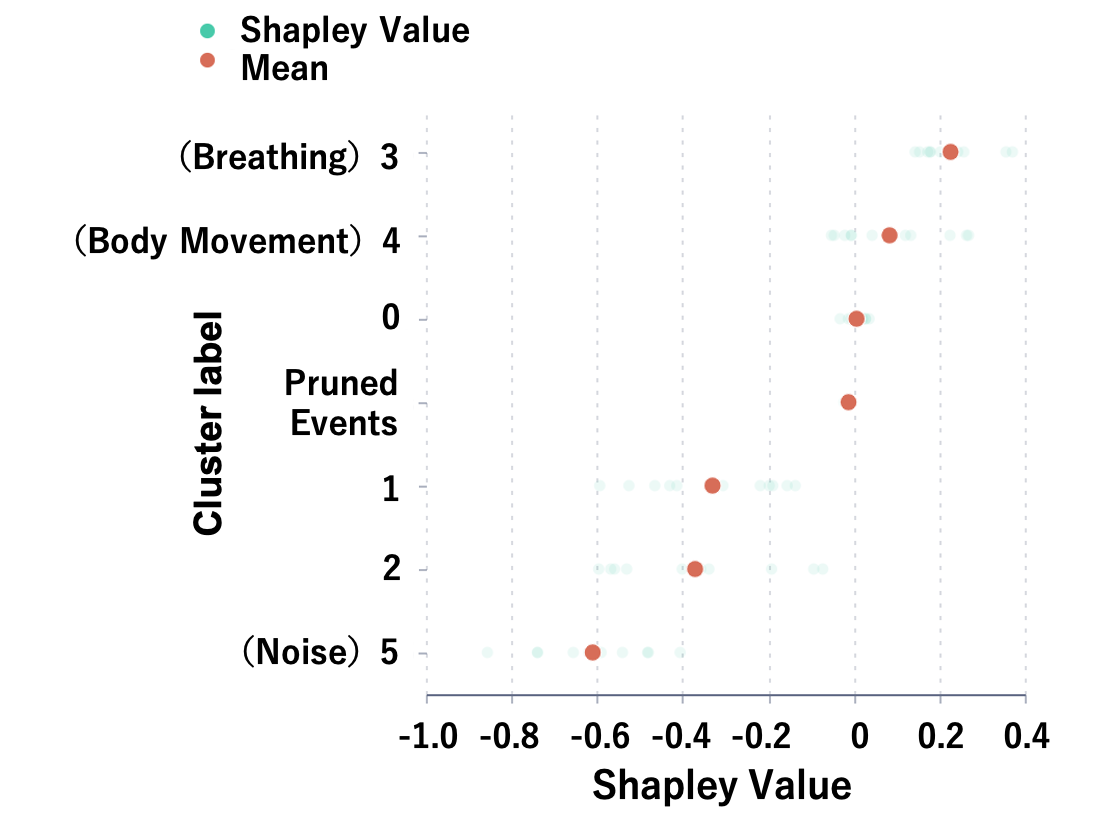
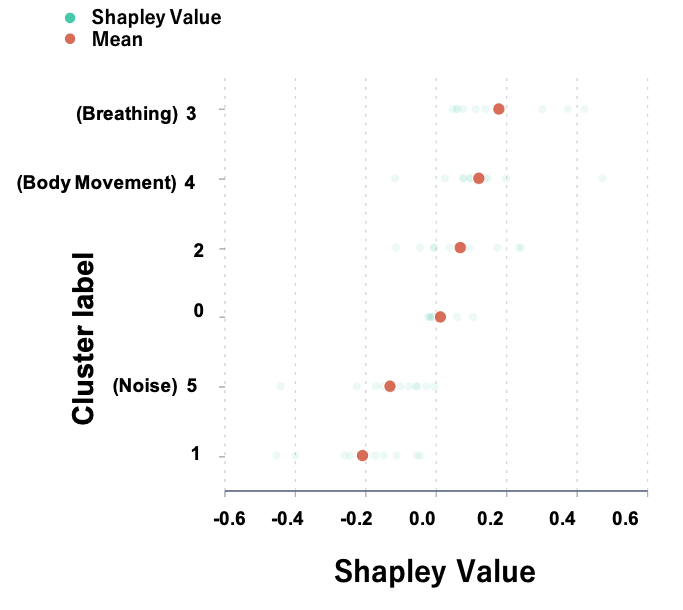
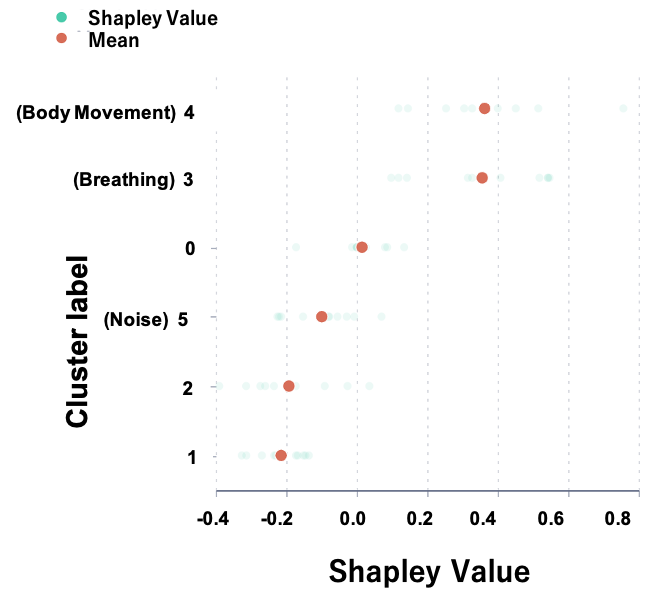
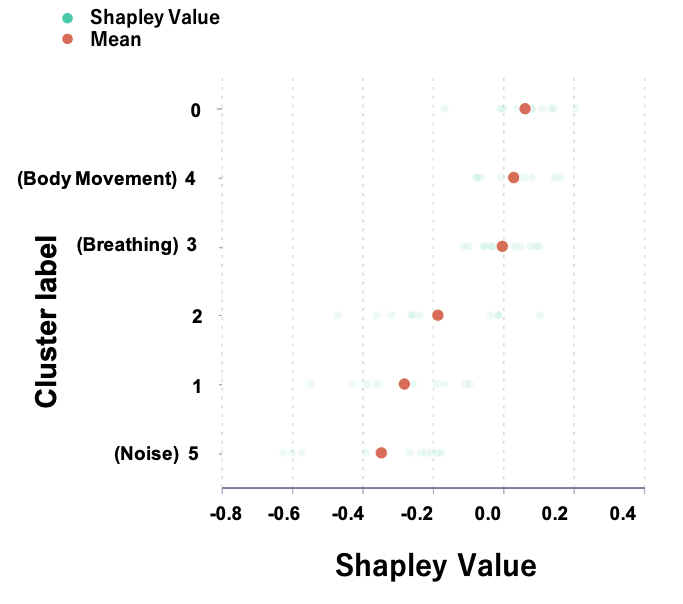
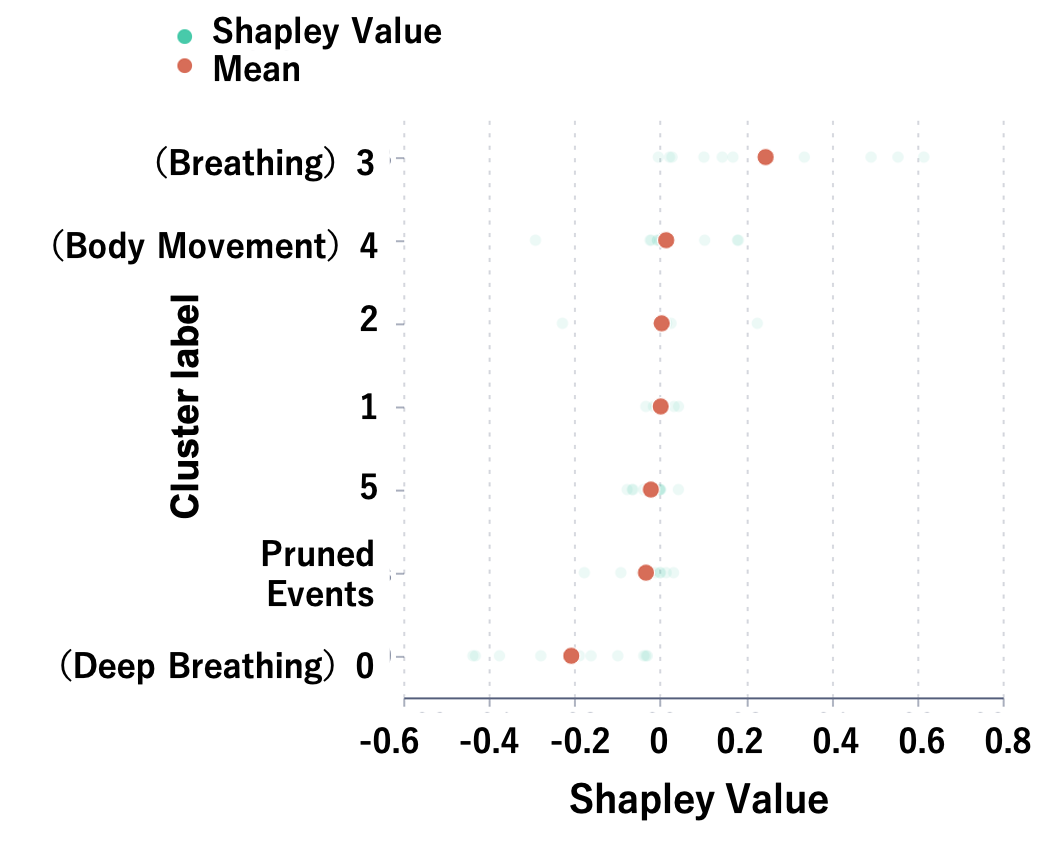
The experiment results revealed that the important time periods and their respective features vary among subjects. This suggests that the proposed method can analyze individual sleep characteristics. As an example, the SHAP values for each of the three segments of the sequence for Subject 1 are shown in Figures 5 and 6. The sleep issues observed on days with unsatisfied for each subject are as follows:
-
•
For Subject 1, the SHAP values of Cluster 0 (large breathing sounds) are relatively large negative values in the early and late segments. However, the differences in SHAP values between clusters in the middle segment are smaller compared to the early and late segments, and their absolute values are also smaller. This indicates that the presence of large breathing sounds in the early and late segments is problematic, suggesting a possibility of sleep apnea syndrome (including pre-syndrome).
-
•
For Subject 2, the SHAP values for noise are significantly large negative values in all time periods, suggesting that noise is likely to disrupt sleep.
-
•
For Subject 3, the SHAP values for noise are significantly large negative values in the early and late segments, similar to Subject 2, indicating that noise is likely to disrupt sleep.
4.4 Comparison with the Conventional Method
We compared the accuracy of sleep satisfaction classification between the proposed method and the conventional method, which used VAE for extracting latent representations of sleep sound events and directly input to LSTM.
To ensure approximately equal computational time per epoch between the proposed and conventional methods, we adjusted the data augmentation factor for the conventional method. We then compared the accuracy of sleep quality assessment for each method. Additionally, we conducted a one-sided t-test with a significance level of 5% to confirm whether there was a significant difference in the mean values between the proposed and conventional methods.
The experimental results are presented in Table 6. For the conventional method, the latent space dimension of VAE and the multiplying factor of data augmentation were (100, 120) for Subject 1, (20, 300) for Subject 2, and (150, 200) for Subject 3, respectively. The values in the table for the conventional method were obtained using the optimal latent space dimension of VAE. It can be observed that the proposed method outperforms the conventional method in terms of accuracy for all subjects. Furthermore, the accuracy of the proposed method was significantly higher than that of the conventional method for Subject 1 and Subject 2. Therefore, it can be concluded that the proposed method achieves at least the same level of accuracy as the conventional method when compared.
| ID | Proposed | Conventional | statistical significance |
|---|---|---|---|
| 1 | 0.864±0.040 | 0.820±0.060 | ✓ |
| 2 | 0.835±0.018 | 0.800±0.050 | ✓ |
| 3 | 0.940±0.033 | 0.917± 0.075 |
5 Conclusion
This study proposed an interpretable method for sleep quality classification using clustering of latent representations of sleep sound events. The experimental results demonstrated that the proposed method achieves high accuracy in classifying sleep satisfaction for a night. Furthermore, we showed significant differences in the importance of clusters based on sleep satisfaction, the ability of the proposed method to analyze individual sleep characteristics, and identify areas for improvement. Additionally, we demonstrated that the proposed method achieves equal or higher accuracy to the conventional method.
The following are the future challenges. The first challenge lies in the significant variation of optimal VAE dimensions and cluster numbers among individuals. Efficient tuning methods will be necessary when deploying sleep evaluation applications using the proposed method. The second challenge involves the manual labeling of sleep sound events. Since there are individual differences of the sounds even for the same events, it is necessary to label sleep sound events for each individual. Manual labeling becomes difficult when deploying on a large scale. Therefore, there is a need to streamline labeling through methods such as constructing an event classifier and utilizing transfer learning.
References
- [1] A. Malhotra, M. Younes, S.T. Kuna, R. Benca, C.A. Kushida, J. Walsh, A. Hanlon, B. Staley, A.I. Pack, G.W. Pien. “Performance of an automated polysomnography scoring system versus computer-assisted manual scoring.” Sleep. 1;36(4):573-82, 2013.
- [2] S. Kwon, H. Kim and W. H. Yeo, “Recent advances in wearable sensors and portable electronics for sleep monitoring,” iScience, 24(5), 102461, 2021.
- [3] S. Zhao, F. Long, X. Wei, N. Ni, H. Wang, and B. Wei B, “Evaluation of a Single-Channel EEG-Based Sleep Staging Algorithm,” International Journal of Environmental Research and Public Health, 1;19(5):2845, 2022.
- [4] S. Mousavi, F. Afghah, and U. R. Acharya, “SleepEEGNet: Automated sleep stage scoring with sequence to sequence deep learning approach,” PloS One, 14(5), e0216456, 2019.
- [5] R. Gargees, J. M. Keller, and M. S. Popescu, “Non-invasive Classification of Sleep Stages with a Hydraulic Bed Sensor Using Deep Learning,” International Conference on Smart Homes and Health Telematics, pp. 73–82, 2019.
- [6] H. Nakano, T. Furukawa, and T. Tanigawa, “Tracheal Sound Analysis Using a Deep Neural Network to Detect Sleep Apnea,” Journal of Clinical Sleep Medicine, vol. 15, no. 8, pp. 1125–1133, 2019.
- [7] J. Luo, H. Liu, X. Gao, B. Wang, X. Zhu, Y. Shi, X. Hei, and X. Ren, “A Novel Deep Feature Transfer-Based OSA Detection Method Using Sleep Sound Signals,” Physiological Measurement, vol. 41, no. 7, 075009, 2020.
- [8] K. Fukui, S. Ishimaru, T. Kato, and M. Numao. “Sound-based Sleep Assessment with Controllable Subject-Dependent Embedding Using Variational Domain Adversarial Neural Network,” International Journal of Data Science and Analytics, 2023.
- [9] Y. Chen, T. Morita, T. Kimura, T. Kato, M. Numao, and K. Fukui. “Gated Variable Selection Neural Network for Multimodal Sleep Quality Assessment,” Proc. 32nd International Conference on Artificial Neural Networks, pp. 288-299, Heraklion Crete, Greece, 2023.
- [10] D.P. Kingma, and M. Welling. “Auto-encoding Variational Bayes,” Proc. 2nd International Conference on Learning Representations (ICLR) Banff Alberta, Canada, 2014.
- [11] S. Hochreiter and J. Schmidhuber, “Long Short-Term Memory,” Neural Computation, vol.9, no.8, pp.1735–1780, 1997.
- [12] J. Bento, P. Saleiro, A.F. Cruz, M.A.T. Figueiredo, and P. Bizarro, “TimeSHAP: Explaining Recurrent Models through Sequence Perturbations,” Proc. 27th ACM SIGKDD Conference on Knowledge Discovery and Data Mining, pp. 2565–2573, Singapore, 2021.
- [13] H. Wu, T. Kato, T. Yamada, M. Numao, and K. Fukui, “Personal Sleep Pattern Visualization Using Sequence-Based Kernel Self-Organizing Map on Sound Data,” Artificial Intelligence in Medicine, vol. 80, pp. 1–10, 2017.
- [14] H. Wu, T. Kato, T. Yamada, M. Numao, and K. Fukui, “Statistical Sleep Pattern Modelling for Sleep Quality Assessment Based on Sound Events,” Health Information Science and Systems, vol. 5, pp. 1–11, 2017.
- [15] S. Lundberg, and S. Lee, “A Unified Approach to Interpreting Model Predictions,” Advances in Neural Information Processing Systems, vol. 30, pp. 4765–4774, 2017.
- [16] M. Zhao, S. Yue, D. Katabi, T. S. Jaakkola, and M. T. Bianchi, “Learning sleep stages from radio signals: A conditional adversarial architecture,” Proc. the 34th International Conference on Machine Learning(ICML2017), 8, pp. 6205–6214, 2017.
- [17] H. Phan, K. Mikkelsen, O. Y. Chén, P. Koch, A. Mertins, and Maarten De Vos, “SleepTransformer: Automatic Sleep Staging With Interpretability and Uncertainty Quantification,” IEEE Transactions on Biomedical Engineering (TBME), vol. 69, no. 8, pp. 2456-2467, 2022.
- [18] H. H. Tran, J. K. Hong, H. Jang, J. Jung, J. Kim, J. Hong, M. Lee, J. W. Kim, C. A. Kushida, D. Lee, D¿ Kim, and I. Y. Yoon, “Prediction of Sleep Stages Via Deep Learning Using Smartphone Audio Recordings in Home Environments: Model Development and Validation,” Journal of Medical Internet Research, vol. 25, pp. 1–14, 2023.
- [19] E. Dafna, A. Tarasiuk, and Y. Zigel, “Sleep staging using nocturnal sound analysis,” Scientific Reports, 8(1), pp. 1–14, 2018.
- [20] A. Crivello, P. Barsocchi, M. Girolami, and F. Palumbo, “The Meaning of Sleep Quality: A Survey of Available Technologies,” IEEE Access, Vol. 7, pp. 167374–167390, 2019.
- [21] J. Kleinberg, “Bursty and hierarchical structure in streams,” Proc. 8th ACM SIGKDD International Conference on Knowledge Discovery and Data Mining, pp. 1–25, Edmonton Alberta, Canada, 2002.
- [22] A. Lenneis, A. Das-Friebel, N.K.Y. Tang, A.N. Sanborn, S. Lemola, H. Singmann, D. Wolke, A. von Mühlenen, and A. Realo, “The influence of sleep on subjective well-being: An experience sampling study,” Emotion, vol. 23, no. 1, pp. 451–464, 2024.
- [23] D.P. Kingma, and J. Ba, “Adam: a Method for Stochastic Optimization,” Proc. International Conference on Learning Representations, 2015.
- [24] L. van der Maaten, and G. Hinton. “Visualizing data using t-SNE,” Journal of Machine Learning Research, vol. 9, no. 86, pp. 2579–2605, 2008.
Appendix A Results of Interpretation of Sleep Satisfaction Classification