Finding Lensed Radio Sources with the VLA Sky Survey
Abstract
Radio observations of strongly lensed objects are valuable as cosmological probes. Lensed radio sources have proven difficult to identify in large part due to the limited depth and angular resolution of the previous generation of radio sky surveys, and as such, only a few dozen lensed radio sources are known. In this work we present the results of a pilot study using the Very Large Array Sky Survey (VLASS) in combination with optical data to more efficiently identify lensed radio sources. We obtain high-resolution () VLA follow-up observations for 11 targets that we identify using three different techniques: i) a search for compact radio sources offset from galaxies with high lensing potential, ii) VLASS detections of known lensed galaxies, iii) VLASS detections of known lensed quasars. 5 of our targets show radio emission from the lensed images, including of the lensed optical quasar systems. This work demonstrates the efficacy of combining deep and high-resolution wide-area radio and optical survey data to efficiently find lensed radio sources, and we discuss the potential impact of such an approach using next-generation surveys with the Vera C. Rubin Observatory, Euclid, and Nancy Grace Roman Space Telescope.
1 Introduction
Strong gravitational lensing, the phenomenon by which multiple images of a background source are created by a foreground lens, has been an active and growing field of study since the discovery of the first lensed object by Walsh et al. (1979). Since then, the advent of high-resolution space-based optical imaging from the Hubble Space Telescope and large ground-based optical surveys have increased the number of known lenses today to many hundreds (e.g., Jacobs et al., 2019; Huang et al., 2020; Zaborowski et al., 2023; Lemon et al., 2024).
Gravitational lensing is achromatic, and strong lenses can be observed in any wavelength of light, though relative abundances vary across the electromagnetic spectrum. At radio frequencies, under 100 lensed sources are known, as opposed to the thousands of optical ones. This is due in part to the relative scarcity of radio sources. For example, the Faint Images of the Radio Sky at Twenty-centimeters (FIRST, Becker et al., 1995; Helfand et al., 2015) and the imaging portion of the optical Sloan Digital Sky Survey (SDSS York et al., 2000; Abazajian et al., 2009), which covered the same area and were roughly contemporaneous, had source densities of and , respectively. Furthermore, the angular resolution needed to identify strong lensing, typically on the scale of arcsecond for galaxy-galaxy lenses (McKean et al., 2015; Collett, 2015), also presents a large barrier to finding lensed radio sources as the angular resolution of wide area surveys has historically been on the order of a few tens of arcseconds (e.g, Condon et al., 1998; Bock et al., 1999; Intema et al., 2017). This has historically resulted in samples of rare candidate lensed radio sources being overwhelmingly contaminated by non-lensed objects (e.g. Jackson & Browne, 2007). Successful radio searches for lensing, such as the Jodrell Bank Astrometric Survey (JVAS, King et al., 1999) and the Cosmic Lens All-Sky Survey (CLASS, Myers et al., 2003; Browne et al., 2003), began with a flux-limited sample to limit the amount of necessary high-resolution follow-up to confirm lensing. More recently, radio lens searches have taken advantage of the abundance of optical lensed quasars by conducting deep observations of these to try to detect radio emission (Jackson et al., 2015; Dobie et al., 2024). In the future, facilities such as the Square Kilometer Array (SKA, Braun et al., 2019) and next generation Very Large Array (ngVLA, Carilli et al., 2015) will provide depth and sub-arcsecond resolution in combination with high survey-speeds, making them efficient lens-finding tools. Currently however, only limited sky areas (of order a few square degrees) have been observed with the requisite combination of depth and angular resolution to readily identify strong lensing at radio wavelengths (Morabito et al., 2022).
The Very Large Array Sky Survey (VLASS, Lacy et al., 2020) provides angular resolution across of sky at 3 GHz. By 2025 VLASS will have observed its entire footprint over three distinct epochs, and at the time of writing, VLASS has already completed two of these epochs with the third epoch already underway. While VLASS does not posses the resolution necessary to separate the images of most lensed quasars (Lemon et al., 2019), the beam of survey allows for high confidence associations with optical sources and is less subject to contamination from interloping sources than other near-all-sky radio surveys.
The scientific applications of radio lenses are numerous, and range from probing the structure of AGN jets at high redshift (Spingola et al., 2019b) to studying the magnetic fields of lens galaxies (Mao et al., 2017). One particularly exciting possibility lies in the characterization of low-mass dark matter halos to constrain the microphysics of dark matter. Due to the sensitivity of image magnifications and deflections to all mass along the line of sight between source and observer, lensing observations are sensitive to the lower end of the dark matter halo mass function, especially the “completely dark halos” not massive enough to form stars (Vegetti et al., 2023; Bechtol et al., 2022). The milliarcsecond-scale astrometric perturbations caused by these halos (Metcalf & Madau, 2001) currently can only be accessed using the resolution of radio Very Long baseline Interferometry (VLBI). Such gravitational imaging analyses can potentially differentiate between different models of dark matter phenomenology (e.g., Spingola et al., 2019a; Powell et al., 2023). Next-generation telescopes such as SKA and ngVLA will be able to perform observations of lens systems quickly and robustly – larger samples of candidate systems are important to inform both the theory and technical development of those dark matter analyses.
In this paper, we present the results of a VLASS-based search for strong lensed radio sources, and report the detection of radio emission from five previously known optically lensed quasars. In Section 2 we describe our candidate selection process, Section 3 provides a summary of our observations, and Section 4 presents the results of each candidate observed in detail. In Section 5 we discuss the population of known lensed radio sources and the potential for future survey-based radio lens searches. We summarize this work in Section 6.
2 Candidate Identification
In selecting sources for the VLA observations, we took a two-pronged approach based on both known lens systems and catalog-based optical-radio cross-matching. We identify radio sources using the VLASS epoch 1 quick-look catalog from Gordon et al. (2021), which contains reliable detections with mJy at . To account for the known astrometric errors in the quick-look data, we have corrected the source positions based on the method of Bruzewski et al. (2021). 111Since the identification of these targets in 2022, a version of the epoch 1 VLASS Quick Look catalog with corrected astrometry has been made available (B. Sebastian et al., in prep.)
2.1 Known Lensed Optical Sources
As lensed radio sources are rare, knowing a priori that a system is a gravitational lens maximises the efficiency in searching for these objects. To this end, we cross match the VLASS catalog with two catalogs of known optical lenses using data from Gaia (Gaia Collaboration et al., 2016) and the Dark Energy Survey (DES, Dark Energy Survey Collaboration et al., 2016).
We first used the catalog of lensed quasars in Gaia (Lemon et al., 2017, 2018, 2019), finding 43 matches with VLASS. Of these, 31 were previously known lensed radio sources, and a further 7 had existing archival observations at sufficient resolution and depth to confirm or reject the radio lensing hypothesis without the need for additional telescope time. An additional candidate was also rejected after visual inspection of the VLASS data showed the lens galaxy to be an FR I radio galaxy, implying the radio emission in the system came from the lens rather than the lensed source. After these cuts we were left with 5 candidate new radio lenses.
We also cross-matched VLASS with strongly lensed systems in DES (Jacobs et al., 2019). Here we found 17 matches, all of which were neither previously known strong lenses nor had archival high-resolution VLA data. Visually inspecting these 17 objects showed that in most of these cases, the radio emission was more likely due to the lens galaxy being a radio galaxy. While in theory it is possible to observe radio emission from both the lens and source, we did not prioritize these targets. In two cases we found the radio emission to be consistent with being from the lensed images and require higher resolution follow up to confirm their nature. However, due to limited observing time we only observed one of these with the VLA for this paper.
2.2 Blind Search for Lensed Sources From Optical/Radio Cross Associations
In addition to combining VLASS with catalogs of known optical lenses, we adopted the approach of Jackson & Browne (2007) (hereafter JB07) to conduct a blind search for lensed systems in the radio catalog data. The JB07 method assumes the lensed source flux is blended together into a single detection at the survey resolution, and predicts an offset from the lens galaxy due to the unequal magnifications inherent in lensed images. Additionally, these blended components should have position angles either close to or perpendicular to that of the lens galaxy’s optical position angle for 2 and 4-image systems, respectively. JB07 matched the SDSS and FIRST surveys, identifying candidates, none of which were lenses. However, the wealth of additional candidates afforded by increased depth and sky coverage since JB07 has led us to use their method with VLASS and DES to attempt to identify further candidate lensed radio systems.
We begin by narrowing our optical selection to luminous red galaxies (LRGs), which due to their high mass are the most common type of lens galaxy, and are often embedded in larger structures which can increase lensing probability. We used the Dark Energy Spectroscopic Instrument Legacy Survey 9th data release (LS-DR9, Dey et al., 2019) as the optical survey. LS-DR9 covers nearly the entire sky at in the bands down to a point source depth of mag in the Legacy Survey northern fields () and mag in the southern sky. Additionally LS-DR9 provides mid-infrared forced photometry from the unblended Wide-field Infrared Survey Experiment (unWISE, Wright et al., 2010; Lang, 2014) bands. We follow the selection criteria of Zhou et al. (2020), to select LRGs with high purity. We then cross matched these with VLASS sources that were marginally resolved (; where is the major axis of the source after deconvolution from the beam), selecting only those matches that satisfy the angular separation and misalignment criteria used in JB07.
We are interested in radio emission from the background lensed source rather than extended radio lobes from the lens galaxy, the latter of which may mimic the configuration of lensed radio sources in catalog space and as such are a likely contaminant for this selection technique. As radio lobes are expected to have steep radio spectra, a spectral index cut identifying only flat spectrum radio sources is a straightforward way to minimise such contamination of our sample. We achieved this by estimating the spectral index222throughout this work we adopt the convention relating flux density, , and frequency, , by , , using data from the NRAO VLA Sky Survey (NVSS, Condon et al., 1998), and selecting only those sources with . In determining the spectral indices, VLASS flux measurements are scaled by , as per the recommendation of Gordon et al. (2021), to correct for the known underestimation of flux densities in the VLASS quick look catalog. Furthermore, given the large difference in angular resolution between VLASS () and NVSS (), spectral indices are only considered reliable when single VLASS sources are matched to an NVSS source.
We find candidate radio lenses using this method. We visually inspect these candidates to identify plausible targets, with expected to yield a genuine lensed source (Jackson & Browne, 2007, example rejects from this inspection are shown in Figure 1). After visual inspection, we are left with only a handful of viable candidates. Motivated by the desire to test the efficiency of our method while only using limited amounts of telescope time, we select the five most promising candidates for VLA follow-up.
| Name | Integration time | Image RMS | Calibrator | Identification method | ||
|---|---|---|---|---|---|---|
| [mJy] | [s] | [] | ||||
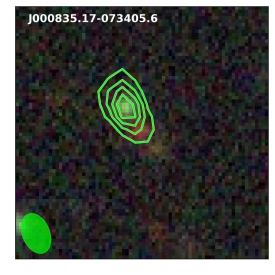
| J000835.17073405.6 | 3.5 | +0.13 | 80 | 25 | J00060623 | JB07 method |
| J0013+5119 | 2.4 | -0.53 | 130 | 21 | J2355+4950 | Gaia lensed QSO |
| DES J04122646 | 2.8 | -0.30 | 90 | 30 | J04161851 | DES lensed galaxy |
| J120157.21+421703.4 | 4.2 | +0.16 | 90 | 119 | J1146+3958 | JB07 method |
| J135413.22+325937.1 | 3.0 | -0.11 | 90 | 107 | J1416+3444 | JB07 method |
| J171527.20+280452.4 | 2.6 | -0.31 | 100 | 107 | J1753+2848 | JB07 method |
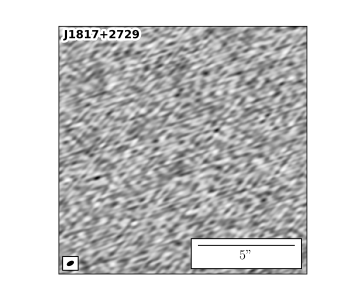
| J1817+2729 | 3.0 | +0.09 | 90 | 115 | J1753+2848 | Gaia lensed QSO |
| J2145+6345 | 1.3 | -0.60 aaJ2145+6345 is not detected in NVSS and is outside the footprint of FIRST. As such we estimate a spectral index limit based on the mJy detection limit of NVSS. | 299 | 15 | J2022+6136 | Gaia lensed QSO |
| HS B2209+1914 | 2.3 | -0.88 | 219 | 17 | J2212+2355 | Gaia lensed QSO |
| WISE J23291258 | 1.2 | -0.96 | 448 | 11 | J23311556 | Gaia lensed QSO |
| J233353.31+255450.6 | 4.9 | -0.22 | 75 | 52 bbThe image RMS for J233353+255450 is given for the uv-tapered image, see Section 4.3.4. | J2340+2641 | JB07 method |
Note. — This table lists (1) the name of the candidate lensed radio source; (2) the flux density in VLASS epoch 1; (3) the estimated spectral index between GHz and GHz based on measurements from VLASS and either FIRST or NVSS depending on sky location; (4) the time for which we observed the target; (5) the RMS noise of our cleaned image; and (6) the complex gain calibrator for that source. Column (7) notes whether the target was identified from known lensed quasars in Gaia (Lemon et al., 2019), lensed galaxies in DES (Jacobs et al., 2019) or by applying the method of Jackson & Browne (2007) to the VLASS and LS DR9 catalogs.
3 VLA Observations
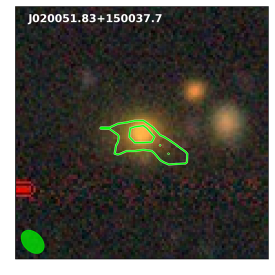
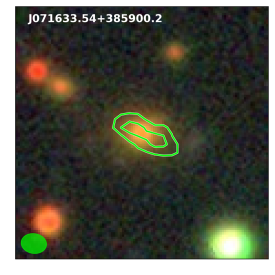
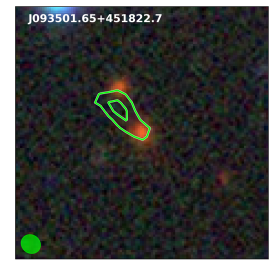
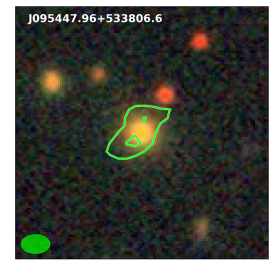
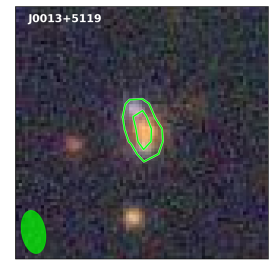
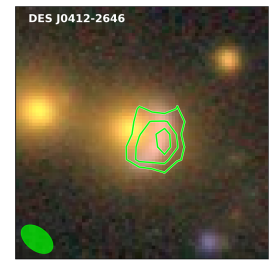
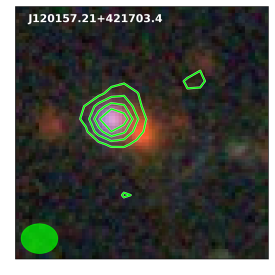
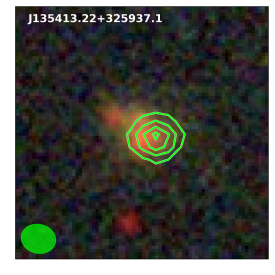
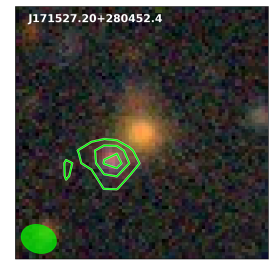
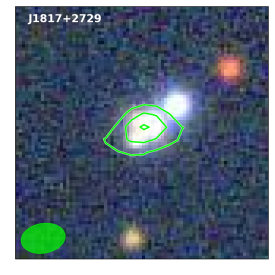
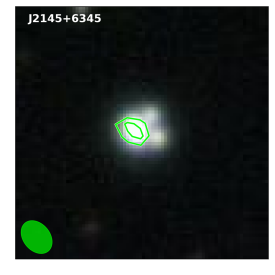
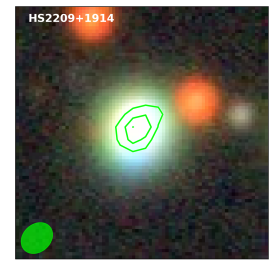
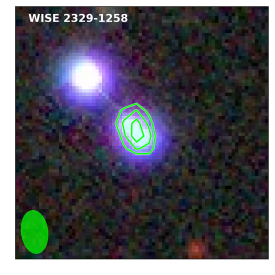
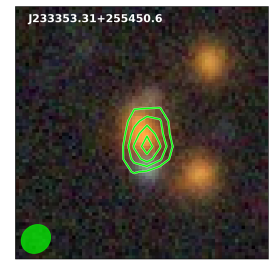
Using our two selection approaches and removing those previously known lensed radio sources and those targets for which there are high resolution observations in the VLA archive, we are left with 11 targets. We show optical images overlaid with VLASS contours in Figure 2. We observe these targets with the Karl G. Jansky Very Large Array (VLA) in A-configuration (VLA Proposal: 23A-249). Observations were conducted in the X-band using NRAO default correlator setup X32f2A, corresponding to 3-bit sampling and 2 second integration times, and basebands centered at 9 and 11 GHz and 2GHz bandwidth. The primary calibrator used was 3C 48 for all targets except J120157.21+421703.4, 135413.22+325937.1, 171527.20+280452.4, and J1817+2729, which used 3C 286. Table 1 shows our target list with the VLA integration times and complex calibrators used, alongside some of their selection criteria. The raw data was calibrated by the NRAO as part of the Science Ready Data Products (SRDP) initiative, which creates calibrated measurement sets optimized for continuum (Stokes I) imaging.
We imaged our visibilities using the tclean task in the NRAO’s Common Astronomy Software Applications (CASA) suite of processing tools (CASA Team et al., 2022). As lensed radio quasar systems tend to be composed mainly of point sources, we used the Högbom (1974) deconvolution method with single-term multi-frequency synthesis (Conway et al., 1990). Given our targets are never more than a few arcseconds across, we did not use any wide-field imaging procedures. Cleaning was done using an interactive mask, with a stopping threshold of 0.1mJy, which was usually between two and five times the noise floor. After imaging, model visibilities were examined in order to assess the efficacy of increasing dynamic range via self-calibration (Readhead & Wilkinson, 1978), but in each case our snapshot observation signal-to-noise was too low for a useful gain solution. In a few cases this general imaging procedure was augmented with extra steps as required by the situation, these will be discussed individually in the following section.
4 Results
Table 2 summarizes the targeted VLA observation results, including the position and flux of each detected radio component. These were calculated with the CASA task imfit, which fits elliptical gaussians to image-plane radio maps. As expected for AGN cores, most observed components were fit as point sources with some exceptions noted in the table and discussed below. Of the 11 targets observed, we found evidence of lensed radio emission in 4 previously known lensed quasar systems. The fifth previously known system studied was not detected but was found to be a lensed radio source by Dobie et al. (2024). In 4 other sources, we found unlensed radio emission; we attribute the VLASS emission to either the putative lens galaxy or an unlensed quasar. Another source had no significant detection whatsoever, and the final source is an ambiguous case discussed further in Section 4.4.2.
| Target | Component | RA | RA | Dec | Dec | Flux Density |
|---|---|---|---|---|---|---|
| [deg] | [mas] | [deg] | [mas] | [Jy] | ||
| J000835.17-073405.6 | Single Quasar | 2.1465188 | 2 | -7.5683175 | 2 | 2370 ±40 |
| J0013+5119 | A | 3.348415 | 14 | 51.318736 | 10 | 240 ±40 |
| B | 3.348112 | 5 | 51.3179497 | 3 | 250 ±30 | |
| Lens Galaxy | 3.348073 | 4 | 51.3182923 | 3 | 490 ±30 | |
| DES J0412-2646 | North | 63.179016 | 11 | -26.775585 | 23 | 160 ±40 |
| South aaThis component was fit as an extended source by imfit rather than a point source. | 63.179 | 26 | -26.77575 | 66 | 260 ±90 | |
| J120157.21+421703.4 | Single Quasar | 180.4883875 | 1 | 42.2842668 | 12 | 7000 ±200 |
| J135413.22+325937.1 | Single Quasar | 208.5550522 | 2 | 32.993648 | 4 | 2800 ±200 |
| J171527.20+280452.4 | Not Detected | |||||
| J1817+2729 | Not Detected | |||||
| J2145+6345 | A | 326.2717218 | 7 | 63.7613599 | 2 | 430 ±30 |
| B | 326.27193 | 10 | 63.76152 | 4 | 250 ±30 | |
| C | 326.270737 | 25 | 63.761261 | 7 | 130 ±30 | |
| HS B2209+1914 | A | 332.876315 | 13 | 19.487111 | 7 | 290 ±30 |
| B | 332.876415 | 21 | 19.48684 | 12 | 270 ±40 | |
| WISE J2329-1258 | A | 352.49105 | 47 | -12.98315 | 96 | 160 ±50 |
| Northeast aaThis component was fit as an extended source by imfit rather than a point source. | 352.491016 | 30 | -12.98286 | 63 | 80 ±20 | |
| Southwest aaThis component was fit as an extended source by imfit rather than a point source. | 352.49132 | 99 | -12.98298 | 223 | 150 ±70 | |
| J233353.31+255450.6 | Extended Emission aaThis component was fit as an extended source by imfit rather than a point source. | 353.47219 | 26 | 25.91395 | 146 | 1700 ±200 |
Note. — Lensed quasar images are indicated by capital letters.
4.1 Statistical Considerations
For our observations, especially those which we claim are indeed radio-loud lenses, we wish to reject the possibility that the radio emission is indeed from the quasar and lens separately, rather than a chance alignment of radio sources and optical ones. We adopt a frequentist approach based on Galvin et al. (2020) to give the probability each radio detection is associated with its corresponding optical detection. The Gaia survey has the sky coverage, sensitivity, and resolution necessary to detect in the optical all the radio quasar images we observed, and so was used as our optical survey for this analysis. Let be the density of optically detected sources, which in the case of Gaia DR3 (Gaia Collaboration et al., 2023) is approximately . Assuming no correlation between radio and optical, the number of expected optical detections within seconds of arc of a given radio detection is given by , or . As Gaia’s astrometric precision is typically less than one milliarcsecond, and our VLA precision (in A-config X-band) is on the order of milliarcseconds, a typical value of is expected to be tens of milliarcseconds for a real match, corresponding to an individual source random probability of between and . By contrast, two unrelated sources separated by would give a random probability of closer to 1/100. We expect for a real radio lens to observe emission from each quasar image, and thus will measure a random probability for each of them. Multiplying these probabilities together gives an estimated total probability that the radio sources are chance alignments with the lensed optical images, and we will report this number for each claimed radio-loud gravitational lens in the next section.
4.2 New Radio-Loud Lenses
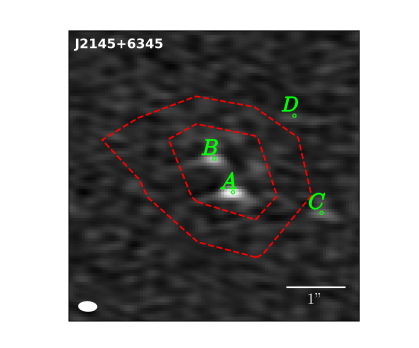
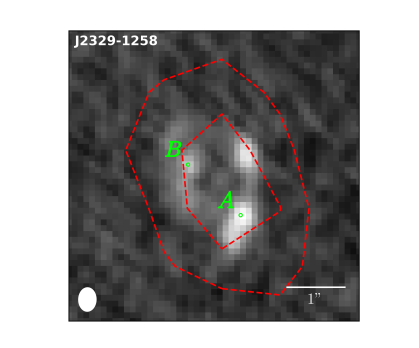
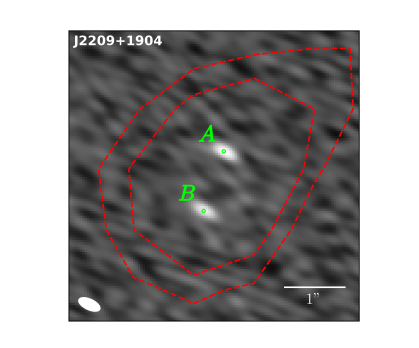
The radio loud lenses presented below are displayed in Figure 3.
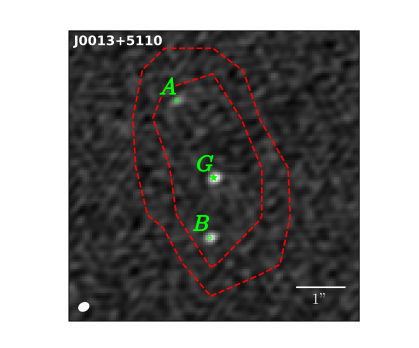
4.2.1 J0013+5119
J0013+5119 was discovered as a doubly imaged quasar by Lemon et al. (2019) using the Wide-field Infrared Survey Explorer (WISE) and Gaia DR2 catalogues. The quasar source is at redshift and the two images are separated by . Our VLA A-config observations revealed radio emission from both the lens and the quasar images, which are all fit to point sources in X-band using the CASA task imfit but appear as one source in VLASS. The flux densities for the lensed images and taken from imfit give a flux ratio , similar to the optical flux ratio of based on the Gaia -band measurements. The lens galaxy was not detected in Gaia and was too blended with quasar light to get a precise position measurement in any other available optical survey, so our probability consideration only includes the two measured quasar positions. The system probability of random coincidence is then .
As this is the only one of our new lenses to not have a published lens model, we made an effort to provide one in this paper. Using the Lenstronomy (Birrer & Amara, 2018; Birrer et al., 2021) software suite, we fit a simple Singular Isothermal Ellipsoid (Kormann et al., 1994) model with external shear to both VLA data and data from the PanSTARRS 1 survey (PS1, Chambers et al., 2016). However, when testing our best-fit results from this method, we found the source plane positions of images A and B did not match, i.e. the model was not accurately reproducing observations. We suspect this is due to the environment of the lens, and examining wider-field survey images of the J0013+5119 system show other galaxies of similar redshift in the vicinity of the lens, which could lead to a more complex lens model. Modeling such a lens system would require deeper and sharper optical data and is beyond the scope of this paper.
4.2.2 J2145+6345
Quad lens J2145+6345 was also discovered by Lemon et al. (2019) using the same method as J0013+5100, and was singled out by the authors as being ideal for time-delay studies given its reasonably large image separation (a max of ) and bright images. The quasar is located at , and Lemon et al. (2019) report no detection of a lens galaxy in the PanSTARRS survey.
We significantly detected the three brightest images of J2145+6345 in X-band as point sources, and also detected a noise bump coincident with the Gaia position of the fourth quasar image. In VLASS, the system is blurred together into one component. Excluding the faintest image, which was not significantly detected, we obtained a system chance of random of . We calculated the flux ratios between our significantly detected images as and . These radio flux ratios do not differ significantly from the Gaia -band flux ratios of and .
4.2.3 HS B2209+1904
B2209+1904 (aka J2211+1929), a doubly-imaged quasar at , was catalogued, along with its lens galaxy, in the Hamburg Quasar Survey (Hagen et al., 1999). Our X-band observations detected both quasar images as point sources with a flux ratio of . This is slightly, but not significantly, lower than the optical flux ratio observed by Gaia in the -band of . The chance of two random radio sources being in these positions is .
4.2.4 J1817+2729
J1817+2729, a quadruply imaged source at (Lemon et al., 2019), was discovered by Delchambre et al. (2019a) using a blind catalog search in Gaia DR2. Despite a strong detection in VLASS, our X-band observations report no significant emission at GHz, and a manual re-reduction of the data showed the same. Fortunately, the target was also observed by Dobie et al. (2024) in C band (6 GHz), and was confirmed as a lensed radio source therein. J1817+2729 shows no variability between epochs 1 (May 2019) and 2 (Sept 2021) of VLASS, so we assume no significant variability for the source. From VLASS epoch 1 and the summed flux densities of all images in the C-band by Dobie et al. (2024), we estimate a spectral index between 3 GHz and 6 GHz of , substantially steeper than the relatively flat spectrum estimated from NVSS and VLASS. This may be the result of genuine spectral curvature—for instance the spectral index between GHz and GHz might be capturing the spectral turnover of a peaked spectrum radio source (e.g., O’Dea & Saikia, 2021). Extrapolating the C-band flux density to X-band using , we would expect the sum of the lensed images to have Jy. With the distribution of image brightness reported in Dobie et al. (2024), we would expect the brightest lensed image to have a 10 GHz flux density of Jy, corresponding to a detection in our image. We conclude that our observations were simply not sensitive enough to detect the lensed images in X-band, a consequence of estimating the required integration time based on a lower-frequency spectral index and assuming no spectral curvature.

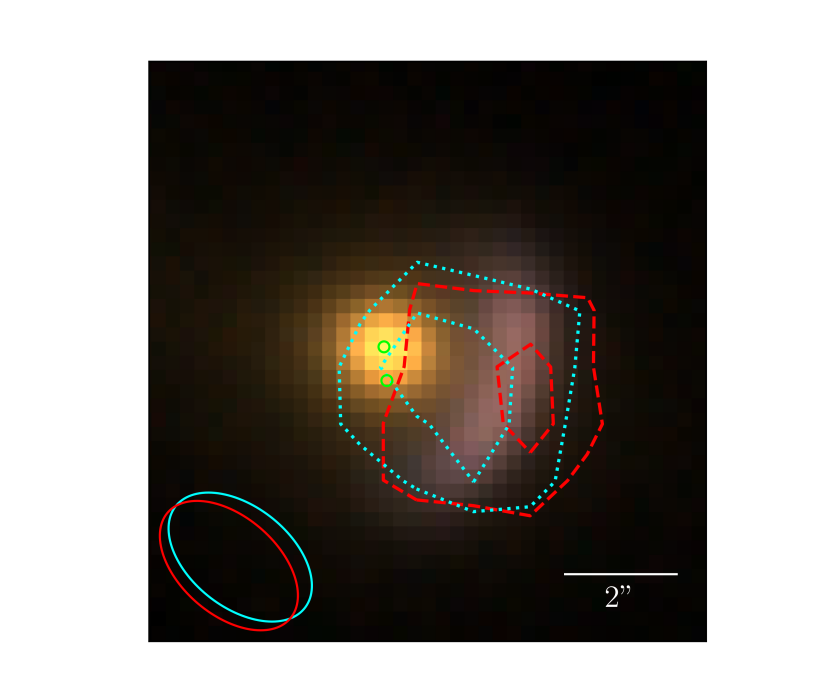
4.2.5 J23291258
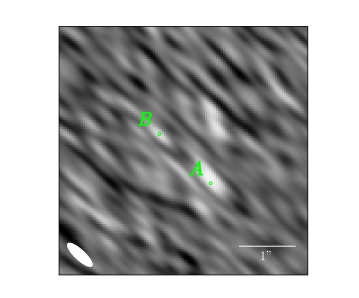
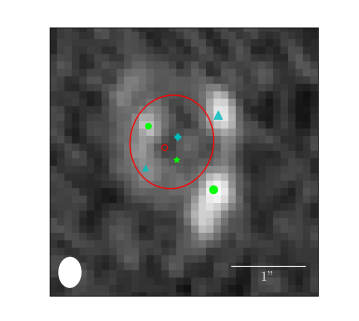
J2329-0734 was discovered by Schechter et al. (2017), who used a WISE color cut to select potential blended quasar pairs and crossmatched with the ATLAS survey. Candidates were checked for consistency in putative image colors and visually inspected before spectroscopic follow-up, which confirmed this object as a lensed quasar at . Our X-band observations detected the brighter image, as well as extended emission coming from just above that image. We detected a noise bump at the position of the other quasar image, but our image fitting procedure favored extended rather than point-source emission at this location. We do not attempt to set a limit on the flux ratio in this system due to this extended emission. To further investigate the nature of this source, we turned to archival data from VLA project 19A-176, who obtained A-config observations of the object in the S and C bands. This data also shows pointlike features at the quasar image location and even more diffuse emission than the X-band data. A 2-term Multi-Frequency Synthesis (Conway et al., 1990) image created from visibility-space stacking both our data and the archival data is shown in the bottom left panel of Figure 3. Due to our only matching one quasar image, our statistical chance of random coincidence from our observations is much lower, at only .
To further investigate the nature of the extended emission present in this lens system, we utilized a lens model created by Shajib et al. (2021). This model, constructed using -band () Adaptive Optics observations on the Keck Telescope’s NIRC2 instrument, only incorporates near-infrared data and thus is an independent test for our radio observations. Figure 4 shows our X-band data, the archival S and C band data, and their combination, as well as the critical curve of Shajib et al. (2021)’s lens model. We propagate the locations of image A and the northeast extended component through the lens model and plot their predicted positions. Image A’s counterpart is located at image B, as expected, and the northeast component’s counterimage is predicted to appear at the location of the southwest component. It is therefore likely that at least one component in radio map besides the AGN core is strongly lensed. This extended lensed emission may be useful to for a gravitational imaging analysis similar to that of Spingola et al. (2019a) with VLBI follow-up. However, given the faintness of this source, such an analysis may not be possible without the enhanced sensitivity of the next generation of radio telescopes (McKean, 2023, priv. comm.).
4.3 Non-Lensing Results

4.3.1 J00080734
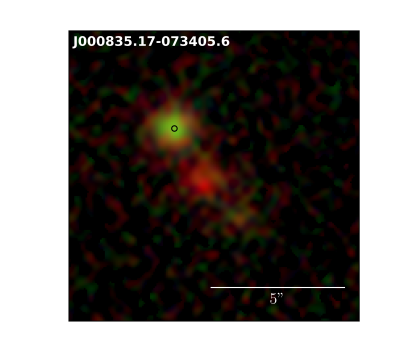
This source was identified as a potential radio lens using the JB07 method, and was singled out for observation due to the relatively bright VLASS detection, green color of the potential source, and possible counterimage in DECaLS. However, our X-band follow-up revealed only a mJy point source coincident with the optical quasar and no counterimage. Our VLA observations of this target have an rms noise of , and at the level we should be sensitive to point sources brighter than Jy. That we detect no radio counterimage suggest that if there were such a counterimage, the flux ratio of the lensed radio source would be a seemingly unrealistic . Moreover, the optical flux ratio of the sources immediately north-east and south-west of the the LRG is , so should this be a lensed source then there would be a substantial discrepancy between the optical and radio flux ratios. While it is not impossible that this source is a lensed quasar, our observations don’t support such a conclusion, and we posit that these are likely two unrelated sources.
4.3.2 J120157+421703
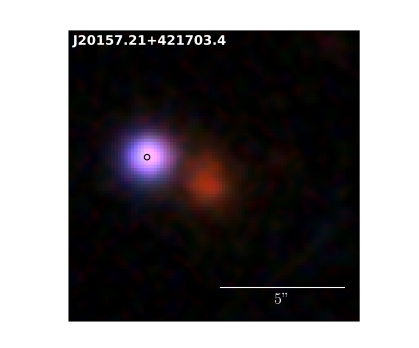
This source was identified as a possible radio lens using the JB07 method. The DECaLS image of this source shows a possible very faint arc to the lower right of the LRG. The VLA X-band data showed a mJy point source coincident with the optical point source from DECaLS, but no counterimage. This presents two possibilities when taking the possible arc into account: either the arc is simply an image artifact or other phenomenon and there is no lensing present at all, or the quasar is at or near the lens redshift and is therefore not strongly lensed.
4.3.3 J135413+326937
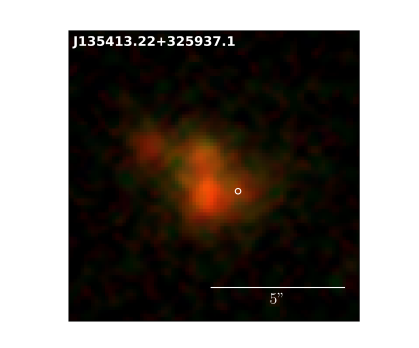
This source was identified as a potential radio lens using the JB07 method. The X-band observations show a mJy point source offset from the LRG and coincident with the VLASS detection, but no counterimage. Therefore we conclude the quasar is not multiply imaged.
4.3.4 J233353+255450
This source was identified as a possible radio lens using the JB07 method. Our initial X-band data reduction showed hints of extended emission near the lens location, and so we re-imaged the data with a uv-plane taper to increase sensitivity at the cost of resolution. We found an extended mJy source located between the supposed lens and source, which we interpret as a radio lobe from the LRG rather than a lensed radio source, a hypothesis that is consistent with the steep spectrum () we measure from the VLASS and X-band flux densities.
4.4 Other Results
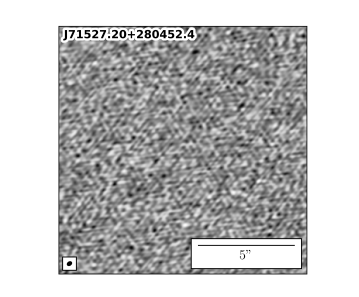
4.4.1 J171527+280452
This source was identified as a possible radio lens using the JB07 method. However, we detected no significant emission in our X-band observations. Based on the mJy VLASS epoch 1 flux of the source and a nondetection threshold, we estimate a spectral index between 3 and 10 GHz for this source of -2.2, much higher than its VLASS-NVSS spectral index of -0.31. The source shows no significant variability between VLASS epochs 1 and 2, leading us to suspect the target is either a peaked-spectrum compact source which is undetected at 10GHz, or an extended source which we do not detect due to resolution or sensitivity. In either case, we cannot rule out the possibility of lensing.
4.4.2 DES J04122646
This source was identified as a lensed galaxy by Jacobs et al. (2019) using a Neural Network-based search of DES. While VLASS images from both epochs seem to be centered away from the lens, our follow-up data shows a Jy point source at the location of the lens galaxy and a Jy diffuse component to the south of that, possibly indicative of a core+jet or core+lobe morphology. Figure 7 shows a DECaLS image of this source with the locations of our VLA detections and contours of two VLASS epochs. While one epoch has the peak of emission located on top of the arc, the other places it between the arc and the lens galaxy. It is possible diffuse emission from the source galaxy is responsible for shifting the VLASS detection over, and that this emission is too low surface brightness for or resolved out of our observations at 10 GHz. However, further observations would be needed to address this hypothesis.
5 The Known Population of Lensed Radio Sources
5.1 Variability and Spectral Indices of Lensed Radio Sources
Until recently, only a handful of lensed radio sources were known, with most of these being identified through dedicated searches such as CLASS and JVAS. The advent of deep and high resolution wide-area sky surveys such as VLASS is now resulting in more detections and correct associations of radio emission from lensed systems, especially lensed quasars. Additionally, the latest generation of optical surveys with high astrometric precision, such as Gaia, are allowing for the identification of hundreds of new lensed quasars (e.g., Jacobs et al., 2019). The result is such that there are now lensed radio sources known, more than double the number known less than a decade ago (McKean et al., 2015). We list all the published gravitational lenses with emission detected at frequencies lower than 100 GHz (mm) in Table 3. This cutoff was chosen to correspond roughly with both the point where dust begins to dominate the SED of a normal galaxy rather than synchrotron emission (Condon, 1992) and the highest observable frequencies of the ngVLA (Carilli et al., 2015). In this Section of the paper we use these objects to broadly characterise the observational properties of the lensed radio source population.
Some previous dedicated searches for lensed radio sources have specifically looked for flat-spectrum radio sources (e.g., Jackson & Browne, 2007; Myers et al., 2003). In principle such a strategy should reduce contamination from the lobes of radio galaxies that can appear offset from their host galaxies, often LRGs, and thus potentially mimic a lensed object in catalog space. With a reasonably large sample of lensed radio sources now in hand we can potentially explore the spectral index distribution of the population. Doing so has several benefits, the spectral index can i) provide insights into the type of source being lensed (e.g., quasar, lobe-dominated radio galaxy etc.); ii) potentially guide future search strategies for lensed radio sources; and iii) be used to show the flux distribution of lensed radio sources at a single observer-frame frequency, as opposed to comparing flux densities from different observations at e.g., GHz and GHz.
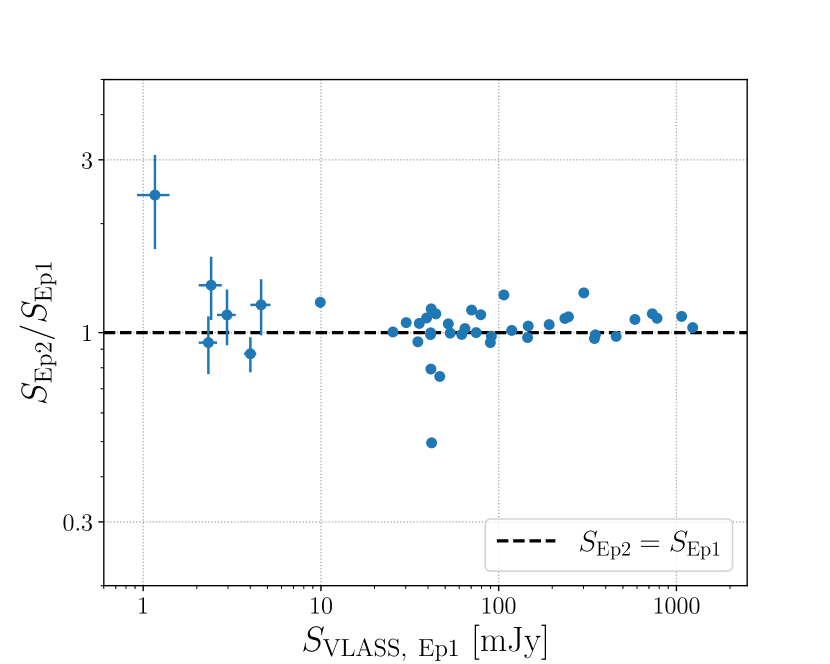
Ideally the spectral index for radio sources should be calculated using flux measurements from different frequencies obtained at the same time to avoid the potential for source variability biasing the measurement. For their lensed quasars observed with the Australia Telescope Compact Array, Dobie et al. (2024) provide contemporaneous measurements at GHz and GHz which we use to calculate the spectral index for these sources. For the remaining sources we do not have contemporaneous multi-band flux density measurements, and are thus dependent on measurements that might be subject to variability. Using the catalogs from the first two epochs of VLASS (Gordon et al., 2021, B. Sebastian et al. in prep.) we characterise the variability of the lensed sources detected in the first epoch of VLASS over timescales of years in Figure 8. With only a few exceptions, most lensed radio show little variability between Epochs 1 and 2 of VLASS, with a median and standard deviation for of and respectively. Knowing that most lensed radio sources aren’t strongly variable strengthens the argument for using flux density measurements taken at different times to estimate the spectral index of these sources. For lensed radio sources we have flux density measurements from both VLASS (GHz) and FIRST (GHz). For the lensed sources for which we have spectral information, we find the median spectral index to be , similar to the typical spectral index for the general radio source population (e.g., Condon et al., 1998; Gordon et al., 2021).
5.2 Future Searches
Notably, of our VLASS detected targets that are lensed optical quasars have radio emission from the lensed source, suggesting that lensed quasars conincident with legacy detections in radio surveys present an efficient approach to identifying candidate lensed radio sources. Moreover, those lensed radio sources detected in flux-limited surveys are likely the most scientifically useful targets due to their typically higher brightness than many sources detected through blind, deep radio observations of lensed optical quasars. With a suite of deep wide-area optical and near-IR imaging surveys from ground and space, such as the Vera C. Rubin Observatory (Ivezić et al., 2019), the Nancy Grace Roman Space Telescope (Spergel et al., 2015), and the Euclid telescope (Laureijs et al., 2011), coming online over the next few years, thousands of lensed quasars will be discovered (e.g. Yue et al., 2022). It is interesting to consider how many of these sources will have complementary radio observations. Some of the new lensed quasars may have already been detected at radio wavelengths, but due to the multi-arcsecond PSF of current wide-area radio surveys their status as lensed radio sources remains unknown. Moreover, for a multi-epoch survey such as VLASS, the ability to combine the individual observations from each epoch enables deeper imaging than one epoch of observations alone, increasing their power as a legacy reference catalog to identify radio emission from newly discovered lensed quasars. After the end of the planned survey, combined three-epoch VLASS images are expected to have a point source depth of Jy (Lacy et al., 2020), substantially deeper than the mJy depth of the Quick Look images from a single epoch currently available333A recently proposed fourth VLASS epoch would push the point source sensitivity of combined images down to Jy (Nyland et al., 2023)..
To make predictions for the number of lensed radio sources that might be detected in VLASS we first determine the GHz flux density distribution of the known lensed radio sources. For bright lensed sources within the VLASS footprint we take the GHz flux density measurement from the VLASS Epoch 1 Quick Look catalog (Gordon et al., 2021). For those sources too faint to be detected by VLASS or lying outside the survey footprint, we estimate their GHz flux density by extrapolating from available measurements at other frequencies using their measured spectral index where available. For those sources for without a spectral index we assume in line with the typical spectral index for the lensed radio source population. Where published flux densities for individual lensed images are used, these are summed to provide a total flux for the lensed system, a better approximation of what will observed by a single VLASS beam. We note here that we do not estimate the GHz flux density for PSS 23221944, as the observed GHz emission is attributed to CO() line emission rather than being continuum emission (Riechers et al., 2008), and thus extrapolating to GHz based on an assumed spectral index is inappropriate in this instance.
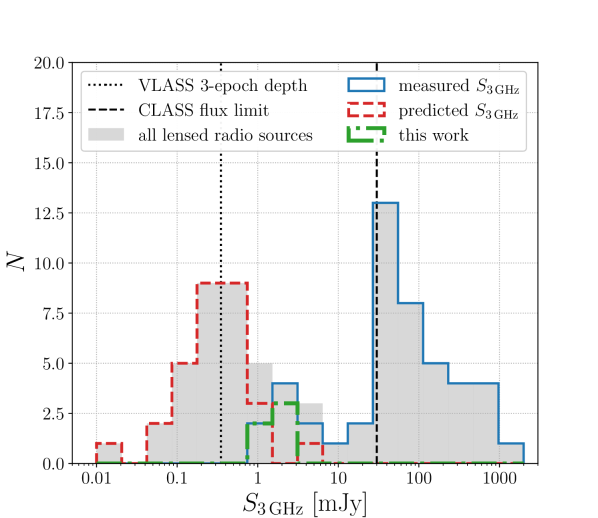
The distribution for lensed radio sources is shown in Figure 9, with predicted and measured flux densities shown by the red dashed and blue sold lines respectively. An important feature of Figure 9 is the apparent bimodality of the radio flux distribution of lensed sources. This can be explained by the two broad selection approaches used over the years. The brighter peak (centered around mJy) is mostly the result of the targeted searches for lensed radio sources conducted by CLASS, JVAS, and MG-VLA (Lawrence et al., 1986). Indeed, the flux limited nature of these searches is evident in Figure 9 as the sudden drop in sources below mJy. The fainter peak (centered around Jy) is the result of radio observations of newly identified lensed quasars in optical imaging. Notably, about half of these objects should be detectable in future multi-epoch combined VLASS images, providing a potential pathway to more efficient target selection for future in depth radio observations. Large numbers of lensed radio sources will be detected in forthcoming optical surveys. For instance Yue et al. (2022) predict lensed quasars will be identified in the Legacy Survey of Space and Time (LSST, Ivezić et al., 2019), of which will be at depths detectable by current optical surveys. Approximately (%) of the footprint of LSST will be covered by VLASS, it follows that hundreds of the lensed sources may be detectable in the final-depth VLASS images.
In this work we have focused on using VLASS to identify lensed radio sources, and indeed the high resolution and time domain aspects of the survey provide unique advantages over previous radio surveys for this challenge. The next generation of radio telescopes however will be even more well suited for identifying lensed radio sources. The high angular resolution and survey speeds of the Square Kilometer Array (SKA) and the ngVLA will enable the ready identification of the multiple images of radio sources separated on sub arcsecond scales. This can provide two key advantages over current approaches. First, not being dependent on optical observations to identify the lensing configuration has the potential to identify systems where the lensed galaxy is has an intrinsically high radio-to-optical luminosity such that it is only detected in radio. Second, in systems where only the lensed background object is radio loud, the low level of radio contamination may allow for more tightly constrained lens models than would be possible from optical observations where light from the foreground lens galaxy may become problematic.
6 Conclusions
We report first results from a pilot study seeking to efficiently identify strongly lensed radio sources by combining wide-area optical and radio survey data. We find that a high fraction of optically selected lensed quasars with radio counterparts in VLASS at mJy-level flux densities are in fact high-confidence lensed radio sources. The results here suggest that large samples of radio strong lenses could be efficiently identified via targeted follow-up of radio counterparts to lenses found in near-future optical and NIR imaging surveys with the Vera C. Rubin Observatory, Euclid, and Nancy Grace Roman Space Telescope. Importantly, the radio lens systems from VLASS are bright enough to allow detailed characterization. Our findings are reinforced by complementary recent results from Dobie et al. (2024) and Jackson et al. (2024).
We observed 11 radio lens candidates based on two selection methods. The method based on Jackson & Browne (2007) aiming to discover entirely new lens systems yielded no new radio lenses. However, given the rarity of gravitational lensing in general, this result was not unexpected, and we note that JB07 themselves found no candidates among a larger follow-up sample. A successful catalog-based method would require a more sophisticated approach than the one we utilized, and such an approach become much more necessary in the future thanks to upcoming large and deep surveys in both the radio and optical.
The second method, which utilized existing catalogs of lensed quasars and galaxy-scale arcs, was much more successful. Five out of the five existing lensed quasars we observed had radio emission from the quasars, rather than the lens, and in only one case did the lens galaxy also emit in the radio. Furthermore, our single lensed galaxy target is still a possible radio lens given the mismatch between VLASS and VLA positions, although its emission seems to be much fainter than suggested by the VLASS epoch 1 data. These results suggest that survey-resolution radio emission from lensed quasar systems is more likely to come from the quasar rather than the lens, and presents a possible method to identify more lensed radio sources in the future.
Our candidate selection for this method utilized a list of lensed quasars published in 2019, containing 220 systems. Since then, the publication of hundreds of lensed quasar (e.g. Lemon et al., 2023; He et al., 2023) and galaxy-galaxy lens (e.g. Dawes et al., 2023; Zaborowski et al., 2023) candidates has greatly expanded the number of possible targets, suggesting that a new search incorporating the same methodology is likely to discover many more systems.
During the final preparations of this manuscript, Jackson et al. (2024) reported independent observations for a sample of radio lens candidates, including 3 of the 4 previously unreported radio lens systems presented in Section 4, as well as an additional 30 sources not considered here. These two works underscore the opportunities for expanding the catalog of known lensed radio sources through target selection based on lenses identified at other wavelengths. Similar to Dobie et al. (2024), we both find that radio emission from systems involving optically-selected lensed quasars is typically dominated by emission from the lensed quasar rather than the main deflector galaxy. Our target selection differs from Dobie et al. (2024) and Jackson et al. (2024) in that we required a spatially coincident VLASS source, and thus all of the new radio lenses discussed here have integrated flux density brighter than mJy at 3 GHz (Figure 9).
7 Acknowledgments
. M.N.M., Y.A.G, K.B., and P.S.F. are supported by U.S. National Science Foundation grants AST 20-09441 and AST 22-06053.
The National Radio Astronomy Observatory is a facility of the National Science Foundation operated under cooperative agreement by Associated Universities, Inc.
The Legacy Surveys consist of three individual and complementary projects: the Dark Energy Camera Legacy Survey (DECaLS; Proposal ID #2014B-0404; PIs: David Schlegel and Arjun Dey), the Beijing-Arizona Sky Survey (BASS; NOAO Prop. ID #2015A-0801; PIs: Zhou Xu and Xiaohui Fan), and the Mayall z-band Legacy Survey (MzLS; Prop. ID #2016A-0453; PI: Arjun Dey). DECaLS, BASS and MzLS together include data obtained, respectively, at the Blanco telescope, Cerro Tololo Inter-American Observatory, NSF’s NOIRLab; the Bok telescope, Steward Observatory, University of Arizona; and the Mayall telescope, Kitt Peak National Observatory, NOIRLab. Pipeline processing and analyses of the data were supported by NOIRLab and the Lawrence Berkeley National Laboratory (LBNL). The Legacy Surveys project is honored to be permitted to conduct astronomical research on Iolkam Du’ag (Kitt Peak), a mountain with particular significance to the Tohono O’odham Nation.
NOIRLab is operated by the Association of Universities for Research in Astronomy (AURA) under a cooperative agreement with the National Science Foundation. LBNL is managed by the Regents of the University of California under contract to the U.S. Department of Energy.
This project used data obtained with the Dark Energy Camera (DECam), which was constructed by the Dark Energy Survey (DES) collaboration. Funding for the DES Projects has been provided by the U.S. Department of Energy, the U.S. National Science Foundation, the Ministry of Science and Education of Spain, the Science and Technology Facilities Council of the United Kingdom, the Higher Education Funding Council for England, the National Center for Supercomputing Applications at the University of Illinois at Urbana-Champaign, the Kavli Institute of Cosmological Physics at the University of Chicago, Center for Cosmology and Astro-Particle Physics at the Ohio State University, the Mitchell Institute for Fundamental Physics and Astronomy at Texas A&M University, Financiadora de Estudos e Projetos, Fundacao Carlos Chagas Filho de Amparo, Financiadora de Estudos e Projetos, Fundacao Carlos Chagas Filho de Amparo a Pesquisa do Estado do Rio de Janeiro, Conselho Nacional de Desenvolvimento Cientifico e Tecnologico and the Ministerio da Ciencia, Tecnologia e Inovacao, the Deutsche Forschungsgemeinschaft and the Collaborating Institutions in the Dark Energy Survey. The Collaborating Institutions are Argonne National Laboratory, the University of California at Santa Cruz, the University of Cambridge, Centro de Investigaciones Energeticas, Medioambientales y Tecnologicas-Madrid, the University of Chicago, University College London, the DES-Brazil Consortium, the University of Edinburgh, the Eidgenossische Technische Hochschule (ETH) Zurich, Fermi National Accelerator Laboratory, the University of Illinois at Urbana-Champaign, the Institut de Ciencies de l’Espai (IEEC/CSIC), the Institut de Fisica d’Altes Energies, Lawrence Berkeley National Laboratory, the Ludwig Maximilians Universitat Munchen and the associated Excellence Cluster Universe, the University of Michigan, NSF’s NOIRLab, the University of Nottingham, the Ohio State University, the University of Pennsylvania, the University of Portsmouth, SLAC National Accelerator Laboratory, Stanford University, the University of Sussex, and Texas A&M University.
BASS is a key project of the Telescope Access Program (TAP), which has been funded by the National Astronomical Observatories of China, the Chinese Academy of Sciences (the Strategic Priority Research Program “The Emergence of Cosmological Structures” Grant # XDB09000000), and the Special Fund for Astronomy from the Ministry of Finance. The BASS is also supported by the External Cooperation Program of Chinese Academy of Sciences (Grant # 114A11KYSB20160057), and Chinese National Natural Science Foundation (Grant # 12120101003, # 11433005).
The Legacy Survey team makes use of data products from the Near-Earth Object Wide-field Infrared Survey Explorer (NEOWISE), which is a project of the Jet Propulsion Laboratory/California Institute of Technology. NEOWISE is funded by the National Aeronautics and Space Administration.
The Legacy Surveys imaging of the DESI footprint is supported by the Director, Office of Science, Office of High Energy Physics of the U.S. Department of Energy under Contract No. DE-AC02-05CH1123, by the National Energy Research Scientific Computing Center, a DOE Office of Science User Facility under the same contract; and by the U.S. National Science Foundation, Division of Astronomical Sciences under Contract No. AST-0950945 to NOAO.
The PanSTARRS 1 Surveys (PS1) and the PS1 public science archive have been made possible through contributions by the Institute for Astronomy, the University of Hawaii, the PanSTARRS Project Office, the Max-Planck Society and its participating institutes, the Max Planck Institute for Astronomy, Heidelberg and the Max Planck Institute for Extraterrestrial Physics, Garching, The Johns Hopkins University, Durham University, the University of Edinburgh, the Queen’s University Belfast, the Harvard-Smithsonian Center for Astrophysics, the Las Cumbres Observatory Global Telescope Network Incorporated, the National Central University of Taiwan, the Space Telescope Science Institute, the National Aeronautics and Space Administration under Grant No. NNX08AR22G issued through the Planetary Science Division of the NASA Science Mission Directorate, the National Science Foundation Grant No. AST-1238877, the University of Maryland, Eotvos Lorand University (ELTE), the Los Alamos National Laboratory, and the Gordon and Betty Moore Foundation.
=15mm
Name
Method
RA
Dec
VLASS Flux
Images
Sep.
References
VLASS Component
[deg]
[deg]
[mJy]
[”]
QSO B097+5608
RADIO
150.3369
55.8974
317.483
2
6.17
Walsh et al. (1979)
J100120.93+555355.8
PG B1115+080
OPTICAL
169.57062
7.7663
4
2.43
Hartley et al. (2021)
Weymann et al. (1980)
MG B2016+112
RADIO
304.8253
11.4537
93.026
3
2.56
Lawrence et al. (1984)
J201918.00+112712.2
B2237+0305
OPTICAL
340.125975
3.358508
4
1.78
Falco et al. (1996)
Huchra et al. (1985)
MG B1131+0456
RADIO
172.9854
4.9302
261.992
2
2.2
Hewitt et al. (1988)
J113156.44+045549.5
PKS B1830211
RADIO
278.4164
21.0609
aaSource is outside of VLASS footprint () or otherwise masked
3
0.99
Pramesh Rao & Subrahmanyan (1988)
B1413 + 117
OPTICAL
213.9426
11.4953
3.487
4
1.35
Zhang et al. (2023)
Magain et al. (1988)
J141546.22+112943.7
MG B1654+1346
RADIO
253.6741
13.7726
205.031
Lobe
2.0
Langston et al. (1989)
J165441.79+134621.4
MG B0414+0534
RADIO
63.6571
5.5786
930.234
4
2.4
Hewitt et al. (1992)
J041437.74+053443.0
JVAS B1422+231
JCP
216.1587
22.9335
676.326
4
1.3
Patnaik et al. (1992)
J142438.11+225600.7
JVAS B0218+35.7
JCP
35.2729 ddPosition of lens unreliable/unknown, position of brightest source image given instead
35.9372
1073.526
2
0.335
Patnaik et al. (1993)
J022105.46+355613.8
MG B1549+3047
RADIO
237.3014
30.7879
508.064
Lobe
2.0
Lehar et al. (1993)
J154912.55+304714.9
CLASS B1600+434
JCP
240.4187 ddPosition of lens unreliable/unknown, position of brightest source image given instead
43.2798
40.532
2
1.4
Jackson et al. (1995)
J160140.50+431647.2
CLASS B1608+656
JCP
242.3082
65.5413
35.675
4
2.27
Myers et al. (1995)
J160914.03+653228.1
FSC 10214+4724
OPTICAL
156.1437
47.1531
4/Lobe/SFG
1.0
Deane et al. (2013)
Graham & Liu (1995)
MG B0751+2716
RADIO
117.923
27.2755
304.438
4
0.8
Lehar et al. (1997)
J075141.53+271631.8
JVAS B1938+666
JCP
294.6055 ddPosition of lens unreliable/unknown, position of brightest source image given instead
66.8148
398.267
4
1.02
King et al. (1997)
J193825.26+664852.8
RX J0911+0551
OPTICAL
137.86479 aaSource is outside of VLASS footprint () or otherwise masked
5.848
4
3.25
Jackson et al. (2015)
Bade et al. (1997)
CLASS B0712+472
JCP
109.0152
47.1474
26.245
4
1.46
Jackson et al. (1998)
J071603.59+470850.1
FBQ B0951+2635
XMATCH
147.84412
26.58725
2
1.1
Schechter et al. (1998)
CLASS B1933+503
JCP
293.6293
50.4232
79.109
4
1.52
Sykes et al. (1998)
J193430.92+502523.3
APM B08279+5255
OPTICAL
127.9235 ddPosition of lens unreliable/unknown, position of brightest source image given instead
52.75486
3
0.38
Ibata et al. (1999)
Irwin et al. (1998)
JVAS B1030+074
JCP
158.3918 ddPosition of lens unreliable/unknown, position of brightest source image given instead
7.1906
300.708
2
1.65
Xanthopoulos et al. (1998)
J103334.02+071126.3
CLASS B1127+385
JCP
172.5007
38.2005
35.965
2
0.7
Koopmans et al. (1999)
J113000.14+381203.1
CLASS B1152+199
JCP
178.8264
19.6615
53.896
2
1.56
Myers et al. (1999)
J115518.32+193942.0
CLASS B1359+154
JCP
210.3981 ddPosition of lens unreliable/unknown, position of brightest source image given instead
15.2237
45.277
6
1.71
Myers et al. (1999)
J140135.54+151324.8
CLASS B1555+375
JCP
239.2998 ddPosition of lens unreliable/unknown, position of brightest source image given instead
37.36
34.178
4
0.42
Marlow et al. (1999)
J155711.95+372136.0
CLASS B2045+265
JCP
311.8349
26.7339
36.293
4
1.9
Fassnacht et al. (1999)
J204720.27+264402.4
JVAS B2114+022
JCP
319.2116
2.4297
127.486
2
2.56
King et al. (1999)
J211650.76+022546.7
HS B2209+1914
OPTICAL
332.87625 ddPosition of lens unreliable/unknown, position of brightest source image given instead
19.4869
2.024
2
1.04
This work
Hagen et al. (1999)
J221130.31+192913.3
CLASS B0128+437
JCP
22.8059 ddPosition of lens unreliable/unknown, position of brightest source image given instead
43.9703
61.221
4
0.55
Phillips et al. (2000)
J013113.45435812.9
PMN J18383427
JCP
279.6187
214.667
2
0.99
Winn et al. (2000)
J183828.50342741.2
CLASS B0739+366
JCP
115.7132 ddPosition of lens unreliable/unknown, position of brightest source image given instead
36.5788
30.526
2
0.53
Marlow et al. (2001)
J074251.20+363443.6
FIRST J0816+5003
XMATCH
124.1618
50.0688
64.939
Lobe
2.0
Lehár et al. (2001)
J081638.73+500407.2
FIRST J0823+3906 bbListed as a strong candidate for lensing but not spectroscopically confirmed
XMATCH
125.8496
39.11
56.205
Lobe
5.0
Lehár et al. (2001)
J082323.65+390638.4
FIRST J1622+3531 bbListed as a strong candidate for lensing but not spectroscopically confirmed
XMATCH
245.6239
35.5257
102.976
Lobe
3.0
Lehár et al. (2001)
J162229.77+353134.3
PMN J20041349
JCP
301.0294
13.8252
22.097
2
1.13
Winn et al. (2001)
J200407.05134931.0
CLASS B2319+051
JCP
350.4201
5.4602
68.925
2
1.36
Rusin et al. (2001)
J232140.81+052737.3
PMN J01340931
JCP
23.6486 ddPosition of lens unreliable/unknown, position of brightest source image given instead
9.5175
636.323
5
0.68
Winn et al. (2002a)
J013435.67093102.7
CLASS B0445+123
JCP
72.0916 ddPosition of lens unreliable/unknown, position of brightest source image given instead
12.4654
31.086
2
1.35
Argo et al. (2003)
J044822.00+122755.5
FIRST J1004+1229
XMATCH
151.1037
12.4894
8.624
2
1.54
Lacy et al. (2002)
J100424.87+122922.5
PMN J16320033
JCP
248.2403
0.5559
167.349
3
1.47
Winn et al. (2002b)
J163257.68003320.9
HE B04351223
OPTICAL
69.56198
12.28739
4
2.54
Jackson et al. (2015)
Wisotzki et al. (2002)
HS B0810+2554
OPTICAL
123.38054
25.75092
4
0.91
Jackson et al. (2015)
Reimers et al. (2002)
CLASS B0631+519
JCP
98.8013 ddPosition of lens unreliable/unknown, position of brightest source image given instead
51.9505
46.425
2
1.16
Browne et al. (2003)
J063512.35+515701.2
CLASS B0850+054
JCP
133.2232
5.2543
78.061
2
0.68
Biggs et al. (2003)
J085253.57+051515.8
CLASS B2108+213
JCP
317.7256
21.5162
36.473
2
4.57
Browne et al. (2003)
J211054.07+213058.8
RXS J11311231
OPTICAL
172.96461
12.53289
4.008
4/SFG eeRXS J11311231 emits from both star-forming regions and the quadruply lensed AGN core.
3.23
Wucknitz (2009)
Sluse et al. (2003)
J113151.53123158.0
SDSS J1004+4112
OPTICAL
151.14546
41.21189
4
14.62
Jackson (2011)
Inada et al. (2003a)
SDSS J0924+0219
OPTICAL
141.2325771
2.3234747
4
1.81
Jackson et al. (2015)
Inada et al. (2003b)
FOV J0743+1553 bbListed as a strong candidate for lensing but not spectroscopically confirmed
XMATCH
115.9744
15.8903
47.366
Lobe
1.8
Haarsma et al. (2005)
J074353.85+155324.8
SDSS J1259+1241 cdcdfootnotemark:
OPTICAL
194.9811138 ddPosition of lens unreliable/unknown, position of brightest source image given instead
12.69751076
2
3.5
Dobie et al. (2024)
Hennawi et al. (2006)
CLASS J0316+4328
JCP
49.2122 ddPosition of lens unreliable/unknown, position of brightest source image given instead
43.472
126.464
2
0.5
Boyce et al. (2007)
J031650.88+432819.2
PSS J2322+1944
OPTICAL
350.5298
19.7397
SFG
1.5
Riechers et al. (2008)
WISE J23291258
OPTICAL
352.491
12.98306
1.013
2
1.26
This work
Schechter et al. (2017)
J232957.86125859.1
PS J1721+8842
GAIA
260.43437
88.70599
1.848
4/2 ffPS J1721+8842 is a lensed dual AGN system, with one core quadruply lensed and the other doubly lensed.
4.03
Mangat et al. (2021)
Lemon et al. (2018)
J172146.08+884221.9
GRAL J11314419 ccLens system bright in radio but at too low resolution to confirm emission from source
GAIA
172.750041 ddPosition of lens unreliable/unknown, position of brightest source image given instead
44.3330556
aaSource is outside of VLASS footprint () or otherwise masked
4
1.7
Dobie et al. (2024)
Krone-Martins et al. (2018)
WGD J20384008 ccLens system bright in radio but at too low resolution to confirm emission from source
GAIA
309.511278 ddPosition of lens unreliable/unknown, position of brightest source image given instead
40.137107
aaSource is outside of VLASS footprint () or otherwise masked
4
2.87
Dobie et al. (2024)
Agnello et al. (2018)
MJV 1255+1158 bbListed as a strong candidate for lensing but not spectroscopically confirmed
RADIO
193.874 ddPosition of lens unreliable/unknown, position of brightest source image given instead
11.9816
36.024
2
0.46
Spingola et al. (2019a)
J125529.76+115854.2
MJV J1330+3141 bbListed as a strong candidate for lensing but not spectroscopically confirmed
RADIO
202.5398 ddPosition of lens unreliable/unknown, position of brightest source image given instead
31.6846
38.521
2
0.54
Spingola et al. (2019a)
J133009.54+314104.5
J0013+5119
GAIA
3.348077 ddPosition of lens unreliable/unknown, position of brightest source image given instead
51.3183
2.097
2
1.89
This work
Lemon et al. (2019)
J001323.53+511905.9
DES J0229+0320 ccLens system bright in radio but at too low resolution to confirm emission from source
GAIA
37.49255525 ddPosition of lens unreliable/unknown, position of brightest source image given instead
37.49255525
2
2.14
Dobie et al. (2024)
Lemon et al. (2020)
GRAL J02461845 ccLens system bright in radio but at too low resolution to confirm emission from source
GAIA
41.5508333 ddPosition of lens unreliable/unknown, position of brightest source image given instead
18.7514167
2
1.0
Dobie et al. (2024)
Krone-Martins et al. (2019)
GRAL J0248+1913
GAIA
42.2031 ddPosition of lens unreliable/unknown, position of brightest source image given instead
19.22528
4
1.76
Dobie et al. (2024)
Delchambre et al. (2019b)
GRAL J0346+2154
GAIA
56.5458
21.9124
2
0.99
Dobie et al. (2024)
Krone-Martins et al. (2019)
GRAL J05303730 ccLens system bright in radio but at too low resolution to confirm emission from source
GAIA
82.6541 ddPosition of lens unreliable/unknown, position of brightest source image given instead
82.6541
3
1.04
Dobie et al. (2024)
Delchambre et al. (2019b)
GRAL J0659+1629
GAIA
104.766823 ddPosition of lens unreliable/unknown, position of brightest source image given instead
16.485772
4
5.2
Dobie et al. (2024)
Delchambre et al. (2019b)
GRAL J0818+0601
GAIA
124.6269582 ddPosition of lens unreliable/unknown, position of brightest source image given instead
6.027244393
2
1.15
Dobie et al. (2024)
Krone-Martins et al. (2019)
GRAL J15561352 ccLens system bright in radio but at too low resolution to confirm emission from source
GAIA
239.23375 ddPosition of lens unreliable/unknown, position of brightest source image given instead
13.8694722
2
0.96
Dobie et al. (2024)
Krone-Martins et al. (2019)
J2145+6345
GAIA
326.2713
63.7614461
1.182
4
2.07
This work
Lemon et al. (2019)
J214505.20+634541.1
GRAL 2343+0435
GAIA
355.8775 ddPosition of lens unreliable/unknown, position of brightest source image given instead
4.5994444
2
1.23
Dobie et al. (2024)
Krone-Martins et al. (2019)
GRAL J06072152 ccLens system bright in radio but at too low resolution to confirm emission from source
GAIA
91.795 ddPosition of lens unreliable/unknown, position of brightest source image given instead
21.8713889
4
1.7
Dobie et al. (2024)
Stern et al. (2021)
GRAL J0608+4229
GAIA
92.1725 ddPosition of lens unreliable/unknown, position of brightest source image given instead
42.4936111
4
1.3
Dobie et al. (2024)
Stern et al. (2021)
GRAL J08182613 ccLens system bright in radio but at too low resolution to confirm emission from source
GAIA
124.6179167 ddPosition of lens unreliable/unknown, position of brightest source image given instead
26.2236111
4
6.2
Dobie et al. (2024)
Stern et al. (2021)
J15373010 ccLens system bright in radio but at too low resolution to confirm emission from source
GAIA
234.355598
30.171335
4
3.3
Dobie et al. (2024)
Lemon et al. (2019)
GRAL J16510417
GAIA
252.7720833 ddPosition of lens unreliable/unknown, position of brightest source image given instead
4.2902778
4
10.1
Dobie et al. (2024)
Stern et al. (2021)
GRAL J1817+2729
GAIA
274.378545 ddPosition of lens unreliable/unknown, position of brightest source image given instead
27.494468
2.575
4
1.8
This work
Dobie et al. (2024)
Lemon et al. (2019)
J181730.82+272940.2
GRAL J20143024
GAIA
303.7258333 ddPosition of lens unreliable/unknown, position of brightest source image given instead
30.4144444
4
2.5
Dobie et al. (2024)
Delchambre et al. (2019b)
GRAL J21030850
GAIA
315.8708333 ddPosition of lens unreliable/unknown, position of brightest source image given instead
8.8469444
4
1.0
Dobie et al. (2024)
Stern et al. (2021)
SDSS J0823+2418
GAIA
125.9211496
24.3015122
2
0.64
Gross et al. (2023)
Stern et al. (2021)
Note. — Objects are ordered by lens discovery year. (1): The name given to object in its discovery paper. (2): Discovery method for the lens system, using the following key: JCP - Bright, flat-spectrum source search, as seen in the JVAS (King et al., 1999), CLASS (Browne et al., 2003), and PMN (Winn et al., 2000) lens surveys; RADIO - Other radio-based lens search or serendipitous radio discovery; XMATCH - Joint optical+radio search; OPTICAL - Lens system discovered by an optical search and confirmed as a radio source later; GAIA - Lens discovered specifically utilizing Gaia data and confirmed as a radio source later. RA, Dec: Coordinates are J2000 and correspond to the lens deflector in each system, unless otherwise noted. Many close quasar lenses, such as those in Dobie et al. (2024), have faint or blended lenses with poor astrometry, and in these cases the coordinates of the brightest image have been given instead. (3): Total flux from the nearest component to the lens coordinates within , using the Gordon et al. (2021) VLASS quick-look catalog. Non-detections are marked corresponding to that catalog’s limiting flux. (4): Number of images of the radio AGN visible in the system. Sources where the radio emission is from a lensed radio lobe rather than an AGN core are marked “Lobe”, and those where the emission is from a lensed high redshift, ultra-luminous star-forming galaxy are marked “SFG”. (5): Maximum image separation for lensed AGN cores. For SFG and Lobe sources the Einstein radius is given. (6): When multiple references are given, the first corresponds to the discovery of radio emission and the others to the (original) discovery of lensing at another wavelength. (7): VLASS source associated with this lens system, left blank if no systems were matched within .
References
- Abazajian et al. (2009) Abazajian, K. N., Adelman-McCarthy, J. K., Agüeros, M. A., et al. 2009, ApJS, 182, 543, doi: 10.1088/0067-0049/182/2/543
- Agnello et al. (2018) Agnello, A., Lin, H., Kuropatkin, N., et al. 2018, MNRAS, 479, 4345, doi: 10.1093/mnras/sty1419
- Argo et al. (2003) Argo, M. K., Jackson, N. J., Browne, I. W. A., et al. 2003, MNRAS, 338, 957, doi: 10.1046/j.1365-8711.2003.06138.x
- Astropy Collaboration et al. (2013) Astropy Collaboration, Robitaille, T. P., Tollerud, E. J., et al. 2013, A&A, 558, A33, doi: 10.1051/0004-6361/201322068
- Astropy Collaboration et al. (2018) Astropy Collaboration, Price-Whelan, A. M., Sipőcz, B. M., et al. 2018, AJ, 156, 123, doi: 10.3847/1538-3881/aabc4f
- Bade et al. (1997) Bade, N., Siebert, J., Lopez, S., Voges, W., & Reimers, D. 1997, A&A, 317, L13
- Bechtol et al. (2022) Bechtol, K., Birrer, S., Cyr-Racine, F.-Y., et al. 2022, arXiv e-prints, arXiv:2203.07354, doi: 10.48550/arXiv.2203.07354
- Becker et al. (1995) Becker, R. H., White, R. L., & Helfand, D. J. 1995, ApJ, 450, 559, doi: 10.1086/176166
- Biggs et al. (2003) Biggs, A. D., Rusin, D., Browne, I. W. A., et al. 2003, MNRAS, 338, 1084, doi: 10.1046/j.1365-8711.2003.06159.x
- Birrer & Amara (2018) Birrer, S., & Amara, A. 2018, Physics of the Dark Universe, 22, 189, doi: 10.1016/j.dark.2018.11.002
- Birrer et al. (2021) Birrer, S., Shajib, A., Gilman, D., et al. 2021, The Journal of Open Source Software, 6, 3283, doi: 10.21105/joss.03283
- Bock et al. (1999) Bock, D. C. J., Large, M. I., & Sadler, E. M. 1999, AJ, 117, 1578, doi: 10.1086/300786
- Boyce et al. (2007) Boyce, E. R., Myers, S. T., Browne, I. W. A., Stroman, W. J., & Jackson, N. J. 2007, MNRAS, 381, L55, doi: 10.1111/j.1745-3933.2007.00365.x
- Braun et al. (2019) Braun, R., Bonaldi, A., Bourke, T., Keane, E., & Wagg, J. 2019, arXiv e-prints, arXiv:1912.12699, doi: 10.48550/arXiv.1912.12699
- Browne et al. (2003) Browne, I. W. A., Wilkinson, P. N., Jackson, N. J. F., et al. 2003, MNRAS, 341, 13, doi: 10.1046/j.1365-8711.2003.06257.x
- Bruzewski et al. (2021) Bruzewski, S., Schinzel, F. K., Taylor, G. B., & Petrov, L. 2021, ApJ, 914, 42, doi: 10.3847/1538-4357/abf73b
- Carilli et al. (2015) Carilli, C. L., McKinnon, M., Ott, J., et al. 2015, Next Generation Very Large Array Memo No. 5. Science Working Groups Project Overview, https://library.nrao.edu/public/memos/ngvla/NGVLA_05.pdf
- CASA Team et al. (2022) CASA Team, Bean, B., Bhatnagar, S., et al. 2022, PASP, 134, 114501, doi: 10.1088/1538-3873/ac9642
- Chambers et al. (2016) Chambers, K. C., Magnier, E. A., Metcalfe, N., et al. 2016, arXiv e-prints, arXiv:1612.05560, doi: 10.48550/arXiv.1612.05560
- Collett (2015) Collett, T. E. 2015, ApJ, 811, 20, doi: 10.1088/0004-637X/811/1/20
- Condon (1992) Condon, J. J. 1992, ARA&A, 30, 575, doi: 10.1146/annurev.aa.30.090192.003043
- Condon et al. (1998) Condon, J. J., Cotton, W. D., Greisen, E. W., et al. 1998, AJ, 115, 1693, doi: 10.1086/300337
- Conway et al. (1990) Conway, J. E., Cornwell, T. J., & Wilkinson, P. N. 1990, MNRAS, 246, 490
- Dark Energy Survey Collaboration et al. (2016) Dark Energy Survey Collaboration, Abbott, T., Abdalla, F. B., et al. 2016, MNRAS, 460, 1270, doi: 10.1093/mnras/stw641
- Dawes et al. (2023) Dawes, C., Storfer, C., Huang, X., et al. 2023, ApJS, 269, 61, doi: 10.3847/1538-4365/ad015a
- Deane et al. (2013) Deane, R. P., Rawlings, S., Garrett, M. A., et al. 2013, MNRAS, 434, 3322, doi: 10.1093/mnras/stt1241
- Delchambre et al. (2019a) Delchambre, L., Krone-Martins, A., Wertz, O., et al. 2019a, A&A, 622, A165, doi: 10.1051/0004-6361/201833802
- Delchambre et al. (2019b) —. 2019b, A&A, 622, A165, doi: 10.1051/0004-6361/201833802
- Dey et al. (2019) Dey, A., Schlegel, D. J., Lang, D., et al. 2019, AJ, 157, 168, doi: 10.3847/1538-3881/ab089d
- Dobie et al. (2024) Dobie, D., Sluse, D., Deller, A., et al. 2024, MNRAS, 528, 5880, doi: 10.1093/mnras/stad4002
- Falco et al. (1996) Falco, E. E., Lehar, J., Perley, R. A., Wambsganss, J., & Gorenstein, M. V. 1996, AJ, 112, 897, doi: 10.1086/118062
- Fassnacht et al. (1999) Fassnacht, C. D., Blandford, R. D., Cohen, J. G., et al. 1999, AJ, 117, 658, doi: 10.1086/300724
- Gaia Collaboration et al. (2016) Gaia Collaboration, Prusti, T., de Bruijne, J. H. J., et al. 2016, A&A, 595, A1, doi: 10.1051/0004-6361/201629272
- Gaia Collaboration et al. (2023) Gaia Collaboration, Vallenari, A., Brown, A. G. A., et al. 2023, A&A, 674, A1, doi: 10.1051/0004-6361/202243940
- Galvin et al. (2020) Galvin, T. J., Huynh, M. T., Norris, R. P., et al. 2020, MNRAS, 497, 2730, doi: 10.1093/mnras/staa1890
- Gordon et al. (2021) Gordon, Y. A., Boyce, M. M., O’Dea, C. P., et al. 2021, ApJS, 255, 30, doi: 10.3847/1538-4365/ac05c0
- Graham & Liu (1995) Graham, J. R., & Liu, M. C. 1995, ApJ, 449, L29, doi: 10.1086/309629
- Gross et al. (2023) Gross, A. C., Chen, Y.-C., Foord, A., et al. 2023, ApJ, 956, 117, doi: 10.3847/1538-4357/acf469
- Haarsma et al. (2005) Haarsma, D. B., Winn, J. N., Falco, E. E., et al. 2005, AJ, 130, 1977, doi: 10.1086/466513
- Hagen et al. (1999) Hagen, H. J., Engels, D., & Reimers, D. 1999, A&AS, 134, 483, doi: 10.1051/aas:1999442
- Hartley et al. (2021) Hartley, P., Jackson, N., Badole, S., et al. 2021, MNRAS, 508, 4625, doi: 10.1093/mnras/stab2758
- He et al. (2023) He, Z., Li, N., Cao, X., et al. 2023, A&A, 672, A123, doi: 10.1051/0004-6361/202245484
- Helfand et al. (2015) Helfand, D. J., White, R. L., & Becker, R. H. 2015, ApJ, 801, 26, doi: 10.1088/0004-637X/801/1/26
- Hennawi et al. (2006) Hennawi, J. F., Strauss, M. A., Oguri, M., et al. 2006, AJ, 131, 1, doi: 10.1086/498235
- Hewitt et al. (1992) Hewitt, J. N., Turner, E. L., Lawrence, C. R., Schneider, D. P., & Brody, J. P. 1992, AJ, 104, 968, doi: 10.1086/116290
- Hewitt et al. (1988) Hewitt, J. N., Turner, E. L., Schneider, D. P., Burke, B. F., & Langston, G. I. 1988, Nature, 333, 537, doi: 10.1038/333537a0
- Högbom (1974) Högbom, J. A. 1974, A&AS, 15, 417
- Huang et al. (2020) Huang, X., Storfer, C., Ravi, V., et al. 2020, ApJ, 894, 78, doi: 10.3847/1538-4357/ab7ffb
- Huchra et al. (1985) Huchra, J., Gorenstein, M., Kent, S., et al. 1985, AJ, 90, 691, doi: 10.1086/113777
- Ibata et al. (1999) Ibata, R. A., Lewis, G. F., Irwin, M. J., Lehár, J., & Totten, E. J. 1999, AJ, 118, 1922, doi: 10.1086/301111
- Inada et al. (2003a) Inada, N., Oguri, M., Pindor, B., et al. 2003a, Nature, 426, 810, doi: 10.1038/nature02153
- Inada et al. (2003b) Inada, N., Becker, R. H., Burles, S., et al. 2003b, AJ, 126, 666, doi: 10.1086/375906
- Intema et al. (2017) Intema, H. T., Jagannathan, P., Mooley, K. P., & Frail, D. A. 2017, A&A, 598, A78, doi: 10.1051/0004-6361/201628536
- Irwin et al. (1998) Irwin, M. J., Ibata, R. A., Lewis, G. F., & Totten, E. J. 1998, ApJ, 505, 529, doi: 10.1086/306213
- Ivezić et al. (2019) Ivezić, Ž., Kahn, S. M., Tyson, J. A., et al. 2019, ApJ, 873, 111, doi: 10.3847/1538-4357/ab042c
- Jackson (2011) Jackson, N. 2011, ApJ, 739, L28, doi: 10.1088/2041-8205/739/1/L28
- Jackson et al. (2024) Jackson, N., Badole, S., Dugdale, T., et al. 2024, MNRAS, doi: 10.1093/mnras/stae916
- Jackson & Browne (2007) Jackson, N., & Browne, I. W. A. 2007, MNRAS, 374, 168, doi: 10.1111/j.1365-2966.2006.11126.x
- Jackson et al. (2015) Jackson, N., Tagore, A. S., Roberts, C., et al. 2015, MNRAS, 454, 287, doi: 10.1093/mnras/stv1982
- Jackson et al. (1995) Jackson, N., de Bruyn, A. G., Myers, S., et al. 1995, MNRAS, 274, L25, doi: 10.1093/mnras/274.1.L25
- Jackson et al. (1998) Jackson, N., Nair, S., Browne, I. W. A., et al. 1998, MNRAS, 296, 483, doi: 10.1046/j.1365-8711.1998.01304.x
- Jacobs et al. (2019) Jacobs, C., Collett, T., Glazebrook, K., et al. 2019, ApJS, 243, 17, doi: 10.3847/1538-4365/ab26b6
- King et al. (1999) King, L. J., Browne, I. W. A., Marlow, D. R., Patnaik, A. R., & Wilkinson, P. N. 1999, MNRAS, 307, 225, doi: 10.1046/j.1365-8711.1999.02328.x
- King et al. (1997) King, L. J., Browne, I. W. A., Muxlow, T. W. B., et al. 1997, MNRAS, 289, 450, doi: 10.1093/mnras/289.2.450
- Koopmans et al. (1999) Koopmans, L. V. E., de Bruyn, A. G., Marlow, D. R., et al. 1999, MNRAS, 303, 727, doi: 10.1046/j.1365-8711.1999.02342.x
- Kormann et al. (1994) Kormann, R., Schneider, P., & Bartelmann, M. 1994, A&A, 284, 285
- Krone-Martins et al. (2018) Krone-Martins, A., Delchambre, L., Wertz, O., et al. 2018, A&A, 616, L11, doi: 10.1051/0004-6361/201833337
- Krone-Martins et al. (2019) Krone-Martins, A., Graham, M. J., Stern, D., et al. 2019, arXiv e-prints, arXiv:1912.08977, doi: 10.48550/arXiv.1912.08977
- Lacy et al. (2002) Lacy, M., Gregg, M., Becker, R. H., et al. 2002, AJ, 123, 2925, doi: 10.1086/340568
- Lacy et al. (2020) Lacy, M., Baum, S. A., Chandler, C. J., et al. 2020, PASP, 132, 035001, doi: 10.1088/1538-3873/ab63eb
- Lang (2014) Lang, D. 2014, AJ, 147, 108, doi: 10.1088/0004-6256/147/5/108
- Langston et al. (1989) Langston, G. I., Schneider, D. P., Conner, S., et al. 1989, AJ, 97, 1283, doi: 10.1086/115071
- Laureijs et al. (2011) Laureijs, R., Amiaux, J., Arduini, S., et al. 2011, arXiv e-prints, arXiv:1110.3193, doi: 10.48550/arXiv.1110.3193
- Lawrence et al. (1986) Lawrence, C. R., Bennett, C. L., Hewitt, J. N., et al. 1986, ApJS, 61, 105, doi: 10.1086/191109
- Lawrence et al. (1984) Lawrence, C. R., Schneider, D. P., Schmidt, M., et al. 1984, Science, 223, 46, doi: 10.1126/science.223.4631.46
- Lehár et al. (2001) Lehár, J., Buchalter, A., McMahon, R. G., Kochanek, C. S., & Muxlow, T. W. B. 2001, ApJ, 547, 60, doi: 10.1086/318367
- Lehar et al. (1993) Lehar, J., Langston, G. I., Silber, A., Lawrence, C. R., & Burke, B. F. 1993, AJ, 105, 847, doi: 10.1086/116476
- Lehar et al. (1997) Lehar, J., Burke, B. F., Conner, S. R., et al. 1997, AJ, 114, 48, doi: 10.1086/118451
- Lemon et al. (2020) Lemon, C., Auger, M. W., McMahon, R., et al. 2020, MNRAS, 494, 3491, doi: 10.1093/mnras/staa652
- Lemon et al. (2023) Lemon, C., Anguita, T., Auger-Williams, M. W., et al. 2023, MNRAS, 520, 3305, doi: 10.1093/mnras/stac3721
- Lemon et al. (2024) Lemon, C., Courbin, F., More, A., et al. 2024, Space Sci. Rev., 220, 23, doi: 10.1007/s11214-024-01042-9
- Lemon et al. (2019) Lemon, C. A., Auger, M. W., & McMahon, R. G. 2019, MNRAS, 483, 4242, doi: 10.1093/mnras/sty3366
- Lemon et al. (2017) Lemon, C. A., Auger, M. W., McMahon, R. G., & Koposov, S. E. 2017, MNRAS, 472, 5023, doi: 10.1093/mnras/stx2094
- Lemon et al. (2018) Lemon, C. A., Auger, M. W., McMahon, R. G., & Ostrovski, F. 2018, MNRAS, 479, 5060, doi: 10.1093/mnras/sty911
- Magain et al. (1988) Magain, P., Surdej, J., Swings, J. P., Borgeest, U., & Kayser, R. 1988, Nature, 334, 325, doi: 10.1038/334325a0
- Mangat et al. (2021) Mangat, C. S., McKean, J. P., Brilenkov, R., et al. 2021, MNRAS, 508, L64, doi: 10.1093/mnrasl/slab106
- Mao et al. (2017) Mao, S. A., Carilli, C., Gaensler, B. M., et al. 2017, Nature Astronomy, 1, 621, doi: 10.1038/s41550-017-0218-x
- Marlow et al. (1999) Marlow, D. R., Myers, S. T., Rusin, D., et al. 1999, AJ, 118, 654, doi: 10.1086/300987
- Marlow et al. (2001) Marlow, D. R., Rusin, D., Norbury, M., et al. 2001, AJ, 121, 619, doi: 10.1086/318735
- McKean (2023) McKean, J. 2023, personal communication
- McKean et al. (2015) McKean, J., Jackson, N., Vegetti, S., et al. 2015, in Advancing Astrophysics with the Square Kilometre Array (AASKA14), 84, doi: 10.22323/1.215.0084
- Metcalf & Madau (2001) Metcalf, R. B., & Madau, P. 2001, ApJ, 563, 9, doi: 10.1086/323695
- Morabito et al. (2022) Morabito, L. K., Jackson, N. J., Mooney, S., et al. 2022, A&A, 658, A1, doi: 10.1051/0004-6361/202140649
- Myers et al. (1995) Myers, S. T., Fassnacht, C. D., Djorgovski, S. G., et al. 1995, ApJ, 447, L5, doi: 10.1086/309556
- Myers et al. (1999) Myers, S. T., Rusin, D., Fassnacht, C. D., et al. 1999, AJ, 117, 2565, doi: 10.1086/300875
- Myers et al. (2003) Myers, S. T., Jackson, N. J., Browne, I. W. A., et al. 2003, MNRAS, 341, 1, doi: 10.1046/j.1365-8711.2003.06256.x
- Nyland et al. (2023) Nyland, K., Alexander, K., Andernach, H., et al. 2023, VLASS Epoch 4 Science Case, https://science.nrao.edu/vlass/library/vlass-epoch-4-science-case
- O’Dea & Saikia (2021) O’Dea, C. P., & Saikia, D. J. 2021, A&A Rev., 29, 3, doi: 10.1007/s00159-021-00131-w
- Patnaik et al. (1993) Patnaik, A. R., Browne, I. W. A., King, L. J., et al. 1993, MNRAS, 261, 435, doi: 10.1093/mnras/261.2.435
- Patnaik et al. (1992) Patnaik, A. R., Browne, I. W. A., Walsh, D., Chaffee, F. H., & Foltz, C. B. 1992, MNRAS, 259, 1P, doi: 10.1093/mnras/259.1.1P
- Phillips et al. (2000) Phillips, P. M., Norbury, M. A., Koopmans, L. V. E., et al. 2000, MNRAS, 319, L7, doi: 10.1046/j.1365-8711.2000.04033.x
- Powell et al. (2023) Powell, D. M., Vegetti, S., McKean, J. P., et al. 2023, MNRAS, 524, L84, doi: 10.1093/mnrasl/slad074
- Pramesh Rao & Subrahmanyan (1988) Pramesh Rao, A., & Subrahmanyan, R. 1988, MNRAS, 231, 229, doi: 10.1093/mnras/231.2.229
- Readhead & Wilkinson (1978) Readhead, A. C. S., & Wilkinson, P. N. 1978, ApJ, 223, 25, doi: 10.1086/156232
- Reimers et al. (2002) Reimers, D., Hagen, H. J., Baade, R., Lopez, S., & Tytler, D. 2002, A&A, 382, L26, doi: 10.1051/0004-6361:20011798
- Riechers et al. (2008) Riechers, D. A., Walter, F., Brewer, B. J., et al. 2008, ApJ, 686, 851, doi: 10.1086/591434
- Rusin et al. (2001) Rusin, D., Marlow, D. R., Norbury, M., et al. 2001, AJ, 122, 591, doi: 10.1086/321156
- Schechter et al. (1998) Schechter, P. L., Gregg, M. D., Becker, R. H., Helfand, D. J., & White, R. L. 1998, AJ, 115, 1371, doi: 10.1086/300294
- Schechter et al. (2017) Schechter, P. L., Morgan, N. D., Chehade, B., et al. 2017, AJ, 153, 219, doi: 10.3847/1538-3881/aa6899
- Shajib et al. (2021) Shajib, A. J., Molina, E., Agnello, A., et al. 2021, MNRAS, 503, 1557, doi: 10.1093/mnras/stab532
- Sluse et al. (2003) Sluse, D., Surdej, J., Claeskens, J. F., et al. 2003, A&A, 406, L43, doi: 10.1051/0004-6361:20030904
- Spergel et al. (2015) Spergel, D., Gehrels, N., Baltay, C., et al. 2015, arXiv e-prints, arXiv:1503.03757, doi: 10.48550/arXiv.1503.03757
- Spingola et al. (2019a) Spingola, C., McKean, J. P., Lee, M., Deller, A., & Moldon, J. 2019a, MNRAS, 483, 2125, doi: 10.1093/mnras/sty3189
- Spingola et al. (2019b) Spingola, C., McKean, J. P., Massari, D., & Koopmans, L. V. E. 2019b, A&A, 630, A108, doi: 10.1051/0004-6361/201935427
- Stern et al. (2021) Stern, D., Djorgovski, S. G., Krone-Martins, A., et al. 2021, ApJ, 921, 42, doi: 10.3847/1538-4357/ac0f04
- Sykes et al. (1998) Sykes, C. M., Browne, I. W. A., Jackson, N. J., et al. 1998, MNRAS, 301, 310, doi: 10.1046/j.1365-8711.1998.02081.x
- Vegetti et al. (2023) Vegetti, S., Birrer, S., Despali, G., et al. 2023, arXiv e-prints, arXiv:2306.11781, doi: 10.48550/arXiv.2306.11781
- Walsh et al. (1979) Walsh, D., Carswell, R. F., & Weymann, R. J. 1979, Nature, 279, 381, doi: 10.1038/279381a0
- Weymann et al. (1980) Weymann, R. J., Latham, D., Angel, J. R. P., et al. 1980, Nature, 285, 641, doi: 10.1038/285641a0
- Winn et al. (2001) Winn, J. N., Hewitt, J. N., Patnaik, A. R., et al. 2001, AJ, 121, 1223, doi: 10.1086/319403
- Winn et al. (2002a) Winn, J. N., Lovell, J. E. J., Chen, H.-W., et al. 2002a, ApJ, 564, 143, doi: 10.1086/324144
- Winn et al. (2000) Winn, J. N., Hewitt, J. N., Schechter, P. L., et al. 2000, AJ, 120, 2868, doi: 10.1086/316874
- Winn et al. (2002b) Winn, J. N., Morgan, N. D., Hewitt, J. N., et al. 2002b, AJ, 123, 10, doi: 10.1086/338094
- Wisotzki et al. (2002) Wisotzki, L., Schechter, P. L., Bradt, H. V., Heinmüller, J., & Reimers, D. 2002, A&A, 395, 17, doi: 10.1051/0004-6361:20021213
- Wright et al. (2010) Wright, E. L., Eisenhardt, P. R. M., Mainzer, A. K., et al. 2010, AJ, 140, 1868, doi: 10.1088/0004-6256/140/6/1868
- Wucknitz (2009) Wucknitz, O. 2009, PoS, IX EVN Symposium, 102, doi: 10.22323/1.072.0102
- Xanthopoulos et al. (1998) Xanthopoulos, E., Browne, I. W. A., King, L. J., et al. 1998, MNRAS, 300, 649, doi: 10.1046/j.1365-8711.1998.01804.x
- York et al. (2000) York, D. G., Adelman, J., Anderson, John E., J., et al. 2000, AJ, 120, 1579, doi: 10.1086/301513
- Yue et al. (2022) Yue, M., Fan, X., Yang, J., & Wang, F. 2022, AJ, 163, 139, doi: 10.3847/1538-3881/ac4cb0
- Zaborowski et al. (2023) Zaborowski, E. A., Drlica-Wagner, A., Ashmead, F., et al. 2023, ApJ, 954, 68, doi: 10.3847/1538-4357/ace4ba
- Zhang et al. (2023) Zhang, L., Zhang, Z.-Y., Nightingale, J. W., et al. 2023, MNRAS, 524, 3671, doi: 10.1093/mnras/stad2069
- Zhou et al. (2020) Zhou, R., Newman, J. A., Dawson, K. S., et al. 2020, RNAAS, 4, 181, doi: 10.3847/2515-5172/abc0f4