The Role of Carbon Pricing in Food Inflation: Evidence from Canadian Provinces111This working paper is at a very early stage (draft version 1). Please use it with caution.
1 Introduction
Carbon pricing is gaining popularity among countries that are ambitious about emission mitigation. According to The World Bank (2024), 39 national jurisdictions have carbon pricing in effect as of 2023, covering 23% (\ce11.66 Gt CO_2eq222\ceCO_2eq = carbon dioxide equivalent.) of global greenhouse gas (GHG) emissions. Some representative countriesregions are Europe, Canada, New Zealand, and Mexico. Two different approaches exist for implementing carbon pricing: carbon tax and emission trade system (ETS, also referred to as cap-and-trade) (London School of Economics 2019). The former is a tax attached to the production or consumption of each unit of polluting sources, whereas the latter regulates the total emission by assigning tradable emission permits to producers.
A common concern of carbon pricing is its influence on affordability. However, economists have found little evidence for inflationary effects from carbon pricing (e.g., Tombe and Winter 2023, Moessner 2022). Some studies even see deflationary effects from carbon pricing policies (e.g., Konradt and Weder 2021, McKibbin et al. 2021). This counter-intuitive finding may be explained by the tax revenue recycling (Beck et al. 2015) and shifts in consumer preference (Network for Greening the Financial System 2020). However, the economic effects on food prices lack more thorough examinations. Food is considered one of the oil price-sensitive items given its reliance on transportation and heatingcooling (Chen and Tombe 2023). Therefore, the responsiveness of food prices to carbon pricing—which mainly targets the energy sector—deserves special attention.
Our main goal is to investigate the effect of carbon pricing on food prices in Canadian provinces. As a country with almost two decades of history of carbon pricing, Canada provides a rich reserve of resources for this research. For this reason, many previous studies on carbon pricing were case studies of Canada (e.g., Konradt and Weder 2021, Benjamin et al. 2022).
We apply difference-in-difference (DiD) methods to capture the average effects of carbon pricing policies on food CPI for Canadian provinces with effective carbon pricing. Data used in the model are sourced from Statistics Canada (2024a) and the U.S. Bureau of Labor Statistics (2023). Our results suggest a deflationary effect of carbon pricing on food prices. We also find that such a deflationary effect is more prominent in the long run. In addition, this study provides evidence that food deflation after carbon pricing is mainly attributable to reductions in consumption, while farm production costs are not sensitive to these policies.
2 Related literature
2.1 Carbon pricing in Canada
The history of carbon pricing in Canada traces back to 2007 when Quebec and Alberta implemented the country’s first carbon tax and cap-and-trade, respectively (Statistics Canada 2017). Québec implemented the first tax justified with emission in Canada in October 2007 (Québec Official Publisher 2007). However, the tax rates were too low to induce behavioral changes (Yamazaki 2017; Hanoteau and Talbot 2019 ). Hence, the Québec carbon tax is usually not considered for carbon tax studies. Similarly, Manitoba’s fuel tax, which became effective in January 2012 (Manitoba 2015), is also not a desirable policy for this type of study as it covers only coal and petroleum coke.
Canada’s first standard carbon pricing policy was implemented in 2007 in Alberta as a cap-and-trade system. This policy became North America’s first multi-sector emission trading system that encourages fast-abating producers to take more abatement actions and sell leftover allowances to the slower ones (Government of Alberta 2009). The first time the name “carbon tax” was used in a Canadian legislative document was in British Columbia, where the province initiated a tax on energy purchases in July 2008 (Office of Legislative Counsel 2008). The ineffective tax in Québec was replaced by a cap-and-trade system in January 2013 (Gouvernement du Québec 2018). At the end of 2016, Alberta, British Columbia, and Québec had implemented their provincial carbon pricing systems.
In December 2016, Canada announced the Pan-Canadian Framework (PCF) that aims to reduce GHG emissions by \ce219 Mt CO_2eq from the 2016 level333This target was subsequently replaced by Net-zero emissions by 2025 (Government of Canada 2023).. PCF demands all provinces have carbon pricing matching the federal benchmark by 2018. The federal government inserts a “backstop” to any shortage in carbon pricing to help all provinces meet the benchmark (Winter 2020).
After the deadline for carbon pricing set by the PCF, all Canadian provinces and territories have carbon pricing systems in place, with federal backstops applied partially or in full. Some existing carbon pricing systems before the PCF were also replaced by new systems. A detailed description of post-PCF carbon pricing in each province can be found in Office of the Auditor General of Canada (2022) and Winter (2020).
2.2 Economic effects of carbon pricing
Although the literature on the economic effects of carbon pricing is not rich, studies generally disagree with the opinion that carbon pricing causes affordability issues. For example, Tombe and Winter (2023) examine the effective carbon tax rate in British Columbia and find that carbon tax only increased the prices of most items by less than , with the effect on food being slightly higher (). Moessner (2022) find similar result among the OECD countries. They suggest that by increasing the carbon price by \ce$10 t CO_2eq, food and core CPI444Consumer price index show no significant response. Känzig (2023) separately investigates headline and core CPI555Core CPI excludes food and energy and finds significant increases in both indices, but the overall effect is minimal compared to the increase in energy price.
Some studies find adverse impacts on inflation. McKibbin et al. (2021) show that while a carbon tax has a small positive impact on the headline inflation of Europe, the core inflation indeed decreases because of carbon tax. This disparity provides evidence that food and energy may respond to carbon pricing differently compared to other commodities. Another study by Konradt and Weder (2021) suggests significant but small deflation effects from carbon taxes in Canada and Europe.
The counter-intuitive effects of carbon pricing on inflation are attributable to several factors. First, consumers may switch to green products due to the policy (Network for Greening the Financial System 2020). This substitution behavior will, to some extent, offset the effects on the cost of living. Second, carbon pricing encourages innovations in renewable energy (Andersson et al. 2020). However, the speed of innovation makes it unlikely that renewable energy explains price changes in the short run. Third, in the case of Alberta, the output-based pricing system (OBPS) for large emitters relieves the additional costs on households (Winter et al. 2023). Another potential reason is the recycling of proceeds. Beck et al. (2015) find that the carbon tax rebate in British Columbia increases the real income of lower-income families. Lastly, results of Konradt and Weder (2021) suggest that the increase in energy price due to carbon tax is more than offset by the decrease in prices of services and other tradables. This phenomenon may be explained by the falling income of higher-income households, cheaper real estate, and energy-intensive durables (Konradt and Weder 2021).
To assess mechanisms of changes in food prices, we focus on the demand and supply shocks associated with carbon pricing. Specifically, we access changes in consumption per capital and farm input costs after carbon pricing.
2.3 Data
We use the monthly food CPI of Canadian provinces between January 2005 and December 2016 (inclusive) from Statistics Canada (2024a). The original data starts from 2000 and is constantly being updated. We keep only the window between 2005 and 2016 for two reasons. First, because the data is monthly, there are too many pre-treatment periods before 2005 which may capture the effects of irrelevant events. Second, the PCF, which started in 2017, led to nationwide carbon pricing and updated some existing provincial policies. Identifying the effect of PCF requires more complex designs and does not fall within the scope of this study. For this reason, we leave carbon pricing policies after 2016 for future research.
Summary statistics of provincial food CPI data are in Table 1. Food CPIs are normalized to have an average value of in 2002. The month variable is indexed from for January 2005 to for December 2016. “Treated group” is a dummy for whether a province has carbon pricing in any period.
| month | province | food cpi | treated group |
|---|---|---|---|
| Min. : 1.00 | Length:1440 | Min. :100.7 | Min. :0.0 |
| 1st Qu.: 36.75 | Class :character | 1st Qu.:113.5 | 1st Qu.:0.0 |
| Median : 72.50 | Mode :character | Median :126.1 | Median :0.0 |
| Mean : 72.50 | Mean :125.6 | Mean :0.3 | |
| 3rd Qu.:108.25 | 3rd Qu.:136.3 | 3rd Qu.:1.0 | |
| Max. :144.00 | Max. :157.6 | Max. :1.0 |
3 Empirical analysis
3.1 Difference-in-difference (DiD)
We first use a simple DiD method to identify the average treatment effect on the treated (ATT) of carbon pricing on food CPI in each province that had carbon pricing before 2017. Quebec, Alberta, and British Columbia are the “treated provinces”. On the other hand, the “controlled provinces” include Manitoba, Newfoundland and Labrador, Prince Edward Island, Nova Scotia, Ontario, New Brunswick, and Saskatchewan666We do not consider territories due to their specialty in Canadian politics..
The empirical model for each treated province is specified as
| (1) |
where and denote the group membership (a treated province or the controlled provinces) and month. is the average CPI for food items in month and province . is a dummy variable that takes on the value of when an observation belongs to the treated provinces and is observed after the implementation of carbon pricing, which is equivalent to the interaction of a province dummy and a month dummy. is the average treatment effect of carbon pricing on food CPI of the treatment group (i.e., ATT). Parameters and are province and month fixed effects. Lastly, is the disturbance term. Note that our specification resembles the robustness check section of Konradt and Weder (2021). However, this model extends to more provinces and focuses on food commodities.
We estimate Equation 1 for each treated province (Alberta, Quebec, British Columbia) against the whole control group. The food CPI for the latter is taken as the group average. This repeated pairwise DiD allows us to assess the ATT in each treated province.
We also adopt a staggered DiD design to accommodate the different treatment timings across provinces and capture the long-run treatment effects. Following Callaway and Sant’Anna (2021), the staggered DiD model in our study is
| (2) |
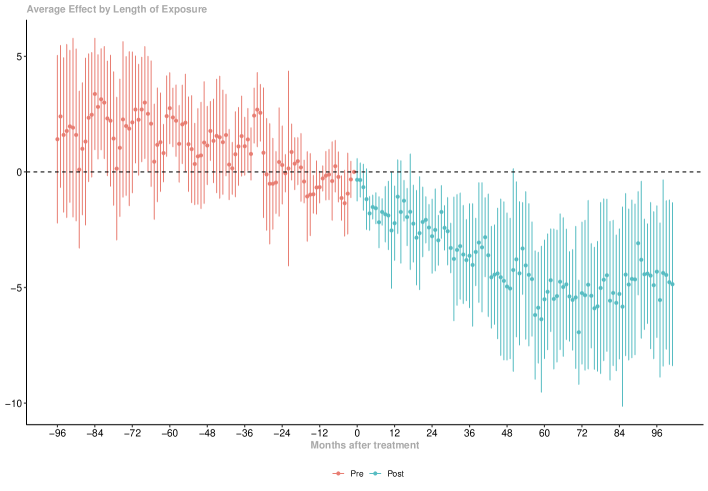
where denotes each lag or lead to the treatment. and are positive constants denoting the first lead and the last lag observed. represents the interaction between treated provinces and treated months. Coefficients and are effects corresponding to each period before or after the treatment (i.e., leads and lags). All coefficients are normalized with respect to the coefficient of period . We are interested in the treatment effects averaged across treated provinces in each post-treatment period (), which is also known as the group-time average treatment effects. Fixed effects are again denoted by and , and is the new error term. Because of the inclusion of multiple time periods and treated groups, staggered DiD is also known as a dynamic two-way fixed effects or event study.
Another benefit of staggered DiD is that the model specification is itself a falsification test. We can learn the validity of the treatment from the difference between pre- and post-treatment effects. We should observe insignificant pre-treatment effects () and significant post-treatment effects () if changes in the output variable are caused by the treatment. In addition, the post-treatment coefficients show the evolution of treatment effects in the long run. A similar approach is used in Autor (2003).
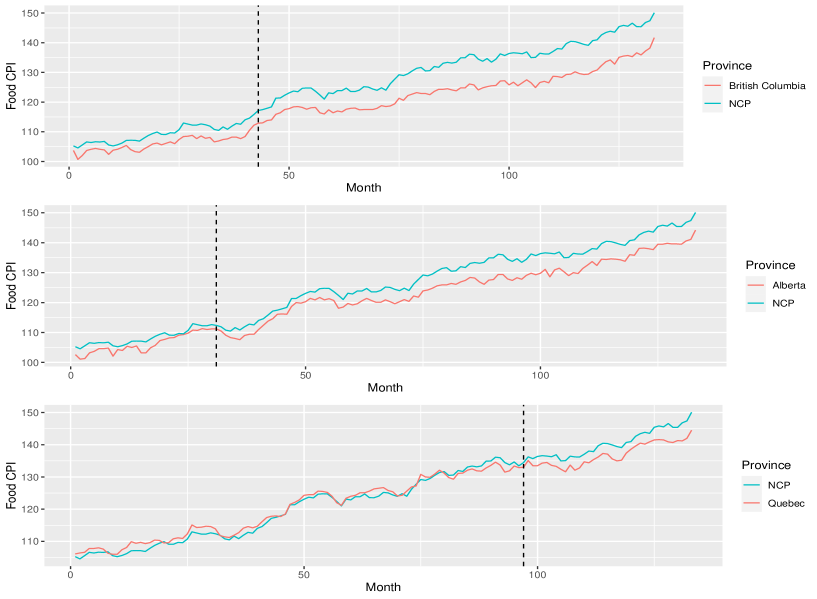
We illustrate changes in food CPI in treatment and control groups in Figure 1. NCP (no carbon pricing) represents the average of the control group. Each vertical dashed line indicates the month when a provincial carbon pricing policy was enacted. There is a clear drop in food CPI in all treated provinces compared to the controlled provinces after carbon pricing. The slightly nonparallel trends before treatment are unlikely to be a concern since they are small in size. We rely on the significance of the pre-treatment effects in Equation 2 to test the parallel trend assumption. The trends of Quebec and controlled provinces overlap until the treatment (cap-and-trade) is close, which agrees with Hanoteau and Talbot (2019) that the carbon tax in Quebec was ineffective.
The fuel tax implemented in 2012 in Manitoba remains a source of uncertainty. We include Manitoba in the controlled group due to the limited coverage of its tax. Nevertheless, such an exclusion may cause model misspecification. Thus, we conduct a falsification test by moving Manitoba from the control group to the treated group in another staggered DiD regression.
4 Regression results
We first run separate DiD models for each pairwise comparison between one treated province and the controlled provinces. From the results presented in Table 1, all models suggest negative effects of carbon pricing on food CPI. Each column of Table 1 contains results for one treatment province, as well as the type of carbon pricing applied (carbon tax or cap-and-trade). BC has the greatest (most negative) estimated effect, stating that the carbon tax program in BC is linked to a reduction in food CPI by . Other provinces also show significant negative effects. The effect in Alberta is only half of other provinces. The overall effect of carbon pricing on food CPI based on separate pairwise DiD models lies between and , which confirms the results by McKibbin et al. (2021) and Konradt and Weder (2021) that carbon pricing is deflationary.
| Dependent variable: | |||
| Food CPI | |||
| BC: tax | AB: trade | QC: trade | |
| ATT | 4.792∗∗∗ | 2.516∗∗∗ | 4.088∗∗∗ |
| (0.315) | (0.311) | (0.231) | |
| Province FE | Yes | Yes | Yes |
| Month FE | Yes | Yes | Yes |
| Observations | 266 | 266 | 266 |
| R2 | 0.638 | 0.333 | 0.706 |
| Adjusted R2 | 0.268 | 0.350 | 0.404 |
| F Statistic (df = 1; 131) | 230.861∗∗∗ | 65.330∗∗∗ | 313.933∗∗∗ |
| Note: | ∗p0.1; ∗∗p0.05; ∗∗∗p0.01 | ||
When the DiD model has a staggered design as in Equation 2, we observe some interesting patterns in long-term effects. The estimated average treatment effects and their confidence intervals are plotted in Figure 2. The horizontal axis contains the leads (positive values) and lags (negative values) to the treatment. The first observation is that the effects of carbon pricing on food CPI are also deflationary as in separate pairwise models. The effects vary over time. The immediate effects after carbon pricing are either weak ( CPI) or insignificant. The deflationary effects after 24 months (2 years) are more potent than in the earlier post-treatment periods. The difference between the short-run and long-run estimates suggests that the deflationary effects of carbon pricing on food require some “rendering-in” time. Carbon pricing has an immediate treatment effect on food prices of CPI and a long-run effect of CPI.
Our next finding relates to the parallel trend assumption that is fundamental for DiD studies. Most of the confidence intervals of pre-treatment effects cover 0, especially those in the last 36 months (3 years) before treatment. Therefore, despite the small splits in pre-treatment trends shown in Figure 1, the parallel assumption still holds in a boarder sense.
The last observation, or the problem, is that the confidence intervals are wide. This issue arises from the macro nature of our data—there are at most observations (provinces) in each period. While the estimated effects are still informative, we refrain from testing any hypotheses other than the confidence intervals as the test statistics will lack reliability. On the other hand, despite the uncertainty between the upper and lower bounds of estimates, the overall treatment effects still show clear reductions in food CPI after carbon pricing.
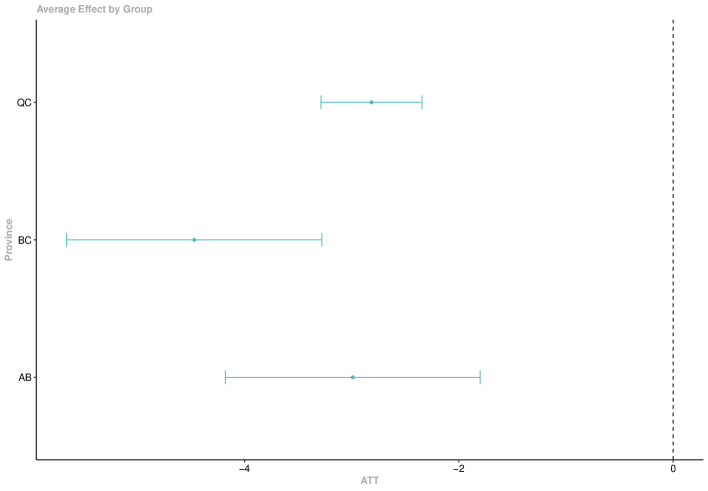
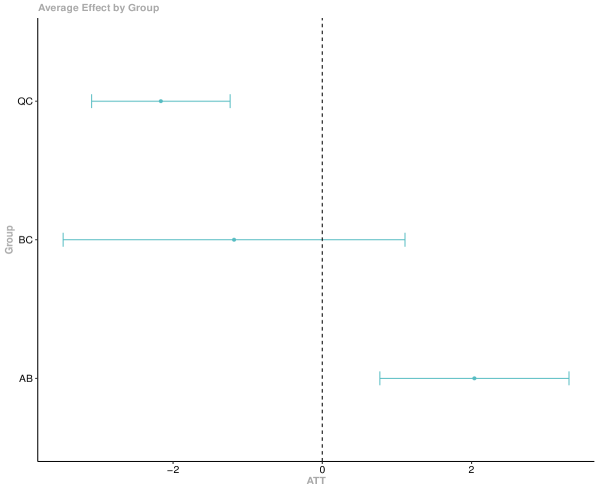
We also estimate the province-level treatment effects (Figure 3) to examine the provincial heterogeneity. All provinces with carbon pricing experienced significant decreases in food CPI after carbon pricing. The food CPI of British Columbia reduced by the most (). The effects in the other two provinces are around . Nonetheless, the expected reduction in food CPI is minimal even for BC where the food deflationary effect is the strongest.
In summary, the effects of carbon pricing on food CPI are overall deflationary and sometimes insignificant. The decrease in food CPI was minimal in the first two years of carbon pricing but slowly intensified until reaching around CPI after 5 - 7 years of treatment. There is a slight upward trend in the effects after seven years of carbon pricing, but the magnitude is incomparable with the earlier negative effects. Hence, at least within an 8-year window (96 months), our results suggest an association between food deflation and carbon pricing policies.
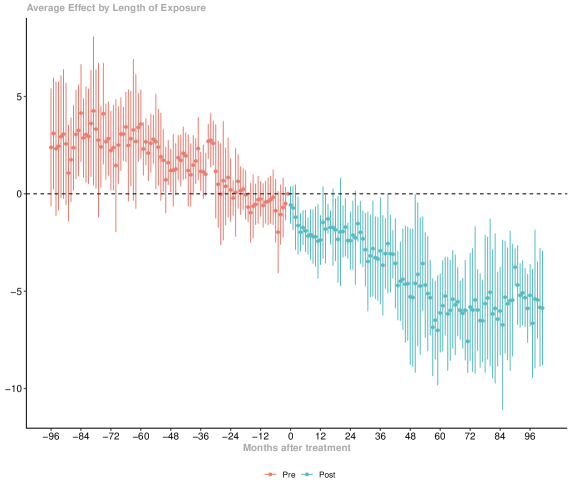
Lastly, we perform falsification test by re-estimating Equation 2 with Manitoba defined as a treated province. The post-treatment effects do not change significantly after we redefine the coverage of treatment (see Figure 4). On the other hand, most pre-treatment effects are significantly different from 0. Although the pre-treatment effects still plateau around 0 in the last 36 months before treatment, the parallel trend assumption is less likely to hold when Manitoba is considered as treated instead of controlled.
5 Mechanism of price adjustment
So far, we have confirmed the adverse relationship between carbon pricing and food prices, but the channels through which the deflation occurs remain unclear. In this section, we investigate the market-based channels—in other words, the effects of demand and supply shocks.
We first examine the demand-side shock in terms of consumption. We use another staggered DiD model with the same independent variables and log consumption per capita as the new output variable777Data of consumption is collected by Statistics Canada (2024b). Due to limited data availability, we use aggregate consumption instead of food alone. A separate regression is used for each of the five income quintiles of each treated province. The results are plotted in Figure 5.
The consumption effects of carbon pricing are heterogeneous across provinces and income quintiles. The first three income quintiles (mid to low income) have clear drops in consumption. BC has reduced consumption in all of the first three income quintiles. The effects range from in the first quintile to in the third quintile. Alberta experiences the strongest shrinkage in consumption in the first quintile (), while the effects in the next two quintiles are insignificant. The consumption per capita of Quebec is affected the least, with the most substantial reduction being only in the second quintile.
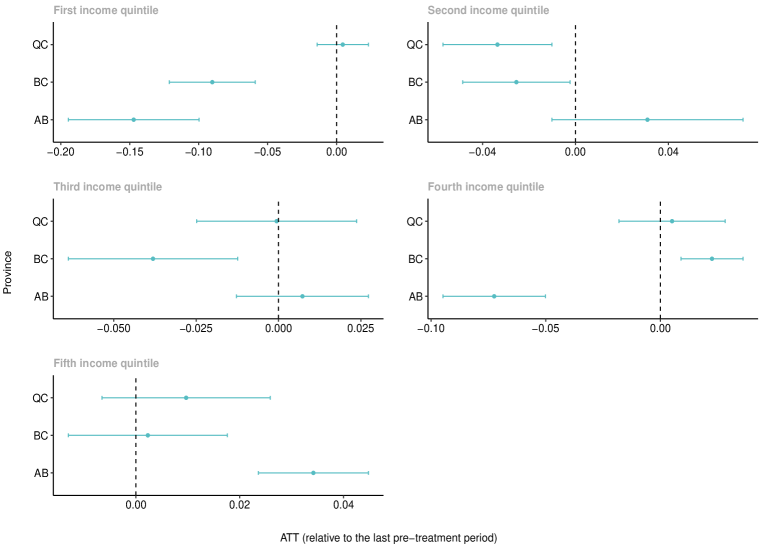
The consumption effects are more puzzling in the higher-income quintiles (last two plots of Figure 5). Alberta has a reduction in consumption of in the fourth quintile, while the effect was in the highest quintile. It is unclear why the directions of effects are different. However, the overall consumption effect in higher-income quintiles is still negative since the increase in the fifth quintile is small. The other two provinces in upper-income quintiles mostly have insignificant changes in consumption, with BC having a small and significant increase in the fourth quintile.
Based on our analysis, the deflated food prices are partially driven by reduced consumption. Despite the heterogeneity across income quintiles and provinces, the aggregated effect of carbon pricing on consumption is predominantly negative.
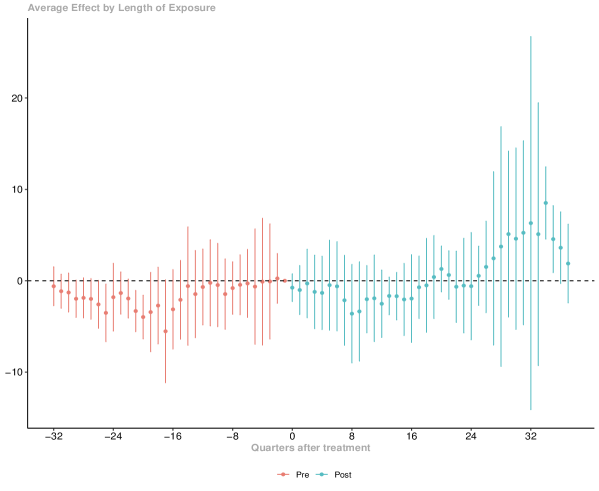
The supply side effect, on the other hand, does not seem to vary with carbon pricing. We use staggered DiD once more to regress on the farm input cost index (index for 2002 100)888Data of farm input cost index is collected by Statistics Canada (2024c). The results by province are shown in Figure 6. The changes in farm input costs are minimal. Only the farm input cost of Alberta increased by indices after carbon pricing, while the effects in other treatment provinces are either negative or insignificant.
We plot the average treatment effect on farm input cost in Figure 7. Similar to the provincial-level effects shown in Figure 6, there is no significant change in farm input cost after carbon pricing. The average treatment effect has a small bump 24 quarters (6 years) after carbon pricing. Nevertheless, given that the bumped effects are still insignificant and that 24 quarters are rather far away, we do not consider it an effect of carbon pricing.
The insignificant effect of carbon pricing on farm input costs is likely due to the design of carbon pricing policies. In Alberta, the cap-and-trade system encourages farms to reduce emissions and sell their leftover permits to larger emitters. In the province’s 2009 summary of specified gas emitters regulation 2009, reduced tillage offset \ce1,607 thousand tonnes of \ceCO_2eq in the 2009 compliance year, making it the largest source of emission offsets. The revenue from selling leftover emission permits may have made up for farmers’ loss from abatement actions. In BC, the carbon tax is exempted for fuels used for farming purposes. Although some subsequent production stages are still taxed (e.g., processing, transportation, etc), farm operation takes a significant portion of the total carbon footprint of food. Lastly, the agri-food establishments in Quebec receive free allowances in the cap-and-trade system. Though the direct impact of free allowances on farm production is unclear, one can expect that this policy, to some extent, offsets the cost burden of farmers.
Therefore, we find a significant reduction in consumption (demand side) and an insignificant change in farm input cost (supply side). These analyses suggest that food deflation in treated Canadian provinces is mainly due to reduced demand. It should be noted that this deflation is not necessarily beneficial for consumers. Indeed, the deflated food price is a result of lower consumption rather than a signal of future welfare improvement.
Our results on the consumption effect are somehow not in line with studies focusing on the effects of tax revenue recycling. Beck et al. (2015) and Winter et al. (2023) both find that carbon pricing harms low-income households less. Contrarily, based on our analysis shown in Figure 5, lower-income quintiles are not hurt any less than the higher-income ones. The disagreement between results may be attributable to the methods used. Beck et al. (2015) and Winter et al. (2023) use a CGE model and a simulation model with synthetic microdata, respectively, while our approach is econometric. More research is needed to detail the effect of carbon pricing on consumption.
6 Conclusion
This study finds that carbon pricing policies in Canadian provinces have a deflationary effect on food prices. Such an effect requires a “rendering-in” period of about 24 months (2 years). The actual magnitude of the deflation, however, is still weak even at its peak. We find evidence in support of the demand-driven mechanism of deflation, such that consumption per capita decreased due to carbon pricing. The supply-side effect, in contrast, does not contribute much to the deflation.
Our results oppose the misconception that carbon pricing speeds up inflation, but this finding does not render carbon pricing a harmless policy to the general consumers. The decreased food prices are more likely the result of lower consumption rather than a forecast of welfare gains. Despite the uncertainty over welfare, the impact of carbon pricing on food prices and consumption is still minimal. Therefore, carbon pricing should not be blamed for the growing food affordability issue. As pointed out by Tombe and Winter (2023), carbon pricing is not the reason for the high cost of living as its effects on prices are negligible for most commodities999Tombe and Winter (2023) find a negligible increase in food price, which is different from the small negative effect found in this study. Although disagreement exists in the direction of effects, both their and this study conclude that carbon pricing does not drive up inflation.
Besides consumption, the special treatment farmers receive in light of carbon pricing policies also contributes to lower food prices. Farmers and agri-food producers receive various types of exemptions and aids in provinces that price carbon. These benefits relieve the pressure that carbon pricing could have put on food affordability.
Obviously, the impact on the affordability of food or other commodities is not the primary target of carbon pricing. Still, the social cost of carbon pricing needs to be justified by the reduction in fossil fuel use and the transition to greener energy sources. The effectiveness of carbon pricing on environmental quality and resource use is a subject for future research.
A limitation of our study is the data quality. Compared to microdata, the monthly provincial food CPI data lacks variation. We expect to get more precise results if microdata on food costs are available.
References
- Andersson et al. (2020) Andersson, M., J. Morgan, and C. Baccianti (2020). Climate change and the macro economy. ECB Occasional Paper (2020243).
- Autor (2003) Autor, D. H. (2003). Outsourcing at will: The contribution of unjust dismissal doctrine to the growth of employment outsourcing. Journal of labor economics 21(1), 1–42.
- Beck et al. (2015) Beck, M., N. Rivers, R. Wigle, and H. Yonezawa (2015). Carbon tax and revenue recycling: Impacts on households in british columbia. SSRN Electronic Journal.
- Benjamin et al. (2022) Benjamin, E. O., D. Hall, J. Sauer, and G. Buchenrieder (2022). Are carbon pricing policies on a path to failure in resource-dependent economies? a willingness-to-pay case study of canada. Energy Policy 162, 112805.
- Callaway and Sant’Anna (2021) Callaway, B. and P. H. Sant’Anna (2021). Difference-in-differences with multiple time periods. Journal of econometrics 225(2), 200–230.
- Chen and Tombe (2023) Chen, Y. and T. Tombe (2023). The rise (and fall?) of inflation in canada: A detailed analysis of its post-pandemic experience. Canadian Public Policy 49(2), 197–217. Publisher: University of Toronto Press.
- Gouvernement du Québec (2018) Gouvernement du Québec (2018). Québec cap-and-trade system for greenhouse gas emission allowances (C&T). Technical overview (3rd edition ed.). Québec, Québec: Environnement et lutte contre les changements climatiques Québec. OCLC: 1157034955.
- Government of Alberta (2009) Government of Alberta (2009). Annual Summary of Specified Gas Emitters Regulation: 2009.
- Government of Canada (2023) Government of Canada (2023). Net-zero emissions by 2050. https://www.canada.ca/en/services/environment/weather/climatechange/climate-plan/net-zero-emissions-2050.html.
- Hanoteau and Talbot (2019) Hanoteau, J. and D. Talbot (2019). Impacts of the Québec carbon emissions trading scheme on plant-level performance and employment. Carbon Management 10(3), 287–298.
- Konradt and Weder (2021) Konradt, M. and B. Weder (2021). Carbon taxation and inflation: evidence from the european and canadian experience.
- Känzig (2023) Känzig, D. (2023). The unequal economic consequences of carbon pricing. National Bureau of Economic Research.
- London School of Economics (2019) London School of Economics (2019). What is a carbon price and why do we need one? https://www.lse.ac.uk/granthaminstitute/explainers/what-is-a-carbon-price-and-why-do-we-need-one.
- Manitoba (2015) Manitoba (2015). The Emission Tax on Coal and Petroleum Coke Ace. C.C.S.M. c. E90.
- McKibbin et al. (2021) McKibbin, W., M. Konradt, and B. Weder di Mauro (2021). Climate policies and monetary policies in the euro area. Publisher: [sn].
- Moessner (2022) Moessner, R. (2022). Effects of carbon pricing on inflation. Publisher: CESifo Working Paper.
- Network for Greening the Financial System (2020) Network for Greening the Financial System (2020). Climate change and monetary policy.
- Office of Legislative Counsel (2008) Office of Legislative Counsel (2008). Carbon Tax Regulation. B.C. Reg. 125/2008 (O.C. 386/2008).
- Office of the Auditor General of Canada (2022) Office of the Auditor General of Canada (2022). Carbon pricing - Environment and Climate Change Canada: independent auditor’s report. OCLC: 1315025134.
- Québec Official Publisher (2007) Québec Official Publisher (2007). Regulation respecting the annual duty payable to the Green Fund. Act respecting the Régie de l’énergie (chapter R-6.01, ss. 85.36 and 114). Implicitly revoked, S.Q. 2013, c. 16, s. 177; eff. 2020-11-01.
- Statistics Canada (2017) Statistics Canada (2017). Carbon pricing in the canadian system of macroeconomic accounts. Technical report, Statistics Canada. https://www150.statcan.gc.ca/n1/pub/13-605-x/2017001/article/14838-eng.htm.
- Statistics Canada (2024a) Statistics Canada (2024a). Consumer price index, monthly, not seasonally adjusted.
- Statistics Canada (2024b) Statistics Canada (2024b). Distributions of household economic accounts, income, consumption and saving, Canada, provinces and territories.
- Statistics Canada (2024c) Statistics Canada (2024c). Farm input price index, quarterly.
- The World Bank (2024) The World Bank (2024). Carbon pricing dashboard.
- Tombe and Winter (2023) Tombe, T. and J. Winter (2023). Energy and environmental policy trends: Emissions pricing and affordability: Lessons from british columbia. The School of Public Policy Publications 16(1).
- U.S. Bureau of Labor Statistics (2023) U.S. Bureau of Labor Statistics (2023). Food at home in U.S. city average, all urban consumers, not seasonally adjusted.
- Winter (2020) Winter, J. (2020). Carbon pricing in a federal state: The case of canada. ifo DICE Report 18(1), 13–19.
- Winter et al. (2023) Winter, J., B. Dolter, and G. K. Fellows (2023). Carbon pricing costs for households and the progressivity of revenue recycling options in canada. Canadian Public Policy 49(1), 13–45.
- Yamazaki (2017) Yamazaki, A. (2017). Jobs and climate policy: Evidence from british columbia’s revenue-neutral carbon tax. Journal of Environmental Economics and Management 83, 197–216.