Radiation hardness of open Fabry-Pérot microcavities
††journal: opticajournal††articletype: Research ArticleHigh-finesse microcavities offer a platform for compact, high-precision sensing by employing high-reflectivity, low-loss mirrors to create effective optical path lengths that are orders of magnitude larger than the device geometry. Here, we investigate the radiation hardness of Fabry-Pérot microcavities formed from dielectric mirrors deposited on the tips of optical fibers. The microcavities are irradiated under both conventional ( 0.1 Gy/s) and ultrahigh (FLASH, 20 Gy/s) radiotherapy dose rates. Within our measurement sensitivity of 40 ppm loss, we observe no degradation in the mirror absorption after irradiation with over 300 Gy accumulated dose. This result highlights the excellent radiation hardness of the dielectric mirrors forming the cavities, enabling new optics-based, real-time, in-vivo, tissue-equivalent radiation dosimeters with 10 micron spatial resolution (our motivation), as well as other applications in high-radiation environments.
1 Introduction
External beam radiotherapy (EBT) is one of the most common treatments for cancer worldwide. It relies on the selective destruction of tumoural cell DNA via irradiation [1] with energetic (MeV) photons, electrons, or protons [2]. For all applications, it is critical to accurately estimate – ideally by real-time, in vivo measurement [3] – the radiation dose deposited in the tumour and surrounding tissue.
Many dosimeters have been explored in both literature and clinical practices [4, 5], but all come with important limitations that may either result in undesired irradiation of surrounding healthy tissues or imprecision in the delivered dose [6], or make them incompatible with new ultrahigh dose rate schemes (FLASH [7, 8, 9]). These issues emerge from technical challenges [10, 11, 12, 13, 14, 15, 16] including (i) dissimilarity between the sensing medium and tissue, which leads to dose rate and beam-energy dependencies, and the need for multiple calibrations, (ii) sensor dimensions or materials that perturb beam fluence, limit spatial resolution, and/or preclude in-vivo measurement, (iii) directional dependencies, and (iv) lack of real-time readout.
All four challenges could potentially be addressed using a fiber-coupled Fabry-Pérot optical microcavity [17] filled with water – a tissue-equivalent medium – probed on resonance to continuously monitor for the microseconds-long transients in absorption associated with hydrated electrons generated by passing radiation [18, 19, 20, 21, 22, 23]. While hydrated electron spectroscopy has long been a known modality of radiation detection in water [24, 23], the long optical paths ( cm) required to obtain a measurable absorption signal have hampered practical application to dosimetry. By enclosing the water within a high-finesse optical microcavity, a long optical path can be realized with a sensor that is shorter by many orders of magnitude. In particular, fiber cavities, which employ mirrors fabricated on the tips of optical fibers, routinely achieve an optical path length enhancement of or more with active volumes as small as and external dimensions nominally limited by the m diameter of standard single-mode optical fibers. This small sensor size, coupled with alignment-free fiber delivery of optical signals, lends itself naturally to endoscopic applications.
Before considering such a detector, it is essential to verify that the cavity mirrors do not significantly degrade when exposed to relevant doses of radiation (i.e., that they exhibit “radiation hardness”). To get a sense of scale for the required mirror performance, we note that folding the optimal meter-scale water path [23] into a sub-millimeter optical cavity requires finesse of at least 3,000, corresponding to mirror losses below 1,000 ppm (note this scales with cavity length). If clinical radiation introduces additional losses at this level, this technology will be hampered by the need to recalibrate or replace mirrors frequently.
In this paper, we verify the radiation hardness of finesse 8,000 Fabry-Pérot fiber cavities formed by dielectric micromirrors under extreme conditions. Specifically, we observe no measurable increase in cavity losses (within our ppm sensitivity) across multiple devices and for accumulated doses up to Gy delivered under clinical and FLASH conditions. Radiation hardness is observed for both direct (electron beam) and indirect (photon beam) radiation. Beyond enabling a new paradigm for oncological dosimetry, these robust mirrors may also be used for quantum optics and sensing applications in other high-radiation environments including space [25], nuclear, and / or defense scenarios.
2 Experimental Setup and Methods
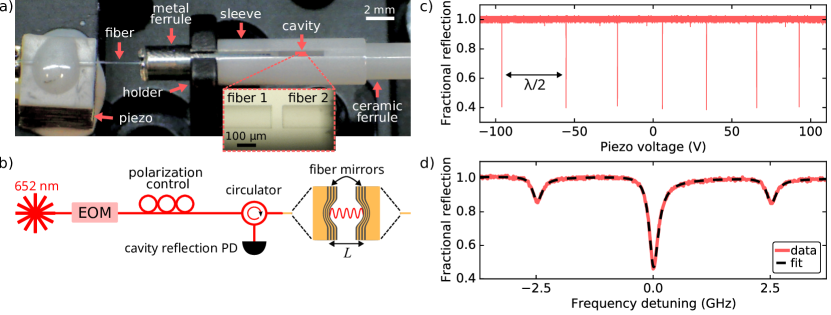
We test air-filled fiber-fiber cavities (FFCs) comprising two concave micromirrors fabricated on the tips of opposing single-mode pure silica optical fibers (Thorlabs 630HP; Fig. 1a inset). Small (50 m) radius-of-curvature dimples are created on cleaved fiber tips using a CO2 laser ablation process [17], and subsequently coated with dielectric Bragg mirrors having alternating layers of Ta2O5 and SiO2 [26]. The small dimples in this batch of fiber mirrors limit our stable cavity lengths to 30 m. However, since irradiation can only introduce losses via the coating materials (see below), our results apply to other mirror geometries and cavity lengths as well. We probe the cavities with a 652 nm laser (Toptica DL Pro); this wavelength is chosen because it is near the maximum ratio of absorption from hydrated electrons [20] and water [27]. The Bragg stack is designed to transmit 60 ppm at this wavelength, corresponding to finesse 50,000. However, the combination of material absorption, scattering losses, and mirror shape provide a comparable loss [28, 26], reducing the finesse to 10,000-20,000 for this particular batch of cavities.
Passive cavity alignment is achieved using two ferrules mounted in a C-shaped sleeve, where one fiber is glued to a long-range shear piezoelectric actuator (Thorlabs PN5FC1; Fig. 1a) used to tune the cavity length over m, corresponding to free spectral ranges (FSRs). Laser light is injected through one fiber, and light reflected back into the same fiber is detected through an optical circulator (OZ Optics) with a photodiode (Thorlabs DET10A or Thorlabs PDA8A; Fig. 1b). An example cavity reflection signal is shown in Fig. 1c, exhibiting 7 narrow resonances over the piezo scanning range. A high-resolution scan of individual dips reveals an asymmetric line shape (Fig. 1d) associated with imperfect alignment between the cavity and fiber modes [26].
Mirror radiation hardness is tested by measuring the cavities’ finesse and linewidth before and after irradiation. These quantities depend on the power transmission , through each mirror and the round-trip power loss (absorption and scattering) as and , where is cavity length, and is the total round-trip loss. Note these quantities do not vary with radiation-induced changes in the surrounding silica fibers, and (for a fixed cavity alignment) any finesse or linewidth variation can be entirely attributed to a change in mirror loss.
We extract for a given cavity mode from the ratio of the spacing between adjacent resonances (i.e., one FSR; see Fig. 1c) to the linewidth of the resonance (Fig. 1d). To reduce vibrations, we drive the piezo with a continuous sinusoid, and calibrate the relative mirror position (-axis) from the raw data (Fig. 1c) by fitting the resonance locations – known to occur every half wavelength (326 nm) – to a sinusoid. To estimate , we add sidebands to the laser with an electro-optical modulator (EOM) at a single convenient frequency between GHz (2.5 GHz in Fig. 1d), producing three peaks of known separation in the reflected signal, allowing us to calibrate the detuning between the cavity resonance and laser light.
3 Conventional dose rate exposure
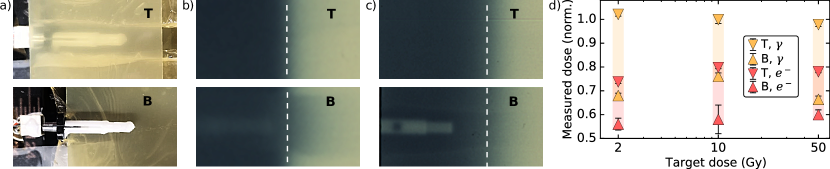
We first test the fiber mirrors under conventional radiotherapy dose rates with both photon and electron beams using a clinical linear particle accelerator (Varian Trilogy Clinac, Varian Medical Systems) with a radiation field size of cm2 at a source-to-surface distance (SSD) of 1 m. The photon irradiation is set at 6 MV and dose rate of 1000 MU/min (1 MU = 1 cGy of absorbed dose to water at the depth of maximum dose, for SSD of 1 m and field size of cm2); the electron irradiation is set at 6 MeV, with a dose rate of 600 MU/min. During irradiation, we surround the devices with a standard bolus material (Superflab), that mimics human tissue and serves as a build-up medium, to ensure the appropriate radiation dose is delivered to the cavity vicinity. We use a 1-cm-thick top layer for the photon beam and a 0.5-cm-thick top layer for the electron beam to account for differences in particle penetration depth [29]. To test mirror hardness under conventional therapeutic conditions, the cavities are irradiated to 200, 1000 and 5000 MU, corresponding to target doses of 2, 10, and 50 Gy. These values are chosen to span relevant clinical doses: 2 Gy corresponds to a typical partial dose delivered to patients in a single session, and 50 Gy is roughly the maximum clinical accumulated dose used in conventional radiotherapy schemes.
The dose delivered to the cavities is estimated using EBT3 radiochromic film (Ashland). We determine bounds on this value using film below (B) and on top of (T) the devices [30], as shown in Fig. 2a; the measurements have an uncertainty of 2% according to the film dosimetry protocol. Example exposed films are shown in Fig. 2b-c for 10 Gy photon and electron irradiation, respectively. Due to the shorter penetration depth of electron irradiation, the device outline (C-clamp and ferrules) is more clearly visible on the bottom film for this modality. A summary of normalized delivered dose vs. target dose output by the linear accelerator (LINAC) is shown in Fig. 2d. The shaded regions between top and bottom films represent uncertainty in our calibration, corresponding to a maximum error of for electron therapy (at 10 Gy) and for photon therapy (at 2 Gy), ensuring that the delivered dose in the cavity vicinity is within a factor of two of the target value.
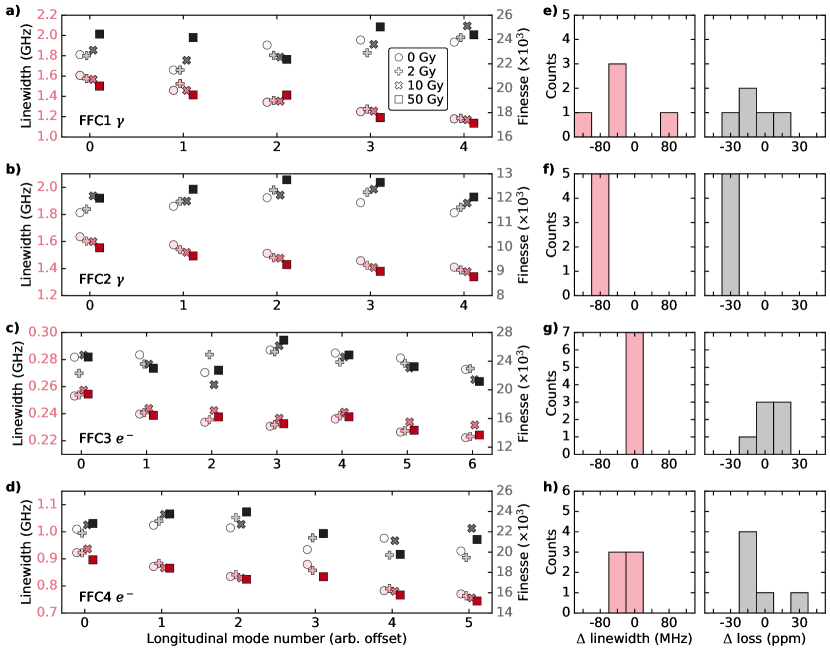
Figure 3a-d shows results for the four devices (FFC1-4; cavity lengths 5, 9, 27 and 8 m, respectively) before irradiation (0 Gy, light circles) and after each of the three tested doses (2, 10 and 50 Gy, from lighter to darker markers, respectively). Note that these labels indicate the target fractional dose of each irradiation, and the cumulative doses are 0, 2, 12, and 62 Gy, respectively. Devices FFC1-2 (Fig. 3a-b) are exposed to gamma rays, while devices FFC3-4 (Fig. 3c-d) are exposed to electrons. These quantities are measured for multiple adjacent (longitudinal) cavity modes, with each marker showing the average between acquisitions (statistical errors, i.e., the standard error on the mean, are within the marker size). The linewidth exhibits an overall downward trend with increasing cavity length (i.e., increasing mode number), as expected from the associated increase in round-trip time (which narrows resonances). Deviations from this trend (more visible in the nominally constant finesse) are attributed to mode-to-mode differences in alignment, transverse mode structure [28], and the resulting variations in the spatial distribution of the cavity mode on the (somewhat) non-uniform mirror coatings [31]. Figure 3e-h shows histograms of the total accumulated changes in cavity linewidth (red) and round-trip loss (grey) between the non-irradiated cavities (0 Gy data) and last conventional dose rate exposure (50 Gy data, 62 Gy total) for these cavity modes in each device. Importantly, we observe no consistent correlation between radiation dose and cavity linewidth for either photon or electron beam therapies. We attribute these overall variations to a combination of drifts in transverse cavity alignment (this changes which regions of the mirror surfaces participate in determining the finesse) and imperfect coupling to a single polarization mode of the cavity (coupling is maximized with the use of fiber paddles before the devices). These drifts place a systematic uncertainty on our ability to observe added losses of ppm.
4 Ultrahigh dose rate exposure
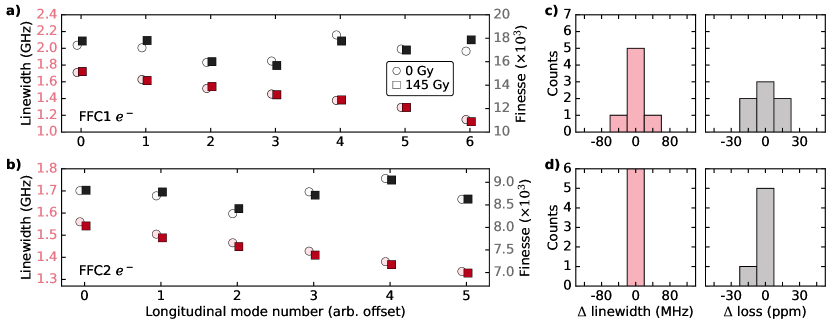
The radiation hardness of the fiber mirrors is further tested at ultrahigh dose rates similar to those of FLASH. A modified clinical LINAC [32] is used to irradiate FFC1 (now m) and FFC2 (now m) with 8 MeV electrons at Gy/s for s ( mGy/pulse at 200 Hz beam rate), resulting in a total absorbed dose of Gy. The delivered doses are estimated by a series of calorimetry measurements before and after irradiation, with a graphite calorimeter placed at the same source-to-field distance as the cavities. In this case, there is no need of a buildup medium since, for an 8 MeV electron beam, the dose absorbed on the surface of a water-equivalent medium is only less than the dose measured at a depth of mm (i.e., the approximate measurement depth of the calorimeter) [10]. The mass stopping power of silica is greater than graphite at this beam energy [33], so we can assume that the dose absorbed by the fiber mirrors agrees with that measured by the calorimeter to within a few percent.
Figure 4a-b shows the cavities’ linewidth (red) and finesse (grey) before (light circles) and after (dark squares) this final ultrahigh dose rate irradiation. Markers show the average between fits of acquisitions for each longitudinal mode (error bars again within the marker size). Histograms on the right (Fig. 4c-d) show the changes in linewidth (red) and total round-trip cavity losses (grey) over all measured resonances. Our results are consistent with no measurable mirror degradation from ultrahigh dose rate exposure to within 20 ppm. Note the reduced drift here likely arises from the shorter (few days) time scale between pre- and post-irradiation measurements (the time scale for the 0-50 Gy sequence in Sec. 3 was weeks).
These ultrahigh dose rate tests are performed on the same FFC1 and FFC2 devices as in Section 3 after the clinical dose rate tests. In between these two tests, the cavities were additionally irradiated with Gy at a rate of Gy/s. However, due to a mechanical malfunction, the cavity lengths changed such that the modes in Sections 3 and 4 are different, and so no conclusive data could be gleaned from this intermediate test. Nevertheless, we still observe high-finesse (up to nearly 20,000) after the cavities have been exposed to a total accumulated dose of 307 Gy.
5 Conclusion
In summary, we have demonstrated the radiation hardness of an open Fabry-Pérot microcavity suitable for future use in radiation oncology. The high-finesse dielectric mirrors studied here maintained low losses over a full range of clinically relevant irradiation conditions, including conventional therapies and FLASH-type exposure. Limited by systematic drifts in our apparatus, we observed changes in loss below ppm after 62 Gy delivered at conventional rates, and below ppm after 145 Gy at FLASH-level rates.
As mentioned, these drifts happen on a timescale of days to weeks, while the real-time absorption transients associated with hydrated electrons last microseconds. Due to the separation of time scales, the uncertainties reported here will not play a role in limiting the sensitivity of our envisioned dosimeter.
The compact footprint and high-sensitivity afforded by microcavity devices will open the door for high-precision, in-situ, tissue-equivalent, real-time dosimetry for radiation-based cancer treatments. Moreover, these mirror coatings should be suitable for sensing in other radiation-intensive environments, including space, nuclear, and/or defense scenarios.
Funding
Acknowledgments We thank Rigel Zifkin and Jiaxing Ma for fruitful discussions. FCRM acknowledges support from a Fonds de Recherche du Québec – Nature et Technologies (FRQNT) B2 scholarship (dossier #2022-2023 - B2X - 319595). EJ acknowledges support from a Natural Sciences and Engineering Research Council of Canada (NSERC) postdoctoral fellowship (PDF-558200-2021). LC acknowledges support from the National Science and Engineering Research Council of Canada (NSERC, grant # RGPIN 435554-2013, RGPIN-2020-04095), the Canada Research Chairs (grant # 950-229003 and 950-231949), Canada Foundation for Innovation (Innovation Fund 2015 Project # 33488 and LOF/CRC 229003). JCS acknowledges support from the Natural Sciences and Engineering Research Council of Canada (NSERC RGPIN 2018-05635), Canada Research Chairs (CRC 235060), Canadian foundation for Innovation (CFI 228130, 36423), Institut Transdisciplinaire d’Information Quantique (INTRIQ), and the Centre for the Physics of Materials (CPM) at McGill.
Disclosures The authors declare no conflicts of interest.
Data Availability Statement The data presented here will be made available on the McGill Dataverse found at https://borealisdata.ca/dataverse/mcgill .
References
- [1] W. R. Hendee, G. S. Ibbott, and E. G. Hendee, Radiation therapy physics (John Wiley & Sons, 2013).
- [2] W. D. Newhauser and R. Zhang, “The physics of proton therapy,” \JournalTitlePhysics in Medicine & Biology 60, R155 (2015).
- [3] B. Mijnheer, S. Beddar, J. Izewska, and C. Reft, “In vivo dosimetry in external beam radiotherapy,” \JournalTitleMedical Physics 40, 070903 (2013).
- [4] K. R. Hogstrom and P. R. Almond, “Review of electron beam therapy physics,” \JournalTitlePhysics in Medicine & Biology 51, R455 (2006).
- [5] M. R. Ashraf, M. Rahman, R. Zhang, et al., “Dosimetry for FLASH radiotherapy: a review of tools and the role of radioluminescence and Cherenkov emission,” \JournalTitleFrontiers in Physics 8, 328 (2020).
- [6] O. Holmberg and M. Pinak, “How often does it happen? A review of unintended, unnecessary and unavoidable high-dose radiation exposures,” \JournalTitleJournal of Radiological Protection (2021).
- [7] V. Favaudon, L. Caplier, V. Monceau, et al., “Ultrahigh dose-rate FLASH irradiation increases the differential response between normal and tumor tissue in mice,” \JournalTitleScience Translational Medicine 6, 245ra93–245ra93 (2014).
- [8] J. Bourhis, W. J. Sozzi, P. G. Jorge, et al., “Treatment of a first patient with FLASH-radiotherapy,” \JournalTitleRadiotherapy and Oncology 139, 18–22 (2019).
- [9] M.-C. Vozenin, J. H. Hendry, and C. L. Limoli, “Biological benefits of ultra-high dose rate FLASH radiotherapy: sleeping beauty awoken,” \JournalTitleClinical Oncology 31, 407–415 (2019).
- [10] E. B. Podgorsak et al., Radiation Oncology Physics (IAEA Vienna, 2005).
- [11] G. Azangwe, P. Grochowska, D. Georg, et al., “Detector to detector corrections: a comprehensive experimental study of detector specific correction factors for beam output measurements for small radiotherapy beams,” \JournalTitleMedical Physics 41, 072103 (2014).
- [12] J. Daniel, Y. A. Yousif, J. Zifodya, and R. Hill, “An evaluation of solid state detectors for the relative dosimetry of kilovoltage X-ray beams,” \JournalTitleMedical Physics 49, 4082–4091 (2022).
- [13] S. Devic, N. Tomic, and D. Lewis, “Reference radiochromic film dosimetry: review of technical aspects,” \JournalTitlePhysica Medica 32, 541–556 (2016).
- [14] O. Rampado, E. Garelli, S. Deagostini, and R. Ropolo, “Dose and energy dependence of response of Gafchromic® XR-QA film for kilovoltage x-ray beams,” \JournalTitlePhysics in Medicine & Biology 51, 2871 (2006).
- [15] M. Martišíková, B. Ackermann, and O. Jäkel, “Analysis of uncertainties in Gafchromic® EBT film dosimetry of photon beams,” \JournalTitlePhysics in Medicine & Biology 53, 7013 (2008).
- [16] N. Suchowerska, P. Hoban, M. Butson, et al., “Directional dependence in film dosimetry: radiographic and radiochromic film,” \JournalTitlePhysics in Medicine & Biology 46, 1391 (2001).
- [17] D. Hunger, T. Steinmetz, Y. Colombe, et al., “A fiber Fabry–Perot cavity with high finesse,” \JournalTitleNew Journal of Physics 12, 065038 (2010).
- [18] G. Stein, “Some aspects of the radiation chemistry of organic solutes,” \JournalTitleDiscussions of the Faraday Society 12, 227–234 (1952).
- [19] E. J. Hart, E. Fielden, and S. Belmont, The hydrated electron dosimeter (Marcel Dekker: New York, 1970).
- [20] E. J. Hart, B. D. Michael, and K. H. Schmidt, “Absorption spectrum of e in the temperature range -4 to 390 deg.” \JournalTitleThe Journal of Physical Chemistry 75, 2798–2805 (1971).
- [21] L. Turi and P. J. Rossky, “Theoretical studies of spectroscopy and dynamics of hydrated electrons,” \JournalTitleChemical Reviews 112, 5641–5674 (2012).
- [22] V. Svoboda, R. Michiels, A. C. LaForge, et al., “Real-time observation of water radiolysis and hydrated electron formation induced by extreme-ultraviolet pulses,” \JournalTitleScience Advances 6, eaaz0385 (2020).
- [23] J. Mégrourèche, H. Bekerat, J. Bian, et al., “Development of a hydrated electron dosimeter for radiotherapy applications: a proof of concept,” \JournalTitleMedical Physics 50, 7245–7251 (2023).
- [24] E. J. Hart and J. Boag, “Absorption spectrum of the hydrated electron in water and in aqueous solutions,” \JournalTitleJournal of the American Chemical Society 84, 4090–4095 (1962).
- [25] S. Girard, A. Morana, A. Ladaci, et al., “Recent advances in radiation-hardened fiber-based technologies for space applications,” \JournalTitleJournal of Optics 20, 093001 (2018).
- [26] E. Janitz, M. Ruf, M. Dimock, et al., “Fabry-Perot microcavity for diamond-based photonics,” \JournalTitlePhysical Review A 92, 043844 (2015).
- [27] D. J. Segelstein, “The complex refractive index of water,” Ph.D. thesis, University of Missouri–Kansas City (1981).
- [28] J. Benedikter, T. Hümmer, M. Mader, et al., “Transverse-mode coupling and diffraction loss in tunable Fabry–Pérot microcavities,” \JournalTitleNew Journal of Physics 17, 053051 (2015).
- [29] J. F. Ziegler, M. D. Ziegler, and J. P. Biersack, “SRIM – the stopping and range of ions in matter (2010),” \JournalTitleNuclear Instruments and Methods in Physics Research Section B: Beam Interactions with Materials and Atoms 268, 1818–1823 (2010).
- [30] S. Devic, J. Seuntjens, E. Sham, et al., “Precise radiochromic film dosimetry using a flat-bed document scanner,” \JournalTitleMedical Physics 32, 2245–2253 (2005).
- [31] M. Mader, J. Reichel, T. W. Hänsch, and D. Hunger, “A scanning cavity microscope,” \JournalTitleNature Communications 6, 7249 (2015).
- [32] M. Snyder, J. Vadas, J. Musselwhite, et al., “Technical Note: FLASH radiotherapy monitor chamber signal conditioning,” \JournalTitleMedical Physics 48, 791–795 (2021).
- [33] M. Berger, J. Coursey, M. Zucker, and J. Chang, “Stopping-power and range tables for electrons, protons, and helium ions, NIST Standard Reference Database 124,” \JournalTitleNational Institute of Standards and Technology (NIST), Physical Measurement Laboratory (PML) (Updated 2017).