Correlations of event activity with hard and soft processes in p+Au collisions at at STAR
Abstract
With the STAR experiment at RHIC, we characterize +Au collisions by event activity (EA) measured within the pseudorapidity range in the Au-going direction and report correlations between this EA and hard- and soft-scale particle production at mid-rapidity (). At the soft scale, charged particle production in low-EA +Au collisions is comparable to that in collisions and increases monotonically with increasing EA. At the hard scale, we report measurements of high transverse momentum () jets in events of different EAs. In contrast to the soft particle production, high- particle production and EA are found to be inversely related. To investigate whether this is a signal of jet quenching in high-EA events, we also report ratios of imbalance and azimuthal separation of dijets in high- and low-EA events. Within our measurement precision, no significant differences are observed, disfavoring the presence of jet quenching in the highest 30% EA +Au collisions at .
pacs:
25.75.-q, 25.75.NqI Introduction
Jets are algorithmically clustered groups of nearly collinear particles originating from showering and hadronization of highly-energetic partons, and therefore can serve as their proxies. These partons are predominantly produced at the beginning of a heavy-ion (A+A) collision and may subsequently interact with the evolving medium generated in the collision. Specifically, in collisions with sufficiently high event activity (EA) – usually quantified by particle multiplicity or energy deposition within limited phase space – a quark-gluon plasma (QGP) is expected to form and in turn quench jets through collisional and radiative energy losses [1]. The resulting suppression of jet production rate in high-EA A+A collisions compared to that in collisions was a strong early indication of QGP formation [2] and continues to be a principle means for studying QGP physics [3, 4, 5]. Jet quenching can be quantified by the nuclear modification factor, : the ratio of the jet yield per pair of colliding nucleons in A+A collisions to that in collisions. Traditionally, jet measurements in collisions of a heavy ion with a proton or deuteron (/+A), usually referred to as small system collisions, provide necessary references for by benchmarking the so-called cold nuclear matter (CNM) effects, i.e., effects related to the presence of a heavy nucleus in the collision but not to the creation of a QGP [6, 7, 2].
In this formulation, small system collisions are considered to be qualitatively different from high-EA A+A collisions and can be used as QGP-free benchmarks. However this clear qualitative difference has become more nuanced with the observation of long-range correlations in soft particle production in high-multiplicity collisions [8]; such correlations are conventionally interpreted as resulting from QGP flow in A+A collisions. That first observation in has motivated a broad and ongoing interest in studying small systems for QGP-like signals. The results have been fruitful, e.g., most flow-like signals have been observed in small system collisions, but have also raised new questions and motivated the search for evidence of jet quenching [9, 10, 11, 12, 13]. Concurrent theoretical calculations on possible formation of small-volume QGP allow for results ranging from modest [14] to significant [15] jet quenching, and therefore motivate the need for experimental exploration.
Several measurements of have been reported from +Pb collisions, where is the center-of-mass energy per nucleon-nucleon pair. When not selected for EA, the measurement is consistent with unity, i.e., no sign of jet suppression is observed [16, 17, 18, 19]. However, when selecting events by EA at the ATLAS experiment, the for high transverse momentum () jets is suppressed (enhanced) in high- (low-) EA events [16]. Tellingly, for central to -going rapidities, the spectrum modification can be parameterized by the total jet energy (, where is the jet rapidity). This is intriguing because jets are proxies for hard scattered partons; therefore, the jet energy scaled by can be used as the experimental approximation of of the scattered parton in the colliding proton, which is related to the parton momentum fraction . This interpretation is reinforced by a more recent measurement using +Pb collisions, in which dijets are used to further constrain the experimental estimate of , and demonstrate a similar correlation between EA and [20]. Proposed causes for an to EA correlation include energy conservation (e.g., as in the Angantyr implementation in PYTHIA8 [21]), fluctuation of the proton size [13], and color transparency between successive nucleon-nucleon collisions [22]. Such a correlation could bias centrality classification of small system collisions: high- (low-) collisions would have lower (higher) EA and therefore could be misclassified as a more peripheral (central) events. This would subsequently change the geometric scaling used to calculate centrality selected values of . It is of interest to note that measurements of bosons have also indicated a qualitatively similar selection bias in centrality selection for low-EA, i.e. peripheral, Pb+Pb events [23].
Subsequent to the first observation of the EA dependence of , two measurements in +Pb collisions were made by the ALICE experiment for jets up to around . The first measured inclusive jets with a modification to avoid possible centrality classification bias [24]. The second measurement was of jet spectra per high- hadron trigger (“h+jet”) [25], also referred to as a “semi-inclusive” measurement [26], not to be confused with the term in semi-inclusive deep inelastic scattering. (Note: this current publication uses the convention as in the ALICE measurement.) Because of the per-trigger scaling, the semi-inclusive jet spectra may be compared directly between different EA classes without applying any potentially biased geometric scaling. Neither measurement found any dependence of jet spectra on EA. The semi-inclusive measurement also reported a limit on out-of-cone energy transport which, if it is the only mechanism responsible for jet yield suppression in +A collisions, is inconsistent with the EA dependence of at high measured by the ATLAS experiment [25, 16].
On the other hand, a recent publication reports the suppression of the production of high- s relative to that of direct photons in the 5% highest EA +Au collisions at measured with the PHENIX detector [27]. The observed suppression is on the order of 20% and, as s may interact with a QGP while photons do not, may indicate a final state effect.
This publication complements those results by reporting the first semi-inclusive jet measurements reaching high- (up to ) at RHIC using +Au collisions at . We also compare dijet imbalance and azimuthal distributions in high- and low-EA events to search further for possible jet quenching signals.
II Experiment, Data, and Methodology
II.1 Event Selection
RHIC provided +Au collisions at in 2015. Minimum bias (MB) triggered events were collected by the STAR experiment based on the coincident signal in the Vertex Position Detectors (VPD) [28], located at both forward and backward pseudorapidities . Additionally, events with high-momentum-transfer (high-) scatterings were selected by an online requirement using the Barrel Electromagnetic Calorimeter (BEMC) [29], which has full azimuthal coverage at mid-rapidity, . Specifically, the online trigger selection requires at least one BEMC tower with transverse energy of at least . These events are designated in this publication as “high tower” (HT) events, and the leading tower energy as “”. In order to select high jet events desired for this study, the threshold for is raised to as an offline event selection. No additional criteria are added to discriminate between possible signal sources, whether photon, hadron, or otherwise.
STAR has two Zero Degree Calorimeters (ZDCs) located away on either side of the nominal interaction point [30]. ZDCs measure neutrons not participating directly in the collisions and the ZDC coincidence rate (ZDCx) measures the instantaneous luminosity accompanying the triggered collisions. Since the rate of pileup events, which occur slightly before or after the collisions of interest, increase with luminosity, this work only analyzes events with ZDCx less than .
Event vertex locations are determined from the projection of charged particle tracks in STAR’s Time Projection Chamber (TPC) gas volume [31]. Events with , the vertex position along the -axis parallel to the beam line, within of the center of the STAR detector are selected. Of those, any event with a greater than away from the vertex -position measured by the VPD is rejected. This is because the VPD is a fast detector, and therefore resilient to pileup collisions.
Using the above online and offline selections, this publication reports on measurements from 3.7 million MB and 135 million HT collisions.
II.2 Event Activity
STAR traditionally uses charged particle multiplicity at mid-rapidity to classify EA or centrality for Au+Au collisions [1]. However, in small system collisions, particle production from hard scatterings contribute a significant fraction to the total charged particle multiplicity, resulting in a localized auto-correlation between jet production and EA. A possible solution is to separate the acceptance of the EA measurement from that of the jets. One way to do this is to measure the underlying event (UE) “beneath” the hard scattering, i.e., charged particle density () transverse to the jet axis. Another way is to classify EA with particle production at large rapidities, well separated from mid-rapidity jets. The latter is the method employed in this publication by using STAR’s Beam-Beam Counters (BBCs).
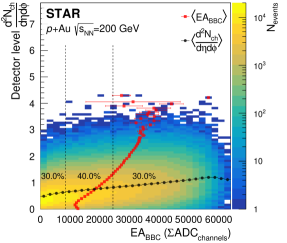
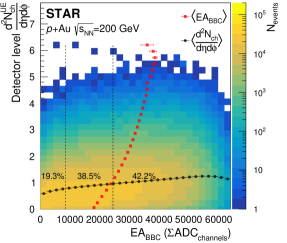
The BBCs are located from STAR’s nominal interaction point [32]. They each consist of annuli of hexagonal-shaped scintillating tiles with full azimuthal coverage in aggregate, receiving signals from the charged particle flux. This work utilizes the inner annuli of the BBC in the Au-going direction (), and quantifies EA as the sum of the ADC values from the response of those tiles (“”). This provides a wide rapidity gap between the EA acceptance and the jets measured at mid-rapidity (). The rapidity gap is large enough that at RHIC kinematics, when one jet is found at mid-rapidity, the recoiling jet of a dijet pair cannot reach the EA acceptance [33]. BBC signals in the Au-going direction are preferred to those in the -going direction because they have a greater range of measured EA.
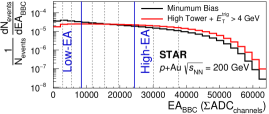
The distributions of EA for MB and HT events are given in Fig. 1. An event is classified as low- (high-) EA if its EA signal is smaller (larger) than the 30% (70%) decile of the EA distribution in MB events (as indicated by vertical solid lines in Fig. 1). HT events skew the EA toward higher values, such that about 19% (42%) of HT collisions are classified as low- (high-)EA. This is consistent with the correlation observed in A+A collisions: higher EA should correlate with more central events, which have more binary nucleon-nucleon collisions, and therefore higher probability of high- parton interactions.
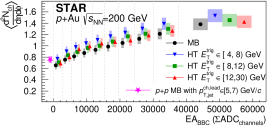
While the BBC was originally designed as a trigger detector [34], we experimentally justify using the BBC as an EA classifier by measuring correlations between and the charged particle density at mid-rapidity, as shown in Figs. 8 and 9 in the appendix. The charged particle density is measured using the full azimuthal range in MB events. In HT events, to avoid the localized auto-correlation introduced by the tracks in the triggering dijet pair, only the charged particle density azimuthally transverse to the trigger () is measured. While the correlation between EA and the UE track density is broad, it is on average positive and monotonic. Qualitatively, this correlation is similar to that observed for EAs measured at and using the ZDC [30] in +Au events [35].
II.3 Jets: Tracks and Towers
The TPC measures charged particle tracks and their kinematics via ionization in its gas volume. The TPC has full azimuthal coverage within . This analysis only uses tracks out to in order to match the BEMC acceptance. Only tracks with are analyzed, in order to avoid poor detection efficiency at low and poor resolution at high . All selected tracks are also required to have at least 20 TPC hits for their reconstruction, pass within of the primary vertex, and contain at least 52% of possible TPC hits along their trajectories.
The BEMC provides energy measurements for electromagnetically interacting particles within [29]. It overlaps the fiducial coverage of the TPC and has an angular granularity of about 0.05 in both and . The transverse energy () component of the calorimeter energy is determined from the tower location relative to the collision vertex via an inverse factor of . The tower limits match the track limits of . Of the 4800 calorimeter towers, 318 towers are excluded due to malfunction during data taking.
In each event, tracks and towers are clustered into jets using the anti- algorithm [36] with a resolution parameter . In order to limit boundary effects, only jets within are used. If a charged particle’s trajectory extrapolates to a tower, it is assumed that the track and the corresponding calorimeter energy (if any) result from the same particle. In order to avoid double counting that particle’s energy, its value is subtracted from the tower energy. Here the particle energy is calculated based on its momentum measured in the TPC and the assumption that it is a pion. Any tower with after subtraction is discarded. While this procedure, referred to as 100% hadronic correction, could potentially over-correct any double-counting, it results in better jet energy resolution and the potential over-correction is accounted for during unfolding [37].
II.4 Track and Jet Corrections
The TPC tracking efficiency is evaluated by simulating the STAR detector response to , , , and via GEANT3 [38]. These simulated signals are embedded into HT events to reflect realistic running conditions, and then reconstructed using the standard STAR framework. The embedded spectra are weighted according to measured particle yields in +Au collisions [39, 7] to obtain the tracking efficiency for the expected mixture of charged particles. It is worth noting that spectral abundances in +Au collisions have not been measured at STAR; therefore appropriately scaled spectra are used in their place [7].
Since the tracking efficiency begins to decrease when approaching the boundary of the TPC acceptance, the measurement of charged particle density is limited to . Within that range, the track reconstruction efficiency decreases from 76% to 66% from the lowest to the highest luminosity events. When this decrease in tracking efficiency is accounted for, the average number of tracks in the TPC increases by about 0.5 tracks in high luminosity events relative to low luminosity events. This increase in track density as a function of luminosity is attributed to the presence of residual pileup tracks which are subtracted from the final reported track densities.
Detector effects on jets are corrected using a similar embedding methodology. Dijet events, simulated with PYTHIA6 [40], are propagated through the GEANT3 simulation of the STAR detector before being embedded into MB events, from which tracks and towers are reconstructed and clustered into detector-level (“raw”) jets. Only events with a reconstructed leading-tower, i.e., the trigger tower, with are used. It is found in the simulations that the HT trigger efficiency is independent of EA at all jet momenta. Therefore, even though the trigger efficiency is not explicitly corrected for in this publication, its effect is expected to cancel in the ratios of jet quantities between high- and low-EA events.
Truth-level jets are clustered directly from the simulated PYTHIA6 events. The truth- and detector-level jets are matched geometrically in and by pairing jets with , preferentially matching the highest- jets if multiple candidates are found. The jet energy scale and resolution (JES and JER) are defined as the average difference in between matched truth- and detector-level jets, and the standard deviation of that difference distribution, respectively. The JES(JER) values range from for jets, to for jets. While JES and JER are not used directly in any correction, they can quantify the detector performance. It is worth noting that the JES is comparable for high- and low-EA events.
The measured jet spectra are corrected using the Bayesian unfolding procedure implemented in the RooUnfold package [41] with six iterations and PYTHIA6 distributions as the priors. The unfolding procedure uses a response matrix filled with matched truth- and detector-level jets to correct for the JES and JER. The additional effects of fake detector-level jets and missed truth-level jets are corrected for using the -dependent relative abundances of the unmatched jets remaining from the matching procedure.
II.5 Systematic Uncertainties for Tracks, Jets, and Towers
Systematic uncertainties in track density measurements include the following: 5% tracking efficiency uncertainty from imperfect detector simulation; an additional 2% tracking efficiency uncertainty accounting for correlations between luminosity and EA; a sub-percent uncertainty for the use of particle spectra in +Au (as opposed to +Au) collisions to weight embedding samples; a sub-percent uncertainty for the unfolding method (bin-by-bin vs 2D Bayesian unfolding); and pileup subtraction uncertainties. The pileup uncertainty, arising mostly from parameterizing the increase of the track density as a function of ZDCx after efficiency correction, ranges from 6-10% and dominates other sources. When adding all individual sources in quadrature, the overall track density uncertainty is 7-11%. The EA and trigger tower values are detector-level characterizations of each event, and are uncorrected quantities without any assigned systematic uncertainties.
Jets are corrected for detector efficiency, acceptance, and resolution with the unfolding procedure as discussed in Sec. II.4. Systematic uncertainties are evaluated by individually varying the response matrices, miss rates, and fake rates, and repeating the entire correction procedure to estimate the magnitude of the uncertainty. The tracking efficiency uncertainties are assessed by randomly removing reconstructed tracks according to the tracking uncertainty values. The tower energy scale uncertainty (3.8%) is applied by uniformly augmenting all tower energies. Collectively these uncertainties constitute 15-20% when added in quadrature, and are the dominant components of the jet spectrum systematic uncertainties. Varying the hadronic correction from 100%, as discussed in Section II.3, to 50% contributes about 2-4% relative uncertainty. The stability of the iterative Bayesian unfolding is quantified by the average difference in the unfolded results when the number of iterations used is varied by from the nominal value of 6. The shape of the prior distribution is reweighted to a distribution in HERWIG (from the default PYTHIA6 distribution), resulting in an uncertainty of about 10% in the first jet bin and from 0-5% in the remaining bins. Finally, over-estimation of the background by embedding PYTHIA6 events into MB +Au data contributes 1.6-2.8% uncertainty.
With the exception of the contribution from the additional 2% tracking efficiency uncertainty, the jet spectrum systematic uncertainties mostly cancel in the high-EA to low-EA ratios. The largest remaining uncertainties, resulting from the hadronic correction and embedding over-estimation, are between 1-2%. The resulting overall systematic uncertainties of the jet spectrum ratios are on the order of 3-9%.
II.6 Semi-Inclusive Jet Spectra
The semi-inclusive jet spectra are the spectra of jets in events with an offline trigger (i.e., a BEMC tower with ), normalized by the number of these triggered events: . Four different spectra are reported in Fig. 5: near- and recoil-side spectra in high- and low-EA events. Near- and recoil-side spectra are defined as jets within and , respectively. Note that most triggered events have no jets within the reported range, thus the integrals of the jet spectra are less than one. Additionally, the ratios of semi-inclusive spectra in high- and low-EA events are reported.
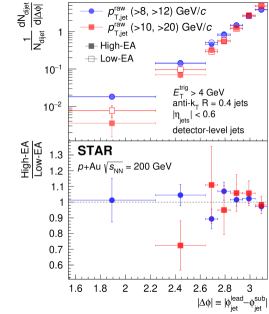
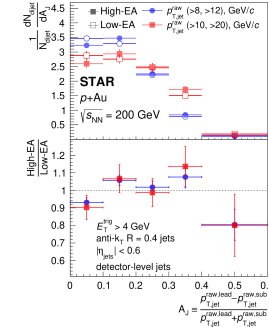
II.7 Dijet Azimuthal Separation () and Momentum Imbalance ()
The modification of dijet imbalance and relative azimuthal distribution have been proposed as methods to probe for jet quenching by the QGP in A+A collisions [42, 43, 44, 45, 46]. These are of particular interest because, to first order, the shapes of their distributions are independent of any EA-to- correlation. This is not true for the semi-inclusive analysis, where an EA-to- correlation would be manifested in the semi-inclusive jet spectra normalization. The distribution of the azimuthal separation between the leading and subleading jets () is reported for all dijets with . Additionally, the distribution of the imbalance is reported for all dijet pairs with , where and are the detector-level for leading and subleading jets of the dijet pair, respectively. All these distributions are normalized to unity for shape comparisons.
Because the JES and JER distributions are not discernibly different between high- and low-EA events, detector effects cancel when detector-level distributions are taken in ratio. This justifies the presentation of the detector-level dijet momentum imbalance and azimuthal separation ratios. However, the dijet ratios could also be biased from anything that affects the selection cuts for and , even if they do not significantly affect the JES and JER. Two possible such differences exist between the high-EA and low-EA events and are accounted for. First, high-EA events have modest increases in underlying event and pileup activity. Second, high-EA events have a higher mean ZDCx value which introduces a modest change in the tracking efficiency. To account for the first effect, the high- and low-EA collision events are divided into groups selected by ZDCx. Within each ZDCx selection, the average number and spectrum () of particles in excess in high-EA events are measured. Then each low-EA event is augmented with particles, whose multiplicity is drawn from a Poisson distribution with mean equal to and transverse momenta sampled from . Additionally, high-EA events are re-weighted to match the ZDCx distribution of the low-EA events. With these modifications, the high-EA and low-EA events are clustered, dijets are selected, and their detector-level distributions and ratios are reported.
II.8 Experimental Conditions Inherent in Results
It is worth noting several experimental conditions which are inherent in the reported results and should be kept in mind in any attempt to compare to theory. First, the EA definition is empirically justified, and therefore direct connection to actual particle densities in the BBC acceptance is not available. Additionally, the MB trigger and the tower trigger are not corrected for trigger biases.
III Results
III.1 Underlying Event
The fully-corrected UE charged particle densities are plotted in Fig. 2 for ten ranges of EA. The EA ranges are selected such that each contains a decile of the distribution in MB events. The HT-triggered events are separated by their values of into three groups.
The charged particle densities increase monotonically with increasing EA for both MB and HT events. The lowest values are consistent with the underlying event activity measured in collisions which contain low- () charged jets [47]. Herein, low-EA +Au collisions appear to be similar to collisions. In the highest EA events, the charged particle densities are around a factor of two higher than that in events. The figure shows that UE charged particle density scales with EA, and also hints that the underlying event may be anti-correlated with increasing trigger energy.
III.2 Event Activity vs. Leading Jet
Figure 3 reports the UE charged particle density differentially with respect to three variables:
-
1.
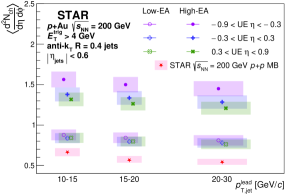
Leading jet : The trigger tower is required to be either within the leading jet or azimuthally recoiling from it (). Data are shown for events with in three ranges of leading jet : (10,15), (15,20), and (20,30) GeV/.
-
2.
High-EA and low-EA, as defined in Sec. II.2.
-
3.
Pseudorapidity of charged particles in the TPC:
-
•
Au-going,
-
•
mid-rapidity,
-
•
-going,
-
•
As expected from the asymmetry of the colliding nuclei, the UE is higher at Au-going rapidities. Figure 3 also confirms the correlation between UE charged particle density and EA expected from Fig. 2: events selected at high-EA (low-EA) have correspondingly higher (lower) mean densities for all values of jet . As is the case in Fig. 2, Fig. 3 also suggests that UE decreases with increasing jet .
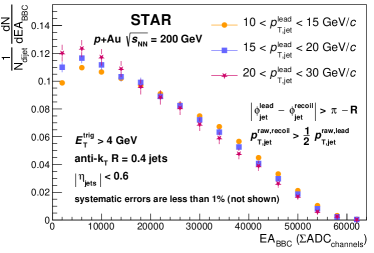
To explore the correlation between hard process and EA further, Fig. 4 presents the distributions of EA for three ranges of , as used in Fig. 3. As already noted, in collisions when one member of a dijet pair is measured in the TPC (), it is not kinematically accessible for the other jet to reach the BBC and therefore cause an anti-correlation. Nevertheless, to ensure this does not affect the measurement, the event selection for Fig. 4 requires both members of a dijet pair to be found fully within the TPC acceptance. This is done using the two highest- detector-level jets ( and ) and requiring that: , , and . Within these events, there is a statistically significant drop of mean EA with increasing : , and , respectively, presenting a clear anti-correlation between EA measured in the BBC and the average momentum transfer of a hard scattering at mid-rapidity.
III.3 Semi-Inclusive Jet Spectra
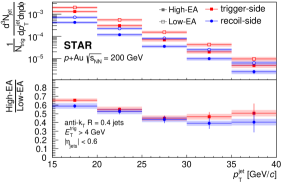
Figure 5 reports the first fully-corrected semi-inclusive jet spectra in small system collisions at RHIC. The top panel is the jet spectra per trigger, counting only jets azimuthally within of the triggering tower for trigger-side jets, while recoil-side jets are required to be azimuthally within of the direction opposite the trigger tower. The spectrum of the recoiling jets has significantly fewer counts per trigger relative to that of the trigger-side jets due to a large fraction of recoiling jets falling outside of the detector’s acceptance () [33]. As shown in the bottom panel, both spectra are distinctly suppressed in high-EA events relative to low-EA events. Notably, the suppression for both trigger- and recoil-side jets is comparable. This is qualitatively different than jet-spectrum suppression attributed to jet quenching in the QGP [48]; there, the QGP causes a selection bias and resulting path-length difference which suppresses the recoil-side jets more than the trigger-side jets.
If the anti-correlation between EA and jet , as shown in Fig. 3, is monotonic then the inverse is also trivially true: the mean jet would also decrease with increasing EA. In other words, the distribution softens from low- to high-EA events. On the other hand, the semi-inclusive jet spectra are normalized by the number of triggers, which have a lower cut off and therefore would not be modified by an EA-to- correlation at the same level as the jets. Consequently, an apparent suppression of the semi-inclusive jet spectrum in high-EA events compared to low-EA events could occur without any jet quenching. Furthermore, if the EA-to- correlation is the sole cause, the suppression levels for trigger- and recoil-side jet spectra would be the same, as is the case in Fig. 5.
III.4 Dijet Azimuthal Difference and Momentum Imbalance Distributions
As previously mentioned, the EA-dependence of semi-inclusive jet spectra shown in Fig. 5 does not prove that the dependence results from jet quenching in high-EA events. In order to isolate a query for EA-dependent jet modification from the EA dependence of the distribution, Figs. 6 and 7 present the detector-level per-dijet pair distributions of the dijet azimuthal difference () and momentum imbalance () in high- and low-EA events. Because their normalization is per dijet, to first order the and distributions avoid dependence on the underlying or distributions.
Dijets are selected according to the following criteria:
-
1.
-
2.
Two different sets of thresholds for and :
-
•
() 12 (8)
-
•
() 20 (10)
-
•
-
3.
Relative azimuth cut:
-
•
For azimuthal difference:
-
•
For momentum imbalance:
-
•
While the measurements of and are not corrected for detector effects and therefore not accessible to direct theoretical comparison, the detector effects cancel in the ratios between high- and low-EA events, which therefore can indicate the presence of jet quenching, if any. As shown in Fig. 6, there is no significant broadening of for high-EA events relative to low-EA events, indicating that the leading and subleading jets retain their initial back-to-back configuration. Similarly, the dijet momentum imbalance distribution presented in Fig. 7 shows no significant modification in high-EA events.
IV Summary and Conclusion
UE charged particle density is reported as a function of , , , and EA for +Au collisions at . EA, measured at in the BBC, and charged particle densities are positively correlated with a broad distribution, suggesting that EA measures event centrality with large fluctuations. At the lowest EA, the UE charged particle density is consistent with that in collisions, and increases by about a factor of two in the highest EA events.
There is a statistically significant decrease in average EA with increasing (). Due to the large rapidity gap between the leading jet axis and the BBC, this anti-correlation must form at the initial stages of the collisions due to phase-space constraints between EA and (or ) of the hard scattering.
The anti-correlation between EA and suggests there would be an apparent suppression of high- jet spectra at high-EA and independent of its physical cause when normalized by the number of triggers with a low threshold. This is demonstrated with the first measurements of semi-inclusive jet spectra for GeV/ and in +A collisions at RHIC. It is also notable that the suppression is similar for both the trigger- and recoil-side spectra; this would be expected if the suppression results from an -to-EA bias, but might not be if resulting from path-length dependent jet quenching.
Finally, distributions of dijet azimuthal correlation and imbalance are reported, along with their ratios between high- and low-EA events. Because these distributions are normalized per dijet pair, they are to first order independent of any EA-to- anti-correlation. Neither measurement shows significant EA dependence within uncertainties, indicating no sign of jet quenching in the high-EA +Au collisions in this analysis. It should be noted that this result is for the top 30% of EA events, and therefore does not directly compare to the top 5% of EA events in +Au collisions for which high- production is reported to be suppressed relative to photon production [27].
Since the correlation between EA and jet production must stem from the earliest stages of the collisions [49], +Au collisions can serve as a potential probe for early-time dynamics or even the pre-collision configuration of the and/or gold nucleus. These are promising opportunities for measurements with +Au collisions that RHIC will provide in the near future, benefiting from the recently installed Event Plane Detector [50] for better EA determination at large rapidity.
ACKNOWLEDGMENTS
We thank the RHIC Operations Group and RCF at BNL, the NERSC Center at LBNL, and the Open Science Grid consortium for providing resources and support. This work was supported in part by the Office of Nuclear Physics within the U.S. DOE Office of Science, the U.S. National Science Foundation, National Natural Science Foundation of China, Chinese Academy of Science, the Ministry of Science and Technology of China and the Chinese Ministry of Education, the Higher Education Sprout Project by Ministry of Education at NCKU, the National Research Foundation of Korea, Czech Science Foundation and Ministry of Education, Youth and Sports of the Czech Republic, Hungarian National Research, Development and Innovation Office, New National Excellency Programme of the Hungarian Ministry of Human Capacities, Department of Atomic Energy and Department of Science and Technology of the Government of India, the National Science Centre and WUT ID-UB of Poland, the Ministry of Science, Education and Sports of the Republic of Croatia, German Bundesministerium für Bildung, Wissenschaft, Forschung and Technologie (BMBF), Helmholtz Association, Ministry of Education, Culture, Sports, Science, and Technology (MEXT), Japan Society for the Promotion of Science (JSPS) and Agencia Nacional de Investigación y Desarrollo (ANID) of Chile.
Appendix A Comparison of BBC Signal to Track Densities
The relationship between EA and uncorrected charged track density is given in Fig. 8 for MB events and Fig. 9 for HT triggered events with an offline cut of . The mean values of the track densities at each EA selection, and conversely EA at each track density selection, are also plotted. The statistical errors on the means are shown but are smaller than the marker size except in the tails of the distributions. The percentages of events within three ranges of EA are also plotted in Figs. 8 and 9; the lowest and highest 30% in the MB sample define the ranges of low- and high-EA, respectively (see Sec. II.2).
References
- Miller et al. [2007] M. L. Miller, K. Reygers, S. J. Sanders, and P. Steinberg, Ann. Rev. Nucl. Part. Sci. 57, 205 (2007), arXiv:nucl-ex/0701025 .
- Adams et al. [2003] J. Adams et al. (STAR), Phys. Rev. Lett. 91, 072304 (2003), arXiv:nucl-ex/0306024 [nucl-ex] .
- Adams et al. [2005] J. Adams et al. (STAR), Nucl. Phys. A 757, 102 (2005), arXiv:nucl-ex/0501009 .
- Aamodt et al. [2011] K. Aamodt et al. (ALICE), Phys. Lett. B 696, 30 (2011), arXiv:1012.1004 [nucl-ex] .
- Chatrchyan et al. [2012] S. Chatrchyan et al. (CMS), Eur. Phys. J. C 72, 1945 (2012), arXiv:1202.2554 [nucl-ex] .
- Abelev et al. [2007a] B. I. Abelev et al. (STAR) (2007) arXiv:nucl-ex/0703016 .
- Adams et al. [2006] J. Adams et al. (STAR), Phys. Lett. B 637, 161 (2006), arXiv:nucl-ex/0601033 .
- Khachatryan et al. [2010] V. Khachatryan et al. (CMS), Journal of High Energy Physics 2010, 10.1007/jhep09(2010)091 (2010).
- Nagle and Zajc [2018] J. L. Nagle and W. A. Zajc, Ann. Rev. Nucl. Part. Sci. 68, 211 (2018), arXiv:1801.03477 [nucl-ex] .
- Stankus [2016] P. Stankus, Nucl. Phys. A 956, 192 (2016).
- Loizides [2016] C. Loizides, Nucl. Phys. A 956, 200 (2016).
- Ohlson [2017] A. Ohlson, Proceedings, 26th International Conference on Ultra-relativistic Nucleus-Nucleus Collisions (Quark Matter 2017): Chicago, Illinois, USA, February 5-11, 2017, Nucl. Phys. A967, 97 (2017), arXiv:1901.00710 [nucl-ex] .
- McGlinchey et al. [2016] D. McGlinchey, J. L. Nagle, and D. V. Perepelitsa, Phys. Rev. C 94, 024915 (2016), arXiv:1603.06607 [nucl-th] .
- Tywoniuk [2014] K. Tywoniuk, Nucl. Phys. A 926, 85 (2014).
- Zakharov [2014] B. G. Zakharov, J. Phys. G 41, 075008 (2014), arXiv:1311.1159 [hep-ph] .
- Aad et al. [2015] G. Aad et al. (ATLAS), Phys. Lett. B748, 392 (2015), arXiv:1412.4092 [hep-ex] .
- Khachatryan et al. [2016] V. Khachatryan et al. (CMS), Eur. Phys. J. C76, 372 (2016), arXiv:1601.02001 [nucl-ex] .
- Adam et al. [2015] J. Adam et al. (ALICE), Phys. Lett. B749, 68 (2015), arXiv:1503.00681 [nucl-ex] .
- Adare et al. [2016] A. Adare et al. (PHENIX), Phys. Rev. Lett. 116, 122301 (2016), arXiv:1509.04657 [nucl-ex] .
- Aad et al. [2023] G. Aad et al. (ATLAS), Measurement of the centrality dependence of the dijet yield in +Pb collisions at = 8.16 TeV with the ATLAS detector (2023), arXiv:2309.00033 [nucl-ex] .
- Bierlich et al. [2018] C. Bierlich, G. Gustafson, L. Lönnblad, and H. Shah, Journal of High Energy Physics 2018, 10.1007/jhep10(2018)134 (2018).
- Kordell and Majumder [2018] M. Kordell and A. Majumder, Phys. Rev. C 97, 054904 (2018), arXiv:1601.02595 [nucl-th] .
- Sirunyan et al. [2021] A. M. Sirunyan et al. (CMS), Phys. Rev. Lett. 127, 102002 (2021), arXiv:2103.14089 [hep-ex] .
- Adam et al. [2016] J. Adam et al. (ALICE), Eur. Phys. J. C 76, 271 (2016), arXiv:1603.03402 [nucl-ex] .
- Acharya et al. [2018] S. Acharya et al. (ALICE), Phys. Lett. B 783, 95 (2018), arXiv:1712.05603 [nucl-ex] .
- Adamczyk et al. [2017a] L. Adamczyk et al. (STAR), Phys. Rev. C 96, 024905 (2017a), arXiv:1702.01108 [nucl-ex] .
- Abdulameer et al. [2023] N. J. Abdulameer et al. (PHENIX), Disentangling centrality bias and final-state effects in the production of high- using direct in Au collisions at GeV (2023), arXiv:2303.12899 [nucl-ex] .
- Reed et al. [2010] R. Reed, J. Balewski, L. S. Barnby, A. Ogawa, J. Lauret, and M. van Leeuwen, J. Phys. Conf. Ser. 219, 032020 (2010).
- Beddo et al. [2003] M. Beddo et al. (STAR), Nucl. Instrum. Meth. A 499, 725 (2003).
- Xu et al. [2016] Y.-F. Xu, J.-H. Chen, Y.-G. Ma, A.-H. Tang, Z.-B. Xu, and Y.-H. Zhu, Nucl. Sci. Tech. 27, 126 (2016).
- Anderson et al. [2003] M. Anderson et al., Nucl. Instrum. Meth. A 499, 659 (2003), arXiv:nucl-ex/0301015 .
- Whitten [2008] C. A. Whitten (STAR), AIP Conf. Proc. 980, 390 (2008).
- Adam et al. [2018] J. Adam et al. (STAR), Phys. Rev. D 98, 032011 (2018), arXiv:1805.09742 [hep-ex] .
- Judd et al. [2018] E. G. Judd et al., Nucl. Instrum. Meth. A 902, 228 (2018).
- Adamczyk et al. [2015a] L. Adamczyk et al. (STAR), Phys. Lett. B 743, 333 (2015a), arXiv:1412.8437 [nucl-ex] .
- Cacciari et al. [2008] M. Cacciari, G. P. Salam, and G. Soyez, Journal of High Energy Physics 2008, 063 (2008).
- Adamczyk et al. [2015b] L. Adamczyk et al. (STAR), Phys. Rev. Lett. 115, 092002 (2015b), arXiv:1405.5134 [hep-ex] .
- Brun et al. [1994] R. Brun, F. Bruyant, F. Carminati, S. Giani, M. Maire, A. McPherson, G. Patrick, and L. Urban, GEANT Detector Description and Simulation Tool (1994).
- Abelev et al. [2007b] B. I. Abelev et al. (STAR), Phys. Rev. C 75, 064901 (2007b), arXiv:nucl-ex/0607033 .
- Sjöstrand et al. [2006] T. Sjöstrand, S. Mrenna, and P. Skands, JHEP 2006 (05).
- Adye [2011] T. Adye, in PHYSTAT 2011 (CERN, Geneva, 2011) pp. 313–318, arXiv:1105.1160 [physics.data-an] .
- Adamczyk et al. [2017b] L. Adamczyk et al. (STAR), Phys. Rev. Lett. 119, 062301 (2017b), arXiv:1609.03878 [nucl-ex] .
- Chatrchyan et al. [2011] S. Chatrchyan et al. (CMS), Phys. Rev. C 84, 024906 (2011), arXiv:1102.1957 [nucl-ex] .
- Aad et al. [2010] G. Aad et al. (ATLAS), Phys. Rev. Lett. 105, 252303 (2010), arXiv:1011.6182 [hep-ex] .
- D’Eramo et al. [2019] F. D’Eramo, K. Rajagopal, and Y. Yin, J. High Energ. Phys. 2019 (1), 172.
- Mueller et al. [2016] A. H. Mueller, B. Wu, B.-W. Xiao, and F. Yuan, Phys. Lett. B 763, 208 (2016), arXiv:1604.04250 [hep-ph] .
- Adam et al. [2020] J. Adam et al. (STAR), Phys. Rev. D 101, 052004 (2020), arXiv:1912.08187 [nucl-ex] .
- Adamczyk et al. [2013] L. Adamczyk et al. (STAR), Phys. Rev. C 87, 044903 (2013), arXiv:1212.1653 [nucl-ex] .
- Dumitru et al. [2008] A. Dumitru, F. Gelis, L. McLerran, and R. Venugopalan, Nucl. Phys. A 810, 91 (2008), arXiv:0804.3858 [hep-ph] .
- Adams et al. [2020] J. Adams et al., Nucl. Instrum. Meth. A 968, 163970 (2020), arXiv:1912.05243 [physics.ins-det] .