An Iterative Refinement Approach for the
Rolling Stock Rotation Problem with
Predictive Maintenance
![[Uncaptioned image]](/html/2404.08367/assets/x1.png) 0000-0001-9401-3707 and Ralf Borndörfer222
0000-0001-9401-3707 and Ralf Borndörfer222![[Uncaptioned image]](/html/2404.08367/assets/x2.png) 0000-0001-7223-9174
Zuse Institute Berlin
Takustr. 7, 14195 Berlin, Germany
prause@zib.de, borndoerfer@zib.de
0000-0001-7223-9174
Zuse Institute Berlin
Takustr. 7, 14195 Berlin, Germany
prause@zib.de, borndoerfer@zib.de
Abstract
The rolling stock rotation problem with predictive maintenance (RSRP-PdM) involves the assignment of trips to a fleet of vehicles with integrated maintenance scheduling based on the predicted failure probability of the vehicles. These probabilities are determined by the health states of the vehicles, which are considered to be random variables distributed by a parameterized family of probability distribution functions. During the operation of the trips, the corresponding parameters get updated. In this article, we present a dual solution approach for RSRP-PdM and generalize a linear programming based lower bound for this problem to families of probability distribution functions with more than one parameter. For this purpose, we define a rounding function that allows for a consistent underestimation of the parameters and model the problem by a state-expanded event-graph in which the possible states are restricted to a discrete set. This induces a flow problem that is solved by an integer linear program. We show that the iterative refinement of the underlying discretization leads to solutions that converge from below to an optimal solution of the original instance. Thus, the linear relaxation of the considered integer linear program results in a lower bound for RSRP-PdM. Finally, we report on the results of computational experiments conducted on a library of test instances.
Keywords:
Rolling Stock Rotation Planning, Iterative Refinement Approach, State-Expanded Event-Graph, Integer linear Programming, Lower Bound
1 Introduction
The current advances in machine learning and the associated ability to efficiently analyze large volumes of data, combined with the inexpensive availability of sensors, enable the effective monitoring of the health conditions of mechanical components. This allows predictive maintenance to be established as a regime for maintenance scheduling in the rail sector. Predictive maintenance is one of the four maintenance systems that exist in the literature, alongside corrective, preventive, and condition-based maintenance. Corrective and preventive maintenance are the two most obvious techniques, where a component is maintained whenever a fault occurs or when a certain time or distance mileage is reached. Condition-based and predictive maintenance, on the other hand, rely on estimating the health state of the respective component. This is usually done by evaluating sensor measurements using statistical methods or machine learning techniques. In condition-based maintenance, components are serviced when the estimated health state exceeds a predefined threshold, whereas in predictive maintenance, the remaining useful life (RUL) or future health states of the component are predicted and maintenance is scheduled just before the estimated occurrence of a fault. For an overview of these different maintenance systems, we refer to wang2007selection . It is evident that predictive maintenance is the most economical and environmentally friendly of these regimes, see for example arena2021predictive , since the components are maintained before failure and the remaining useful life is completely utilized so that no unnecessary replacement actions are carried out.
Unfortunately, health states can only be observed indirectly and must therefore be estimated from sensor measurements. Errors arising from these measurements and the subsequent estimation lead to the fact that the determined health states must be regarded as uncertain. This uncertainty is then further increased by projecting the states into the future under uncertain operating conditions, so that both the health states themselves and their predictions must be considered as random variables. Thus, if we want to incorporate predictive maintenance into the planning of rolling stock rotations, we need to develop approaches that are capable of optimizing the rotations based on these uncertain circumstances, see bougacha2020contribution .
1.1 Related Work
The rolling stock rotation problem (RSRP) with integrated maintenance scheduling is a topic that has already been investigated in the literature. An overview can be found in reuther2018optimization . The authors claim that there is no standard way to address maintenance constraints for RSRP and refer to reuther2017mathematical for examples. The considered maintenance regime is typically distant- or time-dependent preventive maintenance, and the problem is usually modeled by event-based graphs. These graphs are also called space-time graphs and give rise to solution approaches based on mixed-integer programs (MIP) that determine flows within these graphs. These MIP formulations are then solved using either branch-and-price or column generation, e.g., borndorfer2014coarse ; giacco2014rolling ; andres2015maintenance ; borndorfer2016integrated ; lusby2017branch ; gao2022weekly . Furthermore, also heuristics are used to solve RSRP, see for example cacchiani2010solving ; thorlacius2015integrated . For a comparison of the various considered maintenance regimes, constraints, and solution approaches, we refer to prause2024approximating which extends the overview of schlechte2023bouquet . In the considered preventive maintenance, service tasks are scheduled when a certain threshold for the traveled distance or the elapsed time is reached. Thus, the present degradation behavior is linear. In all of these approaches, maintenance is incorporated into the model either through the usage of depot-to-depot paths or through the utilization of resource-constrained paths.
Next, we consider literature on the RSRP with predictive maintenance (RSRP-PdM). In herr2017predictive , the maintenance of the vehicles is scheduled based on their health states, which represent the RUL and are considered to be point-estimates. Here, the maximal degradation level is capped by a threshold and a linear degradation behavior is assumed. The trips are combined into predefined tours that are assigned to the vehicles and after which maintenance services can be carried out. They apply a MIP formulation to solve the problem, where the objective aims at maximizing the degradation of each vehicle before maintenance. This approach is extended by herr2017joint by supposing that the trips are no longer grouped into fixed tours, but it is assumed that the vehicles can be maintained at every station. Their aim is to maximize the minimum deterioration level of all vehicles before maintenance. In wu2019train , the vehicles have to be assigned to paths consisting of fixed tasks of the timetable. This article shows the economic impact of predictive maintenance on commuter trains in Taiwan. The authors give a MIP formulation that minimizes the expected failure costs of the vehicles and use a two-parameter Weibull distribution to model the reliability of the rolling stock. The authors of rokhforoz2021hierarchical assume the RUL to be a random variable, since point-estimates do not capture its uncertainty. They use normal distributions to depict this uncertainty and present a short-term approach that can be applied whenever a fault is detected during operation. In their approach, they use an exponential penalty function to enforce maintenance and employ a MIP formulation with bigM constraints. They also provide a literature overview on RUL estimation. bougacha2022impact aim to reinforce the problem stated by herr2017predictive . For this purpose, they assume that the health states are uncertain and model the degradation as a gamma process. Their approach also schedules the vehicles’ maintenance when the predicted health states exceed a given threshold, rather than based on the failure probability of the vehicles. They aim to optimize and study the duration of the decision horizon and propose a genetic algorithm and two heuristics for solving the problem. In prause2024approximating , the health states of the vehicles are considered as random variables and maintenance is scheduled based on the failure probability of the vehicles. The authors assume that these random variables are distributed by a one-parameter family of probability distribution functions (PDF). During the operation of the trips, the parameter corresponding to the health state of the vehicle in use is then updated. They present a heuristic and a lower bound for RSRP-PdM based on a state-expanded event-graph (SEEG) in which the parameters of the health states are discretized. Another heuristic using this graph model was presented in prause2023multi .
In the following, we briefly review literature that utilizes graph models and algorithmic methods similar to those employed in this article. A state-expanded version of a space-time graph modeling the assignment of duties to vehicles was used by van2017scheduling and li2019mixed for the scheduling of electric vehicles and their charging processes. Here, each node of the underlying space-time graph exists multiple times with different states of charge, and the energy consumption or the recharging is implicitly modeled by arcs that connect nodes with different states of charge. Thus, the energy consumption of the vehicles does not have to be considered during the solution process. The same idea of resource-expanding the underlying graph was used by zhu2012three to solve the resource-constrained shortest path problem. An iterative refinement approach similar to the one used in this article was presented by boland2017continuous . They propose a solution approach to the continuous-time service network design problem that relies on discretizing the time. The considered discretization is then iteratively refined, and the generated solutions provide increasingly accurate approximations to the original problem. Their approach was subsequently applied to various time-dependent problems, see for example vu2020dynamic ; he2022dynamic .
1.2 Contribution
We consider RSRP-PdM as defined in prause2024approximating , where the health states of the vehicles are assumed to be uncertain and considered as random variables distributed by a parametric family of PDFs. This provides the possibility to schedule maintenance based on the failure probability of the vehicles instead of applying thresholds. In addition, non-linear degradation functions are allowed, vehicles can be maintained only at specific maintenance locations, and the trips can be arbitrarily assigned, i.e., they are not a priori grouped into tours.
In this article, we construct a rounding function that allows for consistent underestimation of the parameters during the construction of a SEEG for parameter spaces of finite dimension. Furthermore, we introduce a family of discretizations with increasing granularity and specify the properties of the potentially eligible failure probability functions. Using these notions, we show that the error between a vehicle rotation in the approximate problem induced by the SEEG and its corresponding rotation in the original RSRP-PdM instance approaches zero for increasingly fine discretizations. We then prove that the parameters describing the health states of the vehicles in the SEEG are actually underestimated compared to the parameters occurring in the original scenario when the SEEG is generated using the constructed rounding function. Thus, the costs of the rotations are also underestimated and the objective value of an optimal solution for the approximate problem provides a lower bound for the value of an optimal solution for RSRP-PdM. This generalizes the lower bound given in prause2024approximating to parametric families of PDFs with more than one parameter. Moreover, an iterative refinement of the underlying discretization of the SEEG leads to a sequence of solutions with increasing quality, all of which underestimate the value of an optimal solution for RSRP-PdM, resulting in a dual solution approach. Finally, the presented approaches are evaluated using a set of test instances for RSRP-PdM given in prause2023construction .
1.3 Outline
This article is structured as follows: First, we describe the RSRP-PdM in Section 2. Then, in Section 3, we present the SEEG, which is a state-expanded version of an event-graph. This graph induces an approximate problem that can be solved using the ILP formulation described in Section 4. We then discuss in Section 5 different approaches to model the degradation and how these models can be included in the construction of the SEEG. Next, we construct a rounding function, which is necessary to consistently underestimate the parameters when constructing the SEEG in Section 6. In Section 7, we then utilize this function to prove that the solutions of the induced approximate problem give a lower bound for the objective of RSRP-PdM. Finally, we conduct computational experiments on a test library for RSRP-PdM given by prause2023construction in Section 8 and close with a conclusion in Section 9.
2 Problem Formulation
In this section, we recall RSRP-PdM as described in prause2024approximating . Suppose we are given a set of vehicles with individual health states. We consider the health states of the vehicles at each time point as random variables to account for their uncertainty. Here, is the time horizon consisting of a finite number of time steps. The health states are assumed to be distributed by a parametric family of probability distribution functions (PDFs) with parameter space . Examples of such parametric families are the family of normal distributions, the family of Poisson distributions , the family of gamma distributions, or the family of Weibull distributions. Each PDF of the family is characterized by its parameters , and each vehicle has an initial health value , which is also distributed by a PDF of the considered family, i.e., can be described by its parameter .
Next, we consider a timetable consisting of trips that need to be operated. Each has a departure and an arrival time , and a departure and an arrival location , where is the set of locations and represents the maintenance facilities. In each of these workshops , maintenance services can be carried out to replenish the health state of the maintained vehicle and reset its associated parameters to . These service actions take time. In addition, each trip possesses a degradation function . This function determines how the parameters of the vehicles’ health state alter when is operated. For example, if we consider a vehicle with current health state and let this vehicle operate trip , we apply to the parameters that characterize and obtain . This parameter then describes the PDF of the new health state, i.e., , at the following time point. Assumptions regarding these functions and various degradation models are discussed in Section 5. Note that we assume that there are also degradation functions associated with deadhead trips or vehicle stoppage. Moreover, the considered family of PDFs yields the parameterized failure probability of the vehicles, denoted by , which determines their potential failure costs. Examples of are presented in Section 5 and its properties are discussed in Sections 6 and 7. Finally, specifies the number of vehicles required to operate .
The task of RSRP-PdM is then to determine an assignment of trips, deadhead trips, stoppages, and maintenance services to each of the vehicles such that all trips are operated. In addition, we associate costs with all of the aforementioned operations as well as with the breakdown of vehicles during operation and aim for an assignment with minimal total costs, including potential failure costs of the vehicles. Finally, we require that the resulting vehicle rotations are balanced, i.e., the numbers of vehicles located at each destination at the beginning and at the end of the time horizon have to coincide.
3 The State-Expanded Event-Graph
To approximate RSRP-PdM, we recall the construction of the state-expanded event-graph (SEEG) introduced in prause2024approximating . This graph induces an approximate problem, which can be formulated and solved by an ILP. Thus, if all parameters of the original problem are consistently underestimated during the construction of the graph, the LP relaxation of the ILP provides a lower bound for the original instance. As mentioned in Section 1.1, similar graphs were used by van2017scheduling and li2019mixed for modeling the state of charge of a fleet of electric vehicles, and by zhu2012three for solving the resource-constrained shortest path problem. Note that the arc reduction procedures used in kliewer2006time are also applied in the construction of the SEEG.
3.1 Constructing the Nodes
First, we describe the generation procedure of the nodes of the SEEG. Their construction is based on the events of the respective trips of the timetable, i.e., the times and locations of their departures and arrivals, as well as a discretization of the parameter space .
Example 1.
Assume that the random variables representing the health states are normally distributed and take values in . Then, a possible discretization of the corresponding parameter space could be
To generate the nodes of the SEEG, we iterate over the individual trips and consider their corresponding departure and arrival events. For each of these events and each parameter of the discretization , we construct a node. This results in the set of departure nodes and the set of arrival nodes . In addition, we add a start and an end node for each location and each parameter of the discretization, i.e., . Furthermore, we define the set of nodes corresponding to a certain location and a specific time as .
3.2 Constructing the Arcs
Next, we describe how to construct the arcs of the SEEG. Note that all arcs are directed and correspond to the possible operations of the vehicles. They can therefore alter the parameters that characterize the PDF of the health state of the vehicle in use. Here, the parameters of the tail characterize the PDF of the health state before the operation of the service corresponding to the considered arc, while the parameters of its head represent the updated values. However, the exact value that results when the degradation function of a service is applied to the parameter of its tail node is not necessarily an element of . Therefore, it may happen that no head node exists for the arc of this service. To circumvent this problem, we will utilize a rounding function as constructed in Section 6, which maps arbitrary parameters of to elements of .
When generating the arcs, the employed procedure differs depending on the type of service to be represented: First, we construct the trip arcs. Let therefore be an arbitrary trip. Then, we iterate over all corresponding departure nodes, i.e., nodes in , and apply the degradation function of the trip, i.e., , to their parameter values. Let be one of these departure nodes, then the parameter value after the operation of is . However, does not have to be contained in . We therefore map it to a value in by applying the rounding function mentioned above. This results in , and an arc is added between and . If we repeat this procedure for each , we obtain the set of trip arcs . Note that for each there is an outgoing arc corresponding to , so we obtain multiple arcs representing , which we denote by .
Next, we add waiting arcs representing the standstill of the vehicles at their current location. For this purpose, we sort the nodes at each location in chronologically ascending order and connect time-consecutive nodes with an arc. This creates a timeline for each location. Again, we apply the degradation function associated with waiting to the parameters of the tail node and then determine the parameters of the head node by using . The degradation function used here can depend on the waiting time or simply be the identity if we assume that no wear occurs during the standstill. Repeating this process for all locations yields the set of waiting arcs .
Now, we add arcs that represent possible deadhead trips between the different locations. Suppose we are given a node , then we define the function firstAfter() to determine the first departure node at that can be reached by a deadhead trip from at time . Analogously, we define lastBefore() to return the chronologically last arrival node at from which it is possible to reach by a deadhead trip. To obtain all deadhead arcs, we now iterate over all arrival nodes and determine for all . If holds, we add an arc from to , otherwise we omit the addition of the arc. This generates the set of deadhead arcs . In this process, the composition of the rounding function with the degradation function associated with deadhead trips is again applied to determine the parameters of the head nodes of the arcs. The degradation function can be time- or distance-dependent, or the identity function if it is assumed that no degradation occurs while deadheading. Note that the utilization of firstAfter and lastBefore reduces the number of deadhead arcs contained in the SEEG and was introduced in kliewer2006time .
Then, we add maintenance arcs. These arcs are used to restore the health states by resetting the parameters to predefined values that are as good as new. Let be the parameter values after maintenance, then we define and iterate over all events and maintenance locations . For each of these combinations, we add a new node representing the corresponding maintenance service. Here, is the travel time from to and is the duration of the service. We then add an arc from all nodes of to the just created maintenance node . Finally, we add the outgoing deadhead and waiting arcs of as described above. These procedures generate the set of maintenance nodes and the set of maintenance arcs .
Lastly, we add artificial nodes and arcs that serve to integrate the initial health of the vehicles and their origin into the graph and that are later used to guarantee the balancedness of the vehicle rotations. For this purpose, we add a node for any origin where a vehicle is initially located. Then, for each of these vehicles, we add an arc from to , where is the parameter value of the initial health state of . This results in the set of artificial starting arcs . Similarly, we add a node for each location symbolizing the end of the time horizon and add an arc from each node of to it. We denote these artificial end arcs by and thus obtain the artificial node set and the artificial arc set .
3.3 The Resulting Graph
Using the node and arcs sets constructed in the previous Sections 3.1 and 3.2, we define and , which together form the SEEG . Note that it is admissible to repeatedly remove all nodes of , together with their incident arcs, that have either in- or outdegree equal to zero. In addition, is always dependent on the choice of the discretization and the rounding function applied during the construction process.
We would like to emphasize that non-linear degradation functions can be used in the construction of the SEEG, which offers the possibility to consider and incorporate a wider variety of degradation behaviors. This is an advantage over classical space-time graph models, where it is complicated to deal with non-linear resource consumption. Additionally, the SEEG can easily be adapted for distance- or time-based preventive maintenance scenarios. Here, the parameter values are chosen to represent the distance traveled or the elapsed time since the last maintenance. Then, the bounds of must to be set to match the thresholds of the maximum allowed mileage and the degradation functions are set to accumulate the distance or time associated with the different operations. Possible extensions of the presented model and how these can be implemented is discussed in prause2024approximating .
3.4 Arc Costs
Now, we describe the costs of the arcs of the SEEG. These costs depend on the type of the considered arc. Waiting arcs () are assigned costs of zero, while the costs of the deadhead arcs () depend on the traveled distance between their start and end locations. The costs of the artificial arcs () are determined in the same way as the costs of the deadhead trips, but the operation costs of a vehicle for the considered time horizon are additionally added to each of the starting arcs (). The two types of maintenance arcs (), i.e., the arcs heading to a maintenance node and the arcs originating from it, are allocated different costs. The incoming ones are assigned the sum of the maintenance costs and the deadhead costs between the start and the end location of the arc, while the outgoing arcs are only attributed the deadhead costs from the maintenance facility to the arrival location.
The trip costs () also consist of two different sub-costs. First, there are the costs that are inherent to every trip and which can be time- or distance-dependent. Second, we assign them the expected failure costs of the vehicles, i.e., the product of the failure costs and the probability that a vehicle breaks down. Various approaches to model degradation and their corresponding failure probability functions () are discussed in Section 5. These functions are then applied to the parameters characterizing the health state of the vehicle during and after the operation of a trip, i.e., to the parameter values of the arc’s head node. This can be exemplified as follows: A trip arc connecting and corresponds to a vehicle whose original health state is a random variable distributed by PDF , which is changed to a health state that is a random variable distributed by by performing the associated trip. Thus, the parameter values of the head node of a trip characterize the failure probability of a vehicle during the trip. The expected failure costs can therefore be determined by multiplying the costs associated with a failure with . Note that the SEEG has the advantage of determining the failure costs of the trips during its construction and thus the failure probability function does not need to be evaluated in the objective, as in the case of non-state-expanded MIP formulations.
3.5 The Completely Expanded Event-Graph
Next, we describe a special case of the SEEG that not only approximates but exactly models RSRP-PdM. For this purpose, we will construct a discretization that contains all possibly occurring parameters. First, we collect all parameter values corresponding to the initial health states of the vehicles in . Then, we sort the trips in ascending order by their departure times, iterate over all of them, and apply each degradation functions to all values currently contained in . The resulting values are in turn added to and the procedure continues with the next trip. Note that may be exponential in the input size of RSRP-PdM. If we now apply the identity as rounding function, we obtain , since contains every possible parameter value that could occur. Therefore, the paths in the SEEG corresponding to the vehicle rotations have the same parameter values as they would have in the continuous case. Thus, a solution to the flow problem induced by this graph is an optimal solution for RSRP-PdM. We refer to this graph as completely expanded event-graph (CEEG). Note that this graph is only of theoretical importance and used for comparisons with the SEEG and not for computations.
4 The Induced Approximate Flow Problem
Suppose we consider an instance of RSRP-PdM, and we constructed the SEEG based on some discretization , then we need to translate the task of the original problem into a problem in . Since paths in that start at one of the artificial start nodes and head to one of the artificial end nodes correspond to possible assignments of tasks to a vehicle, we need to determine a set of paths with the following properties: First, each trip must be operated, i.e., exactly arcs out of the multiple ones corresponding to have to be selected. Next, each artificial arc representing the usage of a vehicle, i.e., arcs in , can be contained in at most one path. Finally, to ensure the balancedness, the number of paths leaving a location must be equal to the number of paths heading to .
Note that optimal solutions to this problem are only approximations to the original RSRP-PdM, since the parameters are rounded during the construction of the SEEG. Thus, an approximation error is introduced to each of the parameters and the associated failure probability of the vehicles is not exactly determined, making the costs of the trip arcs only approximations. However, with finer approximations, i.e., more granular choices of , this error approaches zero, as we show in Section 7.
4.1 Complexity of the Approximate Problem
After describing the approximate problem, we give a mathematical formulation for it and prove that it is NP-hard.
Definition 1 (EPCP).
Given a directed graph with source and sink nodes and an index set . For each , let be a subset of arcs and let be a cost function associated with the arcs of . Then the task of the exact path cover problem (EPCP) is to find a set of paths with minimum costs, each of which starts at some source node and heads to some sink node , and which together cover exactly one arc of each set , . In addition, must hold for all .
The solution of the EPCP for a given SEEG yields a solution to the induced approximate problem. Here, trips with must be modeled by parallel trips. After defining EPCP, let us recall exact cover, a problem stated by karp1972reducibility , which was proven to be NP-complete by garey1979computers : Given a set of elements and collection of subsets of , i.e., . Then the task of exact cover is to find a subcollection whose disjoint union is , i.e.,
If we now have an additional weight function that assigns a weight to each subset , we obtain the weighted exact cover problem, where the task is to find an exact cover with minimum total weight. This weighted variant is the optimization version of exact cover and therefore NP-hard.
Theorem 1.
EPCP is NP-hard.
Proof.
To prove the NP-hardness of EPCP, we give a reduction of weighted exact cover to it. Suppose we are given an instance of weighted exact cover with elements , collection , and weight function over . We will now set up the graph of the associated EPCP instance. An illustration of the graph resulting from the constructed described below is depicted in Figure 1. First, we introduce a source node and a sink node and set . Next, we iterate over each subset and add an initial node and a final node to . Between these nodes, we insert chains of arcs corresponding to the elements of , where the first arc has as its tail, while the last arc has as its head. For each , all arcs corresponding to are collected in set , and we add each generated arc to . Then, we then add an arc from to each of the initial nodes and an arc from each of the final nodes to . We set the costs of all arcs to zero, except for the costs of the arcs between and , which are assigned the weight of the corresponding set . Notice that the balancedness of the paths, which is explicitly required in Definition 1, is trivially satisfied since we consider only one source and one sink node. A solution for EPCP for the just generated graph and w.r.t. the arc sets then provides a solution for weighted exact cover. ∎
Note that even if EPCP could be solved in polynomial time, the underlying graph, i.e., the CEEG, which represents the original RSRP-PdM instance, would have an exponential size.
4.2 Solving the Approximate Problem
After introducing the approximate problem induced by the SEEG, we reproduce the following ILP formulation (AP) to solve this problem. The presented formulation was given in prause2024approximating , where it was applied to approximate RSRP-PdM with one-dimensional parameter space. But it can also be directly employed for the multi-dimensional case if the SEEG is constructed accordingly.
In the ILP, are the costs of the arcs and are variables that determine how many vehicles traverse arc . and , for , are the outgoing arcs of the artificial start node at and the incoming arcs of the artificial end node at , respectively. In addition, , , and are as defined in Section 3.
| (AP) | (1) | ||||||
| s.t. | (2) | ||||||
| (3) | |||||||
| (4) | |||||||
| (5) | |||||||
| (6) | |||||||
Here, the objective function (1) aims to minimize the total costs of the vehicle rotations. Constraints (2) ensure that each trip is operated with the required number of vehicles. Flow conservation is guaranteed by constraints (3), while constraints (4) balance the number of vehicles at each location. Finally, the variables representing the selected arcs of the SEEG and their domains are defined in (5) and (6), where the domain of the artificial starting arcs is binary, since each vehicle can only be used once. Possible extensions of this model are also discussed in prause2024approximating .
5 Modeling the Health States and Degradation
In this section, we present two different models that interpret the health states of the vehicles as random variables. These models are crucial as they imply the associated failure probability function .
5.1 Remaining Useful Life Approach
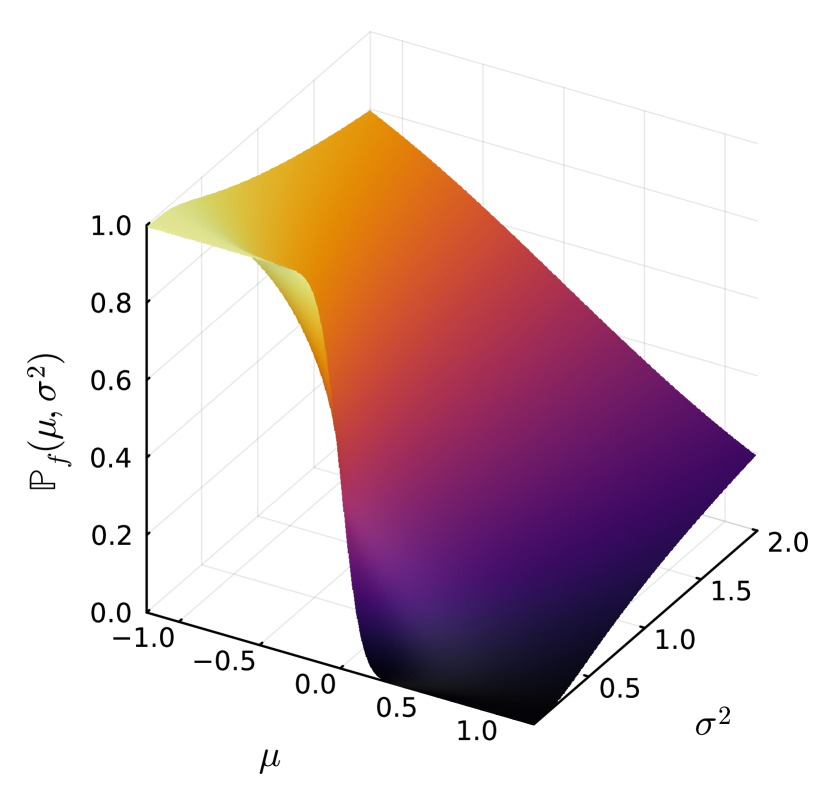
The first model relies on the idea that the RUL of a vehicle can be represented as a point estimate of an observable quantity that is subject to some uncertainty. Examples of this would be a train bogie with an estimated RUL of 10,000 km 500 km or a door that can perform 1,500 150 opening-closing-cycles before a failure occurs. These interpretations reflect the representation via a mean value and a confidence interval and could therefore be represented by the family of normal distributions . By scaling the considered quantity, it can be assumed that the health states are random variables taking values in , where 1 denotes a state that is as good as new and 0 represents a state that leads to a failure. Here, it would be reasonable to assume that the application of the degradation functions of the services decreases as the vehicle deteriorates, while the uncertainty about the state, i.e., , increases with each prediction. This model would then lead to the following failure probability function:
where is the random variable representing the health state of vehicle at time , and is the PDF of a normal distribution with parameters characterizing . Note that the failure probability function depends solely on the parameters . A visualization of the failure probability of the family of normal distributions as a function of and is shown in Figure 2(a).
5.2 Reliability Approach
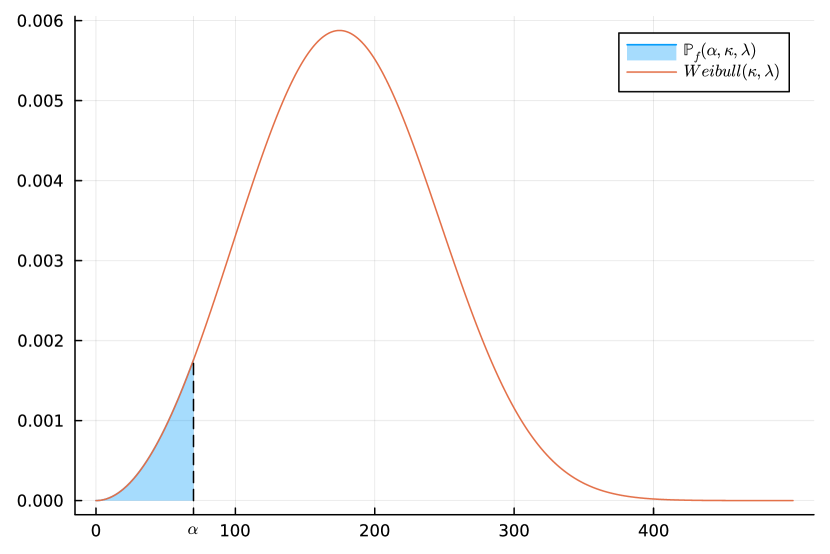
Another possible interpretation is based on reliability theory. In this context, the health state represents the failure rate of the corresponding vehicle over the remaining useful life and depicts the probability that the vehicle fails after an additional number of operating cycles or a certain mileage in its current condition. For an introduction to reliability theory, see emmert2019introduction . Two distributions that are frequently used in this context are the Weibull and gamma distributions. If we use such a representation, we need to take into account the additional mileage of the operated services, i.e., how long the traveled distances are or how many opening-closing-cycles occur. Let this mileage be , then the failure probability can be determined as follows:
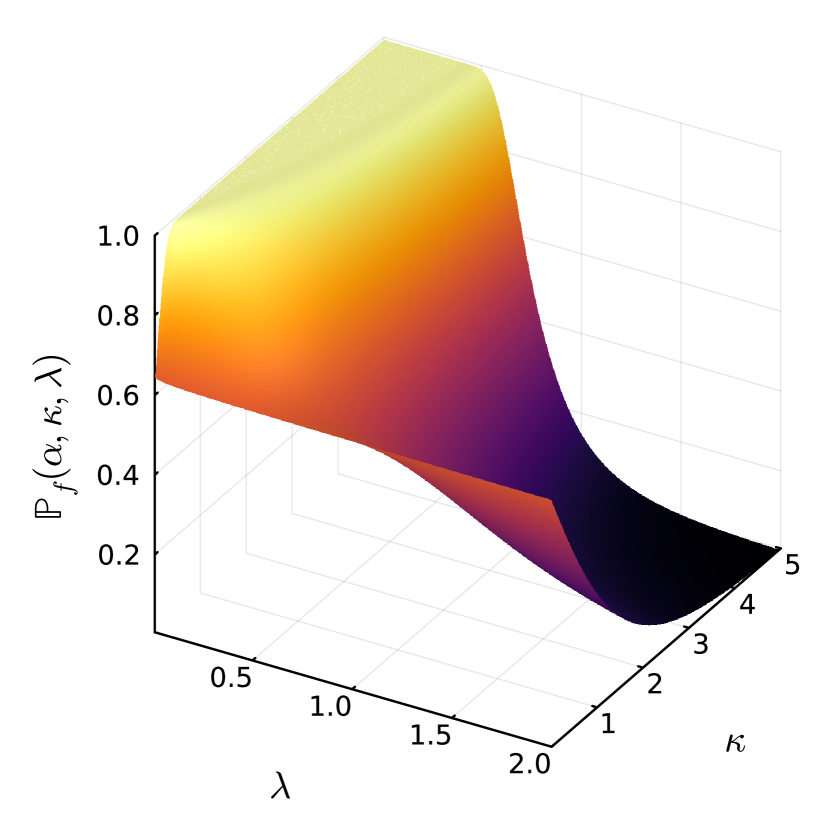
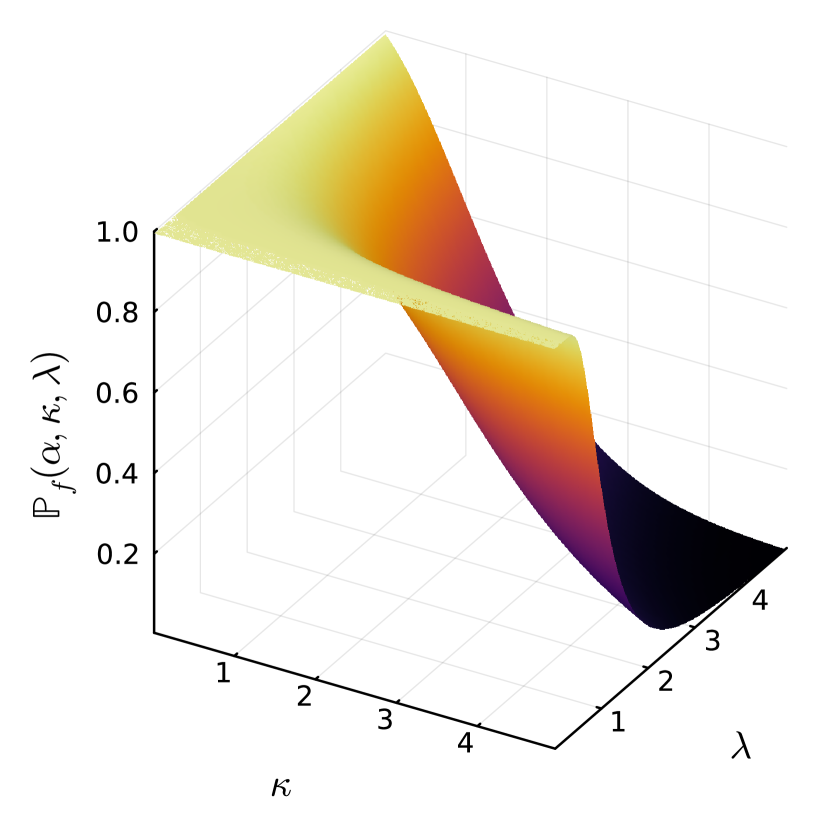
where again is the random variable representing the health state of vehicle at time , and is the PDF of a Weibull distribution with parameters that characterize . In addition, is, as already mentioned, the additional mileage of the operated service. An example of a two-parameter Weibull distribution and the corresponding failure probability for a given is shown in Figure 2(b). In addition, Figure 2(c) illustrates the failure probability of a Weibull distribution as a function of and , and a fixed . Note that a similar model would also be possible with gamma distributions. An example of the failure probability associated with a two-parameter gamma distribution as a function of and , for a fixed , is depicted in Figure 2(d).
6 Consistently Rounding the Parameters
In this section, we construct a rounding function whose application allows a consistent underestimation of the parameters when generating the SEEG. This enables us to assess the rounding error and to show the convergence of a subdivision approach which is presented in the following Section 7. It can thus be shown that solutions of the EPCP for a SEEG constructed using this rounding function provide a lower bound to RSRP-PdM.
In the following, denotes the set of all continuously differentiable functions with domain and is the gradient of . Furthermore, is the convex hull of the vectors contained in , is the standard scalar product of and .
Remark 1.
Let be in and , then the directional derivative of w.r.t. at is given by .
Definition 2.
Let be in , and finite. Then we call directional monotonically increasing on w.r.t. if we have for all and .
Lemma 2.
Let be in , and finite. Furthermore, let be directional monotonically increasing on w.r.t. . Then is directional monotonically increasing on w.r.t. .
Proof.
Since , the derivative in any direction can be expressed as . W.l.o.g. let , then for any there exists with such that . Since is directional monotonically increasing on w.r.t. , we can conclude
Example 2.
Suppose we use the family of normal distributions to represent the health states, i.e., . Then, the failure probability of vehicle at time is
| (7) |
where is the Gauss error function. Thus, the gradient is
Hence, we obtain
This yields
and we can conclude that is directional monotonically increasing on w.r.t. , and directional monotonically increasing on w.r.t. .
Example 3.
Suppose we use the family of Weibull distributions to represent the health states, i.e., . Then, the failure probability of vehicle at time operating a service with wear is
| (8) |
Thus, the gradient is
and the directional derivatives are
Thus, we obtain
Hence, we can conclude that is directional monotonically increasing on w.r.t. , and directional monotonically increasing on w.r.t. .
Example 4.
Suppose we use the family of gamma distributions to represent the health states, i.e., . Then, the failure probability of vehicle at time operating a service with wear is
where is the gamma function and is the lower incomplete gamma function defined as . Thus, we obtain
Unfortunately, we were not able to obtain analytical results showing. But computational experiments indicate exactly this behavior. Hence, we assume to be directional monotonically increasing on w.r.t. .
Lemma 3.
Let be in and , then there exists a vector of signs such that is directional monotonically increasing on w.r.t. .
Proof.
Consider for any , then we either have or .
- Case 1:
-
If , setting leads to a direction in which is directional monotonically increasing.
- Case 2:
-
If , setting leads to a direction with due to the linearity of the scalar product. Hence, is directional monotonically increasing in direction .∎
Suppose we have with , then according to Lemma 3 there exists a set of directions , with , for each such that is directional monotonically increasing on w.r.t. . There are only finitely many of these direction sets , for , and for each of them we define the corresponding domain . These form a partition of . The Examples 2 to 4 give an impression of what the resulting sets can look like, showing that their structure is quite simple. These and their corresponding directions are then employed to determine in which direction the currently considered parameters have to be rounded to underestimate their corresponding failure probability . For this purpose, we define the following rounding function, which incorporates this directional information when rounding the parameters.
Definition 3.
Let be finite and , then we define the cone in direction emitting from to be
Definition 4.
Let be a finite set and a failure probability function. Moreover, let induce a collection of sets , , for , such that is directional monotonically increasing on w.r.t. . Furthermore, let and let be the set containing with corresponding . Then we define rounding function as follows:
This function ensures that the parameters get rounded to the nearest element of the discretization that lies in a direction in which decreases. This will later guarantee that the failure probability is consistently underestimated.
7 Approximating the Error
As mentioned in Section 3, the RSRP-PdM can be represented by the flow problem induced by the CEEG, while solving the flow problem induced by the SEEG, based on some discretization , only provides an approximation to the problem. Now, we estimate the error that arises between the vehicle rotations in the CEEG and their counterparts in the SEEG when is applied during the construction of the SEEG. We then show that the refinement of leads to a sequence of approximations whose solution values approach the value of an optimal solution for RSRP-PdM from below. Thus, the solutions of the LP relaxations of the corresponding formulation (AP) provide a sequence of lower bounds for RSRP-PdM for increasingly finer discretizations.
In this section, we assume that the degradation functions associated with the trips and the other operations, i.e., deadheading or waiting, are Lipschitz continuous. Furthermore, we suppose that is also Lipschitz continuous and that there exist and , for and some , such that is directional monotonically increasing on w.r.t. .
7.1 Bounding the Failure Probability
In the following, we demand that the parameter space is a cuboid bounded by some upper and lower values on each component, i.e., such that
where denotes componentwise less than or equal to. Furthermore, w.l.o.g. we assume and for all . Next, let be the -cube with side lengths one, then we choose its vertices as initial discretization . We refine this discretization by iteratively decomposing the current cubes into subcubes. For this purpose, we insert equidistant points on each diagonal of the cubes and consider the vertices of all resulting subcubes as discretization . Subsequently, the procedure is repeated and each of the resulting subcubes is divided again to obtain . In this way, a family of discretizations with is obtained. Note that all contain the upper and the lower bound of the parameter space.
In addition, we have to take into account the subsets of on which is directional monotonically increasing w.r.t. different sets of directions. For this purpose, the points at which the boundaries of the intersect the “grid lines” that form the cubes of the current discretization must be added to . We denote these points by additional boundary points and assume that the boundaries between the are hyperplanes whose normal vectors are parallel to one of the “grid lines”. This assumption is reasonable as the examples given in Section 6 exhibit exactly this behavior. Thus, the boundary hyperplanes divide the cubes of the discretization into subcubes on which possesses a uniform directional monotonicity behavior. A discretization that possesses these properties is called suitable in the following. Recall Examples 2 and 3: The failure probability of the family of normal distributions is directional monotonically increasing on w.r.t. and on w.r.t. . Thus, the points at which the “grid lines” of intersect the line must be added to . The same applies to the line when considering Weibull distributions.
Now, we show that for a point in a cube and a set of directions, there is always a vertex of the cube in the corresponding cone of directions to which can be rounded.
Lemma 4.
Let be the -dimensional unit cube, arbitrary, a vector of signs, and . Then, contains at least one vertex of .
Proof.
The vertices of are . Now, define with for all , then we have . To show that is contained in , we have to find conic coefficients such that , i.e., . Depending on , we define for all . Since we obtain
- Case 1:
-
If : .
- Case 2:
-
If : .
Hence, the defined are the desired conic coefficients and we conclude . ∎
Note that one or more of the additional boundary points could also lie in . In this case, these elements of the discretization would be closer to than , since is a vertex of the cube itself and thus has the largest distance to in the corresponding direction. Therefore, applying would result in one of these additional points.
Next, we prove an upper bound on the approximation error that arises when applying the rounding function .
Lemma 5.
Consider as defined above and let , , for , be sets such that is directional monotonically increasing on w.r.t. . Then, the error resulting from the application of is .
Proof.
Each discretization induces a partition of into cubes with identical side lengths, i.e., , where each is a cube with side length , for . Now, let be any parameter value, then there exists some that contains , since is a partition of . Furthermore, the also give a partition of , and is directional monotonically increasing on w.r.t. . Let be the set such that , then due to Lemma 4 at least one vertex of is contained in . Hence, we have and it follows . Thus, there exists , which is either a vertex of or one of the additional boundary points. Since all of these points are located on the facets of , we obtain . Hence, it follows . ∎
Lemma 5 shows that the error caused by the application of depends on the diameter of the greatest cube contained in and since and are fixed, we have for the described family of discretizations .
Next, we estimate the rounding errors between the actual parameters of the health states and the occurring parameters in the SEEG caused by the utilization of the rounding function. For this purpose, we compare the parameter values that arise in the CEEG and the SEEG for corresponding vehicle rotations. Recall that the CEEG is based on a discretization that includes all potentially appearing parameters and thus exactly models both the RSRP-PdM and the degradation. Suppose we have a path in the CEEG that corresponds to a vehicle rotation, then we denote a path consisting of the same operations and trips in the SEEG as discrete counterpart of . We show that such a counterpart exists and then estimate the occurring rounding errors along this path.
Theorem 6.
Consider a suitable discretization of w.r.t. and let be any path in the CEEG. Then, there exists a discrete counterpart in the SEEG constructed w.r.t. .
Proof.
It is sufficient to show that for any there is a parameter in to which can be rounded by . If is a cuboid, we can assume w.l.o.g. by scaling. A discretization that contains the bounds of and the additional boundary points induced by therefore consists at least of the elements contained in , as described above. Thus, we can apply the idea of Lemma 4 to and obtain an element to round to. Therefore, we can construct a discrete analogous for each . ∎
Example 5.
Suppose we have and a discretization consisting only of the upper and lower bound of . Furthermore, assume that is directional monotonically increasing on w.r.t. and that there is no trip that would lead to a breakdown for a vehicle that is as good as new, i.e., for all . Then, we have for each , which leads to an extreme case of Theorem 6, since any path in the CEEG would be projected onto a discretized counterpart where all parameter values are zero.
Corollary 7.
Consider and an arbitrary trip . Let be a Lipschitz constant of , a parameter value occurring in the CEEG, and its discrete counterpart in the SEEG. Then, the error occurring after the operation of is bounded by .
Proof.
Due to the Lipschitz continuity of and Lemma 5 it follows
After bounding the error that can occur due to the operation of a trip, we specify a bound on the error for multiple consecutive trips. Here, the error is propagated and amplified as is applied after each trip.
Theorem 8.
Let be a path in the CEEG and its discretized counterpart in the SEEG constructed w.r.t. for some . Additionally,let be the number of trips contained in these paths, and. Then, the error between the parameter value of and its discretized counterpart after the th service is bounded by
Proof.
In the following, and are the parameter values of and after the th service, respectively. W.l.o.g. we assume that the services are indexed in the order of their operation.
Suppose a certain vehicle operates the schedule corresponding to path . Then, the parameters of the initial health state of determine the initial parameters of , i.e., . Therefore, the initial parameters of are given by and by Lemma 5 we obtain. In addition, for each it holds:
In the penultimate transformation, we applied the Lipschitz continuity of and Lemma 5 for . Next, we show by induction on that the stated formula for holds:
- BC:
-
When , we have by Lemma 5:
- IH:
-
Assume holds for all .
- IS:
-
Consider , then using , it follows:
Thus, the claim follows. ∎
Note that, although we do not consider maintenance operations in Theorem 8, they can only reduce the resulting error since they reset the parameters to some predefined value . Therefore, by Lemma 5, the resulting error is at most and thus no further error is propagated from the services that were operated before the maintenance.
Furthermore, since every timetable consists of only a finite number of services, i.e., , there exists a maximum number of services that can be performed consecutively by any vehicle. Therefore, the maximum error that would be possible for each path is , where and are constants. Thus, . Although and can be rather large in real world instances, the error depends on the granularity of the considered discretization, and therefore the refinement procedure determines the rate of convergence, which can be exponentially fast. An example of the error propagation for a one-dimensional parameter space is depicted in Figure 3.
Corollary 9.
Let be a path in the CEEG and be its discretized counterpart in the SEEG constructed w.r.t. for some . Furthermore,let be the number of trips contained in these paths,, and a Lipschitz continuous function with Lipschitz constant . Then, the error between the failure probability of and its discretized counterpart after the th service is bounded by
Proof.
By applying the Lipschitz continuity of and Theorem 8, we conclude
Corollary 9 shows that the error of the failure probability of any path further approaches zero with each refinement of the discretization. In addition to Corollary 9, it holds , since is based on a cumulative distribution function and can therefore only take values in . Hence, the cost error in the objective function of the approximate problem w.r.t. a given path is at most , where is the number of services contained in .
7.2 Approaching the Optimum from Below
Next, we show that the utilization of leads to a consistent underestimation of the parameters in the SEEG. Consequently, the failure probability is also underestimated and thus each path in the SEEG has lower costs than the corresponding path in the CEEG. Therefore, the objective value of a solution to the approximate problem is less than or equal to the problem induced by the CEEG, i.e., the RSRP-PdM itself. This observation allows us to derive a method that approaches the optimal value of a solution for RSRP-PdM from below and can therefore be used to derive lower bounds or for a dual solution approach.
Recall that we have intentionally included the additional boundarypoints in the discretizations . Since these points are closer to the interior points of each cube than the vertices of the cube, the parameters are rounded to these values if they lie in the cone emanating from the parameter in question, before being rounded to other elements of . This prevents the rounding function from mapping parameters to sets on which has a different directional monotonicity.
From now on, we additionally require that the induced by the failure probability possess an order and that we have for , , and , where is the number of domains with different directional monotonicity. As before, this assumption is reasonable since the families of normal and Weibull distributions exhibit exactly this behavior, see Examples 6 and 7, and the family of gamma distributions has the same directional monotonicity on the entire parameter space .
Example 6.
For the normal distribution, we have with, and failure probability (7).
- :
-
, :
- :
-
, :
Hence, we obtain for , .
Example 7.
For the Weibull distribution, we have with , and failure probability (8).
- :
-
, :
- :
-
, :
Hence, we obtain for , .
Furthermore, we assume in the following that all degradation functions are aligned with the considered failure probability, as specified in Definition 5. This reflects the idea that new or recently maintained vehicles do not degrade faster than vehicles that are already worn out.
Definition 5.
Let be the considered failure probability and the degradation function of some trip . Then we say that is aligned with if it holds for all with .
Definition 6.
Let and , then we write to indicate that is componentwise less than or equal to w.r.t. signs if if and if holds for all .
Lemma 10.
Consider a suitable discretization of w.r.t. and let , where is directional monotonically increasing on w.r.t. with . Then, it holds .
Proof.
Corollary 11.
Consider a suitable discretization of w.r.t. and let , where is directional monotonically increasing on w.r.t. with . Then, it holds .
Proof.
Apply Lemma 10 and the directional monotonicity of on w.r.t. . ∎
Theorem 12.
Consider a suitable discretization of w.r.t. and let be a path in the CEEG, and its discretized counterpart in the SEEG. Then, it holds for all , where is the number of services contained in .
7.3 An Iterative Refinement Approach
Lemma 10 and Theorem 12 guarantee that the parameter values in the SEEG are always underestimated when is employed during its construction. This leads to an approximation where the wear applied to the vehicles is less severe than in the CEEG and thus in the original RSRP-PdM instance. Due to the underestimated parameters, the failure probability is underestimated as well and the resulting solution for (AP) has lower costs than the corresponding solution for the original instance. By Theorem 6, there is a discrete counterpart in the SEEG for each path in the CEEG if the SEEG is constructed based a suitable discretization. Since these paths represent all feasible vehicle rotations, the value of an optimal solution of the approximate problem is a lower bound to the value of an optimal solution of the original instance.
Next, we show that adding values to a suitable discretization can only increase the objective value of a solution for the approximate problem. Thus, the subsequent refinement of the discretization leads to a sequence of solutions whose approximate objective values continue to increase and approach the optimal value of a solution for RSRP-PdM from below. For this purpose, we use the notion of corresponding paths, similar to the discrete counterpart of a path, as above: Suppose we are given two SEEGs and that are constructed based on suitable discretizations and , respectively, and that approximate the same problem. Furthermore, let be a path in , then we denote a path in that consists of the same sequence of services as the corresponding path to . Again, such a path exists by Theorem 6.
Theorem 13.
Consider a suitable discretization of w.r.t. and set for some . Let and be the SEEGs based on and , respectively, and let be a path in with being the corresponding path in . Then, it holds .
Proof.
If , we have and no path would get altered. Consequently, we have . We therefore assume in the following. Recall that we assume to be a bounded cuboid and that each discretization induces a partition of into cuboids, one of which contains . Let this cell be .
Now, let be the set of all arcs in that have a head node whose parameters are equal to a vertex of . Then, we obtain two cases: First, if does not contain an arc of , all of its arcs are also present in the SEEG w.r.t. and are not modified. It follows that the parameters of the nodes in are equal to those in , resulting in . Second, if contains an arc of , let be the first of them. Then, each arc preceding remains unchanged. Let be the tail node of and the trip corresponding to , then we determine , where is the parameter value of . Now, there are again two possibilities: If , the failure costs associated with in remain the same and we consider the next arc of . But if , where is the vector of signs that determines in which directions is directional monotonically increasing on the domain containing , we get . The same arguments apply to the subsequent arcs of in . Therefore, the parameter values of the nodes in may be updated, but they can only increase compared to the values of the corresponding nodes in . Consequently, the failure probability can only increase, as can the costs. This results in . ∎
Corollary 14.
Consider a suitable discretization of w.r.t. and set for some . Let and be the SEEGs based on and , respectively. Then, it holds , where is an optimal solution for the approximate problem induced by for .
Proof.
Suppose we have an optimal solution for the approximate problem induced by . consists of a set of paths that also exist in according to Theorem 6. Let these paths be . By Theorem 13, we have for all . These paths yield a solution for the approximate problem induced by with . Since we have , the claim follows. ∎
Theorem 13 and Corollary 14 give rise to an iterative solution approach: Start with a suitable discretization of w.r.t. , then construct the corresponding SEEG, solve the induced approximate problem (AP) and iteratively refine . This yields a sequence of solutions whose objective values approach the value of an optimal solution for RSRP-PdM from below. Such a sequence of discretizations is given by the family described at the beginning of this section. Furthermore, the approximate solutions can be transformed to solutions for the original problem. For this purpose, we consider the service sequences given by the paths contained in the solution and propagate the parameters through the exact degradation functions. The resulting procedure is described in Algorithm 1 and leads to a dual solution approach for RSRP-PdM. However, if one is only interested in a lower bound for the instance, the algorithm can be modified by solving the LP relaxation of (AP) in line 6 and removing lines 1, 7, and 9.
8 Computational Results
In this section, the results of Algorithm 1 for the test instances provided by prause2023construction are presented and discussed. The scenarios are based on real timetables of a private German railroad company and have a time horizon of one week. The health states of the vehicles represent the conditions of their doors and are assumed to be normally distributed, i.e., failure probability (7) has to be utilized. In addition, the occurring degradation behavior is non-linear.
8.1 Computational Setup
8.2 Results
The results obtained for each of the instances are specified in Table 1. The first four columns contain the characteristics of the instances, while column five to eight hold the obtained solution values and lower bounds. Here, MSH is the multi-swap heuristic presented in prause2023multi , DA is the dual solution approach given in Algorithm 1, and LP-LB is the lower bound derived from this algorithm by utilizing the LP relaxation of (AP). The best solution and the best lower bound are each marked in bold. The last column then contains the gap in percent between the best obtained solution and the best lower bound.
First, we describe the results obtained by MSH and DA regarding solutions to the test instances. Here, the heuristic approach was able to achieve the best result for five of the six instances, and its solution for instance T4, where the dual approach obtained the best result, has a gap of only 0.01% and is therefore almost equally good. DA on the other hand, could only find the best solution for one instance, i.e., T4, and was not able to generate a primal feasible result for instance T6 at all. Furthermore, the generated solutions have a gap of 4.2 – 70.5% to the heuristic results for the instances where the heuristic achieved the best results. Thus, MSH is a better choice when it comes to generating feasible solutions, since the heuristic consistently delivers better or almost equally good results as the dual approach. This behavior was expectable as MSH makes the greatest progress within the first 400 seconds prause2023multi , in which DA is still at a point where the discretization is rather coarse leading to an approximation with less severe degradation. Hence, the solutions obtained by the dual approach tend to ignore maintenance at that point in time. In addition, DA relies on repeatedly solving ILP formulation (AP), whose size increases with each iteration.
Next, the results regarding the obtained lower bounds are discussed. Here, LP-LB and DA achieved the same result for three of the six instances, i.e., T2, T5 and T6. LP-LB performs best on two of the instances (T1 and T3), where the results obtained by DA deviate from the LP-based lower bounds by 0.02% and 1.5%, respectively. In one case (T4), DA achieved the best lower bound, while the result of LP-LB is 0.5% away from this bound. These similarly good results are obtained because the LP relaxation is used as a lower bound in the solution process of the ILP within DA. This leads us to two conclusions: On the one hand, this shows that the LP relaxation of (AP) is very tight, as the lower bound in the ILP formulations does not seem to benefit from the integrality constraints of its variables. On the other hand, LP-LB does not appear to benefit from the fact that it does not have to solve the ILP and thus can perform more iterations, allowing the consideration of finer discretizations at an earlier stage. It therefore makes no difference whether DA or LP-LB is used for determining lower bounds.
In summary, a combination of MSH and LP-LB appears to achieve the best results. With this combination it is possible to generate solutions and lower bounds with gaps of less than 5% for test instances originating from genuine timetables. Although the dual solution approach was not able to obtain similarly good solutions as MSH, it performed well in generating lower bounds for RSRP-PdM instances. Moreover, it was able to solve one instance, namely T5, to optimality.
| Instance | Trips | Destinations | Vehicles | Solution Value | Lower Bound | Best Gap in % | ||
|---|---|---|---|---|---|---|---|---|
| MSH | DA | DA | LP-LB | |||||
| T1 | 566 | 8 | 6 | 269,728 | 480,059 | 261,384 | 261,432 | 3.08 |
| T2 | 608 | 10 | 7 | 433,328 | 452,201 | 428,349 | 428,349 | 1.15 |
| T3 | 636 | 15 | 16 | 1,419,687 | 4,817,547 | 1,360,954 | 1,381,725 | 2.67 |
| T4 | 679 | 9 | 8 | 196,411 | 277,687 | 190,537 | 189,577 | 2.99 |
| T5 | 813 | 16 | 14 | 327,805 | 327,770 | 327,770 | 327,770 | 0.00 |
| T6 | 919 | 17 | 29 | 2,337,466 | - | 2,290,596 | 2,290,596 | 2.01 |
9 Conclusion
In this article, we have introduced the notions necessary to consistently underestimate the parameters during the construction of the SEEG for approximating the RSRP-PdM when the considered health states are distributed by families of PDFs with more than one parameter. For this purpose, we have constructed a rounding function that takes the domains into account on which the applied failure probability function is monotonically increasing w.r.t. different sets of directions. Furthermore, we described a family of discretizations with increasing granularity that results in SEEGs with rising approximation quality, and presented different approaches to model the degradation based on the family of normal, Weibull, and gamma distributions. We then estimated the error between vehicle rotations, i.e., paths, in the SEEG and CEEG, and it was proved that the objective value of a solution for the approximate problem can only underestimate the value of an optimal solution for RSRP-PdM. Hence, we derived a dual solution approach and a method to determine lower bounds for the discussed problem. The final computations show the effectiveness of the lower bound, as the gap to heuristic results for real-world instances are rather small.
Possible next steps for future research are the implementation of a column generation approach for solving the LP relaxation of (AP) while computing the lower bound. This could lead to an acceleration of the solution process and might offer the possibility to solve the approximate problem for even finer discretizations than with the direct LP formulation. In addition, this method could be employed to develop a branch and price approach for RSRP-PdM. This could improve the efficiency of the dual approach and thus deliver better results.
Acknowledgements
This work was supported by the innovation funding program ProFIT (grant no. 10174564) funded by the State of Berlin and co-funded by the European Union.
References
- [1] Javier Andrés, Luis Cadarso, and Ángel Marín. Maintenance scheduling in rolling stock circulations in rapid transit networks. Transportation Research Procedia, 10:524–533, 2015.
- [2] Fabio Arena, Mario Collotta, Liliana Luca, Marianna Ruggieri, and Francesco Gaetano Termine. Predictive maintenance in the automotive sector: A literature review. Mathematical and Computational Applications, 27(1):2, 2021.
- [3] Jeff Bezanson, Alan Edelman, Stefan Karpinski, and Viral B Shah. Julia: A fresh approach to numerical computing. SIAM review, 59(1):65–98, 2017.
- [4] Natashia Boland, Mike Hewitt, Luke Marshall, and Martin Savelsbergh. The continuous-time service network design problem. Operations research, 65(5):1303–1321, 2017.
- [5] Ralf Borndörfer, Markus Reuther, and Thomas Schlechte. A coarse-to-fine approach to the railway rolling stock rotation problem. In 14th Workshop on Algorithmic Approaches for Transportation Modelling, Optimization, and Systems, page 79, 2014.
- [6] Ralf Borndörfer, Markus Reuther, Thomas Schlechte, Kerstin Waas, and Steffen Weider. Integrated optimization of rolling stock rotations for intercity railways. Transportation Science, 50(3):863–877, 2016.
- [7] Omar Bougacha. Contribution to post-pronostic decision: a new framework based on prongnostic/decision interaction. PhD thesis, Université Bourgogne Franche-Comté, 2020.
- [8] Omar Bougacha, Christophe Varnier, and Noureddine Zerhouni. Impact of decision horizon on post-prognostics maintenance and missions scheduling: a railways case study. International Journal of Rail Transportation, 10(4):516–546, 2022.
- [9] Valentina Cacchiani, Alberto Caprara, and Paolo Toth. Solving a real-world train-unit assignment problem. Mathematical programming, 124(1):207–231, 2010.
- [10] Frank Emmert-Streib and Matthias Dehmer. Introduction to survival analysis in practice. Machine Learning and Knowledge Extraction, 1(3):1013–1038, 2019.
- [11] Yuan Gao, Jun Xia, Andrea D’Ariano, and Lixing Yang. Weekly rolling stock planning in chinese high-speed rail networks. Transportation Research Part B: Methodological, 158:295–322, 2022.
- [12] Michael R. Garey and David S. Johnson. Computers and Intractability: A Guide to the Theory of NP-Completeness, volume 174. WH Freeman & Co., New York, 1979.
- [13] Giovanni Luca Giacco, Andrea D’Ariano, and Dario Pacciarelli. Rolling stock rostering optimization under maintenance constraints. Journal of Intelligent Transportation Systems, 18(1):95–105, 2014.
- [14] Gurobi Optimization, LLC. Gurobi Optimizer Reference Manual, Version 10.0.2. http://www.gurobi.com, 2024.
- [15] Edward Yuhang He, Natashia Boland, George Nemhauser, and Martin Savelsbergh. Dynamic discretization discovery algorithms for time-dependent shortest path problems. INFORMS Journal on Computing, 34(2):1086–1114, 2022.
- [16] Nathalie Herr, Jean Nicod, Christophe Varnier, Noureddine Zerhouni, Malek Cherif, and Farhat Fnaiech. Joint optimization of train assignment and predictive maintenance scheduling. In International Conference on Railway Operations Modelling and Analysis, 2017.
- [17] Nathalie Herr, Jean-Marc Nicod, Christophe Varnier, Noureddine Zerhouni, and Pierre Dersin. Predictive maintenance of moving systems. In 2017 Prognostics and System Health Management Conference (PHM-Harbin), pages 1–6. IEEE, 2017.
- [18] Richard M. Karp. Reducibility among combinatorial problems. In Raymond E. Miller, James W. Thatcher, and Jean D. Bohlinger, editors, Complexity of Computer Computations: Proceedings of a symposium on the Complexity of Computer Computations, held March 20–22, 1972, at the IBM Thomas J. Watson Research Center, Yorktown Heights, New York, pages 85–103. Springer US, Boston, MA, 1972.
- [19] Natalia Kliewer, Taieb Mellouli, and Leena Suhl. A time–space network based exact optimization model for multi-depot bus scheduling. European journal of operational research, 175(3):1616–1627, 2006.
- [20] Lu Li, Hong K Lo, and Feng Xiao. Mixed bus fleet scheduling under range and refueling constraints. Transportation Research Part C: Emerging Technologies, 104:443–462, 2019.
- [21] Richard M. Lusby, Jørgen Thorlund Haahr, Jesper Larsen, and David Pisinger. A branch-and-price algorithm for railway rolling stock rescheduling. Transportation Research Part B: Methodological, 99:228–250, 2017.
- [22] Felix Prause. A multi-swap heuristic for rolling stock rotation planning with predictive maintenance. Technical Report 23-29, ZIB, Takustr. 7, 14195 Berlin, 2023.
- [23] Felix Prause and Ralf Borndörfer. Construction of a test library for the rolling stock rotation problem with predictive maintenance. Technical Report 23-20, ZIB, Takustr. 7, 14195 Berlin, 2023.
- [24] Felix Prause, Ralf Borndörfer, Boris Grimm, and Alexander Tesch. Approximating rolling stock rotations with integrated predictive maintenance. Journal of Rail Transport Planning & Management, 30:100434, 2024.
- [25] Markus Reuther. Mathematical optimization of rolling stock rotations. PhD thesis, Technische Universität Berlin (Germany), 2017.
- [26] Markus Reuther and Thomas Schlechte. Optimization of rolling stock rotations. In Handbook of Optimization in the Railway Industry, pages 213–241. Springer, 2018.
- [27] Pegah Rokhforoz and Olga Fink. Hierarchical multi-agent predictive maintenance scheduling for trains using price-based approach. Computers & Industrial Engineering, 159:107475, 2021.
- [28] Thomas Schlechte, Christian Blome, Stefan Gerber, Stefan Hauser, Jens Kasten, Gilbert Müller, Christof Schulz, Michel Thüring, and Steffen Weider. The bouquet of features in rolling stock rotation planning. Technical report, EasyChair, 2023.
- [29] Per Thorlacius, Jesper Larsen, and Marco Laumanns. An integrated rolling stock planning model for the copenhagen suburban passenger railway. Journal of Rail Transport Planning & Management, 5(4):240–262, 2015.
- [30] Marcel E. van Kooten Niekerk, J.M. Van den Akker, and J.A. Hoogeveen. Scheduling electric vehicles. Public Transport, 9:155–176, 2017.
- [31] Duc Minh Vu, Mike Hewitt, Natashia Boland, and Martin Savelsbergh. Dynamic discretization discovery for solving the time-dependent traveling salesman problem with time windows. Transportation science, 54(3):703–720, 2020.
- [32] Ling Wang, Jian Chu, and Jun Wu. Selection of optimum maintenance strategies based on a fuzzy analytic hierarchy process. International journal of production economics, 107(1):151–163, 2007.
- [33] Meng-Ju Wu and Yung-Cheng Lai. Train-set assignment optimization with predictive maintenance. In RailNorrköping 2019. 8th International Conference on Railway Operations Modelling and Analysis (ICROMA), Norrköping, Sweden, June 17th–20th, 2019, pages 1131–1139. Linköping University Electronic Press, 2019.
- [34] Xiaoyan Zhu and Wilbert E Wilhelm. A three-stage approach for the resource-constrained shortest path as a sub-problem in column generation. Computers & Operations Research, 39(2):164–178, 2012.