Evidence of ferroelectric features in low-density supercooled water from ab initio deep neural-network simulations
2The Abdus Salam Centre for Theoretical Physics, Trieste (Italy)
3 CNR-IOM, Istituto dell’Officina dei Materiali, SISSA unit, Trieste (Italy)
)
Abstract
Over the last decade, an increasing body of evidence has emerged, supporting the existence of a metastable liquid-liquid critical point in supercooled water, whereby two distinct liquid phases of different densities coexist. Analysing long molecular dynamics simulations performed using deep neural-network force fields trained to accurate quantum mechanical data, we demonstrate that the low-density liquid phase displays a strong propensity toward spontaneous polarization, as witnessed by large and long-lived collective dipole fluctuations. Our findings suggest that the dynamical stability of the low-density phase, and hence the transition from high-density to low-density liquid, is triggered by a collective process involving an accumulation of rotational angular jumps, which could ignite large dipole fluctuations. This dynamical transition involves subtle changes in the electronic polarizability of water molecules which affects their rotational mobility within the two phases. These findings hold the potential for catalyzing new activity in the search for dielectric-based probes of the putative second critical point.
Water is a universal solvent that sustains the thermodynamics and dynamics of numerous physical, chemical and biological processes [1]. Unlike simple liquids, water is characterized by several anomalies that are manifested in different regions of the phase diagram. These include, for example, the presence of the density maximum at 4∘C leading to a lower density of the solid phase of water (ice) compared to the liquid phase, as well as the increase in compressibility of liquid water under supercooling, to name a few [2, 3, 4]. Despite significant efforts from experimental, theoretical, and computational fronts, consensus on the microscopic origins of water’s anomalies has not yet been achieved, thus nurturing an open and active area of research [5, 6, 7].
Currently one of the most lively areas of study in the chemical physics of water pertains to the existence of a second critical point in deeply supercooled water. Several decades ago, Poole and co-workers put forward a fascinating suggestion [8] that liquid water may undergo a first-order liquid-liquid transition (LLT), resulting in the coexistence of two metastable, high- and low-density, liquid phases, hereafter referred to as HDL and LDL, respectively. The existence of this transition is thought to possibly rationalize many of liquid water’s peculiar properties [9, 10]. The experimental proof of the existence of a second critical point is extremely challenging owing to the rapid crystallization under supercooled conditions. Recent experiments, however, appear to break the boundary of no-man’s land and give stronger evidence for the existence of the liquid-liquid critical point (LLCP) [11, 12, 13].
Due to the experimental challenges in probing the thermodynamics in the supercooled regime, numerical simulations continue to play a crucial role in understanding the origins of the phenomena. In particular, the ST2 water model has been unequivocally shown to exhibit an LLCP [14, 15, 16, 17, 18]. In addition a few years ago, microsecond long simulations of one of the most realistic classical models of liquid water, TIP4P/2005 [19], have confirmed the existence of the LLCP [15]. Advancements in machine-learning potentials have also opened up the possibility for highly accurate predictions with only a marginal increase in computational cost compared to classical force fields. In this context, Behler and Parrinello pioneered the development and application of the first neural-network (NN) potentials [20] that were later used to study both thermodynamics and dynamics of water across the phase diagram [21, 22, 23, 24].
Over the last decade, Car and co-workers have expanded the scope of the original NNs with the development of deep neural-network (DNN) potentials [25, 26, 27, 28]. The infrastructure provided by DNNs includes highly robust algorithmic advances within an open-source software allowing for an automatic generation and training of ab inito quality potentials [29, 30]. These advancements have paved the path for a systematic exploration of bulk thermodynamic properties [31, 32, 33, 34, 35], as well as dynamic and transport properties [36, 37, 38] that were previously inaccessible through direct DFT methods, or with many-body polarizable potentials such as MB-pol [39, 40, 41, 42].
More recently, Gartner and Car have deployed these DNN potentials to study the behavior of liquid water upon supercooling and also find evidence for the existence of a LLCP [43, 44]. Given that these DNN simulations come from very high quality electronic structure calculations, namely, using the accurate meta-GGA exchange-correlation functional (SCAN) [45, 46], further strengthens the hypothesis that water can separate into two distinct liquids under supercooled conditions.
In this work, we use these DNN trajectories that were made publicly available in Ref. [44], to examine the coupling between fluctuations in density and polarization. By designing an additional deep neural-network that is trained to reproduce the electronic polarizability [28, 47] in the system, our analysis of the 0.5 microsecond molecular dynamics trajectories reveal that the LDL phase displays a tendency to exhibit ferroelectric character as revealed by the presence of spontaneous polarization in the liquid. The dynamical stability of this polarization in the LDL liquid is found to be strongly coupled to the concentration of orientational defects in the hydrogen-bond network. We show that the transitions between the LDL and HDL phase are activated by a collective reorientational process of large angular jumps [48] and offer new perspectives on how these dielectric properties may serve as another probe of the long-sought critical point.
Results
Polarization fluctuations
Leveraging insights from prior studies, we turn to examining DNN molecular dynamics (MD) simulations of supercooled water reported by Gartner et al.. Remarkably, this model also displays evidence for a second critical point at low temperatures and high pressures, giving rise to a low-density and a high-density liquid phase, in line with other classical water models. Since the LDL phase is thought to be characterized by local order akin to what one would expect in ice, we hypothesized that the HDL-LDL transition could be reflected in changes in its orientational order and possibly be manifested in the polarization of the system.
The macroscopic polarization of an extended system of charged particles is ill-defined in periodic boundary conditions (such as used in any MD simulation), unless each charge can be unequivocally assigned to a neutral, non-dissociating unit [49]. As long as the molecules do not dissociate, their dipole can be estimated by associating to each of them a well defined number of Wannier centers, computed from Maximally Localized Wannier Functions (MLWF) [50, 51]. Therefore, we crafted a separate deep neural-network [28] trained to predict the dipole of each water molecule of the system from SCAN-DFT data. This dipole DNN is used to predict, starting from the atomic positions, the molecular dipoles from which the macroscopic polarization can trivially be obtained.
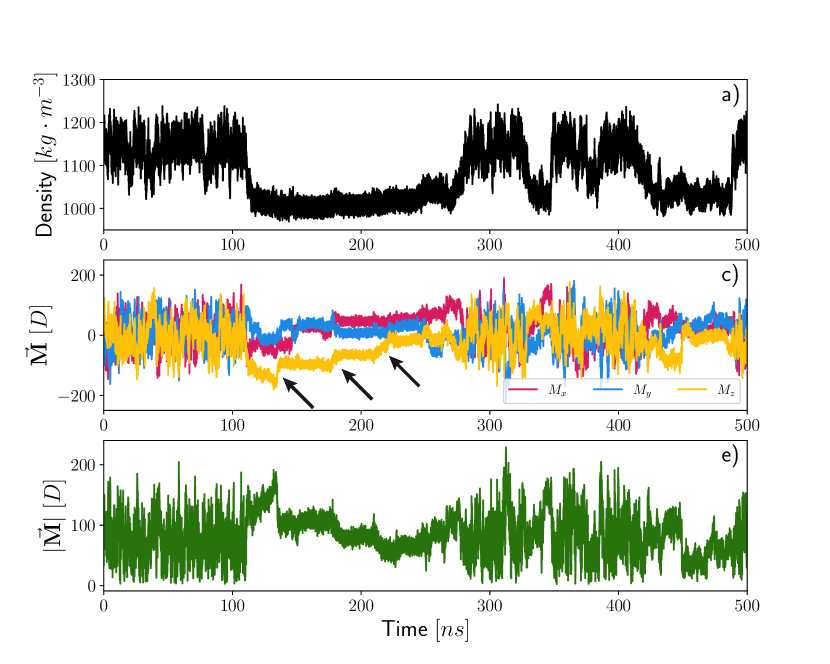
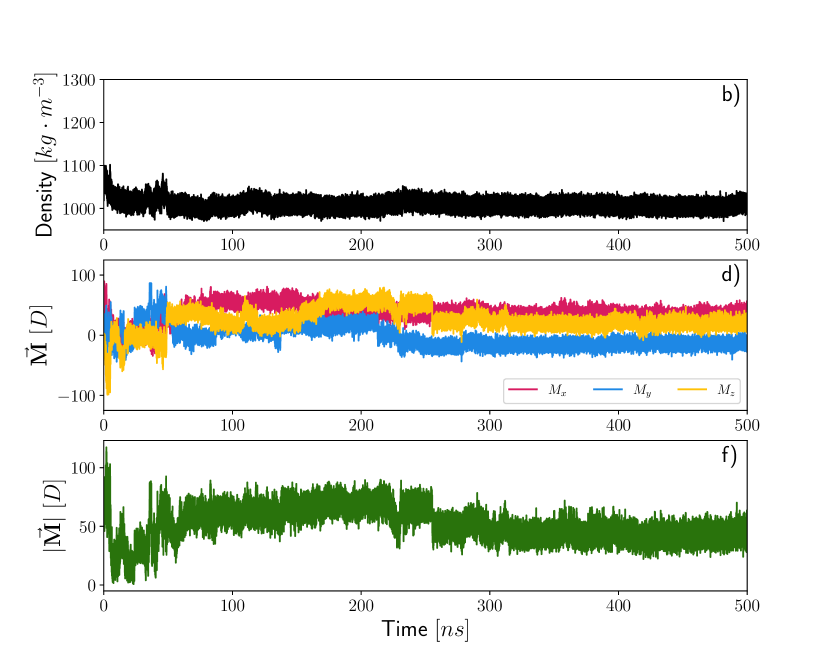
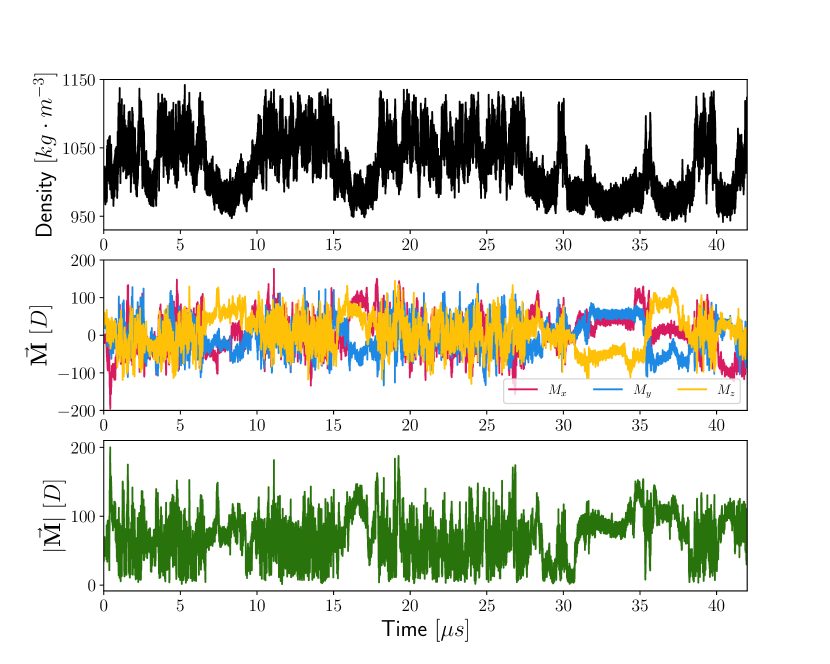
The results of this analysis are summarized in Fig.8 for the two different isobaric-isothermal simulations reported by Gartner et al.. The different subplots show the time series of the density of the system (a)-b)), each of the components of the total dipole (c)-d)), and finally, the dipole modulus (e)-f)). The prominent density fluctuations provide clear evidence of the existence of a metastable critical point near the pT conditions of the corresponding simulations (235K and 3200bar). Specifically, Fig. 8 a) is an example of a trajectory where we observe 5 transitions between the HD and LD phases. On the other hand, in panel b) the system remains in the LD phase for the entire length of the 500-ns simulation.
Turning next to the dielectric properties of supercooled water undergoing the LLT, the time series of the total dipole (depicted in Fig. 8 c) and d)) reveals a strong inclination of the low-density phase towards spontaneous polarization. In particular, LDL water exhibits rather long-lived and nearly constant values of the dipole components surviving for timescales of periods of approximately 100ns. Interestingly, the extent of the polarization both in terms of the magnitude and direction displays a breaking of symmetry. The bottom most panel shows the total dipole moment in the system as a function of time where one clearly sees a marked change in the magnitude of the fluctuations between the LDL and HDL. Similar features are also seen in both the trajectory that hops between the two phases (panel a) and the other which is trapped in the LD phase (panel b). In contrast, in the HDL, the dipole components are symmetrically centered around zero as one would expect in a more disordered phase.
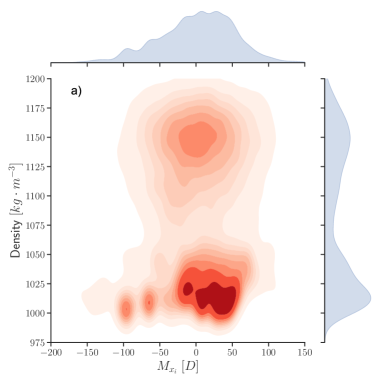
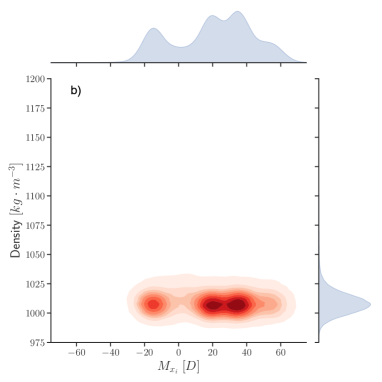
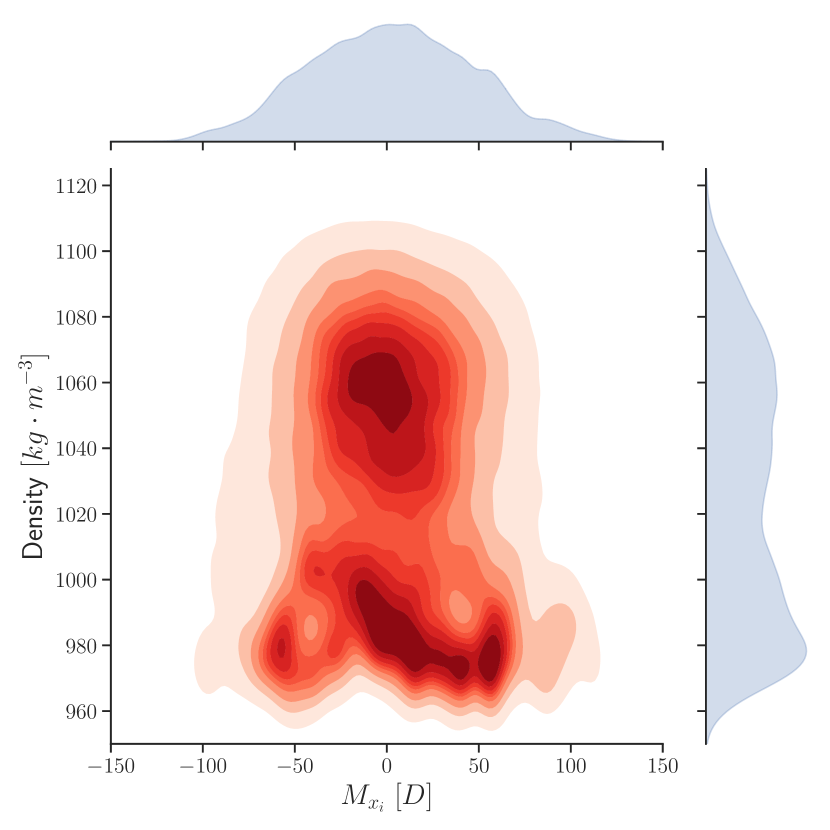
The preceding results strongly point to the importance of the polarization order parameter in affecting the kinetics of the LDL to HDL transition. While the correlation time needed to converge the dipole fluctuations in the LDL phase clearly require significantly longer trajectories that is beyond the scope of the current work and methods employed, it is instructive to construct probability distributions along the density and polarization coordinates. Figure 3 a)-b) shows the two-dimensional distributions for the mass density and dipole (including the three components) as well as the marginal distributions. These density plots firstly confirm that the HD-LD transition is essentially dominated by a mode moving along the density coordinate (y-axes). On the other hand, looking along the x-axis one observes significant structure in the dipole coordinate. Specifically, in both the trajectories (left and right panel), there are at least three different minima that appear. In the case of the simulation that remains trapped in the LDL phase, the marginal distribution along the dipole, clearly shows strong evidence for polarization on the timescales of the current simulation.
Angular Jumps and the LD-HD Transition
A careful examination of the time series associated with the dipole shows the presence of kinks where there are relatively large and abrupt changes in the dipole values (see arrows in the Figure that point to these features). The presence of the kinks is more enhanced in the left panel owing to the fact that in this trajectory, the system oscillates between the LDL and HDL phase and thus the former is metastable. In the second trajectory, the dipole assumes nearly constant values for hundreds of nanoseconds with much fewer kinks.
Changes in the macroscopic dipole and its components over time strongly suggests that there are likely some important changes in the orientational correlations of the hydrogen-bond network network during the LDL-HDL transitions. At ambient temperature, rotational dynamics in liquid water has been shown to involve large angular jumps [48] which lead to the creation of coordination defects. These types of coordination defects also play an important role in different regions of the phase diagram. In ice for example, the migration of orientational Bjerrum-defects involves a highly cooperative reorganization of the network[52, 53]. Similarly, previous studies by Sciortino have demonstrated that coordination defects in water serve as catalytic sites for facilitating the motion of water molecules [54, 55].
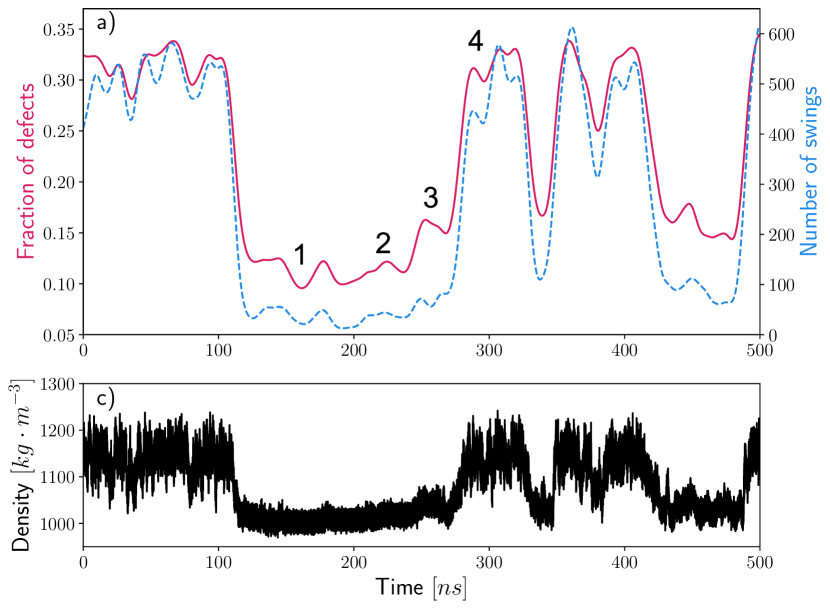
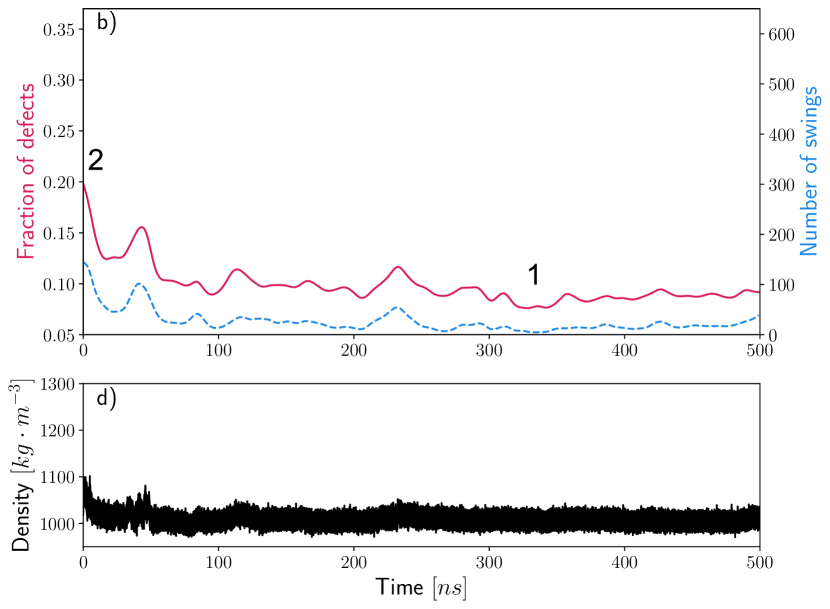
Recently, some of us have shown that angular jumps in liquid water involves a highly cooperative process involving the fluctuations of many hydrogen-bond defects in the network [56]. We hypothesized that the kinks observed in our dipole time series maybe coupled to these types of collective reorientational dynamics. We thus applied an automatized protocol that searches the time-series of all dipole components of each water molecule identifying regions where there are sharp changes indicating large angular jumps (see Methods for more details). The two top panels show the time evolution of the average number of angular jumps observed over time windows of 1ps for the two trajectories. In addition, we also show the fraction of defects in the network defined by the number of water molecules that break ice-rules of donating and accepting two hydrogen bonds. This was determined by using a geometrical criterion of hydrogen bonds determined in similar spirit to that proposed by Luzar and Chandler [57] (see Methods for more details). On the bottom of each panel, the corresponding density time series (black) is shown.
Interestingly, the two phases exhibit markedly different dynamical behavior. The low-density phase appears more structured, with fewer defects and a more glassy nature, constraining rotational mobility. On the other hand, the high-density phase resembles more what one expects in a liquid, showcasing a greater number of defects and increased molecular mobility. Looking specifically at the time interval between 100-300ns where the system resides in the LDL phase, we observe a much smaller number of angular rotations. In this particular case, large jumps are defined by those where the angle change is greater than 60 degrees. More interestingly, the oscillations in the number of angular jumps appear to be rather well correlated with regions in Fig. 8 where the kinks in the dipole are observed. The enhancement in the oscillations together with the reduction of orientational order is depicted in the schematic for example going from regions 1 and 2.
Moving further along that time interval between 100-300ns, the transition from the LDL to the HDL phase involves a growth in the number of rotational jumps (region 3) which ultimately then pushes the system fully into the disordered HDL liquid phase (3-4 in the schematic). Between 300-500ns the system oscillates several times between the HDL and LDL phase as seen in the density plots Fig.5. In this regime, we observe rather curiously, that the LDL phase appears to be more dynamically unstable yielding period where there are a larger number of rotational jumps occurring compared to regions 1 and 2. These features also appear to be rather well correlated with the presence of kinks in the dipole time series. These dynamical features are also fully consistent with the larger structuring that is observed within the LDL phase in the density-dipole density distributions.
The second trajectory close to the LLCP which essentially remains within the LDL phase, displays very different behavior in the re-orientational dynamics. Here we observe the initial dipole fluctuations and kinks shown earlier are manifested in small magnitude oscillations in the angular jumps. This is also reflected in the decay of the number of defects which is schematically represented by a transition from 2 to 1.
Comparing SCAN-DFT and TIP4P/2005
As indicated earlier, Debenedetti and Sciortino demonstrated that TIP4P/2005, one of the most accurate empirical potentials for water, also displays a liquid-liquid critical point at deeply supercooled conditions [15]. These potentials are however, non-polarizable and therefore can only faithfully account for orientational polarization. It is thus interesting to ask what aspects if any, of the LLT could be altered by explicitly including electronic polarization that is present in the DNN.
Similar to the analysis shown in Figs.8 and Fig.3, we examined the coupling between the density and dipole. As in the DNN simulations, we observe long periods in the LDL phase where there is a tendency for spontaneous polarization. This is seen both in the density distributions and the dipole kinks (see Figure 1a SI). Thus at a qualitative level, the presence of polarization within the LDL phase appears be a generic feature that is independent of the quality of the underlying potential. On the other hand, it is clear that rigid point-charge non-polarizable water models have challenges with making quantitative predictions for dielectric properties[58]. In addition, several studies have shown that point-charge models introduce bigger asymmetries in the electrostatic potential on the accepting versus donating side of hydrogen bonds, compared to electronic structure approaches [59]. These differences are also manifested in water dynamics both in terms of its translational diffusion and reorientation polarization [60].
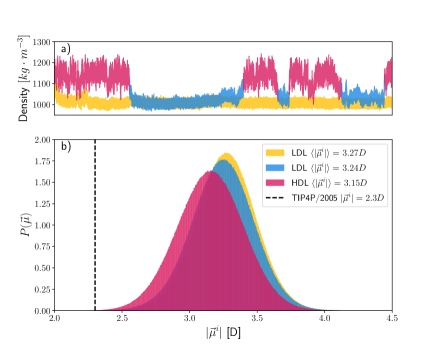
One clear distinction between the two potentials is that in TIP4P/2005, the molecular dipole moment is fixed while in the DNN the water molecular are polarizable which will effectively lead to induced dipoles. In Fig. 6 we report the distribution of the molecular dipoles computed from the SCAN-DFT trajectories. Different colors are chosen to distinguish the distribution of low- (magenta) and high-density (blue) water. A third color (yellow) is chosen to depict the data taken from the second SCAN-DFT trajectory, where the system is deeply trapped in the low-density phase. Interestingly, we observe rather subtle shifts in the average molecular dipole moment of the LDL vs the HDL regions with the former reflecting an enhancement of the average dipole by 0.12 Debye. However, the fluctuations are rather large with all systems displaying significant overlap. In contrast, the molecular dipole of TIP4/2005 is fixed to 2.3 Debye.
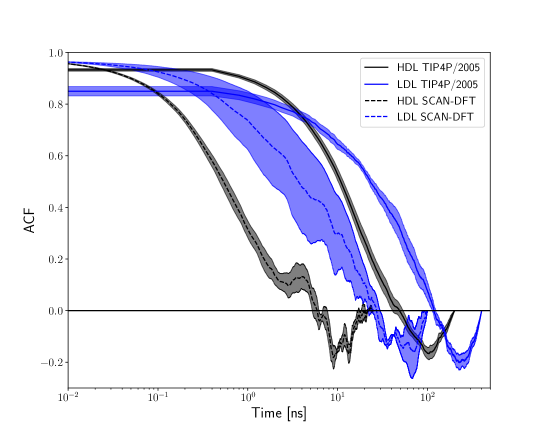
It is beyond the scope of the current contribution to provide a comprehensive analysis of how exactly these differences will manifest in the underlying dynamics associated with the HD-LD transition. We thus attempted to identify some key ingredients associated with the polarization dynamics that we believe warrants further investigation for future studies. Specifically, the autocorrelation of the dipole coming from SCAN appears to display faster relaxation dynamics compared to that of TIP4P/2005 for both the HD and LD phase (see Figure 2 SI). These differences are likely to have important implications on the activation barriers associated with the LLT.
Discussion and Perspectives
In this work, we have taken advantage of state-of-the-art deep neural-network potentials which have recently confirmed the existence of a second critical point in deeply supercooled water. Harnessing these trajectories, we have revisited the putative liquid-liquid second critical point deep in the supercooled regime with specific focus on understanding the role of polarization in this transition.
Our analysis gives rise to a rather intriguing phenomena namely that the LDL phase presents strong propensity to display spontaneous polarization. This behavior is observed both in the structure along the dipole coordinates as well as in the behavior of the dynamics. By employing a recent data-driven approach that automatically detects large angular jumps, we show that the transitions between HDL and LDL appear to be triggered by an accumulation of large reorientational motions in the network.
These findings offer new insights and perspectives on behavior of supercooled water close to its critical point. On one side, it is clear that the kinetics within the LDL phase and transitions to the HDL are strongly modulated not only by the mass density order parameter but also by the polarization. This finding should motivate the design of new experimental probes looking specifically at dielectric anomalies under supercooled conditions.
Besides this, our results also offer new challenges from the computational perspective. Specifically, our results are limited to only sub-microsecond timescales and one would need to deploy enhanced sampling techniques along the density and polarization coordinates to adequately make stronger claims about thermodynamic and dynamical quantities. Finally, from a theoretical and perhaps conceptual side, the dynamical features we observed in the LDL phase are akin to what one observes in glassy systems under supercooling [61, 62, 63] and it remains an open question to the bearing of our results on the glass-transition of liquid water.
Materials and Methods
Molecular dynamics simulations
The trajectories used for the analysis taken from the reference [44], consist of two different NPT simulations of 192 water molecules. The target temperature and pressure are set to 235K and 3200bar respectively and the two trajectories have been initialized with different and independent frames. The system dynamics are propagated by a DNN accurately trained on SCAN-DFT [45] data. The training has been performed with DeePMD-kit [29], while the MD simulations are performed with LAMMPS software [64]. More details on the simulation conditions and the training procedure can be found in reference [44].
Dipole Deep Neural Network
To build the dataset for the training of the dipole DNN model, we collected configurations from different SCAN-DFT simulations of supercooled water performed at different densities and temperatures, ranging from undercooled to ambient conditions. Furthermore, we added frames directly taken from the trajectories of the reference [44], to include specific snapshots of low- and high-density water. We then performed ab initio calculations with the Quantum ESPRESSO™ distribution [65, 66, 67], using the SCAN [45] functional, the plane-wave pseudopotential method, Hamann–Schluter– Chiang–Vanderbilt norm-conserving pseudopotentials [68] with a kinetic-energy cutoff of 150Ry. From the DFT electronic density, we computed the Maximally Localized Wannier Functions (MLWF) [50, 51] using the wannier90 code [69]. The centers of MLWF are called maximally localized Wannier centers (WC), and one can define the dipole of a water molecule as
where , and are the position of the oxygen and hydrogen atoms. Ultimately, refer to the positions of the four WC of the water molecule, one for each pair of valence electrons. Finally, the computed molecular dipoles are used to train the dipole DNN starting from the atomic positions.
The dipole DNN is constructed and trained with the DeePMD-kit [29]. The cutoff radius of the model is set to 6 Å. The size of the embedding and fitting nets are (25, 50, 100) and (100, 100, 100), respectively. The training dataset is made of 5000 water configurations and the model was trained with 2 million steps of stochastic gradient descent.
Angular Jump Analysis and Coordination Defects
In a recent work, some of us developed an approach that uses the time series of the components of the dipole moment of each water molecule and automatically identifies times when there are transitions corresponding to either small or large angular jumps and more generally reorientational dynamics. For more details, the reader is referred to the original Reference[56]. Here we just summarise the essential ingredients behind the procedure.
The analysis relies on using the body fixed dipole vector which is passed through a filtering procedure (see details of filtering protocol in the Supporting Information) to generate another time series . We subsequently proceed to calculate the derivative of using a finite difference approach. Subsequently, we perform a cross product between this derivative vector and to generate a new vector. This new vector corresponds to the direction perpendicular to the plane in which the body-fixed vector rotates
| (1) |
Our methodology defines an angular swing as a process that maintains the plane of rotation of the body-fixed vector unchanged. In other words, during one angular swing, the direction of remains constant. The start and end of swing events are then determined by significant instantaneous alterations in the direction of . Specifically, we examine the following quantity
| (2) |
During the swing, this quantity remains zero. At the start and at the end of the swing, however, this quantity exhibits a non-zero value, indicating a shift in the plane of rotation of the body-fixed vector . As a result, the initiation and termination times of angular swings can be determined by observing peaks in , which align with extremities in the filtered time series, , effectively identifying sudden angular changes. From this analysis, we can essentially accumulate the statistics on the number of angular jumps observed involving angular jumps larger than a certain magnitude .
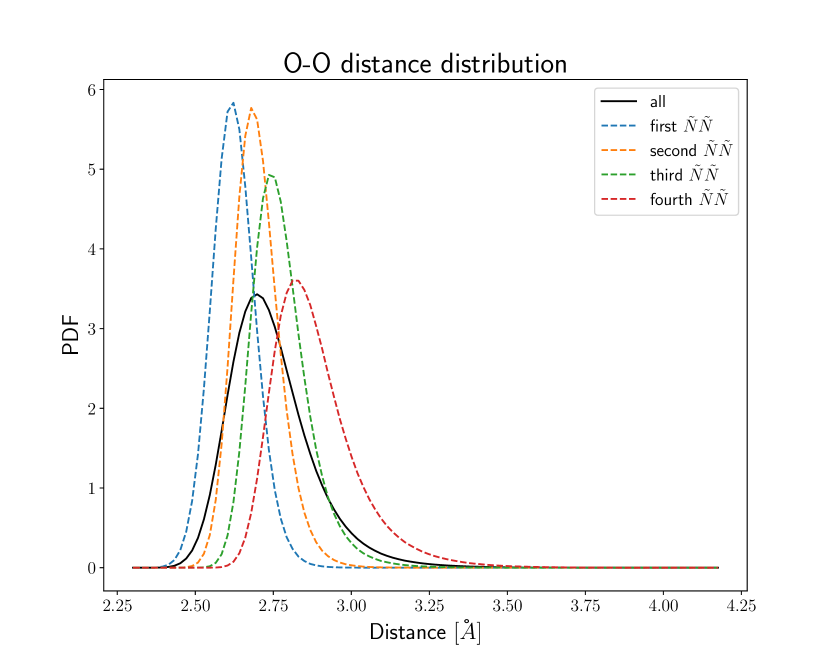
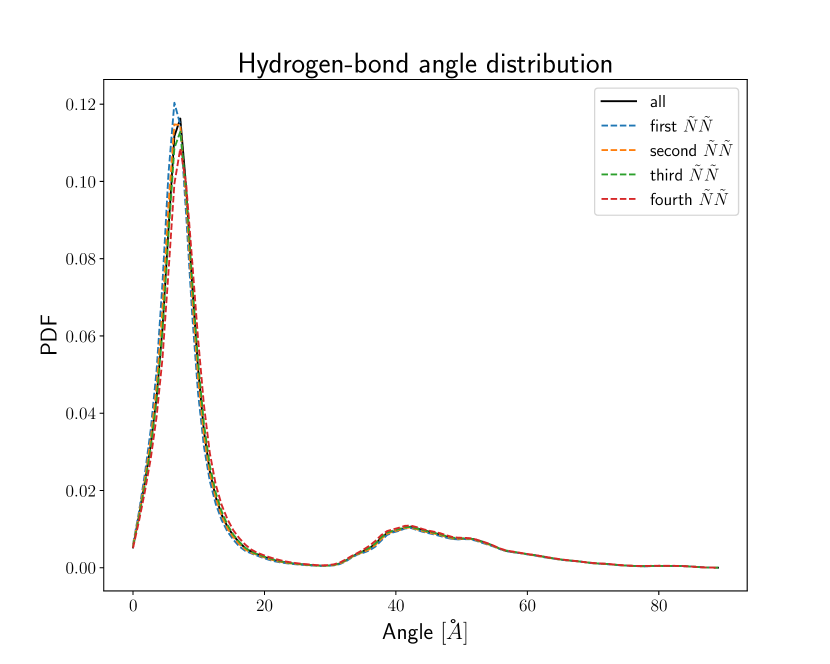
The number of defects was determined by counting the total number of water molecules that are not hydrogen bonded. A geometrical criterion was used which considers two water molecules to be hydrogen bonded when the distance between the donating and accepting oxygen atoms (OD and OA) is within 3.0 Å and the angle formed by the bond vector between the donating hydrogen and oxygen (HD and OD) and the bond vector between OD and OA is less than 60∘. Note that these criteria are different from those used in liquid water at room temperature because of the different thermodynamic conditions being simulated. In the SI (Figure 3) the radial (OD-OA distance) and angular distribution functions of the hydrogen bond angles are shown. Although the absolute number of defects can change depending on the specific thresholds used, the trends are robustly reproduced.
Data Availability
Original data created for the study will be available in a persistent repository upon publication.
Acknowledgement
This work was partially supported by the European Commission through the MaX Centre of Excellence for supercomputing applications (grant number 101093374) and by the Italian MUR, through the PRIN project ARES (grant number 2022W2BPCK) and the Italian National Centre from HPC, Big Data, and Quantum Computing (grant number CN00000013), founded within the Next Generation EU initiative. A.H acknowledges the funding received by the European Research Council (ERC) under the European Union’s Horizon 2020 research and innovation programme (grant number 101043272 - HyBOP). C.M and S.B thank Roberto Car for insightful discussions. All the authors thank Francesco Sciortino for sharing the trajectories for the classical simulations.
Author contributions
C.M., M.G.I., S.B., and A.H. conceive the research; C.M., S.B., and A.H performed research; C.M. analyzed data; N.M. contributed new analysis tools; C.M., S.B., and A.H. wrote the paper.
Competing Interests
No conflict of interests is declared by any of the authors.
References
- [1] Philip Ball “Water as an Active Constituent in Cell Biology” In Chemical Reviews 108.1 American Chemical Society (ACS), 2007, pp. 74–108 DOI: 10.1021/cr068037a
- [2] R. J. Speedy and C. A. Angell “Isothermal compressibility of supercooled water and evidence for a thermodynamic singularity at -45 C” In The Journal of Chemical Physics 65.3, 1976, pp. 851–858 DOI: 10.1063/1.433153
- [3] Osamu Mishima and H. Eugene Stanley “The relationship between liquid, supercooled and glassy water” In Nature 396.6709 Springer ScienceBusiness Media LLC, 1998, pp. 329–335 DOI: 10.1038/24540
- [4] Pablo G Debenedetti “Supercooled and glassy water” In Journal of Physics: Condensed Matter 15.45 IOP Publishing, 2003, pp. R1669–R1726 DOI: 10.1088/0953-8984/15/45/r01
- [5] Anders Nilsson and Lars G. M. Pettersson “The structural origin of anomalous properties of liquid water” In Nature Communications 6.1 Springer ScienceBusiness Media LLC, 2015 DOI: 10.1038/ncomms9998
- [6] John Russo, Kenji Akahane and Hajime Tanaka “Water-like anomalies as a function of tetrahedrality” In Proceedings of the National Academy of Sciences 115.15 Proceedings of the National Academy of Sciences, 2018 DOI: 10.1073/pnas.1722339115
- [7] Rui Shi and Hajime Tanaka “The anomalies and criticality of liquid water” In Proceedings of the National Academy of Sciences 117.43 Proceedings of the National Academy of Sciences, 2020, pp. 26591–26599 DOI: 10.1073/pnas.2008426117
- [8] Peter H. Poole, Francesco Sciortino, Ulrich Essmann and H. Eugene Stanley “Phase behaviour of metastable water” In Nature 360.6402 Springer ScienceBusiness Media LLC, 1992, pp. 324–328 DOI: 10.1038/360324a0
- [9] John Russo and Hajime Tanaka “Understanding water’s anomalies with locally favoured structures” In Nature Communications 5.1 Springer ScienceBusiness Media LLC, 2014 DOI: 10.1038/ncomms4556
- [10] Rui Shi, John Russo and Hajime Tanaka “Common microscopic structural origin for water’s thermodynamic and dynamic anomalies” In The Journal of Chemical Physics 149.22, 2018, pp. 224502 DOI: 10.1063/1.5055908
- [11] Katrin Amann-Winkel et al. “Water’s second glass transition” In Proceedings of the National Academy of Sciences 110.44 Proceedings of the National Academy of Sciences, 2013, pp. 17720–17725 DOI: 10.1073/pnas.1311718110
- [12] Kyung Hwan Kim et al. “Experimental observation of the liquid-liquid transition in bulk supercooled water under pressure” In Science 370.6519 American Association for the Advancement of Science (AAAS), 2020, pp. 978–982 DOI: 10.1126/science.abb9385
- [13] Katrin Amann-Winkel et al. “Liquid-liquid phase separation in supercooled water from ultrafast heating of low-density amorphous ice” In Nature Communications 14.1 Springer ScienceBusiness Media LLC, 2023 DOI: 10.1038/s41467-023-36091-1
- [14] Yang Liu, Athanassios Z. Panagiotopoulos and Pablo G. Debenedetti “Low-temperature fluid-phase behavior of ST2 water” In The Journal of Chemical Physics 131.10 AIP Publishing, 2009 DOI: 10.1063/1.3229892
- [15] Pablo G. Debenedetti, Francesco Sciortino and Gül H. Zerze “Second critical point in two realistic models of water” In Science 369.6501, 2020, pp. 289–292 DOI: 10.1126/science.abb9796
- [16] T. A. Kesselring et al. “Nanoscale Dynamics of Phase Flipping in Water near its Hypothesized Liquid-Liquid Critical Point” In Scientific Reports 2.1 Springer ScienceBusiness Media LLC, 2012 DOI: 10.1038/srep00474
- [17] Peter H. Poole, Richard K. Bowles, Ivan Saika-Voivod and Francesco Sciortino “Free energy surface of ST2 water near the liquid-liquid phase transition” In The Journal of Chemical Physics 138.3 AIP Publishing, 2013 DOI: 10.1063/1.4775738
- [18] Jeremy C. Palmer et al. “Metastable liquid–liquid transition in a molecular model of water” In Nature 510.7505 Springer ScienceBusiness Media LLC, 2014, pp. 385–388 DOI: 10.1038/nature13405
- [19] J. L. F. Abascal and C. Vega “A general purpose model for the condensed phases of water: TIP4P/2005” In The Journal of Chemical Physics 123.23, 2005, pp. 234505 DOI: 10.1063/1.2121687
- [20] Jörg Behler and Michele Parrinello “Generalized Neural-Network Representation of High-Dimensional Potential-Energy Surfaces” In Physical Review Letters 98.14 American Physical Society (APS), 2007 DOI: 10.1103/physrevlett.98.146401
- [21] Tobias Morawietz, Vikas Sharma and Jörg Behler “A neural network potential-energy surface for the water dimer based on environment-dependent atomic energies and charges” In The Journal of Chemical Physics 136.6 AIP Publishing, 2012 DOI: 10.1063/1.3682557
- [22] Tobias Morawietz and Jörg Behler “A Density-Functional Theory-Based Neural Network Potential for Water Clusters Including van der Waals Corrections” In The Journal of Physical Chemistry A 117.32 American Chemical Society (ACS), 2013, pp. 7356–7366 DOI: 10.1021/jp401225b
- [23] Tobias Morawietz, Andreas Singraber, Christoph Dellago and Jörg Behler “How van der Waals interactions determine the unique properties of water” In Proceedings of the National Academy of Sciences 113.30 Proceedings of the National Academy of Sciences, 2016, pp. 8368–8373 DOI: 10.1073/pnas.1602375113
- [24] Bingqing Cheng et al. “Ab initio thermodynamics of liquid and solid water” In Proceedings of the National Academy of Sciences 116.4 Proceedings of the National Academy of Sciences, 2019, pp. 1110–1115 DOI: 10.1073/pnas.1815117116
- [25] Linfeng Zhang et al. “End-to-end symmetry preserving inter-atomic potential energy model for finite and extended systems” In Proceedings of the 32nd International Conference on Neural Information Processing Systems, NIPS’18 Montréal, Canada: Curran Associates Inc., 2018, pp. 4441–4451
- [26] Han Wang, Linfeng Zhang, Jiequn Han and Weinan E “DeePMD-kit: A deep learning package for many-body potential energy representation and molecular dynamics” In Computer Physics Communications 228 Elsevier BV, 2018, pp. 178–184 DOI: 10.1016/j.cpc.2018.03.016
- [27] Linfeng Zhang et al. “Deep Potential Molecular Dynamics: A Scalable Model with the Accuracy of Quantum Mechanics” In Physical Review Letters 120.14 American Physical Society (APS), 2018 DOI: 10.1103/physrevlett.120.143001
- [28] Linfeng Zhang et al. “Deep neural network for the dielectric response of insulators” In Physical Review B 102.4 American Physical Society (APS), 2020 DOI: 10.1103/physrevb.102.041121
- [29] Jinzhe Zeng et al. “DeePMD-kit v2: A software package for deep potential models” In The Journal of Chemical Physics 159.5, 2023, pp. 054801 DOI: 10.1063/5.0155600
- [30] Yuzhi Zhang et al. “DP-GEN: A concurrent learning platform for the generation of reliable deep learning based potential energy models” In Computer Physics Communications 253 Elsevier BV, 2020, pp. 107206 DOI: 10.1016/j.cpc.2020.107206
- [31] Wanrun Jiang, Yuzhi Zhang, Linfeng Zhang and Han Wang “Accurate Deep Potential model for the Al–Cu–Mg alloy in the full concentration space*” In Chinese Physics B 30.5 IOP Publishing, 2021, pp. 050706 DOI: 10.1088/1674-1056/abf134
- [32] Linfeng Zhang, Han Wang, Roberto Car and Weinan E “Phase Diagram of a Deep Potential Water Model” In Physical Review Letters 126.23 American Physical Society (APS), 2021 DOI: 10.1103/physrevlett.126.236001
- [33] Chunyi Zhang et al. “Modeling Liquid Water by Climbing up Jacob’s Ladder in Density Functional Theory Facilitated by Using Deep Neural Network Potentials” In The Journal of Physical Chemistry B 125.41 American Chemical Society (ACS), 2021, pp. 11444–11456 DOI: 10.1021/acs.jpcb.1c03884
- [34] Pablo M. Piaggi, Athanassios Z. Panagiotopoulos, Pablo G. Debenedetti and Roberto Car “Phase Equilibrium of Water with Hexagonal and Cubic Ice Using the SCAN Functional” In Journal of Chemical Theory and Computation 17.5 American Chemical Society (ACS), 2021, pp. 3065–3077 DOI: 10.1021/acs.jctc.1c00041
- [35] Pablo M. Piaggi et al. “Homogeneous ice nucleation in an ab initio machine-learning model of water” In Proceedings of the National Academy of Sciences 119.33 Proceedings of the National Academy of Sciences, 2022 DOI: 10.1073/pnas.2207294119
- [36] R. Li, E. Lee and T. Luo “A unified deep neural network potential capable of predicting thermal conductivity of silicon in different phases” In Materials Today Physics 12 Elsevier BV, 2020, pp. 100181 DOI: 10.1016/j.mtphys.2020.100181
- [37] Davide Tisi et al. “Heat transport in liquid water from first-principles and deep neural network simulations” In Physical Review B 104.22 American Physical Society (APS), 2021 DOI: 10.1103/physrevb.104.224202
- [38] Cesare Malosso et al. “Viscosity in water from first-principles and deep-neural-network simulations” In npj Computational Materials 8.1 Springer ScienceBusiness Media LLC, 2022 DOI: 10.1038/s41524-022-00830-7
- [39] Sandeep K. Reddy et al. “On the accuracy of the MB-pol many-body potential for water: Interaction energies, vibrational frequencies, and classical thermodynamic and dynamical properties from clusters to liquid water and ice” In The Journal of Chemical Physics 145.19 AIP Publishing, 2016 DOI: 10.1063/1.4967719
- [40] Volodymyr Babin, Claude Leforestier and Francesco Paesani “Development of a “First Principles” Water Potential with Flexible Monomers: Dimer Potential Energy Surface, VRT Spectrum, and Second Virial Coefficient” In Journal of Chemical Theory and Computation 9.12 American Chemical Society (ACS), 2013, pp. 5395–5403 DOI: 10.1021/ct400863t
- [41] Volodymyr Babin, Gregory R. Medders and Francesco Paesani “Development of a “First Principles” Water Potential with Flexible Monomers. II: Trimer Potential Energy Surface, Third Virial Coefficient, and Small Clusters” In Journal of Chemical Theory and Computation 10.4 American Chemical Society (ACS), 2014, pp. 1599–1607 DOI: 10.1021/ct500079y
- [42] Gregory R. Medders, Volodymyr Babin and Francesco Paesani “Development of a “First-Principles” Water Potential with Flexible Monomers. III. Liquid Phase Properties” In Journal of Chemical Theory and Computation 10.8 American Chemical Society (ACS), 2014, pp. 2906–2910 DOI: 10.1021/ct5004115
- [43] Thomas E. Gartner et al. “Signatures of a liquid–liquid transition in an ab initio deep neural network model for water” In Proceedings of the National Academy of Sciences 117.42, 2020, pp. 26040–26046 DOI: 10.1073/pnas.2015440117
- [44] Thomas E. Gartner et al. “Liquid-Liquid Transition in Water from First Principles” In Physical Review Letters 129.25 American Physical Society (APS), 2022 DOI: 10.1103/physrevlett.129.255702
- [45] Jianwei Sun, Adrienn Ruzsinszky and John P. Perdew “Strongly Constrained and Appropriately Normed Semilocal Density Functional” In Phys. Rev. Lett. 115 American Physical Society, 2015, pp. 036402 DOI: 10.1103/PhysRevLett.115.036402
- [46] Jianwei Sun et al. “Accurate first-principles structures and energies of diversely bonded systems from an efficient density functional” In Nature Chemistry 8.9 Springer ScienceBusiness Media LLC, 2016, pp. 831–836 DOI: 10.1038/nchem.2535
- [47] Grace M. Sommers et al. “Raman spectrum and polarizability of liquid water from deep neural networks” In Physical Chemistry Chemical Physics 22.19 Royal Society of Chemistry (RSC), 2020, pp. 10592–10602 DOI: 10.1039/d0cp01893g
- [48] Damien Laage and James T. Hynes “A Molecular Jump Mechanism of Water Reorientation” In Science 311.5762 American Association for the Advancement of Science (AAAS), 2006, pp. 832–835 DOI: 10.1126/science.1122154
- [49] R. Resta and D. Vanderbilt “Theory of Polarization: A Modern Approach” In Physics of Ferroelectrics: a Modern Perspective Berlin: Springer-Verlag, 2007, pp. 31–68
- [50] Nicola Marzari and David Vanderbilt “Maximally localized generalized Wannier functions for composite energy bands” In Phys. Rev. B 56 American Physical Society, 1997, pp. 12847–12865 DOI: 10.1103/PhysRevB.56.12847
- [51] Ivo Souza, Nicola Marzari and David Vanderbilt “Maximally localized Wannier functions for entangled energy bands” In Phys. Rev. B 65 American Physical Society, 2001, pp. 035109 DOI: 10.1103/PhysRevB.65.035109
- [52] Niels Bjerrum “Structure and Properties of Ice” In Science 115.2989 American Association for the Advancement of Science (AAAS), 1952, pp. 385–390 DOI: 10.1126/science.115.2989.385
- [53] Maurice Koning “Crystal imperfections in ice Ih” In The Journal of Chemical Physics 153.11 AIP Publishing, 2020 DOI: 10.1063/5.0019067
- [54] Francesco Sciortino, Alfons Geiger and H. Eugene Stanley “Effect of defects on molecular mobility in liquid water” In Nature 354.6350 Springer ScienceBusiness Media LLC, 1991, pp. 218–221 DOI: 10.1038/354218a0
- [55] F. Sciortino, P. Gallo, P. Tartaglia and S. H. Chen “Supercooled water and the kinetic glass transition” In Phys. Rev. E 54 American Physical Society, 1996, pp. 6331–6343 DOI: 10.1103/PhysRevE.54.6331
- [56] Adu Offei-Danso et al. “The collective burst mechanism of angular jumps in liquid water” In Nature Communications 14.1 Springer ScienceBusiness Media LLC, 2023 DOI: 10.1038/s41467-023-37069-9
- [57] Alenka Luzar and David Chandler “Hydrogen-bond kinetics in liquid water” In Nature 379.6560 Springer ScienceBusiness Media LLC, 1996, pp. 55–57 DOI: 10.1038/379055a0
- [58] Bowen Han, Christine M. Isborn and Liang Shi “Incorporating Polarization and Charge Transfer into a Point-Charge Model for Water Using Machine Learning” PMID: 37067482 In The Journal of Physical Chemistry Letters 14.16, 2023, pp. 3869–3877 DOI: 10.1021/acs.jpclett.3c00036
- [59] Richard C. Remsing et al. “The Role of Broken Symmetry in Solvation of a Spherical Cavity in Classical and Quantum Water Models” In The Journal of Physical Chemistry Letters 5.16 American Chemical Society (ACS), 2014, pp. 2767–2774 DOI: 10.1021/jz501067w
- [60] Steven W. Rick and Ward H. Thompson “Effects of polarizability and charge transfer on water dynamics and the underlying activation energies” _eprint: https://pubs.aip.org/aip/jcp/article-pdf/doi/10.1063/5.0151253/17579828/194504_1_5.0151253.pdf In The Journal of Chemical Physics 158.19, 2023, pp. 194504 DOI: 10.1063/5.0151253
- [61] Ludovic Berthier and Giulio Biroli “Theoretical perspective on the glass transition and amorphous materials” In Rev. Mod. Phys. 83 American Physical Society, 2011, pp. 587–645 DOI: 10.1103/RevModPhys.83.587
- [62] L. Berthier et al. “Spontaneous and induced dynamic fluctuations in glass formers. I. General results and dependence on ensemble and dynamics” In The Journal of Chemical Physics 126.18 AIP Publishing, 2007 DOI: 10.1063/1.2721554
- [63] L. Berthier et al. “Spontaneous and induced dynamic correlations in glass formers. II. Model calculations and comparison to numerical simulations” In The Journal of Chemical Physics 126.18 AIP Publishing, 2007 DOI: 10.1063/1.2721555
- [64] Aidan P. Thompson et al. “LAMMPS - a flexible simulation tool for particle-based materials modeling at the atomic, meso, and continuum scales” In Computer Physics Communications 271 Elsevier BV, 2022, pp. 108171 DOI: 10.1016/j.cpc.2021.108171
- [65] Paolo Giannozzi et al. “QUANTUM ESPRESSO: a modular and open-source software project for quantum simulations of materials” In Journal of Physics: Condensed Matter 21.39, 2009, pp. 395502 (19pp) URL: http://www.quantum-espresso.org
- [66] P Giannozzi et al. “Advanced capabilities for materials modelling with QUANTUM ESPRESSO” In Journal of Physics: Condensed Matter 29.46, 2017, pp. 465901 URL: http://stacks.iop.org/0953-8984/29/i=46/a=465901
- [67] Paolo Giannozzi et al. “Quantum ESPRESSO toward the exascale” In The Journal of Chemical Physics 152.15, 2020, pp. 154105 DOI: 10.1063/5.0005082
- [68] D. R. Hamann “Optimized norm-conserving Vanderbilt pseudopotentials” In Phys. Rev. B 88 American Physical Society, 2013, pp. 085117 DOI: 10.1103/PhysRevB.88.085117
- [69] Giovanni Pizzi et al. “Wannier90 as a community code: new features and applications” In Journal of Physics: Condensed Matter 32.16 IOP Publishing, 2020, pp. 165902 DOI: 10.1088/1361-648x/ab51ff
SUPPLEMENTARY INFORMATION
1 Results for TIP4P/2005 simulations
We analyzed the coupling between the density and dipole over a microsecond-long TIP4P/2005 water simulation at nearly supercritical conditions - 177K and 1750bar [15]. The dipole has been computed from the atomic coordinates and the point charges built into the model. The result of this analysis is shown in Fig. 8 a). The different subplots show the temporal evolution of the density of the system (top), the time series of each component of the total dipole (middle), and finally of its modulus (bottom). In Figure 8 b), the density and the three equivalent components of the dipole are illustrated through a two-dimensional probability distribution.
In Fig. 9 we report the total dipole auto-correlation function (ACF) for both the TIP4P/2005 and the SCAN-DFT simulations [44]. The ACF is computed as:
2 Filtering Time Series
To reduce the noise arising from high-frequency fluctuations in the dipole components, we applied a second-order low-pass digital butterworth filter (implemented using the SciPy.signal package in Python), engineered to maintain a near-flat frequency response within the passband. Sampling of the trajectories occurred every 5 picoseconds (ps), with a cutoff frequency set at 10GHz (1/100 in inverse ps), corresponding to the frequency at which the magnitude response of the filter reaches its threshold. In contrast to the room temperature, relaxation dynamics is much slower and hence one does not need a small time-step for processing the trajectories.
In addition to this initial filtering step aimed at reducing noise and preserving essential signal components, we further refined the trajectories by applying a mean filter using the smooth function with a span of 20 data points (equivalent to a time window of 100 ps). This additional smoothing procedure facilitated the subsequent automated detection of angular swings by ensuring smoother trajectories.
Moreover, during the post-processing phase of the defect fractions and the count of swings within the time series, we introduced an extra layer of filtering using a low-pass butterworth filter with a cutoff frequency of 0.05GHz (1/20000 in inverse ps). This supplementary filtering step enabled us to effectively capture fluctuations occurring on the nanosecond (ns) scale.