MSciNLI: A Diverse Benchmark for Scientific Natural Language Inference
Abstract
The task of scientific Natural Language Inference (NLI) involves predicting the semantic relation between two sentences extracted from research articles. This task was recently proposed along with a new dataset called SciNLI derived from papers published in the computational linguistics domain. In this paper, we aim to introduce diversity in the scientific NLI task and present MSciNLI, a dataset containing sentence pairs extracted from five new scientific domains. The availability of multiple domains makes it possible to study domain shift for scientific NLI. We establish strong baselines on MSciNLI by fine-tuning Pre-trained Language Models (PLMs) and prompting Large Language Models (LLMs). The highest Macro F1 scores of PLM and LLM baselines are and , respectively, illustrating that MSciNLI is challenging for both types of models. Furthermore, we show that domain shift degrades the performance of scientific NLI models which demonstrates the diverse characteristics of different domains in our dataset. Finally, we use both scientific NLI datasets in an intermediate task transfer learning setting and show that they can improve the performance of downstream tasks in the scientific domain. We make our dataset and code available on Github.111https://github.com/msadat3/MSciNLI
1 Introduction
Natural Language Inference (NLI) Bowman et al. (2015) or Textual Entailment is the task of recognizing the semantic relation between a pair of sentences where the first sentence is called premise and the second sentence is called hypothesis. Traditional NLI datasets such as SNLI Bowman et al. (2015), MNLI Williams et al. (2018a), SICK Marelli et al. (2014), and ANLI Nie et al. (2019) classify the premise-hypothesis pairs into one of three classes indicating whether the hypothesis entails, contradicts or is neutral to the premise. These datasets have been used both as a benchmark for Natural Language Understanding (NLU) and to improve downstream tasks such as fact verification Martín et al. (2022) and fake news detection Sadeghi et al. (2022). In addition, they have aided in the advancement of representation learning Conneau et al. (2017), transfer learning Pruksachatkun et al. (2020), and multi-task learning Liu et al. (2019a).
However, since the examples in these datasets are derived from non-specialized domains, e.g., image captions, they do not capture the unique linguistic characteristics of different specialized domains such as the scientific domain. More recently, Sadat and Caragea (2022b) introduced the task of scientific NLI along with the first dataset for this task named SciNLI, which contains sentence pairs extracted exclusively from scientific papers related to computational linguistics published in the ACL anthology Bird et al. (2008); Radev et al. (2009). To capture the inferences that frequently occur in scientific text, Sadat and Caragea (2022b) extended the three classes in traditional NLI to four classes for scientific NLI—entailment, reasoning, contrasting, and neutral. Since its introduction, SciNLI has gained great interest in the research community Wang et al. (2022); Deka et al. (2022); Wu et al. (2023).
Despite introducing a challenging task and enabling the exploration of NLI with scientific text, SciNLI lacks the diversity to serve as a general purpose scientific NLI benchmark because it is limited to a single domain (ACL). Moreover, due to the unavailability of multiple domains, SciNLI is not suitable for studying domain adaptation and transfer learning on scientific NLI.
To this end, in this paper, we propose MSciNLI, a scientific NLI dataset containing sentence pairs extracted from papers published in five different domains: “Hardware”, “Networks”, “Software & its Engineering”, “Security & Privacy”, and “NeurIPS.” Similar to Sadat and Caragea (2022b), we use a distant supervision method that exploits the linking phrases between sentences in scientific papers to construct a large training set and directly use these potentially noisy sentence pairs during training. For the test and development sets, we manually annotate and examples, respectively, to create high quality evaluation data for scientific NLI.
We evaluate the difficulty of MSciNLI by experimenting with a BiLSTM based model. We then establish strong baselines on MSciNLI by a) fine-tuning four transformer based Pre-trained Language Models (PLMs): BERT Devlin et al. (2019), SciBERT Beltagy et al. (2019), RoBERTa Liu et al. (2019b) and XLNet Yang et al. (2019); and b) prompting two Large Language Models (LLMs) in both zero-shot and few-shot settings: Llama-2 Touvron et al. (2023), and Mistral Jiang et al. (2023). Furthermore, we provide a comprehensive investigation into the robustness of scientific NLI models by evaluating their performance under domain-shift at test time. Finally, we explore both SciNLI and MSciNLI in an intermediate task transfer learning setting Pruksachatkun et al. (2020) to evaluate their usefulness in improving the performance of other downstream tasks.
Our key findings are: a) MSciNLI is more challenging than SciNLI; b) the best performing PLM baseline, which is based on RoBERTa, shows a Macro F1 of on MSciNLI indicating the challenging nature of the task and a substantial headroom for improvement; c) the best performing LLM baseline with Llama-2 shows a Macro F1 of only indicating that our dataset can be used to benchmark the NLU and complex reasoning capabilities of powerful LLMs; d) domain-shift at test time reduces the performance; and e) diversity in the scientific NLI datasets helps toimprove the performance of downstream tasks.
2 Related Work
Since the introduction of the NLI task, many datasets derived from different data sources have been made available. Datasets such as RTE Dagan et al. (2006) and SICK Marelli et al. (2014) were instrumental in the progress of NLI research in its earlier days. However, the training set sizes of these datasets are too small for large scale deep learning modeling. SNLI Bowman et al. (2015) was introduced as a large dataset for NLI. SNLI contains K sentence pairs where premises are extracted from image captions and human crowdworkers were employed to write the hypotheses and assign the labels. While SNLI is significantly larger than all other prior datasets, due to the premises being extracted from a single source, it lacks the diversity to serve as a challenging and general purpose NLU benchmark. Consequently, Williams et al. (2018b) introduced MNLI containing K sentence pairs where the premises are extracted from a diverse number of sources such as face-to-face conversations, travel guides, and the 9/11 event. Apart from the premise sources, both SNLI and MNLI are constructed in a similar fashion and are the most popular NLI datasets in the recent years.
| Domain | First Sentence | Second Sentence | Class |
| NeurIPS | A number of psychological studies have suggested that our brains indeed perform causal inference as an ideal observer (e.g., [10, 12–14]). | However, it has been challenging to come up with a simple and biologically plausible neural implementation for causal inference. | Contrasting |
| \hdashlineNetworks | Researchers found out that the inhomogeneity in the spatio-temporal distribution of the data traffic leads to extremely insufficient utilization of network resources. | Thus, it is important to fundamentally understand this distribution to help us make better resource planning or introduce new management tools such as time-dependent pricing to reduce the congestion. | Reasoning |
| \hdashlineHardware | Scaling PCM in deep sub-micron regime faces non-negligible inter-cell thermal interference during programming, referred to as write disturbance (WD) phenomenon. | That is, the heat generated for writing one cell may disseminate beyond this cell and disturb the resistance states of its neighboring cells. | Entailment |
| \hdashlineSecurity & Privacy | Following Google’s best practices for developing secure apps, the password database is saved in the app data folder, which should be accessible only to the app itself. | this defines a hierarchical relationship between domains where the bounded domain cannot have more permissions than its bounding domain (the parent). | Neutral |
| \hdashline Software & its Engineering | If the delete operation is complex, then it advances to the discovery mode after which it will advance to the cleanup mode. | On the other hand, if it is simple, then it directly advances to the cleanup mode (and skips the discovery mode). | Contrasting |
Other NLI datasets include QNLI Wang et al. (2018)—derived from the SQuaD Rajpurkar et al. (2016) question-answering dataset; XNLI Conneau et al. (2018)—a cross lingual evaluation corpus derived by translating examples from MNLI; ANLI Nie et al. (2020)—constructed in an iterative adversarial fashion to reduce spurious patterns where human annotators develop examples that can cause the model to make errors in each iteration; SciTail Khot et al. (2018)—derived from a school level science question-answer corpus in which the sentence pairs are classified into two classes: entailment or not-entailment. These datasets have also seen wide applications both as NLU benchmarks and to improve other downstream NLP tasks. However, none of these datasets contains sentences from scientific text that is found in research articles. Moreover, the classes in these datasets are not sufficient to study the inter-sentence inferences and complexities that occur frequently in scientific text.
Thus, to capture both the particularities in scientific text and provide coverage to the frequently occurring inter-sentence semantic relations, Sadat and Caragea (2022b) introduced SciNLI. The sentence pairs in SciNLI were extracted from papers published in the ACL anthology Radev et al. (2009) using distant supervision based on different linking phrases. Given that SciNLI was derived from a single data source (ACL), it also lacks the necessary diversity in the data. Therefore, with a similar motivation behind constructing MNLI—to extend SNLI to multiple domains, we propose MSciNLI, the first diverse benchmark for scientific NLI, to extend SciNLI to multiple domains. The availability of multiple domains in MSciNLI enables the evaluation of the models’ generalization ability under domain shift.
Recently, LLMs have demonstrated near human performance in many NLP tasks including NLI. For example, Zhong et al. (2023) reported that ChatGPT222https://chat.openai.com/ shows a zero-shot accuracy of on RTE and on the matched test set of MNLI. Thus, developing benchmark tasks and datasets which are challenging for even powerful LLMs is paramount. While the primary goal of our dataset is to introduce diversity in scientific NLI, because of the complex reasoning and inference required to predict the semantic relation between a pair of sentences from scientific text, it can serve as a challenging benchmark even for powerful LLMs.
3 MSciNLI: A Multi-Domain Scientific NLI Benchmark
In this section, we describe the data sources for MSciNLI, its construction process and statistics.
3.1 Data Sources
We derive MSciNLI from the papers published in four categories of the ACM digital library333https://dl.acm.org/ — ‘Hardware’, ‘Networks’, ‘Software and its Engineering’, ‘Security and Privacy’ and the papers published in the NeurIPS444https://papers.nips.cc/ conference. Table 1 shows examples of sentence pairs extracted from our five domains. Further details on our data sources (e.g., publication years of the papers) are available in Appendix A.1.
3.2 Data Extraction and Automatic Distant Supervision Labeling
We closely follow the data extraction and automatic labeling procedure based on distant supervision proposed by Sadat and Caragea (2022b). Specifically, we use linking phrases between sentences (e.g., “Therefore”, “Thus”, “In contrast”, etc.) to automatically annotate a large (potentially noisy) training set with the NLI relations. The complete list of linking phrases and their mapping to the NLI relations are presented in Appendix A.2. The procedure is detailed below.
For the Entailment, Contrasting, and Reasoning classes, we extract adjacent sentence pairs from the papers collected from our five domains such that the second sentence starts with a linking phrase. For each extracted sentence pair, the relation corresponding to the linking phrase at the beginning of the second sentence is assigned as its class label. For example, if the second sentence starts with ‘Therefore’ or ‘Consequently’, the example is labeled as Reasoning. Note that the linking phrase is removed from the second sentence after assigning the label to prevent the models from predicting the label by simply learning a superficial correlation between the linking phrase and the label and without actually learning the semantic relation.
For the Neutral class, we construct the sentence pairs by extracting both sentences in the pair from the same paper using three approaches as follows: a) two random sentences that do not begin with any linking phrase are paired together; b) a random sentence which does not begin with any linking phrase is chosen as the first sentence and is paired with the second sentence of a random pair that belongs to one of the other three classes; c) a random sentence which does not begin with any linking phrase is chosen as the second sentence and is paired with the first sentence of a random pair that belongs to one of the other three classes.
After extracting the sentence pairs for all four classes, we randomly split them at paper level into train, test and development sets (to ensure that the sentence pairs extracted from a certain paper end up in a single set). We directly use the automatically annotated examples for training the models. However, our use of distant supervision during the construction of the training set may introduce label noise when the relation between a pair of sentences is not accurately captured by the linking phrase. Therefore, to ensure a realistic evaluation, we employ human annotators to manually annotate the sentence pairs in the test and dev sets with one of the four scientific NLI relations as described below.
3.3 Multi-domain Scientific NLI Test and Development Set Creation
| #Examples | #Words | ‘S’ parser | Word | ||||||
| Domain | Train | Dev | Test | Prem. | Hyp. | Prem. | Hyp. | Overlap | Agrmt. |
| SciNLI (ACL) | 101,412 | 2,000 | 4,000 | 27.38 | 25.93 | 96.8% | 96.7% | 30.06% | 85.8% |
| Hardware | 25,464 | 200 | 800 | 26.10 | 24.59 | 94.3% | 94.5% | 30.52% | 84.6% |
| Networks | 25,464 | 200 | 800 | 26.37 | 25.01 | 93.9% | 93.7% | 30.17% | 90.5% |
| Software & its Engineering | 25,464 | 200 | 800 | 25.80 | 24.51 | 93.9% | 94.1% | 29.83% | 86.5% |
| Security & Privacy | 25,464 | 200 | 800 | 26.14 | 24.50 | 94.0% | 94.2% | 29.91% | 90.4% |
| NeurIPS | 25,464 | 200 | 800 | 29.80 | 29.66 | 96.0% | 95.1% | 31.04% | 88.5% |
| MSciNLI Overall | 127,320 | 1,000 | 4,000 | 26.84 | 25.85 | 94.4% | 94.3% | 30.29% | 88.0% |
Three expert annotators (see Appendix A.3 for more details about the annotators and the instructions) are employed to annotate the test and dev sets of MSciNLI. Specifically, a random subset (balanced over the classes) of sentence pairs from the test and dev sets are given to the three annotators who are instructed to annotate their labels (the relation between the sentences) based only on the context available in the two sentences in each example. If the annotators are unable to determine the label based on the two sentences of a pair, they mark it as unclear. We assign a gold label to each example based on the majority vote from the annotators. In rare cases () where there is no consensus among the annotators for an example, we do not assign a gold label. The examples for which there is a match between the gold label and the automatically assigned label (based on linking phrases) are included in their respective split and the rest are filtered out.
For each domain, we continue sampling random subsets (without replacement) of examples and manually annotate them until we have at least clean examples ( from each class) in the test set and clean examples ( from each class) in the dev set. In total, we annotate examples (all domains combined), among which have an agreement between the gold label and the automatically assigned label. That is, the overall agreement rate for MSciNLI is . Moreover, we find a Fleiss-k score of for MSciNLI indicating substantial agreement among the annotators Landis and Koch (1977).
Data Balancing
To ensure equal representation, the number of examples per class in each domain are downsampled to a size of and in the test and dev set, respectively. Consequently, we end up with a combined (over the domains) test and dev sets of and examples, respectively (balanced over the classes and domains). We balance the training set by using a similar procedure.
3.4 Data Statistics
We show a comparison of key statistics of our dataset with the SciNLI dataset in Table 2.
Dataset Size
We can see that the total number of examples (<premise, hypothesis> pairs) in MSciNLI is higher than that in SciNLI, the only NLI dataset over scientific text. Moreover, each domain in MSciNLI has a large number of examples in the training set which enables exploration of NLI in-domain as well as across domains.
Sentence Parses
Token Overlap
The percentage of word overlap between the premise and hypothesis in each pair in MSciNLI is also low and close to that of SciNLI as shown in Table 2. Thus, like SciNLI, our MSciNLI dataset is also less vulnerable to surface level lexical cues.
4 MSciNLI Evaluation
Our main experiments for evaluating MSciNLI consists of three stages. First, we evaluate its difficulty by experimenting with a BiLSTM model (§4.1). Next, we establish strong baselines on MSciNLI with four Pre-trained Language Models (PLMs) and two Large Language Models (LLMs), and compare them with human performance (§4.2). Finally, we analyze our best performing baseline by investigating its performance when it is fine-tuned on various subsets of the training set and its performance under domain shift (§4.3). Our implementation details are given in Appendix B. Additional experiments on the impact of dataset size and diversity in model training; performance of another LLM; spurious correlations Gururangan et al. (2018); and class-wise performances of the baselines are shown in Appendix C.
4.1 Difficulty Evaluation
BiLSTM Model
MSciNLI is more challenging than SciNLI.
We can see that the Macro F1 of the BiLSTM model for SciNLI is whereas it is only for MSciNLI (the model is trained on the combined MSciNLI training set). These results indicate that MSciNLI presents a broader range of challenges for the model compared with SciNLI, making the scientific NLI task more difficult.
4.2 Baselines
Here, we describe the baseline models for MSciNLI and discuss their performance.
4.2.1 PLM Baselines
We fine-tune the base variants of the following PLMs on the combined MSciNLI training set: BERT Devlin et al. (2019); SciBERT Beltagy et al. (2019); (c) RoBERTa Liu et al. (2019b); and (d) XLNet Yang et al. (2019). We run each experiment with the PLM baselines three times with different random seeds and report the average and standard deviation of their domain-wise and overall Macro F1 scores in Table 4. Our findings are described below.
Domain specific pre-training helps improve the performance.
We can see that SciBERT shows a better performance than BERT in all domains. Note that SciBERT does not address any weaknesses of BERT and is trained using the same procedure as BERT, except SciBERT exclusively uses scientific text for pre-training whereas BERT is trained on the BookCorpus and Wikipedia. Thus, pre-training on scientific documents helps improve the performance of scientific NLI.
| Dataset | F1 | Acc |
| SciNLI (ACL) | ||
| \hdashlineMSciNLI | ||
| xxx-Hardware | ||
| xxx-Networks | ||
| xxx-Software & its Engineering | ||
| xxx-Security & Privacy | ||
| xxx-NeurIPS | ||
| \hdashlinexxx-Overall |
“Robust” pre-training leads to better performance.
Both RoBERTa and XLNet are designed to address different weaknesses of BERT. RoBERTa focuses on optimizing the model in a more robust manner during pre-training while XLNet aims at incorporating auto-regressive nature of natural language without removing bi-directional context. Both of these models substantially outperform BERT in all domains and RoBERTa consistently outperforms XLNet. We can also observe that RoBERTa leads to even better performance compared with SciBERT in most cases.
| Model | Hardware | Networks | SWE | Security | NeurIPS | Overall |
| BERT | ||||||
| SciBERT | ||||||
| XLNet | ||||||
| RoBERTa |
| Model | Prompt | Hardware | Networks | SWE | Security | NeurIPS | Overall |
| Llama-2 | Prompt - 1zs | ||||||
| Prompt - 2zs | |||||||
| Prompt - 3zs | |||||||
| \hdashline | Prompt - 1fs | ||||||
| Prompt - 2fs | |||||||
| Prompt - 3fs | |||||||
| Mistral | Prompt - 1zs | ||||||
| Prompt - 2zs | |||||||
| Prompt - 3zs | |||||||
| \hdashline | Prompt - 1fs | ||||||
| Prompt - 2fs | |||||||
| Prompt - 3fs |
4.2.2 LLM Baselines
We experiment with two LLMs as baselines for our dataset: (a) Llama-2 Touvron et al. (2023) and (b) Mistral Jiang et al. (2023). More specifically, we use the Llama-2-13b-chat-hf and Mistral-7B-Instruct-v0.1 variants of Llama-2 and Mistral, containing billion and billion parameters, respectively. Both of these models are chosen because of their success in many NLP tasks that require complex reasoning and problem solving (e.g., the MMLU benchmark Hendrycks et al. (2021)).
We construct multiple-choice question templates for the scientific NLI task to be used for prompting the LLMs:
-
•
Prompt - 1: this prompt asks the LLMs to predict the class given a sentence pair with the four class names as the choices.
-
•
Prompt - 2: to provide further context to the LLMs about the scientific NLI task, this prompt first defines the scientific NLI classes and then poses the question to predict the class with the class names as the choices.
-
•
Prompt - 3: instead of providing the definitions of the classes first and then asking a question with the class names as the choices, this prompt directly uses the class definitions as the choices.
The three prompt templates can be seen in Appendix D. We evaluate the performance of the LLMs in two settings: a) zero-shot: no input-output exemplars are shown to the model; b) few-shot: four input-human-annotated output exemplars (one for each class) are pre-pended to the prompt to evaluate the LLMs’ in-context learning Brown et al. (2020) ability for scientific NLI. The zero-shot and few-shot versions of each prompt is denoted as Prompt - zs, and Prompt - fs, respectively.
We employ a greedy decoding strategy for all of our LLM based experiments and report the domain-wise and the overall Macro F1 scores of each experiment in Table 5. We find the following:
Llama-2 performs better than Mistral.
We can see that Llama-2 with Prompt - 3fs shows the best performance among all of our LLMs with a Macro F1 of . This is higher than the best performance shown by Mistral with Prompt - 1fs. Thus, Llama-2 with its B parameters has more complex reasoning capability compared to Mistral with its B parameters.
Using class-definitions as choices in the prompt and the few-shot prompt variants improve the performance.
We can see that the performance of both LLMs are generally better when we use Prompt - 3. This indicates that using the class definitions as the potential choices in the multiple-choice question is more suitable for the models, resulting in better performance. We can also see that the few-shot variants of the prompts generally outperform their zero-shot counterparts. Thus, both LLMs are capable of in-context learning and providing few examples can boost their performance.
Scientific NLI is highly challenging for state-of-the-art LLMs
Despite the promising few-shot performance, based on the results in Table 5, it is evident that the task of scientific NLI is highly challenging even for powerful LLMs. Therefore, our dataset along with SciNLI can serve as a challenging evaluation benchmark for LLMs.
| Method | Macro F1 | Accuracy |
| RoBERTa | ||
| Llama-2 | ||
| \hdashlineHuman - E (est.) | ||
| Human - NE (est.) |
4.2.3 Human Performance
We hire three expert annotators (with relevant domain-specific background) and three non-expert annotators (with no background in any of the five domains) to evaluate the human performance on MSciNLI. Note that these expert and non-expert annotators are not involved in our dataset construction process (see Appendix A.3 for more details). Following other popular benchmarks (e.g., SuperGLUE Wang et al. (2019)), we estimate the human performance by re-annotating a small randomly sampled subset of our test set. Each example in the subset is re-annotated by expert and non-expert annotators following the same data annotation procedure described in Section 3.3. We report the average and the standard deviation of the expert and non-expert performances (Macro F1) on this subset, and compare them with the best performing PLM baseline, RoBERTa, and the best performing LLM baseline, Llama-2 with Prompt - 3fs in Table 6. Our findings are described below:
Experts outperform non-experts, and a substantial gap exists between model performance and human expert performance.
As expected, expert annotators with the relevant domain-specific knowledge substantially outperform the non-expert annotators. Despite the lower performance by the non-experts (compared with experts), we can see that they still outperform our baselines. Furthermore, the performance by the experts is significantly higher than both RoBERTa and Llama-2. Therefore, there is a substantial headroom for improving the models’ performance which can foster future research on scientific NLI.
4.3 Analysis
In this section, first, we diagnose the MSciNLI training set by fine-tuning separate models using different training subsets selected by performing data cartography Swayamdipta et al. (2020) (§4.3.1). Next, we study the model behavior under domain shift at test time (§4.3.2). Finally, we perform cross-dataset experiments where we analyze the performance of models fine-tuned on SciNLI, MSciNLI, and their combination (§4.3.3). We choose our best performing baseline model, RoBERTa for these experiments.
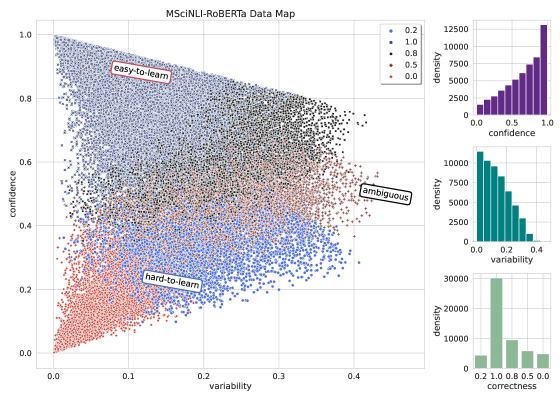
4.3.1 Data Cartography Experiments
We perform a data cartography of MSciNLI to characterize each example in the training set using two metrics — confidence and variability. Based on this characterization, inspired by Swayamdipta et al. (2020), first, we fine-tune three different RoBERTa models using the following subsets of the training set: 1) easy-to-learn — examples with high confidence; 2) hard-to-learn — examples with low confidence; 3) ambiguous — examples with high variability (the detailed method used for selecting these subsets of training examples is available in Appendix E). In addition, to further understand the effect of hard-to-learn examples in model training, we fine-tune two other models using the full training set minus — 1) top hard-to-learn ( examples with lowest confidence) and 2) top hard-to-learn examples ( examples with lowest confidence), denoted as ‘ top hard’, and ‘ top hard’, respectively. The results are shown in Table 7. We find the following.
| Data Subset | Macro F1 | Accuracy |
| \hdashline easy-to-learn | ||
| hard-to-learn | ||
| ambiguous | ||
| \hdashline top hard | ||
| top hard |
Ambiguous examples yield stronger models while the full training set yields better performance.
We can see that the model fine-tuned on the ambiguous examples shows the best performance among the subsets. Therefore, ‘ambiguousness’ in the training examples helps train stronger scientific NLI models. Despite the strong performance shown by ambiguous, its Macro F1 is still lower than the of the training set. Furthermore, although hard-to-learn shows a poor performance ( in Macro F1), removing a percentage of them (e.g., , and in the bottom block of Table 7) from the of the training set does not result in any statistically significant difference in performance compared with . Therefore, all examples in the training set are useful for training the most optimal model.
4.3.2 Out-of-domain Experiments
Here, we train RoBERTa on one domain and test it on another domain (out-of-domain) and contrast it with the RoBERTa trained and tested on the same domain (in-domain). In addition to the five domains in MSciNLI, we also experiment with the ACL domain from SciNLI. For a fair comparison with the other domains, we downsample the training set from SciNLI to the same size as that of the other domains and denote it as ACL - small. Both in-domain (ID) and out-of-domain (OOD) results are shown in Table 8. Our findings are described below:
| Hardware | Networks | SWE | Security | NeurIPS | ACL | |
| Hardware | ||||||
| Networks | ||||||
| SWE | ||||||
| Security | ||||||
| NeurIPS | ||||||
| ACL - small |
| SciNLI | MSciNLI | MSciNLI+ | |
| SciNLI | |||
| \hdashlineMSciNLI | |||
| \hdashlineMSciNLI+ (s) | |||
| MSciNLI+ | 79.48 | 78.07 | 78.76 |
The domain shift reduces the performance.
In general, for each domain, the ID model shows a higher performance than their OOD counterparts (see each column in Table 8). For example, the model fine-tuned on the NeurIPS training set shows a Macro F1 of when it is tested on NeurIPS as well. The performance sees a decline when the models trained on other domains are tested on NeurIPS (e.g., with the Networks model). This indicates that the sentence pairs in each domain exhibit unique linguistic characteristics which are better captured by a model trained on in-domain data.
4.3.3 Cross-dataset Experiments
For the cross-dataset experiments, we train four separate RoBERTa models on: 1) SciNLI, 2) MSciNLI, 3) MSciNLI+ (s) - a combination of MSciNLI and ACL - small, and 4) MSciNLI+ - a combination of MSciNLI and SciNLI. All four models are then evaluated using the separate SciNLI and MSciNLI test sets, and their combination i.e., the MSciNLI+ test set. The results are reported in Table 9. We also evaluate the models on the domain-wise test sets, and general domain NLI datasets, and report the results in Appendix F.
Diverse training data leads to robust models.
The performance sees a decline for both SciNLI and MSciNLI under ‘dataset-shift.’ However, the model fine-tuned with SciNLI shows a higher drop in performance compared with the model fine-tuned with MSciNLI in the out-of-dataset setting. Specifically, the out-of-dataset Macro F1 of the model fine-tuned with SciNLI (when it is tested on MSciNLI) drops by from the in-dataset performance of MSciNLI (). In contrast, the out-of-dataset Macro F1 of the model fine-tuned with MSciNLI (when it is tested on SciNLI) drops by only from the in-dataset performance of SciNLI (). This indicates that the diversity in the data can train more robust scientific NLI models with stronger generalization capabilities.
Combining the datasets yields the best performance.
The best performance for both datasets and their combination is seen when the model is fine-tuned on MSciNLI+. Therefore, fine-tuning the model on a larger training set containing diverse examples yields better performance. We can see that the models trained on MSciNLI+ (s) show a lower performance than those trained on MSciNLI+. This is because MSciNLI+ (s) is smaller in size than MSciNLI+. However, due to the additional diversity introduced by the ACL domain, MSciNLI+ (s) consistently outperforms MSciNLI. Thus, the benefit of combining the datasets holds for MSciNLI+ (s) as well.
| Intermediate training data | |||||
| Dataset | None | MSciNLI+ (MLM) | MNLI | SciNLI | MSciNLI+ |
| SciHTC | 53.47 | ||||
| Paper Field | 74.09 | ||||
| Acl-Arc | 73.04 | ||||
5 Scientific NLI as an Intermediate Task
Research Martín et al. (2022); Sadeghi et al. (2022) has shown that traditional NLI datasets (e.g., SNLI, MNLI) can aid in improving the performance of downstream NLP tasks. While the SciNLI dataset has already been used to improve sentence representation Deka et al. (2022), it was used in conjunction with the traditional NLI datasets. In this section, we investigate whether the scientific NLI datasets by themselves can aid in improving the performance of downstream tasks in an intermediate task transfer setting Pruksachatkun et al. (2020).
To this end, first, a RoBERTa model (out-of-the-box pre-trained with a dynamic MLM objective) is fine-tuned on the downstream tasks. Next, we perform intermediate training of four separate out-of-the-box RoBERTa models with the following approaches before fine-tuning them on the downstream tasks: 1) with a self-supervised dynamic MLM objective (with no information of the NLI classes) on MSciNLI+; 2) with a supervised NLI objective using MNLI; 3) with a supervised scientific NLI objective using SciNLI; 4) with a supervised scientific NLI objective using MSciNLI+.
We experiment with the following downstream tasks: SciHTC Sadat and Caragea (2022a), Paper Field Beltagy et al. (2019), and ACL-Arc Jurgens et al. (2018). SciHTC and Paper Field are topic classification datasets for scientific papers and ACL-Arc is a citation intent classification dataset. Details on these tasks and their labels are in Appendix G. The results for each downstream task are presented in Table 10. We find that:
Scientific NLI can aid in improving the performance of downstream tasks.
As we can see from the table, intermediate training with an unsupervised MLM objective on MSciNLI+ (MSciNLI+ (MLM) in the table) fails to improve the performance of the downstream tasks over the models which are fine-tuned without any intermediate training. In contrast, supervised intermediate training on MSciNLI+ improves the performance of all datasets over all other models. This indicates that training a model further on the scientific NLI task can learn better and more relevant representations for the downstream tasks in the scientific domain. We can also see that supervised intermediate training on MNLI fails to show improvement for any of the downstream tasks. This illustrates the need for NLI datasets capturing the unique linguistic properties of scientific text (e.g., SciNLI and MSciNLI) in order to improve the performance of downstream tasks in this domain. Furthermore, we observe that intermediate training with a scientific NLI objective only using SciNLI fails to improve the performance of the downstream tasks. Therefore, while intermediate training with a scientific NLI objective can aid in improving the performance of downstream tasks, the diversity in the data is essential.
6 Conclusion & Future Directions
We introduce a diverse scientific NLI benchmark, MSciNLI derived from five scientific domains. We show that MSciNLI is more difficult to classify than the only other related dataset, SciNLI. We establish strong baselines on MSciNLI and find that our dataset is challenging for both PLMs and powerful LLMs. Furthermore, we provide a comprehensive investigation into the performance of scientific NLI models under domain-shift at test time and their usage in downstream NLP tasks. In the future, we will develop methods to improve the construction of prompts that enable better reasoning and inference capabilities of LLMs.
Acknowledgements
This research is supported by NSF CAREER award 1802358 and NSF IIS award 2107518. Any opinions, findings, and conclusions expressed here are those of the authors and do not necessarily reflect the views of NSF. We thank our anonymous reviewers for their constructive feedback, which helped improve the quality of our paper.
Limitations
From our experiments, we can see that the performance of the LLMs is low (best performing Macro F1 is ) on MSciNLI, which shows a lot of room for future improvement. The design of the prompts have a high impact on the performance as we can see from the results, thus, further exploration of other prompting strategies can potentially improve the performance further. In the future, we will focus on the design of other prompts to boost the performance of LLMs in scientific NLI.
References
- Beltagy et al. (2019) Iz Beltagy, Kyle Lo, and Arman Cohan. 2019. SciBERT: A pretrained language model for scientific text. In Proceedings of the 2019 Conference on Empirical Methods in Natural Language Processing and the 9th International Joint Conference on Natural Language Processing (EMNLP-IJCNLP), pages 3615–3620, Hong Kong, China. Association for Computational Linguistics.
- Bird et al. (2008) Steven Bird, Robert Dale, Bonnie J. Dorr, Bryan Gibson, Mark T. Joseph, Min-Yen Kan, Dongwon Lee, Brett Powley, Dragomir R. Radev, and Yee Fan Tan. 2008. The ACL Anthology Reference Corpus: A Reference Dataset for Bibliographic Research in Computational Linguistics. In Proc. of the 6th International Conference on Language Resources and Evaluation Conference (LREC’08), pages 1755–1759.
- Bowman et al. (2015) Samuel R. Bowman, Gabor Angeli, Christopher Potts, and Christopher D. Manning. 2015. A large annotated corpus for learning natural language inference. In Proceedings of the 2015 Conference on Empirical Methods in Natural Language Processing, pages 632–642, Lisbon, Portugal. Association for Computational Linguistics.
- Brown et al. (2020) Tom Brown, Benjamin Mann, Nick Ryder, Melanie Subbiah, Jared D Kaplan, Prafulla Dhariwal, Arvind Neelakantan, Pranav Shyam, Girish Sastry, Amanda Askell, et al. 2020. Language models are few-shot learners. Advances in neural information processing systems, 33:1877–1901.
- Conneau et al. (2017) Alexis Conneau, Douwe Kiela, Holger Schwenk, Loic Barrault, and Antoine Bordes. 2017. Supervised learning of universal sentence representations from natural language inference data. arXiv preprint arXiv:1705.02364.
- Conneau et al. (2018) Alexis Conneau, Ruty Rinott, Guillaume Lample, Adina Williams, Samuel R. Bowman, Holger Schwenk, and Veselin Stoyanov. 2018. Xnli: Evaluating cross-lingual sentence representations. In Proceedings of the 2018 Conference on Empirical Methods in Natural Language Processing. Association for Computational Linguistics.
- Dagan et al. (2006) Ido Dagan, Oren Glickman, and Bernardo Magnini. 2006. The pascal recognising textual entailment challenge. In Machine Learning Challenges. Evaluating Predictive Uncertainty, Visual Object Classification, and Recognising Tectual Entailment, pages 177–190, Berlin, Heidelberg. Springer Berlin Heidelberg.
- Deka et al. (2022) Pritam Deka, Anna Jurek-Loughrey, et al. 2022. Evidence extraction to validate medical claims in fake news detection. In International Conference on Health Information Science, pages 3–15. Springer.
- Devlin et al. (2019) Jacob Devlin, Ming-Wei Chang, Kenton Lee, and Kristina Toutanova. 2019. BERT: Pre-training of deep bidirectional transformers for language understanding. In Proceedings of the 2019 Conference of the North American Chapter of the Association for Computational Linguistics: Human Language Technologies, Volume 1 (Long and Short Papers), pages 4171–4186, Minneapolis, Minnesota. Association for Computational Linguistics.
- Gururangan et al. (2018) Suchin Gururangan, Swabha Swayamdipta, Omer Levy, Roy Schwartz, Samuel Bowman, and Noah A. Smith. 2018. Annotation artifacts in natural language inference data. In Proceedings of the 2018 Conference of the North American Chapter of the Association for Computational Linguistics: Human Language Technologies, Volume 2 (Short Papers), pages 107–112, New Orleans, Louisiana. Association for Computational Linguistics.
- Hendrycks et al. (2021) Dan Hendrycks, Collin Burns, Steven Basart, Andy Zou, Mantas Mazeika, Dawn Song, and Jacob Steinhardt. 2021. Measuring massive multitask language understanding. In International Conference on Learning Representations.
- Jiang et al. (2023) Albert Q Jiang, Alexandre Sablayrolles, Arthur Mensch, Chris Bamford, Devendra Singh Chaplot, Diego de las Casas, Florian Bressand, Gianna Lengyel, Guillaume Lample, Lucile Saulnier, et al. 2023. Mistral 7b. arXiv preprint arXiv:2310.06825.
- Jurgens et al. (2018) David Jurgens, Srijan Kumar, Raine Hoover, Dan McFarland, and Dan Jurafsky. 2018. Measuring the evolution of a scientific field through citation frames. Transactions of the Association for Computational Linguistics, 6:391–406.
- Khot et al. (2018) Tushar Khot, Ashish Sabharwal, and Peter Clark. 2018. Scitail: A textual entailment dataset from science question answering. In AAAI, volume 17, pages 41–42.
- Kingma and Ba (2014) Diederik P Kingma and Jimmy Ba. 2014. Adam: A method for stochastic optimization. arXiv preprint arXiv:1412.6980.
- Klein and Manning (2003) Dan Klein and Christopher D. Manning. 2003. Accurate unlexicalized parsing. In Proceedings of the 41st Annual Meeting of the Association for Computational Linguistics, pages 423–430, Sapporo, Japan. Association for Computational Linguistics.
- Landis and Koch (1977) J Richard Landis and Gary G Koch. 1977. The measurement of observer agreement for categorical data. biometrics, pages 159–174.
- Liu et al. (2019a) Xiaodong Liu, Pengcheng He, Weizhu Chen, and Jianfeng Gao. 2019a. Multi-task deep neural networks for natural language understanding. In Proceedings of the 57th Annual Meeting of the Association for Computational Linguistics, pages 4487–4496, Florence, Italy. Association for Computational Linguistics.
- Liu et al. (2019b) Yinhan Liu, Myle Ott, Naman Goyal, Jingfei Du, Mandar Joshi, Danqi Chen, Omer Levy, Mike Lewis, Luke Zettlemoyer, and Veselin Stoyanov. 2019b. Roberta: A robustly optimized bert pretraining approach. arXiv preprint arXiv:1907.11692.
- Marelli et al. (2014) Marco Marelli, Stefano Menini, Marco Baroni, Luisa Bentivogli, Raffaella Bernardi, and Roberto Zamparelli. 2014. A SICK cure for the evaluation of compositional distributional semantic models. In Proceedings of the Ninth International Conference on Language Resources and Evaluation (LREC’14), pages 216–223, Reykjavik, Iceland. European Language Resources Association (ELRA).
- Martín et al. (2022) Alejandro Martín, Javier Huertas-Tato, Álvaro Huertas-García, Guillermo Villar-Rodríguez, and David Camacho. 2022. Facter-check: Semi-automated fact-checking through semantic similarity and natural language inference. Knowledge-Based Systems, 251:109265.
- Nie et al. (2019) Yixin Nie, Adina Williams, Emily Dinan, Mohit Bansal, Jason Weston, and Douwe Kiela. 2019. Adversarial nli: A new benchmark for natural language understanding. arXiv preprint arXiv:1910.14599.
- Nie et al. (2020) Yixin Nie, Adina Williams, Emily Dinan, Mohit Bansal, Jason Weston, and Douwe Kiela. 2020. Adversarial NLI: A new benchmark for natural language understanding. In Proceedings of the 58th Annual Meeting of the Association for Computational Linguistics, pages 4885–4901, Online. Association for Computational Linguistics.
- Pennington et al. (2014) Jeffrey Pennington, Richard Socher, and Christopher D. Manning. 2014. Glove: Global vectors for word representation. In Empirical Methods in Natural Language Processing (EMNLP), pages 1532–1543.
- Pruksachatkun et al. (2020) Yada Pruksachatkun, Jason Phang, Haokun Liu, Phu Mon Htut, Xiaoyi Zhang, Richard Yuanzhe Pang, Clara Vania, Katharina Kann, and Samuel R. Bowman. 2020. Intermediate-task transfer learning with pretrained language models: When and why does it work? In Proceedings of the 58th Annual Meeting of the Association for Computational Linguistics, pages 5231–5247, Online. Association for Computational Linguistics.
- Radev et al. (2009) Dragomir R. Radev, Pradeep Muthukrishnan, and Vahed Qazvinian. 2009. The ACL Anthology network. In Proceedings of the 2009 Workshop on Text and Citation Analysis for Scholarly Digital Libraries (NLPIR4DL), pages 54–61, Suntec City, Singapore. Association for Computational Linguistics.
- Rajpurkar et al. (2016) Pranav Rajpurkar, Jian Zhang, Konstantin Lopyrev, and Percy Liang. 2016. SQuAD: 100,000+ questions for machine comprehension of text. In Proceedings of the 2016 Conference on Empirical Methods in Natural Language Processing, pages 2383–2392, Austin, Texas. Association for Computational Linguistics.
- Sadat and Caragea (2022a) Mobashir Sadat and Cornelia Caragea. 2022a. Hierarchical multi-label classification of scientific documents. In Proceedings of The 2022 Conference on Empirical Methods in Natural Language Processing (Volume 1: Long Papers), Abu Dhabi, United Arab Emirates. Association for Computational Linguistics.
- Sadat and Caragea (2022b) Mobashir Sadat and Cornelia Caragea. 2022b. SciNLI: A corpus for natural language inference on scientific text. In Proceedings of the 60th Annual Meeting of the Association for Computational Linguistics (Volume 1: Long Papers), pages 7399–7409, Dublin, Ireland. Association for Computational Linguistics.
- Sadeghi et al. (2022) Fariba Sadeghi, Amir Jalaly Bidgoly, and Hossein Amirkhani. 2022. Fake news detection on social media using a natural language inference approach. Multimedia Tools and Applications, pages 1–21.
- Swayamdipta et al. (2020) Swabha Swayamdipta, Roy Schwartz, Nicholas Lourie, Yizhong Wang, Hannaneh Hajishirzi, Noah A. Smith, and Yejin Choi. 2020. Dataset cartography: Mapping and diagnosing datasets with training dynamics. In Proceedings of the 2020 Conference on Empirical Methods in Natural Language Processing (EMNLP), pages 9275–9293, Online. Association for Computational Linguistics.
- Touvron et al. (2023) Hugo Touvron, Louis Martin, Kevin Stone, Peter Albert, Amjad Almahairi, Yasmine Babaei, Nikolay Bashlykov, Soumya Batra, Prajjwal Bhargava, Shruti Bhosale, et al. 2023. Llama 2: Open foundation and fine-tuned chat models. arXiv preprint arXiv:2307.09288.
- Wang et al. (2019) Alex Wang, Yada Pruksachatkun, Nikita Nangia, Amanpreet Singh, Julian Michael, Felix Hill, Omer Levy, and Samuel Bowman. 2019. Superglue: A stickier benchmark for general-purpose language understanding systems. In Advances in Neural Information Processing Systems, volume 32. Curran Associates, Inc.
- Wang et al. (2018) Alex Wang, Amanpreet Singh, Julian Michael, Felix Hill, Omer Levy, and Samuel Bowman. 2018. GLUE: A multi-task benchmark and analysis platform for natural language understanding. In Proceedings of the 2018 EMNLP Workshop BlackboxNLP: Analyzing and Interpreting Neural Networks for NLP, pages 353–355, Brussels, Belgium. Association for Computational Linguistics.
- Wang et al. (2022) Chenglin Wang, Yucheng Zhou, Guodong Long, Xiaodong Wang, and Xiaowei Xu. 2022. Unsupervised knowledge graph construction and event-centric knowledge infusion for scientific nli. arXiv preprint arXiv:2210.15248.
- Williams et al. (2018a) Adina Williams, Nikita Nangia, and Samuel Bowman. 2018a. A broad-coverage challenge corpus for sentence understanding through inference. In Proceedings of the 2018 Conference of the North American Chapter of the Association for Computational Linguistics: Human Language Technologies, Volume 1 (Long Papers), pages 1112–1122, New Orleans, Louisiana. Association for Computational Linguistics.
- Williams et al. (2018b) Adina Williams, Nikita Nangia, and Samuel Bowman. 2018b. A broad-coverage challenge corpus for sentence understanding through inference. In Proceedings of the 2018 Conference of the North American Chapter of the Association for Computational Linguistics: Human Language Technologies, Volume 1 (Long Papers), pages 1112–1122. Association for Computational Linguistics.
- Wu et al. (2023) Jinxuan Wu, Wenhan Chao, Xian Zhou, and Zhunchen Luo. 2023. Characterizing and verifying scientific claims: Qualitative causal structure is all you need. In Proceedings of the 2023 Conference on Empirical Methods in Natural Language Processing, pages 13428–13439, Singapore. Association for Computational Linguistics.
- Yang et al. (2019) Zhilin Yang, Zihang Dai, Yiming Yang, Jaime Carbonell, Russ R Salakhutdinov, and Quoc V Le. 2019. Xlnet: Generalized autoregressive pretraining for language understanding. In Advances in neural information processing systems, pages 5753–5763.
- Zhong et al. (2023) Qihuang Zhong, Liang Ding, Juhua Liu, Bo Du, and Dacheng Tao. 2023. Can chatgpt understand too? a comparative study on chatgpt and fine-tuned bert. arXiv preprint arXiv:2302.10198.
- Zhu et al. (2015) Yukun Zhu, Ryan Kiros, Rich Zemel, Ruslan Salakhutdinov, Raquel Urtasun, Antonio Torralba, and Sanja Fidler. 2015. Aligning books and movies: Towards story-like visual explanations by watching movies and reading books. In Proceedings of the IEEE international conference on computer vision, pages 19–27.
Appendix A Additional Dataset Details
| Class | Linking Phrases |
| Contrasting | ‘However’, ‘On the other hand’, ‘In contrast’, ‘On the contrary’ |
| Reasoning | ‘Therefore’, ‘Thus’, ‘Consequently’, ‘As a result’, ‘As a consequence’, ‘From here, we can infer’ |
| Entailment | ‘Specifically’, ‘Precisely’, ‘In particular’, ‘Particularly’, ‘That is’, ‘In other words’ |
A.1 More Details about Data Sources
To construct our dataset, for all five domains, we choose papers published after the year 2000. In particular, the sentence pairs for the training set of NeurIPS are extracted from papers published between 2000 and 2018 and the test and development sets are derived from the papers published in 2019. The training sets for the four ACM domains—Hardware, Networks, Software & its Engineering, and Security & Privacy are constructed from the papers published between 2000 and 2014. The sentence pairs extracted from the papers published between 2015 and 2017 are used to create the test and development sets for each domain.
A.2 List of Linking Phrases
To construct MSciNLI, we use the same list of linking phrases and their corresponding classes as SciNLI. Table 11 shows the linking phrases and their classes.
A.3 Details about Annotators and Annotation Instructions
In this section, we provide the details about the annotators we hired for constructing the test and development sets of MSciNLI (§A.3.1), and for evaluating the human performance (§A.3.2).
A.3.1 Annotators for constructing the test and development sets.
For constructing the MSciNLI development and test sets (in Section 3.3), we hired computer science undergraduate students as research interns at our institution who were compensated in an hourly basis by /hour. Each annotator was trained with several pilot iterations before they started the final annotations for constructing the dataset. Moreover, out of the students that we initially hired, only were selected as the final annotators based on their performance during training to ensure a high quality of labels in our dataset.
The training phase of the students consists of iterations. At each iteration, all students were given a pilot batch and were instructed to predict the label based on the two sentences in each sample. We provide feedback to all students at the end of each iteration. In addition to the hired students, an author of this paper also annotated the examples in the third training iteration. students were then selected as the final annotators who have the top three agreement rates with the author (, , ). Once the annotators are trained, they start the final annotations to create the benchmark evaluation set of MSciNLI.
Note that the annotators are instructed to label each pair of sentences based on the four scientific NLI relations and not based on what could be a possibly good linking phrase between them. This annotation instruction ensures that the scientific NLI task formulation remains the same as the traditional NLI task—predicting the semantic relation between a pair of sentences.
A.3.2 Annotators for evaluating human performance.
For evaluating the human performance on MSciNLI (in Section 4.2.3), we hire expert as well as non-expert annotators via a crowd-sourcing platform called COGITO.555https://www.cogitotech.com/ We ensured that none of the annotators for evaluating the human performance is involved with the construction of MSciNLI at any capacity. We distinguish between the expert and non-expert annotators based on whether they have the relevant background on the scientific domains in MSciNLI. Both sets of annotators are trained in the same fashion as the annotators who helped construct the test and development sets (described in the previous paragraphs). Both expert and non-expert annotators are paid at a rate of /sample.
| Class | #Annotated | Agreement |
| Contrasting | ||
| Reasoning | ||
| Entailment | ||
| Neutral | ||
| \hdashlineOverall |
A.4 Class-wise Agreement Rate
A.5 Difference/Closeness of the Domains
We quantify the differences/closeness of the domains in MSciNLI and the computational linguistic domain from SciNLI as the pairwise cosine similarities of the probability distributions of the RoBERTa-base666https://huggingface.co/roberta-base vocabulary over each domain. The cosine similarities are reported in Table 13. We can see that the first four domains in the Table show a high similarity among them. Recall that the sentence pairs for all of these four domains are extracted from papers published in the ACM digital library. The high cosine similarities illustrate that the writing style and the vocabulary used in these domains are similar. In contrast, the cosine similarity of NeurIPS is the lowest with all other four domains in MSciNLI. Therefore, the vocabulary and the writing style in the papers published in NeurIPS differs substantially from the other four domains. Furthermore, it can be seen that the similarity between ACL and the five domains in MSciNLI is low, which illustrates that our dataset indeed diversifies the task of scientific NLI.
Appendix B Implementation Details
All of our experiments are implemented using PyTorch.777https://pytorch.org/ The details are provided below.
BiLSTM baseline
Two separate BiLSTM layers are used to get the sentence level representations of the two sentences in each pair. The token embeddings of each sentence are sent through the respective BiLSTM layer and then the output hidden states are averaged to get the sentence level representations. The context vector is derived by concatenating the sentence level representations, their element-wise multiplication and difference. is projected with a weight matrix by using a linear layer with softmax to predict the class.
Each BiLSTM layer is equipped with 300D Glove Pennington et al. (2014) embeddings which are allowed to be updated during training. The hidden state size for both BiLSTM layers is set at 300. The models are trained for 30 epochs with early stopping where we set the patience to be 10. The Macro F1 of the development score in every epoch is used as the stopping criteria. We use a cross-entropy loss and Adam optimizer Kingma and Ba (2014) to optimize the model parameters. The min-batch size and learning rate are set at 64 and 0.001, respectively.
| HW | NW | SWE | Sec | NIPS | ACL | |
| HW | ||||||
| NW | ||||||
| SWE | ||||||
| Sec | ||||||
| NIPS | ||||||
| ACL |
PLM baselines
The details of our pre-trained models are described as follows: (a) BERT Devlin et al. (2019) - pre-trained by masked language modeling (MLM) and Next Sentence Prediction (NSP) objectives on BookCorpus Zhu et al. (2015) and Wikipedia; (b) SciBERT Beltagy et al. (2019) - pre-trained using the same objectives as BERT but using scientific text exclusively as the pre-training data; (c) RoBERTa Liu et al. (2019b) - an extension of BERT which uses a variation of MLM where different words are masked in each epoch dynamically (unlike static masking in standard MLM). It is also trained on larger amount of text, larger mini-batch size and larger number of epochs compared to BERT; and (d) XLNet Yang et al. (2019) - pre-trained with a “Permutation Language Modeling” objective instead of MLM to provide bi-directional context to the model while being auto-regressive.
| Hardware | Networks | SWE | Security | NeurIPS | Overall | |
| Domain-wise | ||||||
| xBERT | - | |||||
| xSciBERT | - | |||||
| xXLNet | - | |||||
| xRoBERTa | - | |||||
| Merged - small | ||||||
| xBERT | ||||||
| xSciBERT | ||||||
| xXLNet | ||||||
| xRoBERTa | ||||||
| Merged - large | ||||||
| xBERT | ||||||
| xSciBERT | ||||||
| xXLNet | ||||||
| xRoBERTa |
For these PLM baselines, the two sentences in each example are concatenated with a [SEP] token between them to be used as the input and the hidden representation embedded in the [CLS] token is then projected with a weight matrix . Finally, we use softmax on the projected representation to get the probability distribution over the four classes. The class with the maximum probability is predicted as the label for each input pair.
Each PLM baseline is fine-tuned for 10 epochs with early stopping using the huggingface888https://huggingface.co library. The patience for early stopping is set at 2. The learning rate and the mini-batch size is set at , and , respectively. We use a cross-entropy loss and Adam optimizer Kingma and Ba (2014) to optimize the model parameters.
LLM baselines
We make use of the prompt templates described in Section 4.2.2 to construct the inputs to the LLM baselines. Similar to the PLM baselines, we conduct our experiments for LLM baselines using the huggingface library. We employ a greedy decoding strategy with a maximum generated token count to be . Generally, instead of only providing the answer to our multiple-choice question, the LLMs generates a more verbose response with the answer contained in it. We manually examine the responses for each prompt by each LLM and develop scripts to extract the correct answer with rule-based approaches.
Computational Cost
The BiLSTM and PLM experiments are conducted on a single NVIDIA RTX A5000 GPU. The BiLSTM model was trained in minutes. The time needed to fine-tune each PLM baseline on the full MSciNLI training set using a single GPU is hours. The inference by the LLM baselines is conducted using two NVIDIA RTX A5000 GPUs and it took hours on average for each experiment.
Appendix C Additional Results
C.1 Domain-wise vs Merged
In addition to fine-tuning on the combined MSciNLI training set ( examples) in Section 4.2.1, we experiment with the PLM baselines in two other settings: Domain-wise and Merged-small (see the description of these settings below) and compare their performance with the model fine-tuned on the combined MSciNLI training set denoted as Merged-large. The motivation behind these experiments is two-fold: a) to understand the impact of diversity of examples in model training (Domain-wise vs Merged-small) (when the models are trained on data from a single domain vs data from diverse domains—but all being trained on the same training set size); and b) to understand the impact of training set size (Merged-small vs Merged-large). In the Domain-wise setting, we train and evaluate separate models for each domain using the data from the respective domain. For the Merged-small setting, we randomly down-sample the training set of each domain to examples (class-balanced) before combining them to ensure that the total size of the merged set Merged-small is similar to the Domain-wise training set size (). We combine the downsampled data from all domains and train a single model using the merged data. This model is then evaluated on the test set of each domain and the combined MSciNLI test set. The Merged-large setting corresponds to the combined training set of MSciNLI of examples.
We run each experiment three times and report the average and standard deviation of the Macro F1 score of the models in the three settings in Table 14. We find the following:
Training models on diverse data is more optimal.
We can see that each model trained in the Merged - small setting shows similar performance as their Domain-wise counterparts. Moreover, in some cases (e.g., for BERT for all domains, XLNet for NeurIPS), the Merged - small models outperform the Domain-wise models. Recall that the size of the Merged-small training set is the same as each of the Domain-wise training sets. Since we train separate models for each domain in the Domain-wise setting, it is five times computationally more expensive than the Merged - small setting where a single model is trained for all domains. Therefore, training a single model on diverse data can reduce the computational cost without compromising model performance resulting in a more optimal approach.
More data leads to better performance.
Next we compare the performance of the model fine-tuned on Merged-small with its Merged-large counterpart. The results show that Merged - large models consistently outperform the Merged - small models by a substantial margin. Therefore, the performance on our dataset improves with the the increase of dataset size.
| Model | Contrasting | Reasoning | Entailment | Neutral | Macro Ave. |
| Precision | |||||
| xRoBERTa | |||||
| xLlama-2 | |||||
| \hdashlineRecall | |||||
| xRoBERTa | |||||
| xLlama-2 | |||||
| \hdashlineF1 | |||||
| xRoBERTa | |||||
| xLlama-2 |
| Hardware | Networks | SWE | Security | NeurIPS | Overall | |
| GPT-NeoXT-Chat | ||||||
| xPrompt - 1zs | ||||||
| xPrompt - 2zs | ||||||
| xPrompt - 3zs | ||||||
| \hdashlinexPrompt - 1fs | ||||||
| xPrompt - 2fs | ||||||
| xPrompt - 3fs |
C.2 Class-wise Performances
We evaluate the class-wise performance of our best performing PLM baseline—RoBERTa trained on the combined MSciNLI training set, and our best performing LLM baseline—Llama-2 with Prompt - 3 in the few-shot setting. The results are reported in Table 15.
As we can see, both models show a better performance for the Contrasting and the Neutral classes, and they struggle more for the Reasoning, and Entailment classes. However, even the Contrasting and the Neutral classes are still challenging for the models with substantial headroom for improvement.
C.3 Another LLM Baseline - GPT-NeoX
In addition to the LLMs that we explore in Section 4.2, we also experiment with the GPT-NeoXT-Chat-Base-20B999https://huggingface.co/togethercomputer/GPT-NeoXT-Chat-Base-20B variant of the GPT-NeoX model. However, despite being much larger in size than the Llama-2 and Mistral baselines (20 billion parameters vs 13B and 7B, respectively), GPT-NeoX failed to show any promising performance (for the same three prompts used in the paper). We report the performance of these baselines in Table 16. We can see that the best performance for GPT-NeoX is shown by Prompt - 1zs with an overall Macro F1 of only . Moreover, none of the few-shot versions of the prompts shows any meaningful performance for this model ( in Macro F1 with four labels in total means that the model always predicts the same label). In our future work, we will focus on the designing of other prompts that can improve the performance of the LLMs.
| SciNLI | |||
| Model | F1 | Acc | |
| RoBERTa | xxxboth sentences | ||
| xxxonly sentence | |||
| SciBERT | xxxboth sentences | ||
| xxxonly sentence | |||
C.4 Only-Second-Sentence Baseline
To evaluate the degree of spurious correlations Gururangan et al. (2018) that may exist in MsciNLI, we experiment with only-second-sentence models. Specifically, we fine-tune both RoBERTa and SciBERT where only the second sentence is used as the input. A comparison between the only-second-sentence models and the models using both sentences can be seen in Table 17. The results show that the performance decreases by a large margin when only the second sentence is used as the input. Therefore, the amount of spurious correlation in MSciNLI is smaller compared with other existing NLI datasets (e.g., SNLI Bowman et al. (2015)) and the models need to learn the semantic relation between the sentences in each pair in order to perform well.
However, given that the performance of the only-second-sentence models are much higher than chance (%), we believe there are still some degree of spurious patterns in MSciNLI. In our future work, we will explore methods to identify and reduce the degree of spurious patterns in scientific NLI.
| Prompt - 1 |
<human>: Consider the following two sentences:
Sentence1: <sentence1> Sentence2: <sentence2> What is the semantic relation between Sentence1 and Sentence2? Choose from the following options: 1. Entailment, 2. Reasoning, 3. Contrasting, 4. Neutral. <bot>: |
| Prompt - 2 |
<human>: Consider the following class definitions of four semantic relations between a pair of sentences.
Entailment: <definition of entailment> Contrasting: <definition of contrasting> Reasoning: <definition of reasoning> Neutral: <definition of neutral> Now consider the following two sentences: Sentence1: <sentence1> Sentence2: <sentence2> Based on only the information available in these two sentences and the class definitions, answer the following: What is the semantic relation between Sentence1 and Sentence2? Choose from the following options: 1. Entailment, 2. Reasoning, 3. Contrasting, 4. Neutral. <bot>: |
| Prompt - 3 |
<human>: Consider the following two sentences:
Sentence1: <sentence1> Sentence2: <sentence2> Based on only the information available in these two sentences, which of the following options is true? a. Sentence1 generalizes, specifies or has an equivalent meaning with Sentence2. b. Sentence1 presents the reason, cause, or condition for the result or conclusion made Sentence2. c. Sentence2 mentions a comparison, criticism, juxtaposition, or a limitation of something said in Sentence1. d. Sentence1 and Sentence2 are independent. <bot>: |
Appendix D Prompts for LLMs
The zero-shot versions of the three prompt templates that we construct for LLMs can be seen in Table 18. For the few-shot versions of the prompts, we pre-pend four input-human annotated output exemplars (one for each class) to each prompt. Note that the <human> and <bot> tags in the prompts in the Table are replaced with the relevant tags for each LLM (e.g., [INST]).
Appendix E Training Dynamics Based Data Selection
The easy/hard/ambiguous subsets of the training data are selected based on their training dynamics Swayamdipta et al. (2020). Specifically, the training dynamics of each example is defined in the form of three metrics—confidence, variability, and correctness during training a classifier. These metrics are used to plot the examples in a data map to perform a visual analysis. The aforementioned three subsets of the training set are then selected based on confidence and variability. In this section, we define these metrics, perform a data cartography of MSciNLI, and describe the method to select the subsets used in Section 4.3.1.
E.1 Metrics Definitions
The confidence of each example is defined as the average of the probability predicted by a classifier for its label over the training epochs. That is, for a training example and its label , the confidence is calculated as follows:
| (1) |
Here, is the number of training epochs, is the model at epoch and is the probability of the label given and . The variability of each example is defined as the standard deviation of the predicted probability for its label over the training epochs. More formally, the variability, of an example is calculated as:
| (2) |
Finally, the fraction of the training epochs where the classifier predicts the label of an example correctly is defined as its correctness.
E.2 Data Plot
For creating the data plot, we fine-tune a RoBERTa classifier on the combined MSciNLI training set. While training, we record the probability distributions predicted by the classifier for the training examples over the four labels in each epoch. We then calculate the confidence, variability, and correctness of each example using the recorded probability distributions and plot them in the data map based on these calculated values. The data plot can be seen in Figure 1.
We can see that the model shows a high correctness for the examples in the high confidence region. Therefore, the examples in this region are easy-to-learn for the model. On the other hand, the plot shows that the correctness of the model’s predictions is very low in the low confidence region of the map. Thus, the examples in this region are hard-to-learn for the model. Since, by definition, the probability predicted by the model shows a high fluctuation for the examples in the high variability region, they can be denoted as ambiguous examples.
Based on these observations from the data map, we select the various subsets from the full training set as follows.
E.3 Data Subset Selection
We rank the full training set based on confidence in a descending order and then select the top examples as the easy-to-learn subset. Similarly, we rank the full training set based on confidence in an ascending order and then select the top examples as the hard-to-learn subset. The top examples from a ranking based on the variability in a descending order is chosen as the top ambiguous subset. For the ‘ top hard’ and ‘ top hard’ subsets, we remove top and examples from the ranking based on confidence in an ascending order, respectively from the full training set.
| Hardware | Networks | SWE | Security | NeurIPS | ACL | |
| SciNLI | ||||||
| MSciNLI | ||||||
| MSciNLI+ |
| SciNLI | MSciNLI | SciTail | MNLI | |
| SciNLI | ||||
| MSciNLI | ||||
| SciTail | ||||
| MNLI |
Appendix F Additional Cross-dataset Experiments
F.1 Domain-wise Performance by Cross-dataset Models
F.2 Out-of-dataset Performance on Regular NLI datasets
To understand the effect of data diversity in the performance of scientific NLI models on regular NLI datasets, we perform a set of experiments with RoBERTa where we train models on SciNLI, MSciNLI, SciTail Khot et al. (2018), and MNLI Williams et al. (2018a) and evaluate them on each of the test sets of these datasets. Note that since the test set of MNLI is not publicly available, we use the development set as the test set and a randomly sampled set of size as the development set. Given that the NLI classes differ in these datasets, we convert SciNLI, MSciNLI and MNLI into 2-class datasets. Specifically, we update the labels of all non-entailment classes, i.e., contradiction and neutral for MNLI and contrasting, reasoning, neutral for SciNLI and MSciNLI to a class named Not-entailment. We do not change any labels in SciTail because it is already in a 2-class setting using Entailment and Not-entailment as the classes. The Macro F1 from these experiments are in Table 20.
We can see that the model trained on MSciNLI shows a substantially higher performance on both MNLI, and SciTail compared to the model trained with SciNLI. Therefore, training the models on diverse examples improves their reasoning capabilities which results in a better performance even for traditional NLI datasets. In our future work, we will investigate how the models trained on scientific NLI datasets behave when they are tested on easy, ambiguous and hard-to-learn examples of the traditional NLI datasets.
| Dataset | Classes |
| SciHTC | ‘General and reference’, ‘Hardware’, ‘Computer systems organization’, ‘Networks’, ‘Software and its engineering’, ‘Theory of computation’, ‘Mathematics of computing’, ‘Information systems’, ‘Security and privacy’, ‘Human-centered computing’, ‘Computing methodologies’, ‘Applied computing’, ‘Social and professional topics’ |
| Paper Field | ‘Geography’, ‘Politics’, ‘Economics’, ‘Business’, ‘Sociology’, ‘Medicine’, ‘Psychology’ |
| ACL-Arc | ‘Background’, ‘Extends’, ‘Uses’, ‘Motivation’, ‘Compare/Contrast’, ‘Future work’ |
| Dataset | #Train | #Test | #Dev |
| SciHTC | |||
| Paper Field | |||
| ACL-Arc |
Appendix G Details on Intermediate Task Transfer
G.1 Downstream Tasks - Dataset Details
The categories/class labels and the number of examples in each dataset for the downstream tasks in our intermediate task transfer experiments can be seen in Tables 21 and 22, respectively.
The details of each the downstream tasks that we experiment with are as follows.
SciHTC Sadat and Caragea (2022a)
A hierarchical multi-label scientific topic classification dataset containing K papers. While each paper in SciHTC is assigned multiple labels from different levels of the hierarchy tree), we only consider the level 1 flat categories which are in total (see Table 21) and train the model in a multi-class (single label for each paper) setting.
Paper Field Beltagy et al. (2019)
A paper classification dataset containing K papers where each paper is classified to different scientific fields. The total number of paper classes in this dataset is (see Table 21).
ACL-ARC Jurgens et al. (2018)
A citation intent classification dataset where the intent behind a citation made in a sentence in a scientific paper needs to be predicted. The classes in this dataset can be seen in Table 21.
G.2 Experimental Details of Intermediate Task Transfer Learning
In the intermediate task transfer setting, the RoBERTa model is trained on the NLI datasets for a single epoch (unlike the baselines). For the unsupervised intermediate training with MLM, tokens are randomly masked and the model is also trained for a single epoch. During the fine-tuning step, only the RoBERTa layer is initialized from the model from the intermediate training step. The parameters for the output linear layer with softmax activation is randomly initialized. The model is then fine-tuned for the downstream tasks for multiple epochs. Specifically, the models for SciHTC, and Paper-field are trained for epochs. The models for ACL-Arc are fine-tuned for a maximum of epochs due to its small size. Similar to our baselines, we employ early stopping with patience 2 and Macro F1 score of the development set as the stopping criteria.