SurvMamba: State Space Model with Multi-grained Multi-modal Interaction for Survival Prediction
Abstract.
Multi-modal learning that combines pathological images with genomic data has significantly enhanced the accuracy of survival prediction. Nevertheless, existing methods have not fully utilized the inherent hierarchical structure within both whole slide images (WSIs) and transcriptomic data, from which better intra-modal representations and inter-modal integration could be derived. Moreover, many existing studies attempt to improve multi-modal representations through attention mechanisms, which inevitably lead to high complexity when processing high-dimensional WSIs and transcriptomic data. Recently, a structured state space model named Mamba emerged as a promising approach for its superior performance in modeling long sequences with low complexity. In this study, we propose Mamba with multi-grained multi-modal interaction (SurvMamba) for survival prediction. SurvMamba is implemented with a Hierarchical Interaction Mamba (HIM) module that facilitates efficient intra-modal interactions at different granularities, thereby capturing more detailed local features as well as rich global representations. In addition, an Interaction Fusion Mamba (IFM) module is used for cascaded inter-modal interactive fusion, yielding more comprehensive features for survival prediction. Comprehensive evaluations on five TCGA datasets demonstrate that SurvMamba outperforms other existing methods in terms of performance and computational cost.
1. Introduction
Survival prediction evaluates patients’ mortality risks, thereby enhancing the clinical decision-making process related to diagnosis and treatment planning (Tran et al., 2021). For cancer patients, pathological images and genomic profiles provide critical and interconnected information for patient stratification and survival analysis (Shao et al., 2019). For example, pathological images detail the tumor microenvironment, capturing the diversity of cancer cells and immune interactions (Gui et al., 2023). At the same time, genomic profiles provide critical insights into cancer cell states and immune system factors that affect dynamic prognostic outcomes (Milanez-Almeida et al., 2020; Tong et al., 2023). Therefore, integrating pathological images and genomic data through multi-modal learning holds considerable promise to enhance the precision of cancer survival predictions.
Extensive efforts have been made in multi-modal survival analysis with histological whole slide images (WSIs) and transcriptomic data (Jaume et al., 2023; Xu and Chen, 2023; Subramanian et al., 2021). Among them, Multiple Instance Learning (MIL) (Jaume et al., 2023; Xu and Chen, 2023; Qiu et al., 2023) has emerged as an effective method to process the high-dimensional WSIs and transcriptomic data. In these MIL-based methods, each WSI is represented as a “bag” with numerous patches as instances, while transcriptomic data is organized into a “bag” with functional genomes (i.e., genomic groups) as instances. Subsequently, fusion of histological and genomic features (Li et al., 2022; Chen et al., 2022b) is conducted to predict survival outcomes.
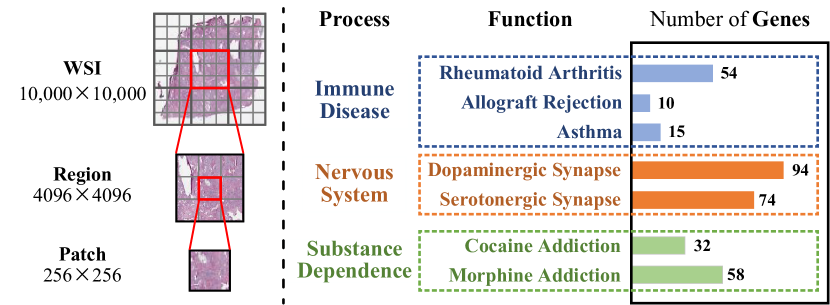
Despite the complex, high-dimensional nature of WSIs and transcriptomic data, they exhibit significant inherent hierarchical structures. These structures stem from their fundamental biological functions and the pathology associated with diseases, as illustrated in Figure 1a. However, existing methods do not fully leverage these hierarchical structures in both WSIs and transcriptomic data (Chen et al., 2022a; Kanehisa and Goto, 2000), which may lead to the following issues. The first issue regards to insufficient global representation. There are multi-level prognostic insights reflected in the hierarchical information. For example, fine-grained patch-level pathological images detail cell densities (Zhang et al., 2024a), while coarse-grained region-level images reveal tissue features and tumor-immune interactions (Fu et al., 2020). Fine-grained function-level transcriptomics reveals the specific functionalities of gene sets (Ietswaart et al., 2021), while coarse-grained process-level data focus on identifying those fundamental macroscopic biological processes (Zhang et al., 2021). Therefore, important global features for survival prediction could potentially be lost if a method focuses on fine-grained information only. Furthermore, there is limited cross-modality communications. Both WSIs and transcriptomic data contain a multitude of cross-modality communications at different hierarchical levels. For instance, adjacent patches/regions within a WSI tend to exhibit higher correlations (Ke et al., 2023), and functions/process sharing similar or related biological mechanisms demonstrate closer relationships (Smug et al., 2023), which cannot be easily revealed if cross-modality communications are only established at fine-grained features level, leading to inadequate intra-modal representations and and subsequently deficient inter-modal integration.
Although the integration of hierarchical structures into multi-modal survival prediction frameworks holds promise for yielding more comprehensive prognostic insights, it poses significant computational challenges, especially when implemented using attention mechanisms, given their high computational complexity. On the other hand, the Selective Structured State Space Model, known as Mamba (Gu and Dao, 2023), has demonstrated remarkable efficiency in long sequence modeling. Mamba effectively captures long-range dependencies and improves training and inference efficiency through a selection mechanism and a hardware-aware algorithm, hence providing an alternative to deal with high-dimensional data.
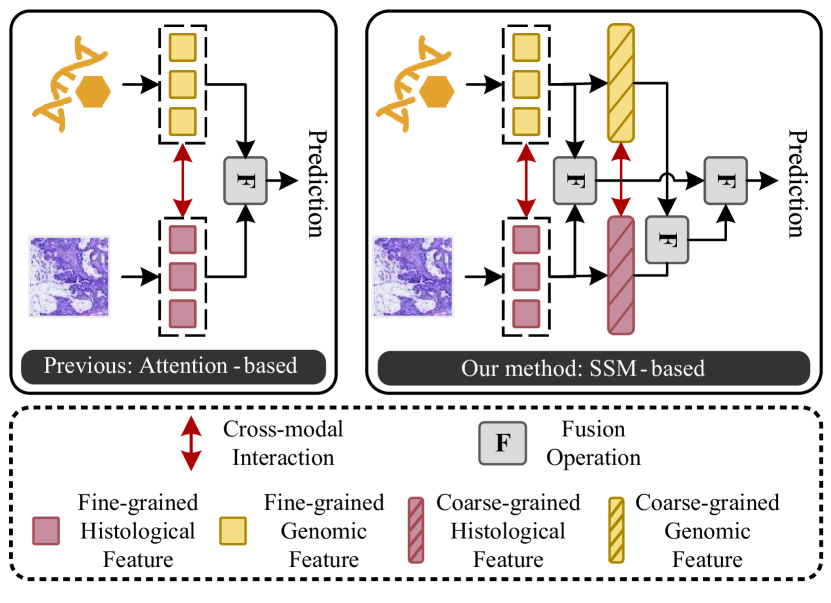
In this paper, we propose a Mamba-based survival prediction method with multi-grained multi-modal interaction, termed SurvMamba, which extracts multi-modal multi-grained information from hierarchical structure and facilitates efficient intra-modal and inter-modal interactions. Specifically, we design a novel Hierarchical Interaction Mamba (HIM) to efficiently capture the hierarchical characteristics of WSIs and transcriptomic data. HIM extracts coarse-grained features through the aggregation of fine-grained instances and enables efficient bidirectional interactions for multi-grained instances. In this way, SurvMamba can extract enhanced local information from fine-grained instances and global information from coarse-grained instances, resulting in more comprehensive intra-modal information to predict patient survival outcomes. Furthermore, we propose an Interaction Fusion Mamba (IFM) to facilitate interactions between histological and genomic features across different granularities, thereby providing refined intra-modal representations at both fine and coarse levels. Finally, these multi-grained features are adaptively integrated to formulate the final survival prediction. The main contributions of this paper can be summarized as follows:
-
•
This work is the first attempt to introduce the Mamba model into multi-modal survival prediction, effectively processing high-dimensional WSIs and transcriptomic data with promising performance.
-
•
We propose a Hierarchical Interaction Mamba module to efficiently encode more comprehensive intra-modal representations at both fine-grained and coarse-grained levels from WSI and transcriptomic data.
-
•
We introduce an Interaction Fusion Mamba module, designed to facilitate interaction and integration of histological and genomic features across various levels, thereby capturing multi-modal features from diverse perspectives.
-
•
Extensive experiments are conducted on five public TCGA datasets, and results show that SurvMamba outperforms a variety of state-of-the-art methods with a smaller computational cost.
2. Related Work
2.1. Multi-modal Survival Prediction
Survival outcome prediction, also known as time-to-event analysis (David and Mitchel, 2012), concentrates on probabilistic assessment of experiencing a specified event such as mortality in the clinical setting before a time under both uncensored and right-censored data. Right-censored data represents cases wherein the event of interest remains unobserved throughout the duration of the study. In the current state-of-the-art methods, estimating cancer patient survival heavily depends on physicians’ assessment of histology and/or interpretation of genomic sequencing report (Chen et al., 2021b). Consequently, there is a growing interest in multi-modal learning methods that integrate histopathology and genomic data for survival prediction (Chen et al., 2020, 2021a, 2021b; Subramanian et al., 2021; Chen et al., 2022b; Jaume et al., 2023; Xu and Chen, 2023). Chen et al. (Chen et al., 2021b) proposed a Multi-modal Co-Attention Transformer framework that identifies informative instances from pathological images using genomic features as queries. Qiu et al. (Qiu et al., 2023) proposed PONET, a novel pathology-genomic deep model informed by biological pathway that integrates pathological images and genomic data to improve survival prediction. Jaume et al. (Jaume et al., 2023) modeled interactions between biological pathway and histology patch tokens using a memory-efficient multi-modal Transformer for survival analysis. Zhang et al. (Zhang et al., 2024b) proposed a new framework named Prototypical Information Bottlenecking and Disentangling (PIBD), including Prototypical Information Bottleneck module for intra-modal redundancy and Prototypical Information Disentanglement module for inter-modal redundancy. Existing methods mainly regard multi-modal survival prediction as a fine-grained recognition task, focusing on histological patches and genomic functions to model fine-grained cross-modal relationships with local information. Neglecting coarser-grained information may result in overlooking some essential global features vital for accurately predicting patient survival. WSIs and genomic data exhibit an intrinsic hierarchical structure, where different granularity levels yield unique and critical insights into patient prognosis.
2.2. State Space Models
Recently, the State Space Models (SSMs) have shown significant effectiveness of state space transformation in capturing the dynamics and dependencies of language sequences. The structured state-space sequence model (S4) introduced in (Gu et al., 2021) is specifically designed to model long-range dependencies, offering the advantage of linear complexity. Various models including S5 (Smith et al., 2022), H3 (Fu et al., 2022) and GSS (Mehta et al., 2022) have been developed base on S4, and Mamba (Gu and Dao, 2023) distinguishes itself by introducing a data-dependent SSM layer and a selection mechanism using parallel scan (S6). Compared to Transformers with quadratic-complexity attention, Mamba excels at processing long sequences with linear complexity. Existing models based on MIL for multi-modal survival prediction struggle with enabling effective and efficient interactions among vast numbers of instances (Ilse et al., 2018; Li et al., 2021; Shao et al., 2021; Li et al., 2024), burdened by significant computational requirements. The introduction of Mamba addresses these challenges by incorporating input-adaptive and global information modeling techniques that emulate self-attention functionalities while retaining linear complexity. This breakthrough diminishes the computational overhead and provides a potential multi-modal learning framework for survival prediction.
3. Methodology
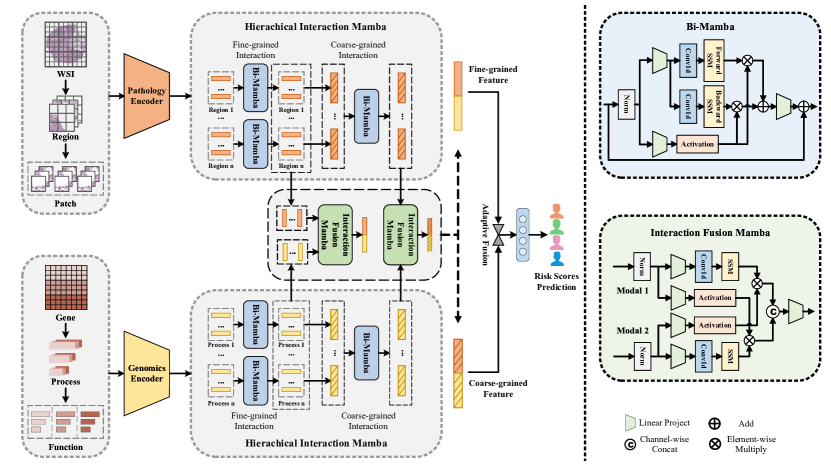
In this section, we first describe the preliminaries of the state space model (SSM) and then provide an overview of our proposed SurvMamba (shown in Figure 2) and its core components.
3.1. Preliminaries
The SSM-based models, i.e., structured state-space sequence models (S4), and Mamba, have emerged as promising architectures for modeling long sequences with linear complexity. With four parameters , they map an input stimulus to an output response through an intermediate latent state . This process can be illustrated in the following equations:
| (1) |
where denotes the evolution parameter, and , represent projection parameters. The models exploit a timescale parameter to convert continuous parameters , into their discrete counterparts , , according to:
| (2) |
Subsequently, these discrete parameters enable the reformulation of Eq. (1) in a recurrent format, facilitating efficient autoregressive inference:
| (3) |
Finally, the output is derived through global convolution. is the length of the input sequence and is a structured convolutional kernel:
| (4) |
3.2. Overview and Problem Formulation
As illustrated in Figure 2, we propose a novel state space model with multi-grained multi-modal interaction named SurvMamba for survival prediction. Clinical data for each patient is encapsulated in a quadruple , where represent the set of WSIs, refers to the set of transcriptomics, is the censoring status and denotes overall survival time (in months). Our objective is to employ WSI and transcriptomic data to estimate hazard functions , which represent the probability of a death event occurring in a brief interval following time for the -th patient.
To capture more comprehensive multi-modal representations, we exploit the inherent hierarchical structure of WSI and transcriptomic data to extract multi-grained information, as will be described in Sec 3.3, subsequently enabling efficient interaction and fusion among them through Mamba-based modules. Following (Jaume et al., 2023; Xu and Chen, 2023; Qiu et al., 2023), we adopt a MIL framework to learn pathological and genomic representations. We first formulate each WSI and transcriptomics as a “bag”, extracting features of fine-grained instances (Patch or Function) from the Pathology Encoder and the Genomics Encoder in groups. Then, with bidirectional Mamba in dual-level MIL framework, the Hierarchical Interaction Mamba (HIM) module aggregates fine-grained instances into coarse-grained instances (Region or Process) and enables efficient intra-modal interactions at different granularities. The details of this module will be described in Sec. 3.4. Further, the Interaction Fusion Mamba (IFM) module facilitates multi-grained interactions between histological and genomic features to derive fine-grained and coarse-grained inter-modal representations, as will be described in Sec. 3.5. Finally, multi-grained multi-modal features will be adaptively fused to predict a hazard function and get the survival risk scores, as will be described in Sec. 3.6.
3.3. Hierarchical Multi-modal Representations
WSIs and transcriptomics exhibit hierarchical structure with multi-level prognostic insights. In this study, we harness this hierarchical nature by representing WSIs and transcriptomics through a three-layer structure. Specifically, WSI is formulated with structures of WSI-, region-, and patch-level, while transcriptomic data are structured across gene-, function-, and process-level, respectively.
For an original WSI , we split it into non-overlapping regions with size of , and each region is further split into non-overlapping patches with size of , where , and . We extract the patch-level features with a frozen pre-trained Pathology Encoder , resulting in patch-level token sequence in , .
Given a set of transcriptomics measurements, it can be mapped into different biological processes . The -th process contains genomic functions , where , and . The number of genomic functions contained within each process varies. We encode genomic functions with Genomics Encoder which contains multilayer perceptrons (MLPs) with learnable weights, resulting in function-level token sequence in , .
3.4. Hierarchical Interaction Mamba
Structural WSI and transcriptomic data exhibit certain dependencies within local or global features. To capture these dependencies, we develop the HIM module. In inspired by (Zhu et al., 2024), this module is designed to learn intra-model features by integrating a bidirectional Mamba (Bi-Mamba) mechanism within a dual-level MIL framework. A comprehensive overview of the Bi-Mamba is provided in Algorithm 1. Our approach aims to model correlations across features of varying granularities effectively. For the first level MIL, the HIM module regards fine-grained (i.e., patch- and function-level) features and as instances, using Bi-Mamba with shared parameters between groups (i.e., region or process) to model fine-grained histological and genomic long sequences, resulting in enhanced fine-grained features and :
| (5) |
Subsequently, with the second level MIL, features and are pooling into coarse-grained (i.e., region- and process-level) features, and Bi-Mamba is then re-applied to facilitate interactions among them to get improved coarse-grained features and . Through this dual-level deep interaction mechanism for each modality, the HIM ensures a thorough and efficient integration of local fine-grained and global coarse-grained features, obtaining enhanced and comprehensive intra-modal histological and genomic features.
| (6) |
3.5. Interaction Fusion Mamba
To facilitate cross-modal feature interaction and fusion at different granularities, we introduce an IFM module (Algorithm 2). In IFM, we project features from two modalities and employ gating mechanisms to encourage complementary feature learning from each other while suppressing redundant features. After that, multi-modal features are concentrated to form a fused representation. Cross-modality communications are established at fine-grained and coarse-grained level via cascaded IFM. Through this block, we can obtain fine-grained fused features from features and , and get coarse-grained fused features from features and , as follows:
| (7) |
3.6. Survival Prediction
Recognizing the varying significance of features at different granularities for survival prediction, we employ an adaptive fusion strategy to fuse features across granular levels. Utilizing learned hyper-parameter denoted as , we subsequently derive the final feature set for prognostication with and , as follows:
| (8) |
Survival prediction estimates the risk probability of an outcome event before a specific time. For the final multi-modal feature of -th patient, we use NLL loss (Zadeh and Schmid, 2020) as the loss function for optimizing survival prediction, following previous works (Xu and Chen, 2023):
| (9) |
where represents the number of samples in the training set, denotes the hazard function characterizing the probability of death, and is defined as the survival function, representing the probability of survival up to the time point .
| Model | G. | H. | BRCA | BLCA | COADREAD | UCEC | LUAD | Overall |
| SNN | ✓ | 0.6060.011 | 0.6100.038 | 0.6170.025 | 0.6100.032 | 0.5890.031 | 0.606 | |
| SNNTrans | ✓ | 0.6210.032 | 0.6110.010 | 0.6350.044 | 0.5920.017 | 0.6020.044 | 0.612 | |
| ABMIL | ✓ | 0.6130.033 | 0.5880.033 | 0.6240.050 | 0.6180.014 | 0.6040.043 | 0.609 | |
| CLAM-SB | ✓ | 0.6050.062 | 0.6020.031 | 0.5980.036 | 0.5760.043 | 0.5860.033 | 0.593 | |
| CLAM-MB | ✓ | 0.6110.041 | 0.6090.010 | 0.6110.036 | 0.5890.023 | 0.6120.022 | 0.606 | |
| TransMIL | ✓ | 0.6280.015 | 0.6040.045 | 0.6270.425 | 0.6010.030 | 0.6260.030 | 0.617 | |
| ABMIL (Cat) | ✓ | ✓ | 0.6330.029 | 0.6210.062 | 0.6370.030 | 0.6320.014 | 0.6110.049 | 0.627 |
| ABMIL (KP) | ✓ | ✓ | 0.6610.042 | 0.6560.028 | 0.6600.032 | 0.6490.030 | 0.6420.020 | 0.654 |
| CLAM-MB (Cat) | ✓ | ✓ | 0.6280.047 | 0.6190.032 | 0.6140.021 | 0.6010.031 | 0.6100.032 | 0.614 |
| CLAM-MB (KP) | ✓ | ✓ | 0.6550.045 | 0.6330.027 | 0.6510.053 | 0.6370.021 | 0.6290.061 | 0.641 |
| TransMIL (Cat) | ✓ | ✓ | 0.6510.039 | 0.6310.031 | 0.6360.026 | 0.6220.043 | 0.6410.033 | 0.636 |
| TransMIL (KP) | ✓ | ✓ | 0.6710.021 | 0.6560.038 | 0.6610.034 | 0.6490.036 | 0.6520.054 | 0.658 |
| MCAT | ✓ | ✓ | 0.6700.032 | 0.6690.026 | 0.6670.025 | 0.6600.032 | 0.6820.042 | 0.670 |
| MOTCat | ✓ | ✓ | 0.6920.036 | 0.6880.029 | 0.6690.042 | 0.6920.024 | 0.6870.046 | 0.686 |
| SurvPath | ✓ | ✓ | 0.7130.025 | 0.7070.014 | 0.6830.022 | 0.7200.026 | 0.6840.025 | 0.701 |
| SurvMamba | ✓ | ✓ | 0.7370.014 | 0.7200.027 | 0.6970.018 | 0.7310.012 | 0.7020.020 | 0.717 |
4. Experiments
In this section, we first describe the datasets and evaluation metrics employed in our study. The experimental results indicate that our approach surpasses contemporary methods in both performance and computational efficiency. Further, we conduct ablation studies to examine the influence of critical components. Finally, from a statistical perspective, we utilize Kaplan-Meier survival curves and the Logrank test to illustrate the effectiveness of survival analysis.
4.1. Datasets and Settings
Datasets.
To demonstrate the performance of our proposed method, we conducted a series of experiments using five public cancer datasets from The Cancer Genome Atlas (TCGA)111http://www.cancer.gov/tcga, which include paired diagnostic WSIs and transcriptomic data alongside verified survival outcomes. The datasets encompass Breast Invasive Carcinoma (BRCA) with 869 cases, Bladder Urothelial Carcinoma (BLCA) with 359 cases, Colon and Rectum Adenocarcinoma (COADREAD) with 296 cases, Uterine Corpus Endometrial Carcinoma (UCEC) with 480 cases, and Lung Adenocarcinoma (LUAD) with 453 cases. Regarding transcriptomic data, we identify 352 unique genomic functions and 42 biological processes, as cataloged in the Kyoto Encyclopedia of Genes and Genomes database (KEGG)222https://www.genome.jp/kegg/. More details about the dataset are provided in Supplementary Material.
Evaluation Metrics.
The models are evaluated using the concordance index (c-index), where a higher value indicates better performance. This index quantifies the proportion of all possible pairs of observations for which the model accurately predicts the sequence of actual survival outcomes.
Implementation.
For WSI preprocessing, we segmented each WSI into regions of pixels at a magnification level of , subsequently subdividing these regions into patches of pixels. The Rectified Adam (RAdam) optimizer was utilized to facilitate model optimization, with a batch size set to 1, a learning rate of , and a weight decay parameter of . The Pathology Encoder (Wang et al., 2021) generates 768-dimensional embeddings that are projected to 512 dimensions. The Genomics Encoder comprises a two-layer feed-forward network designed to produce genomic tokens with 512 dimensions. All computational experiments were conducted on an NVIDIA-A800 GPU. To enhance the robustness of model training, 5-fold cross-validation was applied on all models.
4.2. Comparisons with the State-of-the-Art
To perform a comprehensive comparison with our method, we implemented and evaluated some latest survival prediction methods. We compared our method against the unimodal baselines and the multi-modal SOTA methods. Table 1 shows the experimental results of all methods on all five TCGA datasets.
Unimodal baselines. For transcriptomic data, we specifically implemented SNN (Klambauer et al., 2017) and SNNTrans (Klambauer et al., 2017; Kleinbaum and Klein, 1996). SNN takes the concatenated genomic profiles as a feature vector and predicts the survival outcomes. SNNTrans initially categorizes the genomic data according to the functions and then utilizes TransMIL (Shao et al., 2021) to predict the overall survival. For histology, we compared the SOTA MIL methods ABMIL (Ilse et al., 2018), CLAM (Lu et al., 2021), TransMIL (Shao et al., 2021).
Multi-modal baselines. We compared SOTA methods for multi-modal survival outcome prediction with the previous set-based network architectures (ABMIL, CLAM, TransMIL) with concatenation (Cat) and Kronecker product (KP), two common late fusion mechanisms to integrate bag-level WSI features and genomic features as multi-modal baselines. We also compared MCAT (Chen et al., 2021b), MOTCat (Xu and Chen, 2023) and SurvPath (Jaume et al., 2023) three SOTA methods for multi-modal survival outcome prediction.
Unimodal v.s. Multi-modal. Compared with all unimodal methods, our proposed SurvMamba achieved the highest performance in all five datasets, indicating effective integration of multi-modal features in our method. In comparison with methods for genomic data, SNN and SNNTrans, SurvMamba outperformed them on all benchmarks, with overall c-index performance increases of 11.1% and 10.5%, respectively. Against the pathology baselines, SurvMamba improved on all the pathology-based unimodal approaches, with performance improvements in the overall c-index ranging 10.0% to 12.4%, demonstrating the merit of integrating histopathology and genomic features. The comparison results also highlight the benefits of utilizing multi-modality in survival prediction.
Multi-modal SOTA v.s. SurvMamba. SurvMamba outperforms all multi-modal approaches with an overall c-index performance increase ranging from 1.6% to 10.3%. In comparative analyses within each dataset, SurvMamba achieved the highest c-index performance in four out of five cancer benchmarks, demonstrating its potential as a general method for survival prediction task. When compared with MIL-based multi-modal methods with different fusion methods, SurvMamba achieved a performance increase in overall c-index ranging from 5.9% to 10.3%, highlighting the effectiveness of the proposed multi-modal integration method. Besides, our model also outperforms other SOTA multi-modal learning methods by a obvious margin, including MCAT, MOTCat, and SurvPath, showcasing its outstanding ability for multi-modal learning for prognosis.
| Model | Params | FLOPs | c-index |
| TransMIL (KP) | 2339.20K | 6.01G | 0.658 |
| MCAT | 4869.64K | 24.796G | 0.670 |
| MOTCat | 4869.64K | 24.796G | 0.686 |
| SurvPath | 854.15K | 5.19G | 0.701 |
| SurvMamba | 398.85K | 2.51G | 0.717 |
| Model | HIM | IFM | BRCA | BLCA | COADREAD | UCEC | LUAD | Overall | ||
|---|---|---|---|---|---|---|---|---|---|---|
| Fine-grained | Coarse-grained | Fine-grained | Coarse-grained | |||||||
| A | 0.6880.023 | 0.6670.031 | 0.6600.031 | 0.6860.015 | 0.6680.047 | 0.674 | ||||
| B | ✓ | 0.7080.011 | 0.6830.065 | 0.6660.022 | 0.7170.023 | 0.6740.309 | 0.689 | |||
| C | ✓ | ✓ | 0.7070.007 | 0.6910.030 | 0.6810.030 | 0.7190.020 | 0.6750.033 | 0.695 | ||
| D | ✓ | ✓ | ✓ | 0.7110.081 | 0.7000.034 | 0.6840.036 | 0.7210.017 | 0.6890.016 | 0.701 | |
| E | ✓ | ✓ | ✓ | 0.7090.010 | 0.6960.013 | 0.6870.030 | 0.7200.010 | 0.6790.019 | 0.698 | |
| F | ✓ | ✓ | ✓ | ✓ | 0.7370.014 | 0.7200.027 | 0.6970.018 | 0.7310.012 | 0.7020.020 | 0.717 |
Computational Cost Comparison. Existing frameworks for multi-modal survival prediction are based on the attention mechanism to model the intra- and inter-relationships, while our method leverages the state space model. To validate the computational efficiency of our method, we compared SurvMamba with some multi-modal SOTA methods which show the top 5 on the overall c-index of the five TCGA datasets. The computational complexity is evaluated using model parameters (Params) and floating-point operation count (FLOPs). Params evaluates the network’s scale, while FLOPs assess the model’s complexity. As shown in Table 2, we report the overall c-index on the TCGA dataset, Params, and FLOPs for different SOTA models. Compared to TransMIL, the model size and GPU memory of SurvMamba are reduced by 82.9% and 58.2% with a 5.9% better overall c-index. Compared to the second best method SurvPath, SurvMamba also decreases by 53.3% and 51.6% in model size and GPU memory with a 1.6% better c-index. These results show that our model achieves superior performance compared to the state-of-the-art methods with reduced computational cost.
4.3. Ablation Study
In this ablation study, we conducted some extra experiments to investigate the effectiveness of the key components of SurvMamba. Furthermore, we compared the performance of unidirectional and bidirectional Mamba designs in our method.
Ablation of components.
We conducted ablation studies on five TCGA cancer datasets to validate the effectiveness of the proposed modules. Detailed experimental setups are as follows:
-
(A)
None: All fine-grained histological or genomic features are fed as an input vector into the Bi-Mamba block. These unimodal features are then concatenated to predict survival outcomes.
-
(B)
Fine-grained HIM: Utilizes shared Bi-Mamba in HIM to refine fine-grained features across specific groups, enhancing these features for prediction without considering coarse-grained information.
-
(C)
Multi-grained HIM: Extends Model (B) by incorporating coarse-grained information and integrating multi-grained data for prediction.
-
(D)
Multi-grained HIM + Fine-grained IFM: Model (C) with IFM for fine-grained features.
-
(E)
Multi-grained HIM + Coarse-grained IFM: Model (C) with IFM for coarse-grained features.
-
(F)
Multi-grained HIM + Multi-grained IFM: Model (C) with IFM for multi-grained features (i.e., SurvMamba).
Table 3 illustrates that Model B, by grouping and processing fine-grained features rather than directly learning from extensive sequences of these features like Model A, more effectively identifies nuanced local relationships. This methodological shift results in a c-index increase from 0.674 to 0.689. The introduction of coarse-grained information, representing broader characteristics in Model C further enhances the c-index to 0.695. These outcomes highlight the advantage of a hierarchical approach in harnessing multi-grained information for prognostic purposes. Improving upon Model C, the application of IFM to integrate and interact with fine- or coarse-grained features resulted in a c-index of 0.701 and 0.689, respectively. This demonstrates the IFM module’s effectiveness in integrating multi-modal features. Our proposed SurvMamba model, facilitating both intra-modal and inter-modal interactions and integrations across different granularity levels, delivers a notable c-index of 0.717. Results of the ablation study illustrate the benefits of integrating fine and coarse-grained features and the promising SSM architecture for survival outcome prediction.
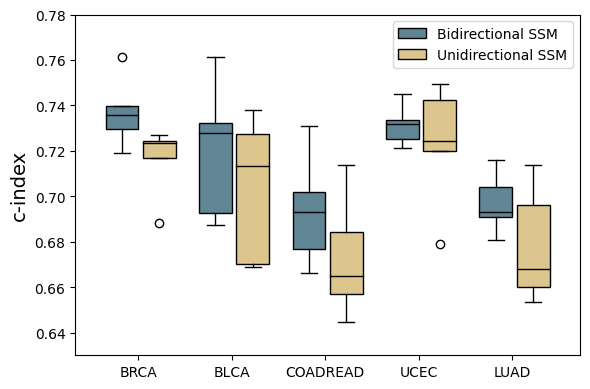
Impact of Bidirectional and Unidirectional SSM
Figure 3 demonstrates that integrating bidirectionality into state space models significantly enhances prognostic predictions, as indicated by a higher median c-index and a narrower interquartile range. This effect is particularly pronounced in the BRCA dataset, where the boxplots show minimal overlap, suggesting a robust improvement. This improvement is likely due to the model’s enhanced ability to capture complex, bidirectional dependencies within histological and genomic features.
4.4. Survival Analysis
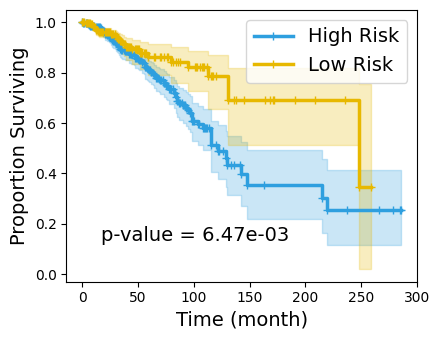
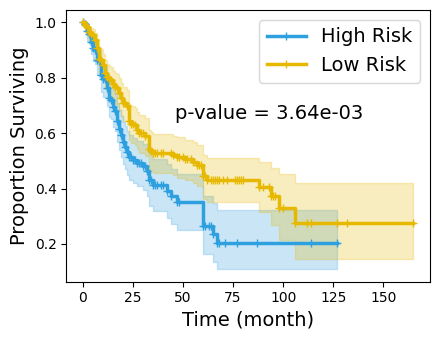
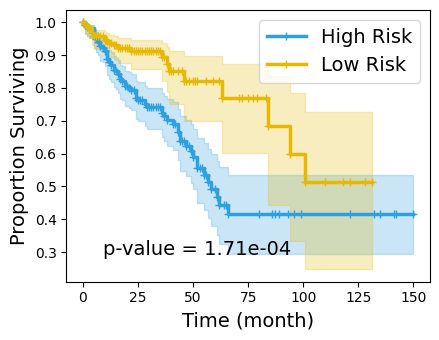
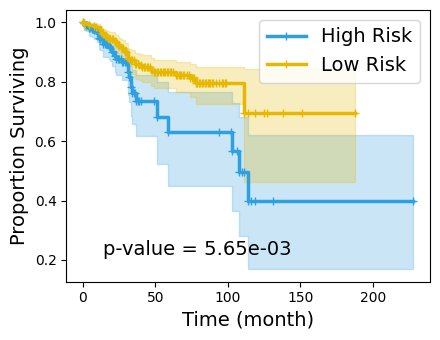
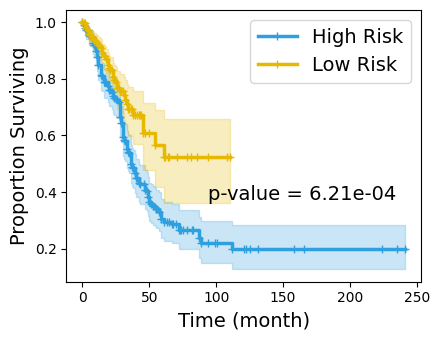
To further validate the effectiveness of SurvMamba for survival analysis, we divided all patients into a low-risk group and a high-risk group based on the median value of the predicted risk scores generated by SurvMamba. Then, we utilize Kaplan-Meier analysis to visualize the survival events of all patients. Meanwhile, we also employ the Logrank test (-value) to measure the statistical significance between the low-risk group and the high-risk group. A -value of less than 0.05 indicates statistical significance. As shown in Figure 4, patients in the low-risk and high-risk groups are stratified clearly on all datasets, demonstrating the prognostic value of SurvMamba in predicting patient outcomes and guiding treatment decisions.
5. Conclusion
In this paper, we proposed a novel state space model with multi-grained multi-modal interaction, termed SurvMamba, for survival prediction from WSIs and transcriptomic data. SurvMamba utilizes multi-grained information from hierarchical structures in WSIs and transcriptomic data. We introduced a HIM module that facilitates efficient interactions between intra-modal features at different granularity levels, thereby enriching the unimodal representations. Furthermore, we introduced an IFM module to integrate inter-modal features across various levels, capturing more comprehensive multi-modal features for survival analysis. The experimental results demonstrate SurvMamba’s superiority in both performance and computational efficiency, underlining its potential for clinical utilization, such as informing diagnostic and treatment choices for cancer patients.
References
- (1)
- Chen et al. (2022a) Richard J Chen, Chengkuan Chen, Yicong Li, Tiffany Y Chen, Andrew D Trister, Rahul G Krishnan, and Faisal Mahmood. 2022a. Scaling vision transformers to gigapixel images via hierarchical self-supervised learning. In Proceedings of the IEEE/CVF Conference on Computer Vision and Pattern Recognition. 16144–16155.
- Chen et al. (2021a) Richard J Chen, Ming Y Lu, Muhammad Shaban, Chengkuan Chen, Tiffany Y Chen, Drew FK Williamson, and Faisal Mahmood. 2021a. Whole slide images are 2d point clouds: Context-aware survival prediction using patch-based graph convolutional networks. In Medical Image Computing and Computer Assisted Intervention–MICCAI 2021: 24th International Conference, Strasbourg, France, September 27–October 1, 2021, Proceedings, Part VIII 24. Springer, 339–349.
- Chen et al. (2020) Richard J Chen, Ming Y Lu, Jingwen Wang, Drew FK Williamson, Scott J Rodig, Neal I Lindeman, and Faisal Mahmood. 2020. Pathomic fusion: an integrated framework for fusing histopathology and genomic features for cancer diagnosis and prognosis. IEEE Transactions on Medical Imaging 41, 4 (2020), 757–770.
- Chen et al. (2021b) Richard J Chen, Ming Y Lu, Wei-Hung Weng, Tiffany Y Chen, Drew FK Williamson, Trevor Manz, Maha Shady, and Faisal Mahmood. 2021b. Multimodal co-attention transformer for survival prediction in gigapixel whole slide images. In Proceedings of the IEEE/CVF International Conference on Computer Vision. 4015–4025.
- Chen et al. (2022b) Richard J Chen, Ming Y Lu, Drew FK Williamson, Tiffany Y Chen, Jana Lipkova, Zahra Noor, Muhammad Shaban, Maha Shady, Mane Williams, Bumjin Joo, et al. 2022b. Pan-cancer integrative histology-genomic analysis via multimodal deep learning. Cancer Cell 40, 8 (2022), 865–878.
- David and Mitchel (2012) G Kleinbaum David and Klein Mitchel. 2012. Survival analysis: a Self-Learning text.
- Fu et al. (2022) Daniel Y Fu, Tri Dao, Khaled K Saab, Armin W Thomas, Atri Rudra, and Christopher Ré. 2022. Hungry hungry hippos: Towards language modeling with state space models. arXiv preprint arXiv:2212.14052 (2022).
- Fu et al. (2020) Yu Fu, Alexander W Jung, Ramon Viñas Torne, Santiago Gonzalez, Harald Vöhringer, Artem Shmatko, Lucy R Yates, Mercedes Jimenez-Linan, Luiza Moore, and Moritz Gerstung. 2020. Pan-cancer computational histopathology reveals mutations, tumor composition and prognosis. Nature cancer 1, 8 (2020), 800–810.
- Gu and Dao (2023) Albert Gu and Tri Dao. 2023. Mamba: Linear-time sequence modeling with selective state spaces. arXiv preprint arXiv:2312.00752 (2023).
- Gu et al. (2021) Albert Gu, Karan Goel, and Christopher Ré. 2021. Efficiently modeling long sequences with structured state spaces. arXiv preprint arXiv:2111.00396 (2021).
- Gui et al. (2023) Cheng-Peng Gui, Yu-Hang Chen, Hong-Wei Zhao, Jia-Zheng Cao, Tian-Jie Liu, Sheng-Wei Xiong, Yan-Fei Yu, Bing Liao, Yun Cao, Jia-Ying Li, et al. 2023. Multimodal recurrence scoring system for prediction of clear cell renal cell carcinoma outcome: a discovery and validation study. The Lancet Digital Health 5, 8 (2023), e515–e524.
- Ietswaart et al. (2021) Robert Ietswaart, Benjamin M Gyori, John A Bachman, Peter K Sorger, and L Stirling Churchman. 2021. GeneWalk identifies relevant gene functions for a biological context using network representation learning. Genome biology 22 (2021), 1–35.
- Ilse et al. (2018) Maximilian Ilse, Jakub Tomczak, and Max Welling. 2018. Attention-based deep multiple instance learning. In International conference on machine learning. PMLR, 2127–2136.
- Jaume et al. (2023) Guillaume Jaume, Anurag Vaidya, Richard Chen, Drew Williamson, Paul Liang, and Faisal Mahmood. 2023. Modeling dense multimodal interactions between biological pathways and histology for survival prediction. arXiv preprint arXiv:2304.06819 (2023).
- Kanehisa and Goto (2000) Minoru Kanehisa and Susumu Goto. 2000. KEGG: kyoto encyclopedia of genes and genomes. Nucleic acids research 28, 1 (2000), 27–30.
- Ke et al. (2023) Jing Ke, Yiqing Shen, Yizhou Lu, Yi Guo, and Dinggang Shen. 2023. Mine local homogeneous representation by interaction information clustering with unsupervised learning in histopathology images. Computer Methods and Programs in Biomedicine 235 (2023), 107520.
- Klambauer et al. (2017) Günter Klambauer, Thomas Unterthiner, Andreas Mayr, and Sepp Hochreiter. 2017. Self-normalizing neural networks. Advances in neural information processing systems 30 (2017).
- Kleinbaum and Klein (1996) David G Kleinbaum and Mitchel Klein. 1996. Survival analysis a self-learning text. Springer.
- Li et al. (2021) Bin Li, Yin Li, and Kevin W Eliceiri. 2021. Dual-stream multiple instance learning network for whole slide image classification with self-supervised contrastive learning. In Proceedings of the IEEE/CVF conference on computer vision and pattern recognition. 14318–14328.
- Li et al. (2024) Hao Li, Ying Chen, Yifei Chen, Wenxian Yang, Bowen Ding, Yuchen Han, Liansheng Wang, and Rongshan Yu. 2024. Generalizable Whole Slide Image Classification with Fine-Grained Visual-Semantic Interaction. arXiv preprint arXiv:2402.19326 (2024).
- Li et al. (2022) Ruiqing Li, Xingqi Wu, Ao Li, and Minghui Wang. 2022. HFBSurv: hierarchical multimodal fusion with factorized bilinear models for cancer survival prediction. Bioinformatics 38, 9 (2022), 2587–2594.
- Lu et al. (2021) Ming Y Lu, Drew FK Williamson, Tiffany Y Chen, Richard J Chen, Matteo Barbieri, and Faisal Mahmood. 2021. Data-efficient and weakly supervised computational pathology on whole-slide images. Nature biomedical engineering 5, 6 (2021), 555–570.
- Mehta et al. (2022) Harsh Mehta, Ankit Gupta, Ashok Cutkosky, and Behnam Neyshabur. 2022. Long range language modeling via gated state spaces. arXiv preprint arXiv:2206.13947 (2022).
- Milanez-Almeida et al. (2020) Pedro Milanez-Almeida, Andrew J Martins, Ronald N Germain, and John S Tsang. 2020. Cancer prognosis with shallow tumor RNA sequencing. Nature medicine 26, 2 (2020), 188–192.
- Qiu et al. (2023) Lin Qiu, Aminollah Khormali, and Kai Liu. 2023. Deep biological pathway informed pathology-genomic multimodal survival prediction. arXiv preprint arXiv:2301.02383 (2023).
- Shao et al. (2019) Wei Shao, Zhi Han, Jun Cheng, Liang Cheng, Tongxin Wang, Liang Sun, Zixiao Lu, Jie Zhang, Daoqiang Zhang, and Kun Huang. 2019. Integrative analysis of pathological images and multi-dimensional genomic data for early-stage cancer prognosis. IEEE transactions on medical imaging 39, 1 (2019), 99–110.
- Shao et al. (2021) Zhuchen Shao, Hao Bian, Yang Chen, Yifeng Wang, Jian Zhang, Xiangyang Ji, et al. 2021. Transmil: Transformer based correlated multiple instance learning for whole slide image classification. Advances in neural information processing systems 34 (2021), 2136–2147.
- Smith et al. (2022) Jimmy TH Smith, Andrew Warrington, and Scott W Linderman. 2022. Simplified state space layers for sequence modeling. arXiv preprint arXiv:2208.04933 (2022).
- Smug et al. (2023) Bogna J Smug, Krzysztof Szczepaniak, Eduardo PC Rocha, Stanislaw Dunin-Horkawicz, and Rafał J Mostowy. 2023. Ongoing shuffling of protein fragments diversifies core viral functions linked to interactions with bacterial hosts. Nature Communications 14, 1 (2023), 7460.
- Subramanian et al. (2021) Vaishnavi Subramanian, Tanveer Syeda-Mahmood, and Minh N Do. 2021. Multimodal fusion using sparse CCA for breast cancer survival prediction. In 2021 IEEE 18th International Symposium on Biomedical Imaging (ISBI). IEEE, 1429–1432.
- Tong et al. (2023) Mengsha Tong, Yuxiang Lin, Wenxian Yang, Jinsheng Song, Zheyang Zhang, Jiajing Xie, Jingyi Tian, Shijie Luo, Chenyu Liang, Jialiang Huang, et al. 2023. Prioritizing prognostic-associated subpopulations and individualized recurrence risk signatures from single-cell transcriptomes of colorectal cancer. Briefings in Bioinformatics 24, 3 (2023), bbad078.
- Tran et al. (2021) Khoa A Tran, Olga Kondrashova, Andrew Bradley, Elizabeth D Williams, John V Pearson, and Nicola Waddell. 2021. Deep learning in cancer diagnosis, prognosis and treatment selection. Genome Medicine 13 (2021), 1–17.
- Wang et al. (2021) Xiyue Wang, Sen Yang, Jun Zhang, Minghui Wang, Jing Zhang, Junzhou Huang, Wei Yang, and Xiao Han. 2021. Transpath: Transformer-based self-supervised learning for histopathological image classification. In Medical Image Computing and Computer Assisted Intervention–MICCAI 2021: 24th International Conference, Strasbourg, France, September 27–October 1, 2021, Proceedings, Part VIII 24. Springer, 186–195.
- Xu and Chen (2023) Yingxue Xu and Hao Chen. 2023. Multimodal optimal transport-based co-attention transformer with global structure consistency for survival prediction. In Proceedings of the IEEE/CVF International Conference on Computer Vision. 21241–21251.
- Zadeh and Schmid (2020) Shekoufeh Gorgi Zadeh and Matthias Schmid. 2020. Bias in cross-entropy-based training of deep survival networks. IEEE transactions on pattern analysis and machine intelligence 43, 9 (2020), 3126–3137.
- Zhang et al. (2024a) Daiwei Zhang, Amelia Schroeder, Hanying Yan, Haochen Yang, Jian Hu, Michelle YY Lee, Kyung S Cho, Katalin Susztak, George X Xu, Michael D Feldman, et al. 2024a. Inferring super-resolution tissue architecture by integrating spatial transcriptomics with histology. Nature Biotechnology (2024), 1–6.
- Zhang et al. (2021) Xi Zhang, Yining Hu, and David Roy Smith. 2021. Protocol for HSDFinder: Identifying, annotating, categorizing, and visualizing duplicated genes in eukaryotic genomes. STAR protocols 2, 3 (2021), 100619.
- Zhang et al. (2024b) Yilan Zhang, Yingxue Xu, Jianqi Chen, Fengying Xie, and Hao Chen. 2024b. Prototypical Information Bottlenecking and Disentangling for Multimodal Cancer Survival Prediction. arXiv preprint arXiv:2401.01646 (2024).
- Zhu et al. (2024) Lianghui Zhu, Bencheng Liao, Qian Zhang, Xinlong Wang, Wenyu Liu, and Xinggang Wang. 2024. Vision mamba: Efficient visual representation learning with bidirectional state space model. arXiv preprint arXiv:2401.09417 (2024).