On Training Data Influence of GPT Models
Abstract
Amidst the rapid advancements in generative language models, the investigation of how training data shapes the performance of GPT models is still emerging. This paper presents GPTfluence, a novel approach that leverages a featurized simulation to assess the impact of training examples on the training dynamics of GPT models. Our approach not only traces the influence of individual training instances on performance trajectories, such as loss and other key metrics, on targeted test points but also enables a comprehensive comparison with existing methods across various training scenarios in GPT models, ranging from 14 million to 2.8 billion parameters, across a range of downstream tasks. Contrary to earlier methods that struggle with generalization to new data, GPTfluence introduces a parameterized simulation of training dynamics, demonstrating robust generalization capabilities to unseen training data. This adaptability is evident across both fine-tuning and instruction-tuning scenarios, spanning tasks in natural language understanding and generation. We will make our code and data publicly available.
On Training Data Influence of GPT Models
Qingyi Liu Yekun Chai††thanks: Equal contribution and shared co-first authorship. Work done during QL’s internship at Baidu. Shuohuan Wang Yu Sun Qiwei Peng Keze Wang Hua Wu Sun Yat-sen University Baidu Inc. University of Copenhagen {liuqy95}@mail2.sysu.edu.cn {chaiyekun,wangshuohuan,sunyu02}@baidu.com
1 Introduction
The advent of generative language models, particularly the GPT series Radford et al. (2019); Brown et al. (2020); Zhang et al. (2022), has marked a paradigm shift in natural language processing (NLP) Touvron et al. (2023); Jiang et al. (2023), code generation Lozhkov et al. (2024); Chai et al. (2023), visual and language understanding Achiam et al. (2023); Team et al. (2023). These models have redefined performance standards across an extensive range of tasks, igniting detailed investigations into the process of training dynamics and the intricate nature of learned representations. Despite these strides, the specific influence of individual training examples on the performance of GPT models remains a significantly underexplored area. This oversight presents a critical challenge in optimizing training processes, a challenge that grows in tandem with the increasing complexity and scale of these models.
Current research has yet to focus comprehensively on the influence of training data on autoregressive language models. Prior studies, such as those utilizing the BERT Park et al. (2023) or T5 architecture Guu et al. (2023), have predominantly concentrated on natural language understanding tasks, leaving a considerable void in the exploration of generative language models.
Furthermore, the majority of this research Pruthi et al. (2020); Guu et al. (2023); K and Søgaard (2021); Koh and Liang (2017); Yeh et al. (2018) has focused on test loss as the primary metric of interest, neglecting other vital performance indicators. Metrics such as BLEU Papineni et al. (2002) and ROUGE Lin (2004) scores are crucial for a thorough evaluation of a model’s capabilities, particularly in the context of generative language models where downstream task performance is paramount. Additionally, the challenge of generalizability—extending methodologies to accommodate unseen data—persists as a significant barrier Guu et al. (2023). This is particularly critical for models expected to adapt to the dynamic and evolving trajectory of NLP tasks.
In response to these gaps, we introduce GPTfluence, a novel framework designed to extend the analysis of training data influence beyond the limitations of existing methodologies and across a broader spectrum of tasks. Employing a featurized simulation approach, GPTfluence estimates the impact of individual training examples on the performance of GPT models, covering both natural language understanding and generation tasks. This expanded focus facilitates a comprehensive understanding of model training dynamics, providing insights into a wide array of evaluation metrics beyond mere test loss.
Extensive experiments on selected subsets from FLAN datasets Wei et al. (2022), across a variety of tasks and GPT model variants Biderman et al. (2023), ranging in size from 14 million to 2.8 billion parameters, validate the effectiveness and superiority of our approach. Notably, our method not only sheds light on the training dynamics of GPT models but also demonstrates remarkable generalization capabilities to unseen data.
Contribution
To encapsulate, our contributions are summarized as follows: (1) We introduce GPTfluence, a featurized simulation approach that significantly advances the analysis of training data influence on GPT models. This approach not only enables a comprehensive comparison with existing methodologies but also marks the first extensive foray into the extensive investigation of training data’s impact on the performance of GPT models across various scales. (2) Our approach demonstrates effectiveness on GPT models across different scales, showing its generalization capability on unseen data. (3) We release the GPTDynamics dataset, a collection encompassing over 350 runs of training dynamics data spanning six distinct model sizes and five NLP tasks, to facilitate further research advancement.
2 Preliminaries
In this section, we revisit the conceptual framework of training data attribution (TDA) methods, aiming to quantify the impact of individual training instances on the performance of models with respect to test data points.
2.1 Task Definition
Considering the data space , such as datasets utilized for instruction-tuning, we denote a training example by and a test example by in . We employ a model, specifically a GPT variant in our experiments, parameterized by weights . Our objective is to forecast the model’s performance on a target metric , with a main focus in existing literature on predicting test set loss Pruthi et al. (2020); Guu et al. (2023).
Practically, this involves working with a sequence of training batches , delineating a training curriculum. Here, symbolizes the batch of training examples utilized at step . The crux of our task is to ascertain the influence of training examples on a test example of interest , specifically in terms of a test metric score , given the training curriculum . This involves tracking changes in performance trajectory as a function of the curriculum , with prior research predominantly focused on test loss prediction, rather than a broader spectrum of performance metrics.
2.2 Training Data Attribution
TracIn
Inspired by the fundamental theorem of calculus—which posits that the integral of a function’s gradient over an interval equals the function’s value difference across that interval—TracIn Pruthi et al. (2020) employs the first-order Taylor expansion to quantify the data influence on test example loss at each step as follows:
| (1) |
where represents the learning rate at step , and signifies the gradient of the loss function with respect to the model weights .
It adopts an influence measurement that utilizes checkpoint ensembling, dubbed TracInCP. This approach aggregates the influences calculated at predefined intervals throughout the training, providing a comprehensive view of the training data’s impact over time.
| (2) |
where denotes the loss change w.r.t. the training example , and indicates the total number of model checkpoints saved during training.
Simfluence Guu et al. (2023) approaches the challenge by learning a linear function that correlates training samples with the test loss , expressed as:
| (3) |
Here, and , the multiplicative and additive factors respectively, are determined using a linear model, with indicating the batch of examples consumed at training step . Although it offers a data-driven simulator derived from training dynamics trajectories, its mapping from training data indices to test data points constrains generalizability to new, unseen data.
While TracIn leverages the neural model’s first-order gradients and Simfluence employs a data-driven simulation approach, both primarily focus on predicting test loss. Our proposed method aligns with Simfluence’s direction but seeks to overcome its limitations, extending our focus to encompass a wider array of performance metrics beyond mere test loss prediction.
3 GPTfluence: Featurized Simulation-based Approach

3.1 Overview
We present GPTfluence, a novel approach for tracking the impact of training examples on the training dynamics of GPT models using a featurized simulator. Figure 1 depicts the process of GPTfluence, encompassing the collection of training dynamics, the training of the simulator, and the execution of the final simulation. Similar to Guu et al. (2023), our initial step involves gathering a comprehensive dataset of training dynamics, which captures both the training curriculum and various target metrics for test examples, extending beyond traditional loss metrics to include performance measures like BLEU and ROUGE scores.
GPTfluence models these dynamics via an -th order Markov process, incorporating both multiplicative and additive factors to reflect the influence of training examples. At its core, the simulator uses a pre-trained encoder to attain the general representation of training and test examples, ensuring adaptability to new, unseen data. This is achieved by modeling the intricate interplay between examples through the interactions within their condensed hidden vector representations. In its application, it can autoregressively forecast the complete performance trajectory of a test example, starting from its initial performance metrics and following the specified training curriculum.
The collection of training dynamics is pivotal for predicting a test sample’s performance trajectory throughout the training process. As outlined in §2.1, a time steps training run is characterized by a sequence of training batches , each contributing to the model’s evolving parameters, , through gradient descent.
To monitor the performance evolution of a particular test example , we record its metric scores at every training step , employing a variety of evaluation metrics beyond mere loss, such as BLEU and ROUGE. This comprehensive record, denoted as , tracks the test example’s performance across all steps of training.
From a broader dataset , we sample subsets for GPT model training, resulting in distinct training runs. These runs yield a rich dataset of training dynamics , encapsulating both the training curricula and the sequential target metric scores for each test point . This dataset is represented as .
3.2 Featurized Simulation Approach
In this work, we introduce a featurized simulation methodology designed to capture the effects of training examples on GPT model training dynamics. This method is predicated on conceptualizing the training process as a sequential, time-evolving Markov process, thereby enabling the simulation of metric trajectories across training iterations. Building upon the foundational insights of Guu et al. (2023), our model extends the conventional first-order Markov assumption to an -th order Markov process. This allows for the consideration of a test sample , where its performance metric at any given timestep is influenced by its performance across the preceding steps, encapsulated as .
Our approach integrates both multiplicative and additive components within the simulation. The performance trajectory of a test sample is thus delineated by a combination of these factors, formulated as follows:
| (4) |
where and represent the learned functions attributed to the current training batch . Here, and are determined through the aggregation of influence factors and , respectively, across the training examples in :
| (5) |
We introduce a parameterized, featurized simulator that employs a pre-trained encoder such as BERT Devlin et al. (2019) and GPT Radford et al. (2019). This is adept at processing each training example and test example , generating predictive influence factors and through the encoded representations and :
| (6) |
where and are the low-dimensional embeddings of the training and test examples, respectively. To preserve the encoder’s semantic generalizability, we keep it frozen during the simulator’s training.
The multiplicative and additive influence factors are then derived by passing the embeddings through the corresponding linear projections, which are subsequently integrated using a Frobenius product as follows:
| (7) | ||||
| (8) |
where are learnable weights, represents the Frobenius inner product between the hidden representations of the training and test examples, yielding a refined estimation of the multiplicative influence exerted by each training example on the test example’s performance trajectory. Our approach offers a granular and comprehensive analysis of training dynamics through this intricate data-driven simulation.
To learn our featurized simulator , we optimize the following L2-regularized regression objective:
| (9) |
where is the discounting factor dictating the degree of L2-regularization, is the test score prediction at step using Eq.(4). Refer to Algorithm 1 for the pseudo-code.
| Method | #Param | RTE | SST-2 | BoolQ | ||||||
| All-Steps MSE () | All-Steps MAE () | Final-Step Spearman’s () | All-Steps MSE () | All-Steps MAE () | Final-Step Spearman’s () | All-Steps MSE () | All-Steps MAE () | Final-Step Spearman’s () | ||
| TracIn-CP (10-steps) | 410M | 1.156(0.838) | 0.787(0.339) | 0.460 | 0.551(0.560) | 0.584(0.307) | -0.089 | 0.957(0.728) | 0.735(0.332) | -0.066 |
| TracIn-CP (all-steps) | 0.757(0.591) | 0.629(0.299) | 0.460 | 0.446(0.555) | 0.525(0.321) | -0.089 | 0.782(0.690) | 0.680(0.339) | -0.066 | |
| Grad-Dot | 12.061(3.688) | 2.906(0.410) | 0.459 | 7.715(1.543) | 1.918(0.205) | -0.084 | 12.527(3.617) | 2.900(0.344) | -0.071 | |
| Simfluence | 1.477(0.274) | 0.634(0.111) | 0.426(0.340) | 1.133(0.287) | 0.455(0.082) | 0.696(0.156) | 1.189(0.362) | 0.485(0.082) | 0.793(0.201) | |
| Ours | 0.220(0.184) | 0.334(0.140) | 0.644(0.174) | 0.111(0.045) | 0.224(0.047) | 0.834(0.129) | 0.132(0.073) | 0.251(0.075) | 0.828(0.154) | |
| TracIn-CP (10-steps) | 1B | 1.225(0.744) | 0.979(0.344) | -0.203 | 4.412(1.301) | 1.697(0.170) | -0.058 | 0.999(1.034) | 0.793(0.400) | 0.649 |
| TracIn-CP (all-steps) | 1.137(0.740) | 0.939(0.343) | -0.203 | 2.158(0.782) | 1.218(0.187) | -0.058 | 0.858(1.043) | 0.731(0.416) | 0.649 | |
| Grad-Dot | 21.928(7.871) | 4.332 (0.874) | -0.198 | 6.601(1.927) | 2.077(0.193) | -0.057 | 18.270(5.630) | 3.563(0.711) | 0.650 | |
| Simfluence | 0.889(0.551) | 0.523(0.197) | 0.360(0.207) | 0.582(0.253) | 0.410(0.084) | 0.712(0.148) | 0.876(0.470) | 0.469(0.198) | 0.862(0.050) | |
| Ours | 0.099(0.078) | 0.227(0.097) | 0.757(0.123) | 0.096(0.075) | 0.221(0.084) | 0.807(0.175) | 0.068(0.058) | 0.187(0.070) | 0.953(0.034) | |
| TracInCP (10-steps) | 2.8B | 8.869(3.673) | 2.700(0.650) | 0.573 | 0.294(0.235) | 0.447(0.176) | 0.801 | 1.185(1.271) | 0.804(0.436) | 0.184 |
| TracInCP (all-steps) | 10.256(4.396) | 2.967(0.652) | 0.573 | 0.265(0.228) | 0.419(0.178) | 0.801 | 1.183(1.260) | 0.800(0.434) | 0.184 | |
| Grad-Dot | 10.101(9.212) | 2.580(1.327) | 0.573 | 1.216(0.411) | 0.935(0.175) | -0.801 | 1.990(1.082) | 1.219(0.321) | 0.184 | |
| Simfluence-linear | 2.032(1.214) | 0.996(0.360) | 0.845(0.061) | 0.921(0.435) | 0.634(0.194) | 0.912(0.018) | 1.545(1.293) | 0.849(0.412) | 0.681(0.087) | |
| Ours | 0.132(0.172) | 0.273(0.129) | 0.969(0.009) | 0.023(0.015) | 0.123(0.040) | 0.979(0.006) | 0.175(0.232) | 0.305(0.165) | 0.963(0.018) | |
| Method | #Param | WebNLG | WMT-16 DE/EN | Average | ||||||
| All-Steps MSE () | All-Steps MAE () | Final-Step Spearman’s () | All-Steps MSE () | All-Steps MAE () | Final-Step Spearman’s () | All-Steps MSE () | All-Steps MAE () | Final-Step Spearman’s () | ||
| TracIn-CP (10-steps) | 410M | 0.048(0.072) | 0.168(0.115) | 0.836 | 0.030(0.071) | 0.122(0.107) | 0.963 | 0.548 | 0.479 | 0.421 |
| TracIn-CP (all-steps) | 0.050(0.073) | 0.173(0.113) | 0.836 | 0.030(0.071) | 0.123(0.107) | 0.963 | 0.413 | 0.426 | 0.421 | |
| Grad-Dot | 0.062(0.080) | 0.187(0.113) | 0.837 | 0.033(0.073) | 0.127(0.109) | 0.963 | 6.479 | 1.608 | 0.421 | |
| Simfluence | 0.036(0.029) | 0.130(0.049) | 0.986(0.002) | 0.016(0.013) | 0.101(0.034) | 0.997(0.001) | 0.770 | 0.361 | 0.779 | |
| Ours | 0.002(0.002) | 0.033(0.017) | 0.994(0.001) | 0.002(0.004) | 0.033(0.023) | 0.998(0.000) | 0.093 | 0.175 | 0.860 | |
| TracIn-CP (10-steps) | 1B | 0.032(0.053) | 0.132(0.095) | 0.885 | 0.012(0.032) | 0.075(0.069) | 0.981 | 1.336 | 0.735 | 0.451 |
| TracIn-CP (all-steps) | 0.033(0.053) | 0.135(0.094) | 0.885 | 0.012(0.032) | 0.076(0.069) | 0.981 | 0.840 | 0.620 | 0.451 | |
| Grad-Dot | 0.044(0.061) | 0.154(0.097) | 0.881 | 0.013(0.033) | 0.075(0.071) | 0.981 | 9.371 | 2.040 | 0.451 | |
| Simfluence | 0.167(0.127) | 0.323(0.112) | 0.823(0.030) | 0.171(0.269) | 0.309(0.168) | 0.925(0.007) | 0.537 | 0.407 | 0.737 | |
| Ours | 0.007(0.005) | 0.068(0.022) | 0.984(0.005) | 0.004(0.004) | 0.049(0.020) | 0.997(0.001) | 0.055 | 0.150 | 0.900 | |
| TracInCP (10-steps) | 2.8B | 0.005(0.008) | 0.051(0.035) | 0.978 | 0.001(0.002) | 0.020(0.019) | 0.997 | 2.071 | 0.804 | 0.707 |
| TracInCP (all-steps) | 0.005(0.008) | 0.051(0.035) | 0.978 | 0.001(0.002) | 0.020(0.019) | 0.997 | 2.342 | 0.851 | 0.707 | |
| Grad-Dot | 0.015(0.020) | 0.089(0.061) | 0.978 | 0.001(0.002) | 0.021(0.019) | 0.997 | 2.665 | 0.969 | 0.386 | |
| Simfluence-linear | 0.102(0.065) | 0.283(0.091) | 0.971(0.004) | 0.063(0.085) | 0.203(0.119) | 0.991(0.001) | 0.933 | 0.593 | 0.880 | |
| Ours | 0.001(0.001) | 0.024(0.016) | 0.997(0.000) | 0.001(0.002) | 0.020(0.016) | 0.999(0.000) | 0.066 | 0.149 | 0.981 | |
3.3 Connection to Previous Approaches
Our approach offers a flexible framework that, under specific conditions, aligns with established models in the TDA literature. Specifically, when the focus narrows down to the overall influence of per-step dynamics, our approach converges to the datamodels Ilyas et al. (2022); Engstrom et al. (2024). Moreover, in scenarios where the Markov order is set to 1 and the input encoder is configured to process sample indices, our method reduces to Simfluence Guu et al. (2023).
4 Experiments
4.1 Experimental Settings
4.1.1 GPTDynamics Data Collection
Datasets and GPT Training Scenarios In subsequent experiments, we refer to the comprehensive training process that employs the aggregated FLAN datasets along with task-specific instructions as instruction tuning. Conversely, the term fine-tuning is reserved to describe the process of individually optimizing models on separate tasks without the use of instructional prompts. Both instruction tuning and fine-tuning processes are encapsulated within our GPTDynamics dataset. We refer to Appendix §A.1 for detailed information.
GPT Backbone We employed Pythia Biderman et al. (2023), a model suite recently made available to the public, as our foundational architecture. Within this suite, we selected five distinct models based on their sizes, encompassing 14M, 70M, 160M, 410M, 1B, and 2.8B, to ensure a broad range of computational capacities were represented.
4.1.2 Experiment Setup for Simulators
Baselines We select TracIn Pruthi et al. (2020), Grad-Dot Charpiat et al. (2019), and Simfluence Guu et al. (2023) as our baselines. Refer to Appendix §A.2 for detailed information.
Evaluation Metrics We utilize a comprehensive set of metrics, including the Mean Squared Error (MSE) and Mean Absolute Error (MAE) calculated across all training steps, alongside the Spearman correlation coefficient () at the final step, to thoroughly assess performance.
4.2 Test Loss Estimation
Instruction Tuning Table 1 presents a comparison between our approach and traditional TDA methods for instruction tuning. GPTfluence demonstrated a distinct edge over Simfluence and other gradient-based TDA techniques across a set of five natural language understanding (NLU) and natural language generation (NLG) tasks, as evidenced by the MSE and MAE metrics for the entire trajectory, alongside the Spearman correlation coefficients at the final time step across various test samples. Examples are shown in Fig. LABEL:fig:loss_a and LABEL:fig:loss_b. Additionally, we observed that while the effectiveness of all evaluated TDA methods in predicting loss trajectories varied with changes in GPT sizes, GPTfluence maintained optimal performance, independent of the GPT scale.
| Dataset | Method | All-Steps MSE () | All-Steps MAE () | Final-Step Spearman’s () |
| RTE | Simfluence | 0.035(0.022) | 0.151(0.054) | 0.743(0.094) |
| Ours | 0.036(0.029) | 0.151(0.060) | 0.746(0.095) | |
| SST-2 | Simfluence | 0.037(0.017) | 0.128(0.030) | 0.938(0.074) |
| Ours | 0.014(0.006) | 0.081(0.018) | 0.943(0.073) | |
| BoolQ | Simfluence | 0.032(0.019) | 0.140(0.038) | 0.992(0.002) |
| Ours | 0.011(0.011) | 0.082(0.049) | 0.994(0.002) | |
| WebNLG | Simfluence | 0.016(0.012) | 0.094(0.036) | 0.984(0.002) |
| Ours | 0.011(0.014) | 0.078(0.043) | 0.985(0.002) | |
| WMT-16 | Simfluence | 0.010(0.008) | 0.067(0.029) | 0.998(0.003) |
| DE/EN | Ours | 0.002(0.002) | 0.031(0.018) | 0.999(0.000) |
| Average | Simfluence | 0.026 | 0.116 | 0.931 |
| Ours | 0.015 | 0.084 | 0.933 |
Fine-tuning In Table 2, it is evident that our approach consistently outperforms Simfluence when it comes to fine-tuning GPT models. On average, our method reduces the MSE and MAE across all training steps by and , respectively, when compared to Simfluence. This implies that our method is more robust and adaptable in simulating training dynamics.
4.3 Generalizing to Test Metric Estimation
We have expanded the evaluation of our model beyond the mere prediction of test loss, now including vital measures such as ROUGE and BLEU scores. We have not reported the performance of TracIn and Grad-Dot baselines due to its inability on such metric predictions.
Instruction Tuning As for instruction tuning, our findings, displayed in Table 4, demonstrate a superior performance of our method over Simfluence in predicting both BLEU and ROUGE-L scores and for GPTs of varying sizes. Intuitively, We draw some qualitative examples in the Fig. LABEL:fig:bleu_c and LABEL:fig:rougeL_d. Notably, for BLEU simulation on the WMT-16 DE/EN task, as the size of GPT increases, all steps MSE of Simfluence increases, whereas our method maintains a more stable performance, even exhibiting slight improvements from 0.92 to 0.93 in loss prediction accuracy at the final step. This suggests that our model is better equipped to manage more challenging tasks and larger model sizes, leveraging the pre-trained representations and instance interactions.
Fine-tuning Our method’s superiority remains evident in the fine-tuning scenario, as depicted in Table 4, underscoring the robustness of our feature-based simulation approach. It’s worth noting that the margin by which GPTfluence outperforms Simfluence in BLEU metric simulation is not as pronounced in fine-tuning contexts as it is in instruction tuning settings. This discrepancy is likely due to the richer and more diverse data available in instruction tuning, which accentuates Simfluence’s relative inefficiency, given its independent parameter learning for each training instance and a distinct simulator for each test instance.
| Method | #Param | WebNLG | |||||
| BLEU | ROUGE-L | ||||||
| All-steps MSE () | All-steps MAE () | Final-step Spearman’s () | All-steps MSE () | All-steps MAE () | Final-step Spearman’s () | ||
| Simfluence | 410M | 23.47(63.52) | 2.34(3.26) | 0.81(0.02) | 0.007(0.008) | 0.055(0.038) | 0.708(0.067) |
| Ours | 9.11(18.41) | 1.73(1.82) | 0.90(0.03) | 0.005(0.006) | 0.045(0.034) | 0.796(0.047) | |
| Simfluence | 1B | 20.58(60.80) | 2.01(3.03) | 0.87(0.03) | 0.006(0.006) | 0.052(0.031) | 0.878(0.035) |
| Ours | 9.72(23.70) | 1.63(2.02) | 0.86(0.03) | 0.004(0.005) | 0.043(0.029) | 0.903(0.020) | |
| Simfluence | 2.8B | 15.08(51.72) | 1.52(2.90) | 0.80(0.08) | 0.005(0.006) | 0.050(0.036) | 0.817(0.063) |
| Ours | 5.56(17.26) | 1.15(1.42) | 0.86(0.05) | 0.003(0.003) | 0.035(0.026) | 0.911(0.050) | |
| Method | #Param | WMT-16 DE/EN | |||||
| BLEU | ROUGE-L | ||||||
| All-steps MSE () | All-steps MAE () | Final-Step Spearman’s () | All-steps MSE () | All-steps MAE () | Final-Step Spearman’s () | ||
| Simfluence | 410M | 32.15(116.17) | 2.25(4.08) | 0.83(0.03) | 0.007(0.017) | 0.039(0.055) | 0.931(0.014) |
| Ours | 7.71(28.05) | 1.14(1.92) | 0.92(0.02) | 0.004(0.009) | 0.030(0.041) | 0.964(0.012) | |
| Simfluence | 1B | 162.94(466.30) | 5.71(9.03) | 0.76(0.03) | 0.025(0.038) | 0.094(0.098) | 0.833(0.031) |
| Ours | 46.33(122.50) | 3.34(4.68) | 0.93(0.01) | 0.013(0.020) | 0.066(0.069) | 0.910(0.011) | |
| Simfluence | 2.8B | 64.07(319.93) | 2.59(5.84) | 0.90(0.05) | 0.008(0.022) | 0.040(0.059) | 0.912(0.045) |
| Ours | 24.27(93.41) | 1.94(3.36) | 0.93(0.05) | 0.005(0.018) | 0.030(0.051) | 0.936(0.037) | |
| Method | #Param | Average | |||||
| BLEU | ROUGE-L | ||||||
| All-steps MSE () | All-steps MAE () | Final-step Spearman’s () | All-steps MSE () | All-steps MAE () | Final-step Spearman’s () | ||
| Simfluence | 410M | 27.81 | 2.29 | 0.82 | 0.007 | 0.047 | 0.820 |
| Ours | 8.41 | 1.43 | 0.91 | 0.004 | 0.037 | 0.880 | |
| Simfluence | 1B | 91.76 | 3.86 | 0.81 | 0.015 | 0.073 | 0.855 |
| Ours | 28.02 | 2.51 | 0.90 | 0.008 | 0.055 | 0.907 | |
| Simfluence | 2.8B | 39.58 | 2.06 | 0.85 | 0.007 | 0.045 | 0.865 |
| Ours | 14.92 | 1.55 | 0.89 | 0.004 | 0.033 | 0.924 | |
| Dataset | Metric | Method | All-steps MSE () | All-steps MAE () | Final-Step Spearman’s () |
| WebNLG | BLEU | Simfluence | 43.33 (77.34) | 4.23 (3.52) | 0.78 (0.02) |
| Ours | 43.98 (81.40) | 4.28 (3.57) | 0.80 (0.01) | ||
| ROUGE-L | Simfluence | 0.008 (0.007) | 0.066 (0.031) | 0.706 (0.038) | |
| Ours | 0.007 (0.006) | 0.060 (0.029) | 0.765 (0.040) | ||
| WMT-16 DE/EN | BLEU | Simfluence | 32.11 (89.13) | 2.76 (3.75) | 0.82 (0.02) |
| Ours | 30.26 (77.23) | 2.91 (3.69) | 0.81 (0.02) | ||
| ROUGE-L | Simfluence | 0.018 (0.025) | 0.091 (0.075) | 0.796 (0.032) | |
| Ours | 0.012 (0.016) | 0.075 (0.057) | 0.843 (0.010) | ||
| Average | BLEU | Simfluence | 37.72 | 3.49 | 0.80 |
| Ours | 37.12 | 3.59 | 0.81 | ||
| ROUGE-L | Simfluence | 0.013 | 0.079 | 0.751 | |
| Ours | 0.009 | 0.068 | 0.805 |
4.4 Ablation Study
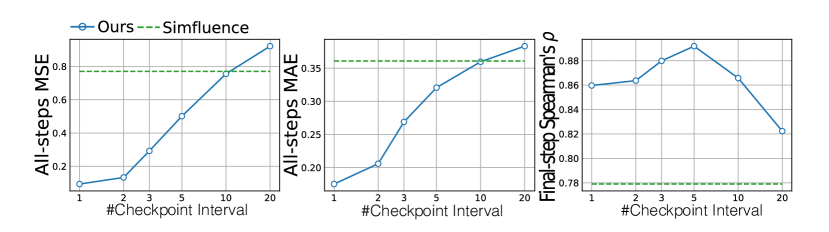
Practical Influence via Checkpoints Our featured simulator is adept at learning from past training dynamics. However, monitoring the training dynamics at every step can be expensive, especially when dealing with large-sized GPTs. Therefore, we conduct experiments to choose training checkpoints at specific intervals to approximate the reality of the neighboring points with the training state of that particular point. Then, we trained our simulator on the approximate training dynamics to find the balance between the cost of collecting training dynamics and the simulator performance.
Results are shown in Fig. 5(b). Unless otherwise specified, we instruction tuning the Pythia-410M for further analysis. In general, the performance of our simulator deteriorates as the number of checkpoint intervals increases. This is manifested by a rise in MSE and MAE at all steps and a drop in Spearman’s when the checkpoint interval is large. However, even when the number of checkpoint intervals is equal to 10, which means that we will use the training state of one point to approximate the training state of the previous ten points and the training dynamics collection time will be shortened by almost , our method still has comparable prediction error at all steps and better Spearman coefficient than Simfluence.
Empirical Analysis of Markov Order Dependency Using the first-order Markov process to predict future states based on the prior step, potentially oversimplifies GPT training dynamics. Therefore, we consider the training dynamics as an -th order Markov process () and experiment on both language understanding (RTE) and generative (WebNLG) tasks.
The result can be seen in Fig. LABEL:fig:order. Overall, when considering more preceding training information, the simulation error initially increases and decreases for both datasets, as indicated by the all-steps MSE metric. It suggests that a high order might introduce noise, leading to a degraded simulator’s performance. Moreover, the final-step Spearman’s shows a significant increase from 0.746 to 0.785 for RTE with the increase of order , but not the same for WebNLG. We guess considering more past training information could improve the prediction accuracy for NLU tasks.
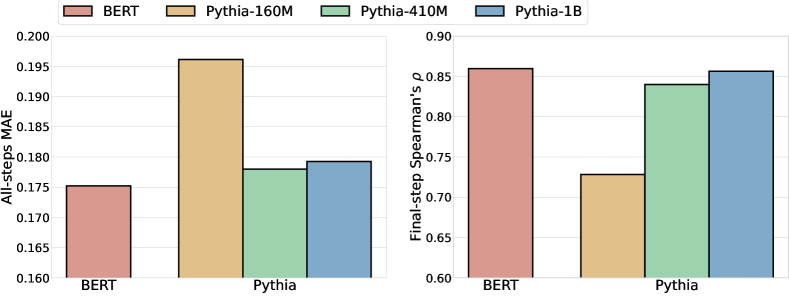
Impact of Different Feature Representations To further explore the impact of various feature representations, we conducted experiments on two types of pre-trained encoders: BERT 111https://huggingface.co/sentence-transformers/all-MiniLM-L6-v2 and Pythia 222https://github.com/EleutherAI/pythia with different sizes. Results are shown in Fig. 6. In general, BERT’s feature representations produce better simulation results than the Pythia encoder. This could be due to its ability to encode context information in both directions. Interestingly, we also found that increasing the parameters of the Pythia encoder does not always lead to better performance of the performance simulator.
4.5 Analysis
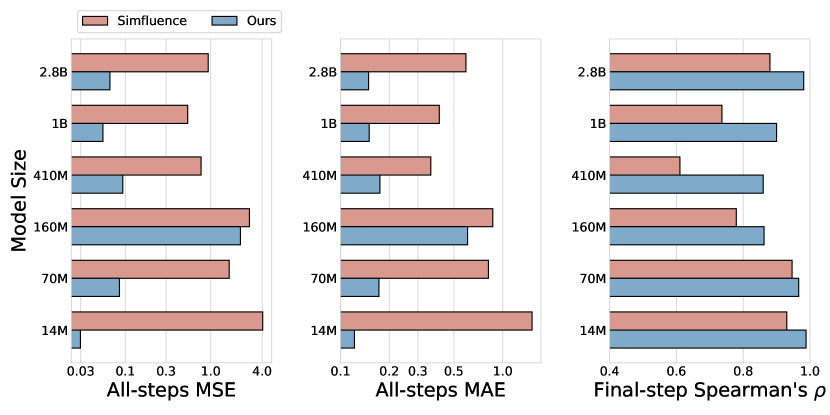
Robustness across Varying Model Sizes We conducted experiments to validate how our simulator handles the complexity of GPTs of different sizes, ranging from 14M to 2.8B, specifically focusing on instruction tuning scenarios. Results are presented in Fig. 7. Our loss simulation experiments revealed that despite the inconsistent simulation performance trend with increasing GPT size, our featurized model consistently surpassed Simfluence. These findings demonstrate the superiority of our model in effectively capturing and managing model complexity.
Unseen Data Generalization Unlike Simfluence, which restricts the parameters only indexed by seen samples of past training runs, our GPTfluence can handle unseen samples via sample parameterization. We conducted experiments on RTE and WebNLG tasks in fine-tuning scenarios to further verify the unseen data generalization. For a future training run, we experiment in three different unseen data scenarios: 1) Examples in the training curriculum are unseen; 2) Test examples are unseen; 3) Both examples in training the curriculum and test examples are unseen.
We defer the results in Table LABEL:tab:unseen_ft in Appendix. Overall, GPTfluence can generalize to unseen data, which includes simulating loss and performance metrics. What’s more, we find that GPTfluence is better at generalizing to unseen training data to simulate the impact of test samples that have been seen in the past. To illustrate this more visually, we show the effect of GPTfluence’s simulation of the unseen training data setting with loss and performance metrics, respectively. As shown in Fig. LABEL:fig:unsen_ft, the generalization performance of GPTfluence is mostly satisfactory.
5 Related Work
Our methodology extends the frontier of TDA techniques, which are instrumental in understanding the influence of individual training instances on model predictions. This body of work bifurcates into two main strands: gradient-based approximation methods and simulation-based approaches.
Gradient-Based Approximation Methods This strand of research capitalizes on gradient information to infer the influence of training instances on model predictions, providing a quantifiable measure of individual data points’ contributions Koh and Liang (2017); Yeh et al. (2018); K and Søgaard (2021). Influence Functions, a pioneering method in this domain, leverages the mathematical framework of influence functions for estimating the impact of dataset perturbations on model predictions. Complementing this, TracIn Pruthi et al. (2020) employs gradient-based approximations to trace the influence of training data on test predictions. Similarly, Grad-Dot Charpiat et al. (2019) uses gradient dot products to approximate the influence of training examples. A contemporary work Xia et al. (2024) that adapts the TracIn framework for models optimized with Adam. LESS incorporates LoRA Hu et al. (2021) and random projection Park et al. (2023) techniques to enhance data selection processes. These methods primarily rely on gradients to quantify data influence, offering tractable solutions with varying degrees of approximation accuracy.
Simulation-Based Approaches An alternative research vein adopts model-based simulations to represent training dynamics Ilyas et al. (2022); Guu et al. (2023). Simfluence Guu et al. (2023) pioneers the simulation-based category by learning a linear model that predicts the influence of training examples through multiplicative and additive factors, as detailed in §2. Recent efforts Engstrom et al. (2024) have focused on simulating the overall influence of training examples, aiming at predicting the cumulative influence of training data for refined data selection.
Our contribution distinctly advances the simulation-based direction by forecasting the end-point influence and modeling the entire trajectory of training dynamics using featurized representations. This approach provides a more in-depth understanding of training data influence, facilitating dynamic adjustments and insights into the model training curricula.
6 Conclusion and Future Work
In this paper, we explore the data attribution analysis for GPT models through GPTfluence, a novel featurized simulator approach. This methodology not only surpasses the predictive capabilities of traditional test loss metrics but forecasts essential task performance metrics across a broad spectrum of GPT model sizes, ranging from 14M to 2.8B parameters. Our comprehensive evaluations across diverse downstream tasks and fine-tuning scenarios substantiate the superior efficacy of our approach. In the future, extending this approach to other tasks and training regime presents a promising avenue for future research.
Ethical Consideration
While our study focuses on predicting the influence of training data on GPT models, we recognize the broader ethical implications that our research may entail, especially as it contributes to the advancement of large language models (LLMs) that are increasingly integrated into societal functions.
Data Use and Privacy
Our research utilizes publicly available datasets and respects privacy concerns by anonymizing any potentially identifiable information. We ensure that our data handling practices comply with all relevant data protection regulations and ethical guidelines, safeguarding against misuse.
Transparency and Accountability
We commit to transparency in our methodologies and findings, providing detailed documentation to facilitate reproducibility. By releasing our code and datasets, we aim to support accountability in AI research, allowing others to scrutinize, validate, and build upon our work.
Potential Misuse
We are cognizant of the potential misuse of predictive models in manipulating or unfairly influencing AI systems. Our research aims to contribute to the understanding and mitigation of such risks by providing tools to analyze and adjust the influence of training data. We encourage the application of our findings in ethical ways that promote fairness and transparency in AI.
Broader Impact
This study advances understanding of data influence on LLMs, offering a methodological approach for detailed impact analysis. This work not only enhances the interpretability and transparency of LLMs but also lays the groundwork for more informed and ethical decisions in data curation and model training.
Limitations
This work introduces a novel feature-based approach within the simulation-based framework for predicting the influence of training data on GPT models. While our methodology represents a significant advancement in the field, it is not without its limitations, which we discuss below:
Dependence on Extensive Training Dynamics
A fundamental constraint of our approach is its reliance on a comprehensive set of training dynamics to train the simulator effectively. This requirement, while crucial for the accuracy of our predictions, necessitates considerable computational resources and time. The efficiency of data influence simulators remains an area ripe for further exploration, with the aim of reducing the computational overhead without compromising on performance.
Limited Dataset Scope
Our experimental validation is confined to a subset of the FLAN datasets, constrained by the logistical and computational costs associated with collecting a large-scale training dynamics dataset. Despite this limitation, we have conducted over 352 training experiments across six different GPT model sizes (ranging from 14M to 2.8B parameters) to amass the GPTDynamics dataset. This dataset, which we are making publicly available, is a step towards mitigating the data scarcity in this research area, yet the need for more expansive datasets encompassing a broader range of tasks and languages remains.
Model Size Constraints
The high computational costs involved in executing multiple runs on larger language models, such as those with 13B or even 72B parameters, have limited the scale of the models we could feasibly include in our study. While our findings are robust across the examined model sizes, extending our analysis to larger models with hundreds of billions of parameters would likely yield additional insights into the scalability and generalizability of our approach.
Generalization to Other Domains
While our study focuses on GPT models and a specific subset of datasets, the generalizability of our approach to other model architectures and domains is not fully explored. Future work could extend our methodology to different types of language models and beyond, including vision and multimodal systems, to assess the applicability and adaptability of our featurized simulation-based approach.
References
- Achiam et al. (2023) Josh Achiam, Steven Adler, Sandhini Agarwal, Lama Ahmad, Ilge Akkaya, Florencia Leoni Aleman, Diogo Almeida, Janko Altenschmidt, Sam Altman, Shyamal Anadkat, et al. 2023. Gpt-4 technical report. arXiv preprint arXiv:2303.08774.
- Biderman et al. (2023) Stella Biderman, Hailey Schoelkopf, Quentin Anthony, Herbie Bradley, Kyle O’Brien, Eric Hallahan, Mohammad Aflah Khan, Shivanshu Purohit, USVSN Sai Prashanth, Edward Raff, Aviya Skowron, Lintang Sutawika, and Oskar van der Wal. 2023. Pythia: A suite for analyzing large language models across training and scaling.
- Brown et al. (2020) Tom Brown, Benjamin Mann, Nick Ryder, Melanie Subbiah, Jared D Kaplan, Prafulla Dhariwal, Arvind Neelakantan, Pranav Shyam, Girish Sastry, Amanda Askell, et al. 2020. Language models are few-shot learners. Advances in neural information processing systems, 33:1877–1901.
- Chai et al. (2023) Yekun Chai, Shuohuan Wang, Chao Pang, Yu Sun, Hao Tian, and Hua Wu. 2023. Ernie-code: Beyond english-centric cross-lingual pretraining for programming languages. In Findings of the Association for Computational Linguistics: ACL 2023, Toronto, Canada, July 9-14, 2023, pages 10628–10650. Association for Computational Linguistics.
- Charpiat et al. (2019) Guillaume Charpiat, Nicolas Girard, Loris Felardos, and Yuliya Tarabalka. 2019. Input similarity from the neural network perspective. Advances in Neural Information Processing Systems, 32.
- Devlin et al. (2019) Jacob Devlin, Ming-Wei Chang, Kenton Lee, and Kristina Toutanova. 2019. BERT: Pre-training of deep bidirectional transformers for language understanding. In Proceedings of the 2019 Conference of the North American Chapter of the Association for Computational Linguistics: Human Language Technologies, Volume 1 (Long and Short Papers), pages 4171–4186, Minneapolis, Minnesota. Association for Computational Linguistics.
- Engstrom et al. (2024) Logan Engstrom, Axel Feldmann, and Aleksander Madry. 2024. Dsdm: Model-aware dataset selection with datamodels. arXiv preprint arXiv:2401.12926.
- Guu et al. (2023) Kelvin Guu, Albert Webson, Ellie Pavlick, Lucas Dixon, Ian Tenney, and Tolga Bolukbasi. 2023. Simfluence: Modeling the influence of individual training examples by simulating training runs. arXiv preprint arXiv:2303.08114.
- Hu et al. (2021) Edward J Hu, Yelong Shen, Phillip Wallis, Zeyuan Allen-Zhu, Yuanzhi Li, Shean Wang, Lu Wang, and Weizhu Chen. 2021. Lora: Low-rank adaptation of large language models. arXiv preprint arXiv:2106.09685.
- Ilyas et al. (2022) Andrew Ilyas, Sung Min Park, Logan Engstrom, Guillaume Leclerc, and Aleksander Madry. 2022. Datamodels: Predicting predictions from training data. arXiv preprint arXiv:2202.00622.
- Jiang et al. (2023) Albert Q Jiang, Alexandre Sablayrolles, Arthur Mensch, Chris Bamford, Devendra Singh Chaplot, Diego de las Casas, Florian Bressand, Gianna Lengyel, Guillaume Lample, Lucile Saulnier, et al. 2023. Mistral 7b. arXiv preprint arXiv:2310.06825.
- K and Søgaard (2021) Karthikeyan K and Anders Søgaard. 2021. Revisiting methods for finding influential examples.
- Koh and Liang (2017) Pang Wei Koh and Percy Liang. 2017. Understanding black-box predictions via influence functions. In International conference on machine learning, pages 1885–1894. PMLR.
- Lin (2004) Chin-Yew Lin. 2004. Rouge: A package for automatic evaluation of summaries. In Text summarization branches out, pages 74–81.
- Lozhkov et al. (2024) Anton Lozhkov, Raymond Li, Loubna Ben Allal, Federico Cassano, Joel Lamy-Poirier, Nouamane Tazi, Ao Tang, Dmytro Pykhtar, Jiawei Liu, Yuxiang Wei, et al. 2024. Starcoder 2 and the stack v2: The next generation. arXiv preprint arXiv:2402.19173.
- Papineni et al. (2002) Kishore Papineni, Salim Roukos, Todd Ward, and Wei-Jing Zhu. 2002. Bleu: a method for automatic evaluation of machine translation. In Proceedings of the 40th annual meeting of the Association for Computational Linguistics, pages 311–318.
- Park et al. (2023) Sung Min Park, Kristian Georgiev, Andrew Ilyas, Guillaume Leclerc, and Aleksander Madry. 2023. Trak: Attributing model behavior at scale. arXiv preprint arXiv:2303.14186.
- Pruthi et al. (2020) Garima Pruthi, Frederick Liu, Satyen Kale, and Mukund Sundararajan. 2020. Estimating training data influence by tracing gradient descent. Advances in Neural Information Processing Systems, 33:19920–19930.
- Radford et al. (2019) Alec Radford, Jeffrey Wu, Rewon Child, David Luan, Dario Amodei, Ilya Sutskever, et al. 2019. Language models are unsupervised multitask learners. OpenAI blog, 1(8):9.
- Team et al. (2023) Gemini Team, Rohan Anil, Sebastian Borgeaud, Yonghui Wu, Jean-Baptiste Alayrac, Jiahui Yu, Radu Soricut, Johan Schalkwyk, Andrew M Dai, Anja Hauth, et al. 2023. Gemini: a family of highly capable multimodal models. arXiv preprint arXiv:2312.11805.
- Touvron et al. (2023) Hugo Touvron, Louis Martin, Kevin Stone, Peter Albert, Amjad Almahairi, Yasmine Babaei, Nikolay Bashlykov, Soumya Batra, Prajjwal Bhargava, Shruti Bhosale, et al. 2023. Llama 2: Open foundation and fine-tuned chat models. arXiv preprint arXiv:2307.09288.
- Wei et al. (2022) Jason Wei, Maarten Bosma, Vincent Y. Zhao, Kelvin Guu, Adams Wei Yu, Brian Lester, Nan Du, Andrew M. Dai, and Quoc V. Le. 2022. Finetuned language models are zero-shot learners.
- Xia et al. (2024) Mengzhou Xia, Sadhika Malladi, Suchin Gururangan, Sanjeev Arora, and Danqi Chen. 2024. Less: Selecting influential data for targeted instruction tuning. arXiv preprint arXiv:2402.04333.
- Yeh et al. (2018) Chih-Kuan Yeh, Joon Kim, Ian En-Hsu Yen, and Pradeep K Ravikumar. 2018. Representer point selection for explaining deep neural networks. Advances in neural information processing systems, 31.
- Zhang et al. (2022) Susan Zhang, Stephen Roller, Naman Goyal, Mikel Artetxe, Moya Chen, Shuohui Chen, Christopher Dewan, Mona Diab, Xian Li, Xi Victoria Lin, Todor Mihaylov, Myle Ott, Sam Shleifer, Kurt Shuster, Daniel Simig, Punit Singh Koura, Anjali Sridhar, Tianlu Wang, and Luke Zettlemoyer. 2022. Opt: Open pre-trained transformer language models.
Appendix A Implementation Details
A.1 Tasks and Datasets for GPTDynamics
We conduct experiments on a subset of FLAN Wei et al. (2022), a diverse array of datasets for instruction tuning, to conduct a thorough evaluation of TDA methods. Our dataset selection spans both NLU and NLG tasks, thereby offering a broad spectrum of challenges for TDA methods to tackle.
The NLU tasks selected include RTE (Natural Language Inference), SST-2 (Sentiment Classification), and BoolQ (Reading Comprehension). For NLG, we delve into WebNLG (Struct-to-Text) and WMT-16 DE/EN (Machine Translation) tasks.
To exploit the superior generalization benefits that instruction tuning brings to language models, we have assembled a specialized subset for instruction fine-tuning. This subset amalgamates the previously mentioned five tasks with CNN-DM (Summarization), crafting an extensive testing environment of FLAN data. We sourced task-specific instructions directly from the original FLAN paper.
A.2 Comparison Baselines
TracIn Pruthi et al. (2020) is a gradient-based used to calculate the influence through a first-order gradient approximation. It considers the influence of the training example on the test example as a loss change in , which is provided by each gradient step of the training example . In practice, TracInCP was proposed as an alternative approximation that considers specific checkpoints during training. TracInCP calculates the gradient dot product of and at these checkpoints. In our experiments, we used TracInCP with 10 checkpoints and all steps’ checkpoints to estimate the influence.
Grad-Dot Charpiat et al. (2019) is a heuristic gradient-based TDA method. They also compute the effect of a training sample on a test sample by the dot product of the gradients but computed on top of the final trained model.
Simfluence Guu et al. (2023) is a novel framework for TDA. It characterizes the loss variation of test samples during training by modeling it as a Markov process. Then, it learns a unique multiplicative and additive influence parameter for each training example. It is worth noting that in the original paper, the framework that considers both multiplicative and additive influences is referred to as Simfluence-linear. However, for simplicity in this paper, we use the term Simfluence to refer to the same model.
A.3 Implementation Details of Instruction Tuning
GPTDynamics Collection for Instruction Tuning
We instruction tuned Pythia from 14M to 2.8B (i.e., 14M, 70M, 160M, 410M, 1B, and 2.8B) on the instruction tuning dataset referenced in Appendix A.1. We collect a total of randomly sampled 768 instances from aforementioned five tasks, with each samples 128 of 200 data points in one training run for instruction tuning. The data division followed the same protocol as in the fine-tuning scenarios. All Pythia models underwent comprehensive fine-tuning, with the exception of the Pythia-2.8B model, which was fine-tuned using the parameter-efficient LoRA technique Hu et al. (2021). The LoRA module was implemented within the query, key, and value projection matrices of the self-attention module, with a LoRA rank of 8, alpha set to 4, and a dropout probability of 0.05. We evaluated the Pythia models using the identical datasets as those in the fine-tuning experiments. For the WebNLG and WMT16 DE/EN datasets, we evaluated BLEU and ROUGE-L scores in addition to test loss, employing a top- sampling strategy for generation with a temperature of 0.2 and top- probability of 0.95. Detailed instruction-tuning hyperparameters are reported in Table 5.
| Instruction-Tuning Hyperparameters | Pythia-14M | Pythia-70M | Pythia-160M | Pythia-410M | Pythia-1B | Pythia-2.8B |
| Optimizer | AdamW | |||||
| Adam’s | (0.9, 0.999) | |||||
| Adam’s | 1e-6 | |||||
| Weight decay | 0.001 | |||||
| Learning rate | 5e-7 | 5e-7 | 5e-7 | 2e-7 | 2e-7 | 1e-5 |
| Learning rate schedule | Linear decay | |||||
| Warmup steps | 0 | |||||
| Batch size | 8 | |||||
| Max sequence length | 2048 | 2048 | 2048 | 2048 | 2048 | 1024 |
| Training epochs | 3 | 3 | 3 | 3 | 2 | 2 |
| Training steps | 288 | 288 | 288 | 288 | 192 | 192 |
| Precision | fp32 |
GPTfluence Training Setup
The architecture of our simulator is a pre-trained sentence encoder followed by parallel weight-sharing fully-connected layers for predicting influence factors. The trainable model size of the simulator is 11.4M excluding pre-trained embeddings (frozen). Unless specified, we use the sentence transformer333https://huggingface.co/sentence-transformers/all-MiniLM-L6-v2 as our pre-trained encoder. For the simulator training, we combine all five FLAN datasets and train our simulator in a multi-task manner, each dataset has 27 training runs. All reported results are averaged over 5 held-out runs. We set the order of Markov process assumptions equal to 1 for instruction tuning. Detailed training hyperparameters of GPTfluence are shown in Table 6.
| Hyperparameters | Pythia-14M | Pythia-70M | Pythia-160M | Pythia-410M | Pythia-1B | Pythia-2.8B |
| L2 regularizaiton | 1e-5 | |||||
| Optimizer | AdamW | |||||
| Adam’s | (0.9, 0.999) | |||||
| Adam’s | 1e-8 | |||||
| Learning rate | 1e-6 | 1e-6 | 1e-6 | 1e-5 | 1e-5 | 1e-5 |
| Learning rate schedule | Linear decay | |||||
| Warmup steps | 200 | |||||
| Batch size | 128 | |||||
| Max training epochs | 50 | 50 | 50 | 50 | 50 | 50 |
| Pre-trained encoder | MiniLM-L6-v2 | |||||
| Max sequence length | 512 | 512 | 512 | 512 | 512 | 512 |
| Early stopping | ✓ | |||||
| Precision | fp32 | |||||
| Seed | 42 |
A.4 Implementation Details of Fine-Tuning
GPTDynamics Collection for Fine-Tuning
All the experiments are conducted on the NVIDIA Tesla V100 GPUs unless specified. We fine-tune Pythia-410M on five datasets: SST-2, BoolQ, RTE, WebNLG, and WMT16 DE/EN. For each dataset, we perform a total of 32 training runs, with each sample 128 of 200 data points from the original training set for GPT training. The split of training runs is divided into 25 for training, 2 for validation, and 5 for test. All reported results are averaged over 5 held-out runs. For NLG datasets, we measure BLEU, ROUGE-L scores besides the test loss, using a top- sampling strategy for generation with a temperature setting of 0.2 and a top- probability of 0.95. Note that we collect ROUGE-L scores on a scale from 0 to 1. The fine-tuning hyperparameters are shown in Table 7.
| Fine-Tuning Hyperparameters | SST-2 | RTE | BoolQ | WebNLG | WMT16 DE/EN |
| Optimizer | AdamW | ||||
| Adam | (0.9, 0.999) | ||||
| Adam | 1e-6 | ||||
| Weight decay | 0.001 | ||||
| Learning rate | 5e-7 | 5e-7 | 5e-7 | 1e-6 | 5e-7 |
| Learning rate schedule | Linear decay | ||||
| Warmup steps | 0 | ||||
| Batch size | 4 | ||||
| Max sequence length | 2048 | ||||
| Training epochs | 3 | ||||
| Training steps | 96 | ||||
| Precision | fp32 |
GPTfluence Training Setup
We train a single featurized simulator on training runs for each dataset with the L2-regularized regression objective as defined in section 3.2. We freeze the parameters of the pre-trained encoder during training for better generalization. We set the order of Markov process assumptions equal to 1 for fine-tuning. Detailed training hyperparameters are shown in Table 8.
| Hyperparameters | SST-2 | RTE | BoolQ | WebNLG | WMT16 DE/EN |
| L2-regularizaiton’s | 1e-5 | ||||
| Optimizer | AdamW | ||||
| Adam’s | (0.9, 0.999) | ||||
| Adam’s | 1e-8 | ||||
| Learning rate | 1e-4 | 1e-4 | 1e-4 | 1e-4 | 1e-4 |
| Learning rate schedule | Linear decay | ||||
| Warmup steps | 200 | ||||
| Batch size | 128 | ||||
| Max training epochs | 300 | 300 | 300 | 300 | 300 |
| Pre-trained encoder | MiniLM-L6-v2 | MiniLM-L6-v2 | MiniLM-L6-v2 | MiniLM-L6-v2 | MiniLM-L6-v2 |
| Max sequence length | 512 | 512 | 512 | 512 | 512 |
| Early stopping | ✓ | ||||
| Precision | fp32 | ||||
| Seed | 42 |
| Hyperparameters | |
| L2 regularizaiton | 1e-5 |
| Optimizer | AdamW |
| Adam’s | (0.9, 0.999) |
| Adam’s | 1e-8 |
| Learning rate | 1e-3 |
| Learning rate schedule | Linear decay |
| Warmup steps | 200 |
| Batch size | 128 |
| Max training epochs | 300 |
| Early stopping | ✓ |
| Precision | fp32 |
| Seed | 42 |
A.5 Implementing GPTfluence
GPTfluence Training
To elucidate the intricate process of collecting training data dynamics and the training of the featurized simulator with GPTfluence, we present the pseudo-code in Algorithm 1. The execution of this algorithm yields a GPTfluence simulator, which is adept at simulating the target performance trajectory and assessing the impact of training examples on a given test point.
Input: Language modeling task , pre-trained GPT , Target sample , Dataset , Subset size , Target metric , Training dynamic , Multiplicative factor function , Additive factor function , regularization weight, Featurized simulator , Markov order -th
Output: Simulator