Unsupervised Concept Drift Detection based on Parallel Activations of Neural Network
Abstract
Practical applications of artificial intelligence increasingly often have to deal with the streaming properties of real data, which, considering the time factor, are subject to phenomena such as periodicity and more or less chaotic degeneration – resulting directly in the concept drifts. The modern concept drift detectors almost always assume immediate access to labels, which due to their cost, limited availability and possible delay has been shown to be unrealistic. This work proposes an unsupervised Parallel Activations Drift Detector, utilizing the outputs of an untrained neural network, presenting its key design elements, intuitions about processing properties, and a pool of computer experiments demonstrating its competitiveness with state-of-the-art methods.
Keywords:
concept drift data streams unsupervised drift detection neural networks1 Introduction
The modern world is dominated by the mass production of data transmitted daily in petabytes of information traveling over the internet [9]. Artificial intelligence applications attempt to organize this chaotic reality from the level of dispersed information into knowledge, recently most often relying on semi-supervised and unsupervised learning methods, significantly reducing the need to rely on human experts in the labeling process [6]. However, default solutions of this type treat available data as static in time, often ignoring the phenomena of knowledge historicity and periodicity of concepts, thus striving to maximize efficiency within the full, huge volume of Big Data [8].
The field of machine learning that focuses more on data velocity and considers the possibility of changing concepts between successive batches of incremental processing is Data Stream Processing. One of the critical issues in this field is drift detection, which involves identifying solutions that allow for effective signaling of significant changes in the concept. It should be noted, however, that the most common state-of-the-art drift detectors most often assume full labeling of the data stream, which does not fit well into the increasingly dominant paradigm of semi-supervised and unsupervised learning. This shows the significant need to develop research on unsupervised drift detectors, which will potentially enable broad applications of Data Stream Processing achievements in mainstream artificial intelligence research.
1.1 Concept drift phenomenon
Concept drift is taxonomically divided in terms of three main axes [1]. According to the impact on recognition ability, drifts are divided into real ones, the influence of which is visible when monitoring the quality of classification, and virtual, which do not affect the decision boundary, but may constitute the initial stage of real changes. According to dynamics, distribution shift may occur at a single point in time (sudden drift), or the transition can be spread over longer period in gradual and incremental drifts. During incremental drift, a temporary concept between the initial and target ones is observed, while in the case of gradual change, objects from two consecutive concepts do co-occur during the transition period. Finally, according to drift recurrence – a concept from the past may recur due to cyclical phenomena such as seasons or daily cycles. Additionally, the taxonomy considers drifts in which prior probability of the classification problem changes [19]. Such drifts may affect recognition quality, showing falsely high accuracy values or a decrease in the quality when using metrics dedicated to imbalanced data, without a drift directly affecting the decision boundary.
1.2 Related works
According to the guidelines described by Domingos et al. [7], a critical element of processing data streams is the mechanism for adapting to concept drifts. In the face of such changes in the data stream, two approaches are used: continuous rebuild and triggered rebuild [22]. In the case of the continuous rebuild, classifiers are trained throughout the entire processing period. In contrast, in the case of the triggered rebuild, specific determinants are used to indicate drifts, and only after change is detected, the classifiers are updated to the current state of posterior distribution of a stream. All approaches from the continuous rebuild strategy require almost immediate access to labels and use them to incrementally train the classifier. The factors used in the triggered rebuild approach can be further divided into three categories: (a) those monitoring the classification model, (b) those monitoring the data, and (c) those monitoring the output from the classification model [17]. Similarly to the continuous rebuild, the methods monitoring the classification output use labels for recognition quality assessment.
Concept drift detectors are used to signal a change in the triggered rebuild approach. The first proposed drift detection methods took advantage of the fact that real concept changes affect the recognition quality and monitored the frequency or distance of errors made by the classifier. Examples of such methods are Drift Detection Method (ddm) [10] and Early Drift Detection Method (eddm) [3]. Subsequent detection methods used more complex mechanisms based on sliding windows in the Adaptive Windowing (adwin) [5] algorithm, pairs of classifiers in Paired Learners [2], and ensembles of classifiers in Diversity for Dealing with Drifts approach [26]. The main disadvantage of these solutions is a strong dependence on label access. It is worth mentioning here that implicit supervised detectors have also been proposed, which do not directly rely on the classification quality to detect concept changes but use labels to analyze algorithm-independent properties of the data [15]. Regardless of how labels are used, the assumption of their almost immediate availability is not realistic due to limited access [29], their cost [24], and possible time delay [14]. For those reasons, scientific interest in unsupervised drift recognition methods has increased in recent years [11]. While some unsupervised methods monitoring the classification model will require access to labels, this is mainly to update the classification model after change detection [29].
In accordance with the taxonomy described earlier, unsupervised drift detection methods will use two types of factors: those dependent on the classification model and those dependent on the data distribution itself. The data distribution is monitored in the Nearest Neighbor-based Density Variation Identification (nn-dvi) [23] detector using the k-nearest neighbors algorithm. Similarly, grid-based data distribution monitoring is proposed in the Grid Density based Clustering (gc3) [30] approach. In the Centroid Distance Drift Detector (cddd) [16] method, the distance between the centroids of subsequent batches is examined. This method can operate in both supervised and unsupervised modes. There are also methods based on the analysis of outlier observations, such as Fast and Accurate Anomaly Detection (faad) [21], proposed mainly for the purpose of anomaly detection. In One-Class Drift Detector (ocdd) [13], a one-class classifier is used to examine the percentage of objects recognized as not belonging to the recognized concept. A similar strategy was used in Discriminative Drift Detector (d3) [12], where a discriminative classifier is used instead of a one-class classifier to explicitly recognize objects from the new concept from those from the previous one in variable-width windows.
Among the solutions based on the classifier properties, the Margin Density Drift Detection (md3) [29] method should be mentioned, in which the density of samples near the decision boundary of the svm classifier is examined. Similarly, in the Confidence Distribution Batch Detection (cdbd) [22] algorithm, the confidence of a classifier is monitored. Both of those approaches, despite their unsupervised detection, require access to labels in order to rebuild the monitored classifier in the case of a drift.
1.3 Motivation and contribution
In this work, we present a fully unsupervised Parallel Activations Drift Detector (padd) method interpreting the activations of randomly initialized neural network (nn). Its overall detection mechanism shows some similarities to the cdbd detector – which is using confidence in the outputs from the trained classifier (possibly nn) – but without the requirement of label access to update the model in the event of drift. Similarly to gc3 method, padd employs paradigm of original sample transformation into the condensed space, but in contrary, it does not use regular distribution grid, introducing non-uniform, tangled set of projections typical for initial random state of a nn [28].
The main contribution of this publication is to present a new drift detection method, operating on a fully unsupervised analysis of a raw nn activations. The paper validates the overall quality of a proposition on synthetic data streams with various characteristics, comparing the proposed approach with unsupervised and supervised state-of-the-art drift detection methods. Conducted experiments are publicly available to preserve replicability of the research.
2 Parallel Activations Drift Detector
This paper presents an unsupervised drift detection method, operating purely on the output of a randomly initialized nn. The approach is described in the Algorithm 1.
The method processes data streams divided into non-interlacing batches (). Drift detection is marked based on replications of statistical tests – aiming to validate the null hypothesis stating the lack of significant difference between two groups of independent measurements – comparing (a) a sample of size from the distribution of past and (b) current activations at the all outputs of the nn. The initial – and constant during the full processing – random weights of nn are drawn from a normal distribution. As default settings, the normal distribution has an expected value of zero and a standard deviation of . The statistical test used for distribution comparison is the Student’s t-test for independent samples.
The critical parameters of the method are the significance level alpha () of the statistical test and the threshold parameter (), indicating the fraction of all tests that need to signal statistical independence of distributions to induce a drift detection.
At the beginning of processing of each batch, activations are calculated for samples from a given batch at all nn outputs. In the first chunk, the historical activations are yet unknown, so the detection step is skipped due to the lack of reference data. The current activations are stored in the pool of historical outputs (). Otherwise, statistical tests are performed for individual network outputs. In lines 5:14 of the pseudocode, replications of the statistical test are performed for each output of the network. Samples of size are drawn with replacement from historical activations for a given output and for the current distribution . If the statistical test shows a significant difference between the past and current distribution, the counter is incremented. Detection criterion is described in lines 15:18 of the pseudocode. If the counter exceeds the required number of tests showing statistically significant (difference defined using , the number of outputs , and the number of test replications ) a concept drift in the current chunk is signaled. Such a signal implicates clearing the buffer of past supports (). For each batch, the current activations are saved to the historical data at the end of processing (line 20).
The Student’s T-test shows a noticeably high sensitivity to the selection of the sample from random variable provided to it, therefore the padd method is stabilizing its verdict with replication of the measurement, which is possible thanks to a reliable buffer of historical activations. The invariance of the model weights, in turn, preserves the repeatability of the transformations performed by the nn, which should lead to results of low-dimensional embeddings to be statistically dependent in the absence of changes in the posterior distribution of the stream – which we associate with both real and virtual drift phenomenon. Consequently, the proposed method is not built around the observation of the decision boundary – as is the case with solutions basing detection on the evaluation of significant changes in the quality of processing – but presents the potential to register general changes in the distribution occurring regardless of a given label bias.
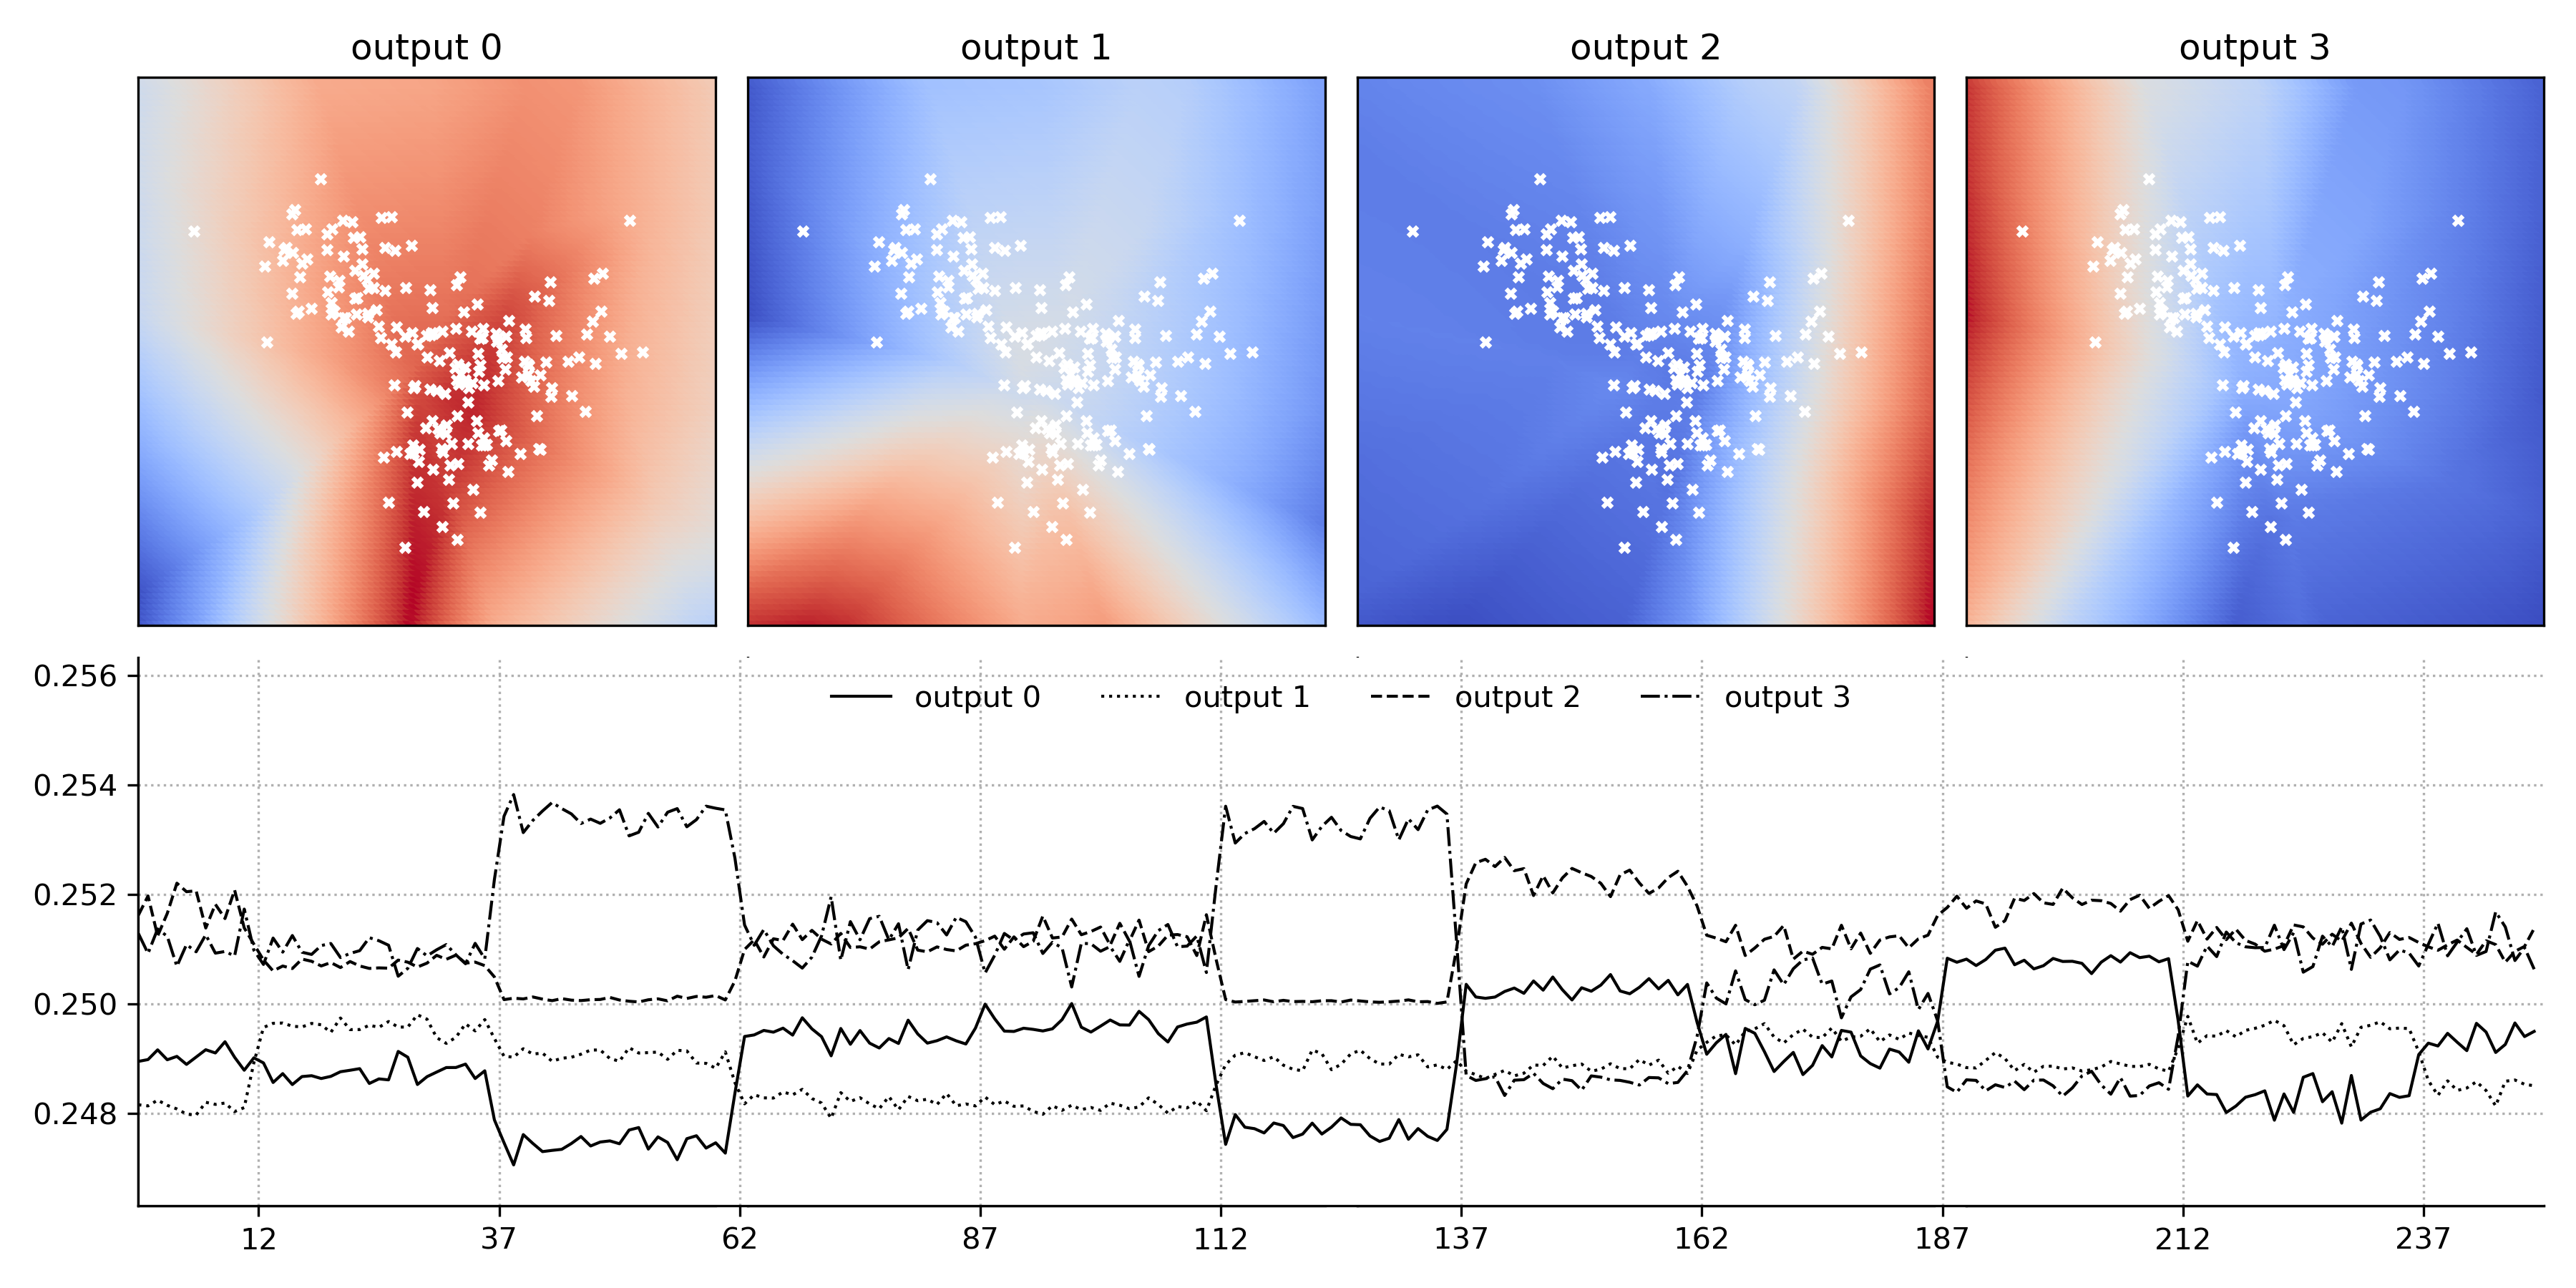
Figure 1 shows the intuition behind the method operation on the exemplary stream with 250 data chunks and a final nn layer with four outputs. The first line presents the image (probing of a model with a mesh-grid covering two-dimensional feature space) of the nn output in the area sampled by data distribution. Red regions correspond to high activations, and blue to low activations. Random initialization of the weights causes diversified local landscapes in every dimension of the output space. In these areas, samples from one batch are marked with white markers. If drift occurs and the posterior distribution of a sampled data chunk changes, the structure of pseudo-supports in the recognized set will map this change within all or a part of the nn outputs. The second row of the graph presents the average activation values for batches in the data stream across all the four outputs. The moments when drifts occur are clearly visible, additionally marked with chunk indices on the horizontal axis of the chart. In relation to the state of the network, some drifts will be easier to identify than others – for example, the difference between the average output for the first drift (chunk 12) is less visible than for the next drift (chunk 37).
3 Experiment design
This chapter will describe the experimental protocol, the data streams used, and the goals of the experiment. The experiment and methods were implemented in the Python programming language and the code is publicly available on the GitHub repository111https://github.com/w4k2/padd.
3.1 Data stream generation
The experimental evaluation was performed on synthetic streams obtained using the generator from the stream-learn library [20]. The streams were described with various number of features and the number and type of drifts. The streams were processed in batches of samples, and each stream with specific configuration was generated ten times with varying random state of a generator.
The complete configuration of data streams is presented in the Table 1. The experiment compared the methods on the complete pool of data streams.
| parameter | configuration | parameter | configuration |
|---|---|---|---|
| Number of chunks | 250 | Drift frequency | 3, 5, 10, 15 drifts |
| Chunk size | 200 | Number of features | 30, 60, 90 (30% informative) |
| Drift dynamics | sudden, gradual | Replications | 10 |
The choice of synthetic data was dictated by the option to verify the operation of detection methods in various conditions and the possibility of replicating the stream generation to stabilize the results for statistical analysis. Additionally, only in the case of synthetic data, the exact moments of drifts are known [25]. This enables comparing changes signaled by the methods with the actual concept drifts.
3.2 Measuring quality of drift detection
The methods’ detection quality was assessed using three drift detection error measures [18], assessing the similarity of drifts occurring in the stream to those detected by a given method. The comparison protocol based on the classification quality has proves to show no relationship between the detection quality and the assessed accuracy of classification [4].
The three drift detection error measures will evaluate detectors on three different criteria:
-
D1
– The average distance of each detection to the nearest drift,
-
D2
– The average distance of each drift to the nearest detection,
-
R
– The adjusted ratio of the number of detections to the number of drifts.
It is important to denote, that measures can only be defined if the evaluated method signals any detection. Otherwise, the errors will be infinite and statistical comparison will not be possible.
3.3 Goals of the experiment
The experimental analysis aimed to compare the proposed approach with reference methods. State-of-the-art supervised and unsupervised detectors were selected. If possible, we have used the implementation of methods provided by the authors or modified them to allow processing streams in the form of batches.
Table 2 presents all methods considered in the experiment, including the proposed padd method. The first column shows the acronym of the method, the second the category in the context of label access, the third the full name of the method and a reference to the article introducing this approach. The last column describes the hyperparameterization of method used in the experiment.
| acronym | category | method name | selected hyperparameters |
| md3 | Unsupervised with label request | Margin Density Drift Detection [29] | threshold parameter set depending on number of features: for 30 features, for 60 features and for 90 features |
| ocdd | Unsupervised | One-Class Drift Detector [13] | percentage parameter set depending on problem dimensionality: for streams with 30 features, for 60 features and in case of 90 features |
| cddd | Unsupervised | Centroid Distance Drift Detector [16] | sensitivity parameter set depending on concept drift density: for streams with sparse changes (3,5) and for streams with dense changes (10,15) |
| padd | Unsupervised | Parallel Activations Drift Detector | alpha equal to for gradual drift and for sudden; threshold of for gradual drift and for sudden; ; ; |
| adwin | Supervised | Adaptive Windowing [5] | default delta of , the base classifier used for error monitoring was Gaussian Naive Bayes |
| ddm | Supervised | Drift Detection Method [10] | default detection threshold of , the base classifier used for error monitoring was Gaussian Naive Bayes |
| eddm | Supervised | Early Drift Detection Method [3] | default beta of , the base classifier used for error monitoring was Gaussian Naive Bayes |
Before carrying out the comparative experiment, a preliminary analysis was conducted to calibrate the hyperparameters of the tested unsupervised methods – including padd – to ensure their correct configuration within the considered environment. Detailed hyperparameter selection results for proposed method are presented in the supplementary materials222https://github.com/w4k2/padd/blob/main/supplementary.pdf. For supervised methods, the default parameters were selected, consistent with the implementation in the scikit-multiflow library [27]
4 Experimental evaluation
The experiment compared the performance of the proposed approach with reference methods. The results for streams with ten drifts are shown in Figure 2. The columns indicate the results for different numbers of features, and the rows for gradual (top) and sudden drift (bottom) types. On the horizontal axis of each graph, successive chunks of the data stream are visible, while the central moments of the actual drift are marked with ticks and grid. Each detection is marked with a single point. For emphasis, the proposed approach is shown in red. The consecutive lines show the results from subsequent replications for a given detector. General results in the form of drift detection error measures averaged over the stream replications are presented in Figure 3.
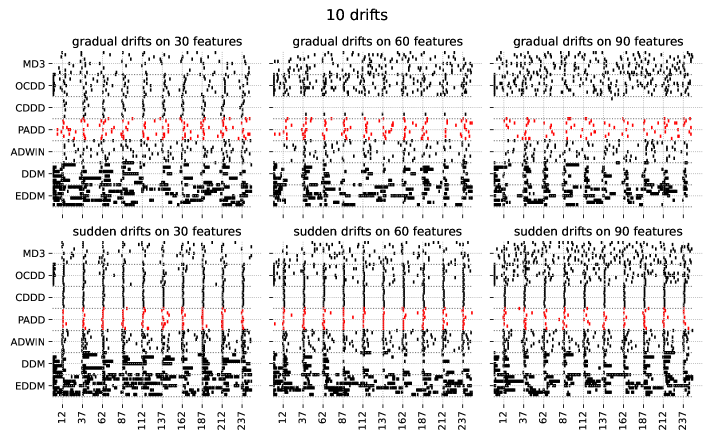
These graphs allow to visually assess the detection quality. The ideal result would be for the method to flag a single change at the center point of the each drift occurrence across all replications – this would result in vertical lines overlapping with the drift markings on the horizontal axis. It can be seen that detections for all methods are more dispersed in the case of gradual drifts – this is either due to the detection in an early or later phase of drift, or due to multiple signaling of the same change in the case of high sensitivity of the method.
Looking at the color-coded tables in the form of heat maps (Figure 3) allows for more general interpretation. The low error values are marked in blue and high in red. Cases for which it was impossible to calculate errors – due to lack of detection – are marked as blank fields. The columns of the figure show the results for the three drift detection errors – , , and , respectively. In each heat map, the results for individual methods are presented in columns, and the results for all tested types of streams are presented in rows, averaged over ten replications.
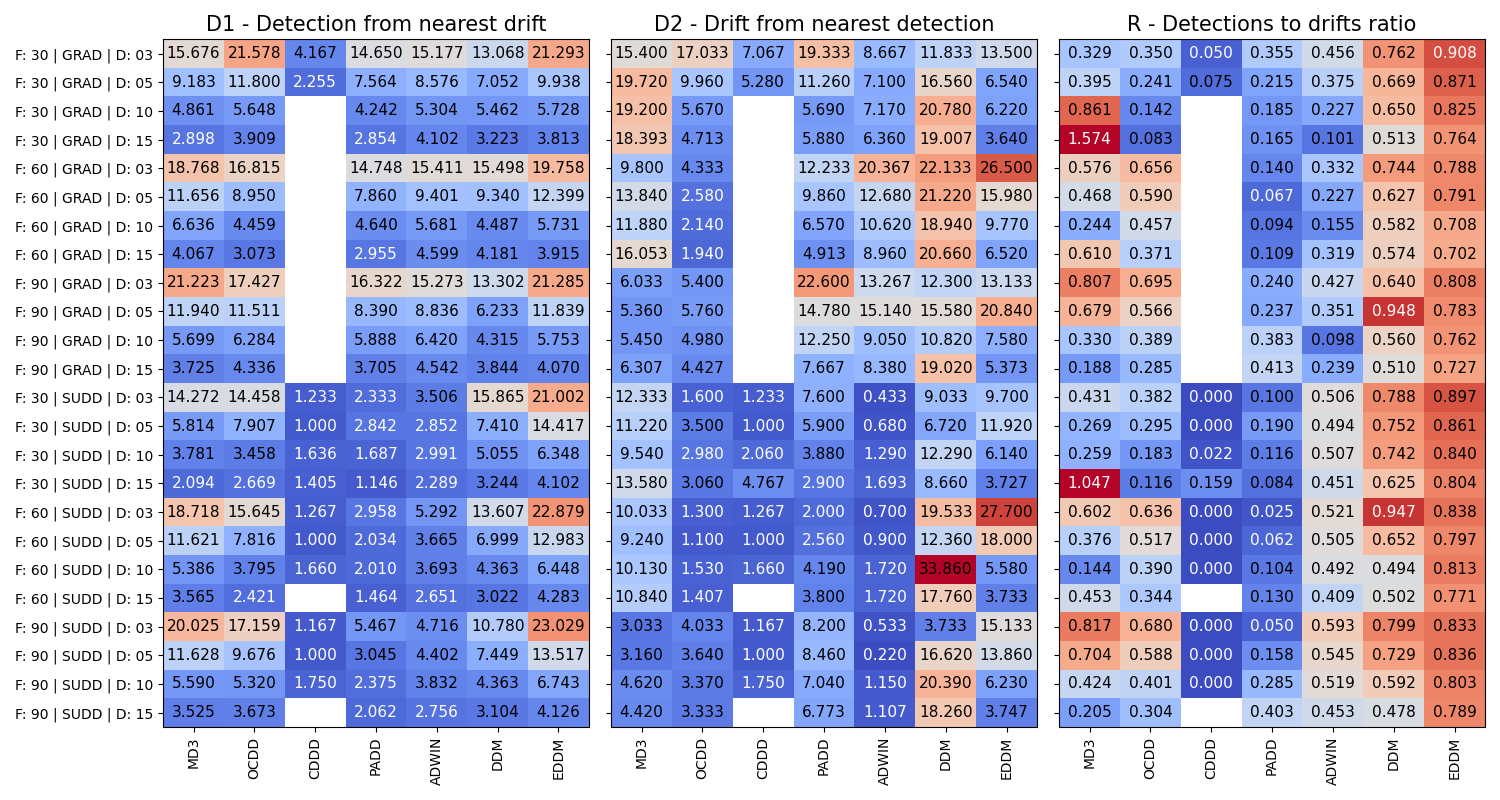
In the first error, the average distance of each detection to the nearest drift (), the average distance to the nearest drift is measured for each detection. This means that methods that signal many distant drifts from the moment of their actual occurrence, such as ddm, eddm, and md3, will achieve higher error values. It is also visible that for streams where drifts are less frequent (3 and 5 in the entire stream), these errors’ values will be higher due to the relatively greater distance for incorrect detections. In the second measure, the average distance of each drift to the nearest detection (), the nearest detection is searched for each drift. The highest errors in this criterion are demonstrated by the ddm and md3 methods, which sometimes signaled drifts with a delay or did not detect all changes. The last measure, the adjusted ratio of the number of detections to the number of drifts (), looks only at the number of changes signaled by the method compared to the actual number of drifts. This measure is aimed to penalize methods for too many detections rather than too few – hence the high error values for the md3, ddm, and eddm methods. It is worth paying attention to the results for the cddd method, which are exceptionally low in all streams for which the measure could be determined, however, its problem is the tendency to not signal frequent and gradual drifts.
The results obtained from the second experiment were also subjected to post-hoc Nemenyi test based on Wilcoxon Signed Rank across all the three errors. The results for , , and errors are presented in the Figure 4. The overall statistical analysis did not consider the results of the cddd detector due to the inability to calculate measures in the absence of detection by the method, which took place in 12 out of 24 calculations.
| () | () | () |
|---|---|---|
The results show that in the case of error, the presented method is significantly best, lone leader of comparison. For the error, the presented solution – while having the best ranking value – is statistically significantly co-dependent to the adwin and occd. For the , the best results were obtained by the ocdd method, and the padd results are statistically dependent on the second method in terms of quality, the adwin method with the minimal difference in ranks.
It is worth to emphasize, that those criteria should not be used independently to evaluate methods, and it is the juxtaposition of all three that describes the proper and effective method operation.
5 Conclusions and future works
This work proposed an unsupervised Parallel Activations Drift Detector, that utilises an untrained neural network to recognize significant changes in the posterior distribution of the data stream to signal concept drift according to the result of a statistical test stabilized by pool of replications. The conducted experimental evaluation allowed to demonstrate that the proposed padd method states a valuable tool in the context of reference methods. This enriches the pool of available drift detection methods, introducing an algorithm with high reliability in a proper configuration.
As part of future work, it is planned to expand the hyperparameter calibration study – considering the introduction of a non-parametric version of the method interpreting the area under the curve of the threshold function of a statistical test – and a broader review of possible validators to replace the simple Student’s T-test. An interesting area for developing the analysis would also be to conduct research on the dependencies between the outputs of the nn used, allowing for the naivety of their independence to be abandoned.
Acknowledgements
This work was supported by the statutory funds of the Department of Systems and Computer Networks, Wroclaw University of Science and Technology.
References
- [1] Agrahari, S., Singh, A.K.: Concept drift detection in data stream mining: A literature review. Journal of King Saud University - CISC 34(10), 9523–9540 (2022)
- [2] Bach, S.H., Maloof, M.A.: Paired learners for concept drift. In: 2008 Eighth IEEE International Conference on Data Mining. pp. 23–32. IEEE (2008)
- [3] Baena-Garcıa, M., del Campo-Ávila, J., Fidalgo, R., Bifet, A., Gavalda, R., Morales-Bueno, R.: Early drift detection method. In: Fourth international workshop on knowledge discovery from data streams. vol. 6, pp. 77–86. Citeseer (2006)
- [4] Bifet, A.: Classifier concept drift detection and the illusion of progress. In: ICAISC 2017, Zakopane, Poland, June 11-15, 2017, Proceedings, Part II 16. pp. 715–725. Springer (2017)
- [5] Bifet, A., Gavalda, R.: Learning from time-changing data with adaptive windowing. In: Proceedings of the 2007 SIAM international conference on data mining. pp. 443–448. SIAM (2007)
- [6] Chen, T., Kornblith, S., Swersky, K., Norouzi, M., Hinton, G.E.: Big self-supervised models are strong semi-supervised learners. Advances in neural information processing systems 33, 22243–22255 (2020)
- [7] Domingos, P., Hulten, G.: A general framework for mining massive data streams. Journal of Computational and Graphical Statistics 12(4), 945–949 (2003)
- [8] Emmert-Streib, F., Yang, Z., Feng, H., Tripathi, S., Dehmer, M.: An introductory review of deep learning for prediction models with big data. Frontiers in Artificial Intelligence 3, 4 (2020)
- [9] Feldmann, A., Gasser, O., Lichtblau, F., Pujol, E., Poese, I., Dietzel, C., Wagner, D., Wichtlhuber, M., Tapiador, J., Vallina-Rodriguez, N., et al.: A year in lockdown: how the waves of covid-19 impact internet traffic. Communications of the ACM 64(7), 101–108 (2021)
- [10] Gama, J., Medas, P., Castillo, G., Rodrigues, P.: Learning with drift detection. In: Advances in Artificial Intelligence–SBIA 2004, Sao Luis, Maranhao, Brazil, September 29-Ocotber 1, 2004. Proceedings 17. pp. 286–295. Springer (2004)
- [11] Gemaque, R.N., Costa, A.F.J., Giusti, R., Dos Santos, E.M.: An overview of unsupervised drift detection methods. Wiley Interdisciplinary Reviews: Data Mining and Knowledge Discovery 10(6), e1381 (2020)
- [12] Gözüaçık, Ö., Büyükçakır, A., Bonab, H., Can, F.: Unsupervised concept drift detection with a discriminative classifier. In: Proceedings of the 28th CIKM. pp. 2365–2368 (2019)
- [13] Gözüaçık, Ö., Can, F.: Concept learning using one-class classifiers for implicit drift detection in evolving data streams. Artificial Intelligence Review 54(5) (2021)
- [14] Grzenda, M., Gomes, H.M., Bifet, A.: Delayed labelling evaluation for data streams. Data Mining and Knowledge Discovery 34(5), 1237–1266 (2020)
- [15] Hu, H., Kantardzic, M., Sethi, T.S.: No free lunch theorem for concept drift detection in streaming data classification: A review. Wiley Interdisciplinary Reviews: Data Mining and Knowledge Discovery 10(2), e1327 (2020)
- [16] Klikowski, J.: Concept drift detector based on centroid distance analysis. In: 2022 International Joint Conference on Neural Networks (IJCNN). pp. 1–8. IEEE (2022)
- [17] Klinkenberg, R., Renz, I.: Adaptive information filtering: Learning in the presence of concept drifts. Learning for text categorization pp. 33–40 (1998)
- [18] Komorniczak, J., Ksieniewicz, P.: Complexity-based drift detection for nonstationary data streams. Neurocomputing 552, 126554 (2023)
- [19] Komorniczak, J., Zyblewski, P., Ksieniewicz, P.: Prior probability estimation in dynamically imbalanced data streams. In: 2021 International Joint Conference on Neural Networks (IJCNN). pp. 1–7. IEEE (2021)
- [20] Ksieniewicz, P., Zyblewski, P.: Stream-learn—open-source python library for difficult data stream batch analysis. Neurocomputing 478, 11–21 (2022)
- [21] Li, B., Wang, Y.j., Yang, D.s., Li, Y.m., Ma, X.k.: Faad: an unsupervised fast and accurate anomaly detection method for a multi-dimensional sequence over data stream. Frontiers of Information Technology & Electronic Engineering 20(3), 388–404 (2019)
- [22] Lindstrom, P., Mac Namee, B., Delany, S.J.: Drift detection using uncertainty distribution divergence. Evolving Systems 4, 13–25 (2013)
- [23] Liu, A., Lu, J., Liu, F., Zhang, G.: Accumulating regional density dissimilarity for concept drift detection in data streams. Pattern Recognition 76, 256–272 (2018)
- [24] Liu, S., Xue, S., Wu, J., Zhou, C., Yang, J., Li, Z., Cao, J.: Online active learning for drifting data streams. IEEE Transactions on Neural Networks and Learning Systems 34(1), 186–200 (2021)
- [25] Lu, J., Liu, A., Dong, F., Gu, F., Gama, J., Zhang, G.: Learning under concept drift: A review. IEEE transactions on knowledge and data engineering 31(12), 2346–2363 (2018)
- [26] Minku, L.L., Yao, X.: Ddd: A new ensemble approach for dealing with concept drift. IEEE transactions on knowledge and data engineering 24(4), 619–633 (2011)
- [27] Montiel, J., Read, J., Bifet, A., Abdessalem, T.: Scikit-multiflow: A multi-output streaming framework. Journal of Machine Learning Research 19(72), 1–5 (2018)
- [28] Narkhede, M.V., Bartakke, P.P., Sutaone, M.S.: A review on weight initialization strategies for neural networks. Artificial intelligence review 55(1), 291–322 (2022)
- [29] Sethi, T.S., Kantardzic, M.: Don’t pay for validation: Detecting drifts from unlabeled data using margin density. Procedia Computer Science 53, 103–112 (2015)
- [30] Sethi, T.S., Kantardzic, M., Hu, H.: A grid density based framework for classifying streaming data in the presence of concept drift. Journal of Intelligent Information Systems 46, 179–211 (2016)