FairEM360: A Suite for Responsible Entity Matching
Abstract.
Entity matching is one the earliest tasks that occur in the big data pipeline and is alarmingly exposed to unintentional biases that affect the quality of data. Identifying and mitigating the biases that exist in the data or are introduced by the matcher at this stage can contribute to promoting fairness in downstream tasks. This demonstration showcases FairEM360, a framework for 1) auditing the output of entity matchers across a wide range of fairness measures and paradigms, 2) providing potential explanations for the underlying reasons for unfairness, and 3) providing resolutions for the unfairness issues through an exploratory process with human-in-the-loop feedback, utilizing an ensemble of matchers. We aspire for FairEM360 to contribute to the prioritization of fairness as a key consideration in the evaluation of EM pipelines.
PVLDB Reference Format:
Nima Shahbazi, Mahdi Erfanian, Abolfazl Asudeh, Fatemeh Nargesian, Divesh Srivastava. PVLDB, 16(10): , 2024.
doi:
††This work is licensed under the Creative Commons BY-NC-ND 4.0 International License. Visit https://creativecommons.org/licenses/by-nc-nd/4.0/ to view a copy of this license. For any use beyond those covered by this license, obtain permission by emailing info@vldb.org. Copyright is held by the owner/author(s). Publication rights licensed to the VLDB Endowment.
Proceedings of the VLDB Endowment, Vol. 16, No. 10 ISSN 2150-8097.
doi:
PVLDB Artifact Availability: The source code, demonstration video, and other artifacts are available at: https://github.com/UIC-InDeXLab/FairEMDemo.
1. Introduction
Entity matching (EM) is the task of identifying records from one or more data sources that refer to the same real-world entity. EM is a critical step across a wide array of socially sensitive domains such as healthcare, security, HR, elections, and e-commerce. Recent studies (Shahbazi et al., 2023a, 2024) have highlighted the significance of evaluating EM tasks with fairness considerations and the potential severity of the consequences if overlooked since there is no single matcher that consistently outperforms all others. Certain data properties, such as heterogeneity, quality, inherent similarities among groups, and representation skews, along with the choice of entity matcher may encode unintentional biases towards certain groups resulting in systematic disparate impact. That is, records from some groups may match at a significantly lower/higher rate than records from other groups, with real-world consequences such as under/overestimating the prevalence of certain demographic groups. In this situation, where results vary based on data, matcher, matching criteria, and fairness measurement, it is necessary to compare the results of different matchers side-by-side, evaluate their advantages and disadvantages, and opt for the most fitting results for the task at hand.
To this end, we propose FairEM360, a framework for facilitating responsible EM. Our goal is to assist practitioners in finding answers to the following questions:
-
•
Does a matcher demonstrate (un)fairness towards a particular group of interest concerning a specific definition of fairness?
-
•
Can we find possible explanations for a matcher exhibiting unfairness towards a specific group?
-
•
Considering an ensemble of matchers, what strategy yields a desirable trade-off between fairness and matching performance?
FairEM360 incorporates a comprehensive set of group fairness definitions tailored for single and pairwise fairness metrics specifically designed for EM audits (Shahbazi et al., 2023a). FairEM360 also features a ready-to-use ensemble of 10 matchers for performing matching tasks. Furthermore, FairEM360 offers a diverse range of subgroup-based, measure-based, and group-representation based explanations that shed light on the reasoning behind matcher’s unfair behavior. Finally, through an exploratory process with human-in-the-loop feedback that navigates the combinatorial space of matchers, and fairness measures, FairEM360 is directed toward satisfying the fairness constraints required by the user while satisfying a minimum matching performance for various groups. To the best of our knowledge, FairEM360 stands out as the first system for responsible EM.
2. System Architecture
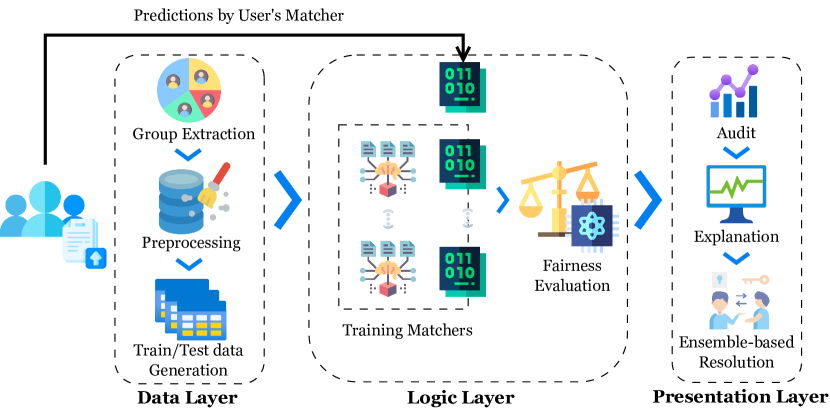
FairEM360 adopts a three-layer architecture: 1) data, 2) logic, and, 3) presentation (Figure 1). In the remainder of this section, we will provide an overview of each layer.
2.1. Data Layer
The data layer serves as the initial stage when users load their dataset into FairEM360. This layer fulfills two primary tasks:
Group Extraction: The first step in auditing an entity matcher for fairness is identifying meaningful groups/subgroups (e.g., white-male, black-female, ect.) from the sensitive attributes (e.g., race, sex), based on which the matcher should be audited. Sensitive attributes are attributes for which a matcher is likely to exhibit bias. Depending on the type, cardinality, and number of sensitive attributes, FairEM360 navigates the space of all possible (sub)groups. It unifies the group representations using one-hot encoding, which enables representing the subgroups of individual entities and pairs of entities across various settings such as binary, non-binary, and setwise sensitive attributes. Entity encodings are the output of the data layer and will be passed as an input to the logic layer, where the fairness of a matcher is investigated for a group.
Preprocessing: If the user opts to utilize the integrated matchers in their evaluation, the data layer will be responsible for preprocessing the input datasets to ensure their compatibility with the matchers, as well as splitting the data into test, train, and validation sets. The datasets are passed to the logic layer to be trained.
2.2. Logic Layer
The actual evaluation of the output from an EM task occurs in the logic layer. The input to the logic layer is a workload of tuples each consisting of left and right entity groups (extracted in the data layer), the matcher prediction, and the matching ground truth. A workload is a test set of tuples for evaluating an entity matcher. Given the pairwise nature of EM tasks, single fairness or pairwise fairness paradigms can be used to audit matchers for fairness. In single fairness, the performance of a matcher is evaluated for one group, matching at least one of the tuples in a pair. In pairwise fairness though, a pair of groups is considered for evaluation. Given a group of interest, the logic layer summarizes the workload into a confusion matrix, which is used in computing various fairness measures. Next, proper fairness measures are used to evaluate the EM task depending on the context of the task, the fairness paradigm of interest, etc. FairEM360 offers a set of 5 group fairness definitions specific to EM that users can use to evaluate their tasks. Finally, each group’s unfairness is calculated using subtraction-based or division-based notations of disparity and if the unfairness exceeds the fairness threshold specified by the user, the matcher is considered unfair for that group. For more details on fairness definitions, and unfairness measurement please refer to (Shahbazi et al., 2023a).
Training Matchers: If the user has chosen to use the integrated matchers in their evaluation, this layer initially trains the matchers before passing them to the evaluation component for auditing. We have integrated 10 ML-based EM systems into this component. Broadly speaking, these matchers can be categorized into one of two groups of non-neural or neural including:
- •
- •
The containerized design of the matcher integration component has greatly facilitated its extension. Practitioners can easily integrate their EM systems into FairEM360 by containerizing them and implementing a wrapper to preprocess the input datasets into their required format.
2.3. Presentation Layer
The presentation layer analyzes the results generated by the logic layer from evaluating fairness measures on (sub)groups of interest. More concretely, the input to the presentation layer is the disparity values of each group in case of single fairness or each group pair in case of pairwise fairness, for all applicable measures. The presentation layer has three main components:
Audit: The audit component presents the fairness evaluation results to the user. For every fairness paradigm and relevant fairness measure, FairEM360 illustrates the groups to which a matcher has exhibited unfairness and quantifies the extent of this disparity.
Explanation: After a matcher is audited based on fairness measures and groups, and unfairness are identified, FairEM360 reassures to offer additional insights explaining the unfairness towards a group. The explanations provided by FairEM360 fall under the category of Local Model-agnostic Methods (Molnar, 2020), where given an unfairness measure and a group for which the model has been unfair, the goal is to provide (local) explanations for the queried (measure, group).
The presentation layer determines whether a matcher w.r.t. a measure/group. To allow users to explore potential explanations for unfairness, FairEM360 provides three perspectives:
-
•
Subgroup-based Explanation. A matcher may be unfair on a group (e.g., female) because it performs poorly on more granular subgroups (e.g., black-female). Navigating the subgroup hierarchy of a matcher from an unfair group to its subgroups while considering the matcher’s performance on subgroups allows us to identify the subgroups that may be the source of unfairness. Assuming sufficient data exists for the unfair group and its granular subgroups in the dataset, disparity analysis of these granular subgroups over various measures allows the user to gain more insights into the unfairness of the original unfair group.
-
•
Measure-based Explanation. The measure-based explanation describes the unfairness of a matcher subject to a specific group in terms of the group’s confusion matrix. For example, the low accuracy for a specific group can be due to the high false-positive rate for that group. This is a common practice in analyzing matcher performance holistically. Measure-based explanations offer insights into the fairness definitions, indicating what factors have contributed to the emergence of such unfairness.
-
•
Group-representation based Explanation. Responsible training in EM techniques requires access to unbiased data with proper representation of different groups and possible cases (Shahbazi et al., 2023b). over/under representation of different groups can bias the models in favor of some of the groups, making the model unfair. In particular, given the class imbalance nature of EM tasks, it is important to ensure proper representatives from different groups in both (match/unmatch) classes. This group of explanations analyzes the representation of each group within the dataset and conditioned on the matching ground truths.
-
•
Example-based Explanation. For each group that exhibits unfairness according to a particular fairness measure, FairEM360 randomly selects a small sample for user review. These examples serve to provide the user with deeper insights into the factors (e.g., name similarities) contributing to higher error rates within this specific group. Such factors may include inherent similarities among certain groups or matchers assigning greater importance to specific features, among others.
Ensemble-based Resolutions: The primary goal of this component is to resolve the existing unfairness by assigning various matchers for various groups (e.g., HierMatcher for white and SVM-based for black individuals). Let be an ensemble, where each groups is assigned the model . One strategy is to use the best-performing matcher for each group . That is , where is the performance of the model for group . This approach, while being optimal for each group may not be fair, as the best-performing models for various groups may not provide an equal performance between all groups. Alternatively, optimizing for fairness, one can find an assignment of models with minimum performance disparity across different groups (i.e., max. fairness). This approach, however, may miss to assign good-performing models for some groups. Therefore, instead of sticking to one strategy, FairEM360 enables optimization based on both strategies. To do so, it considers two criteria: (a) the worst performance for a group, where the model performance for all groups is at least ; and (b) unfairness .
Consider the set of all possible assignment of models to the groups. Note that for groups and models, there are such assignments . Let and be performance and fairness values for each assignment . FairEM360 views each as a point in the fairness-performance space. It then shows the Pareto-frontier of the points, i.e., set of non-dominated assignments, to the user in order to visually explore the trade-offs of fairness and performance, and to select a non-dominated assignment .
2.4. Implementation Details
The FairEM360 is a web-application with front-end and back-end modules. The back-end is responsible for data layer and logic layer operations, while the front-end handles visualization tasks. The back-end is implemented using FastAPI to maximize adaptability and scalability. Employing abstraction and object-oriented programming, the architecture facilitates seamless integration of new matchers with fairness measures. Communication with embedded matchers is facilitated through Docker containers, enabling each matcher to operate with its own dependencies. This design enables the system to accommodate multiple matchers concurrently. Introducing a new matcher simply requires containerizing it and implementing designated abstract methods for preprocessing, running and extracting final scores. The front-end is implemented using ReactJS, a popular JavaScript library that facilitates the development of modular and reusable user interfaces. ReactJS employs a component-based architecture, where state components manage data within the component hierarchy. This approach enables a fully dynamic and interactive system, capable of adapting seamlessly to user interactions. Furthermore, the back-end and front-end employ a Representational State Transfer (RESTful) API for communication, thereby establishing independence between the system’s logic and visualization components. This decoupling facilitates independent modifications to either part without cascading effects on the other.
3. Demonstration Scenarios
In this demonstration, our objective is to illustrate how FairEM360 can aid practitioners in auditing their EM tasks. The landing page of FairEM360 greets users with an introduction and offers essential details about the system and how it operates. Following that, a standard workflow within FairEM360 involves four key steps:
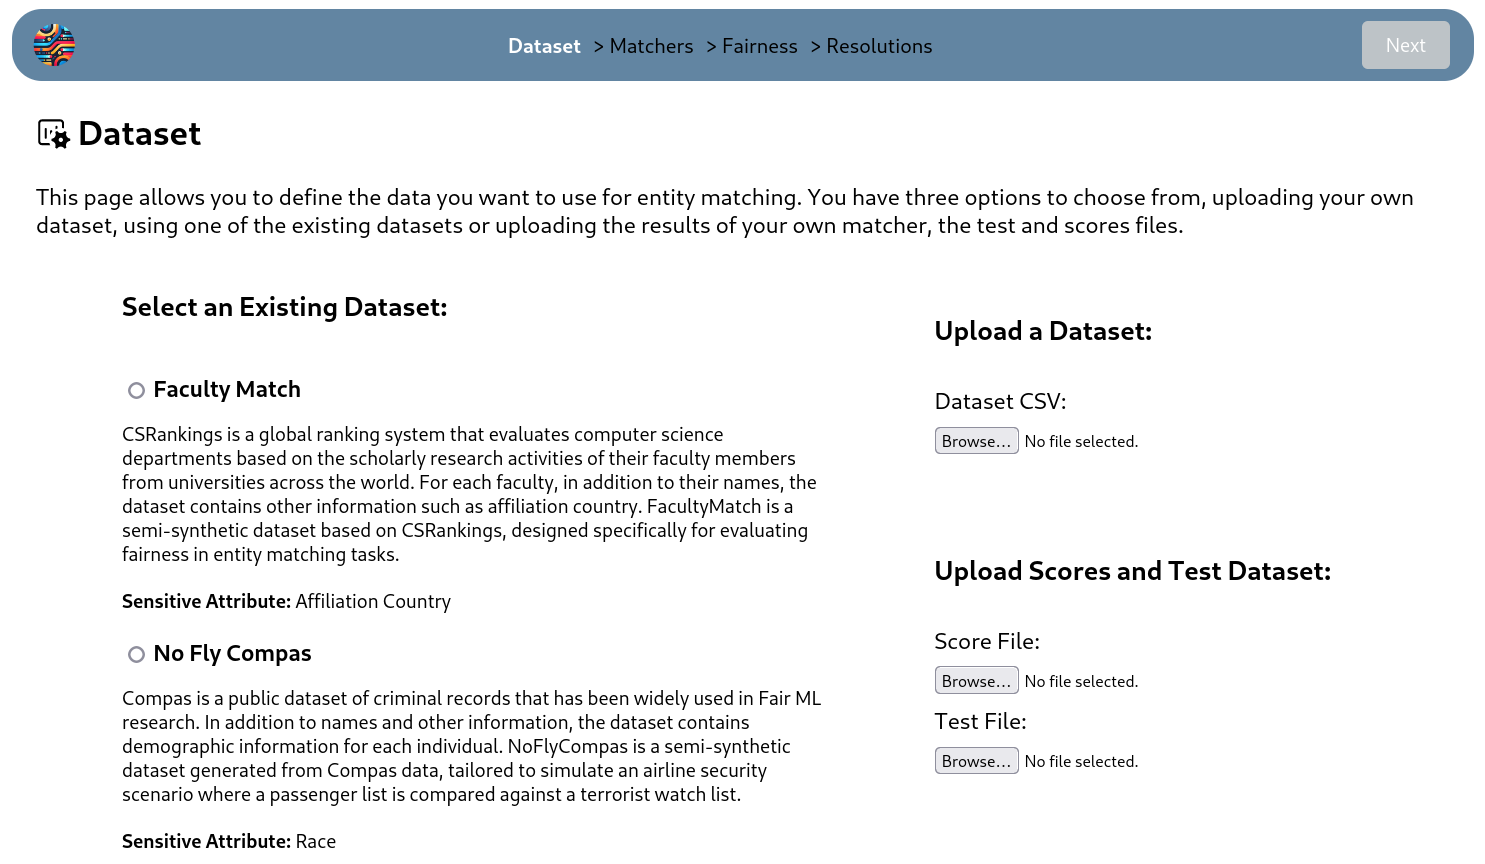
Step 1: Data Import: In this step, users are asked to import their datasets into the system. At a high level, FairEM360 performs two distinct tasks: (i) Matching-and-Evaluation and (ii) Evaluation-Only. In the former task, users upload a dataset to the system and utilize the integrated matchers within the system to conduct the matching process, followed by evaluating the matching outcomes. In the latter task, users have already executed the matching process using their own matcher, and they upload the predictions (in the format of scores) along with the dataset to the system for evaluation. In our demonstrations, we use FacultyMatch and NoFlyCompas datasets to highlight the capabilities of FairEM360. Figure 7 illustrates the data import step. The user has selected the FacultyMatch dataset and proceeds to the next step.
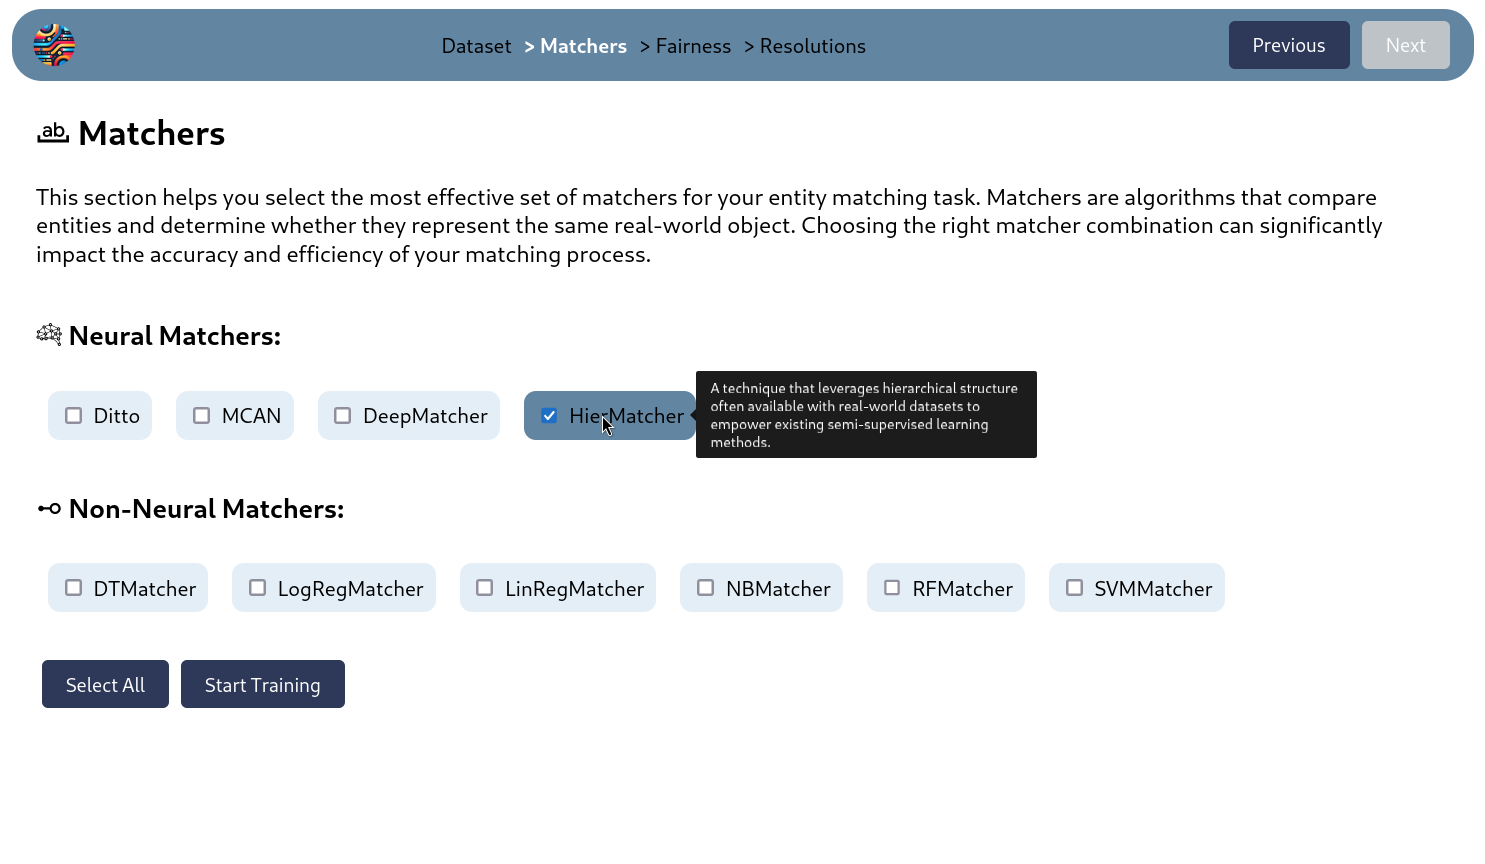
Step 2: Matcher Selection: Depending on the task of interest, during this step, the user selects a set of matchers to execute the matching task on the input dataset. This is particularly useful when users wish to compare the performance of multiple matchers on their data or assess the performance of their own matcher against the integrated matchers FairEM360 and leverage them to resolve any potential unfairness issues. Users can also access information about each matcher by hovering over its title. Figure 7 illustrates the matcher selection step.
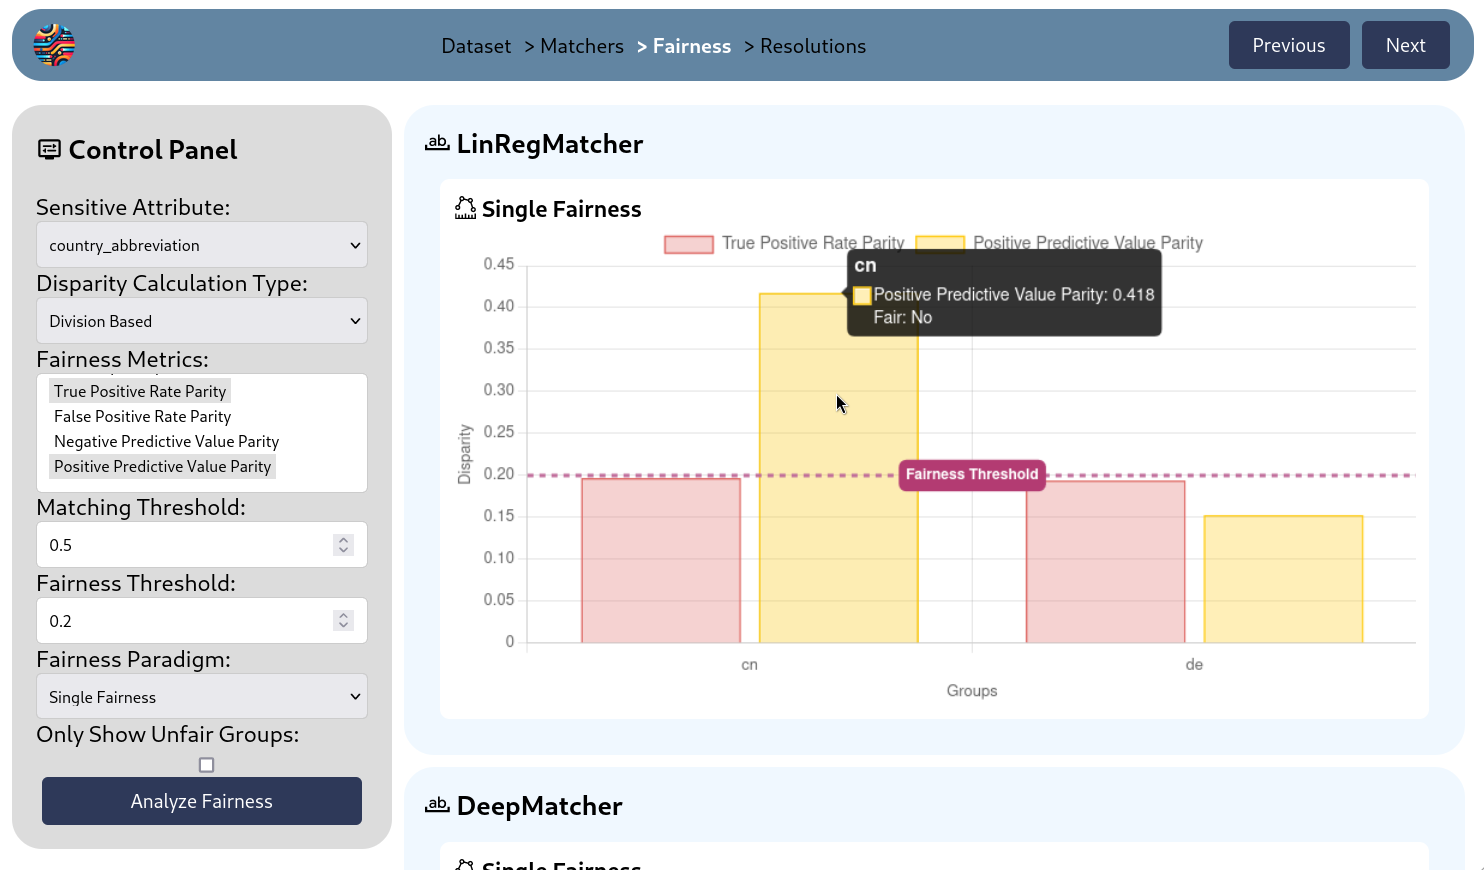
Step 3: Fairness Evaluation: In this step, the user initially determines how to conduct the audit on the matching results. The initial decision involves selecting the sensitive attribute which assists FairEM360 in the automatic group extraction process. Next, the user must select the unfairness calculation approach (subtraction-based vs. division-based) and specify the fairness measures they wish to employ to evaluate their task. Users can view information about each definition by hovering over the corresponding measure. Next, the user should specify the matching threshold, a value within the range of that determines the cut-off point above which a pair is considered a match. The subsequent variable to be determined is the fairness threshold, which specifies the threshold beyond which the disparity between a specific group and the average value based on a fairness definition is considered unfair. Lastly, the user selects the fairness paradigm and decides whether they want to exclusively view the results related to unfair groups.
With the chosen evaluation criteria as outlined above, FairEM360 initiates the audit process and displays the results in the right pane. For each matcher and fairness paradigm, the results are presented as bar charts illustrating the unfairness value for each group alongside each measure. Any group whose value surpasses the designated fairness threshold (highlighted by a red line in the plot) is considered unfair. The plots provide a high level of interactivity, enabling users to filter results by clicking on the measure name in the legend or to view details of each group by hovering over individual bars. Figure 7 illustrates an instance of the audit FairEM360 offers where LinRegMatcher demonstrates unfairness for the cn, as its unfairness of 0.418 exceeds the specified fairness threshold of 0.2.
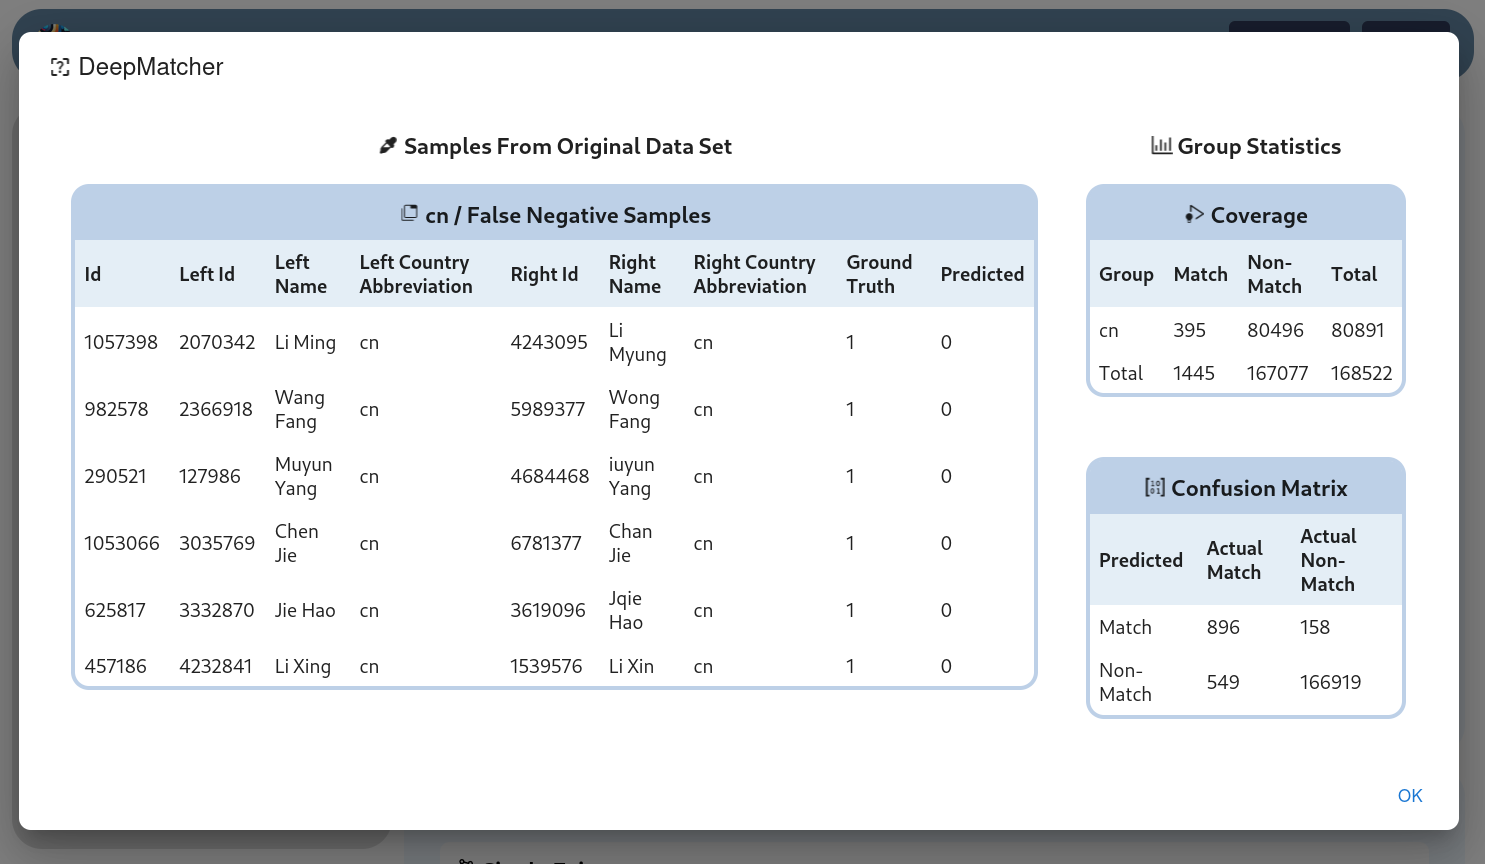
By clicking on each bar, FairEM360 provides insights into various aspects of the group, including its representation (coverage) in the training data, a random sample of problematic pairs associated with the measure and group, investigating the subgroup hierarchy unfairness if applicable (specific to setwise or intersectional sensitive attributes), group’s confusion matrix and factors that have contributed to the unfairness, among other details. Figure 7 provides an example of the potential explanations for a matcher’s unfair behavior towards a group. In this case the matcher has been unfair towards cn group w.r.t. True Positive Rate Parity. By examining the example-based explanations, one can infer that the matcher is erroneously matching entities from the cn group due to inherent similarities present in Chinese names compared to German names.
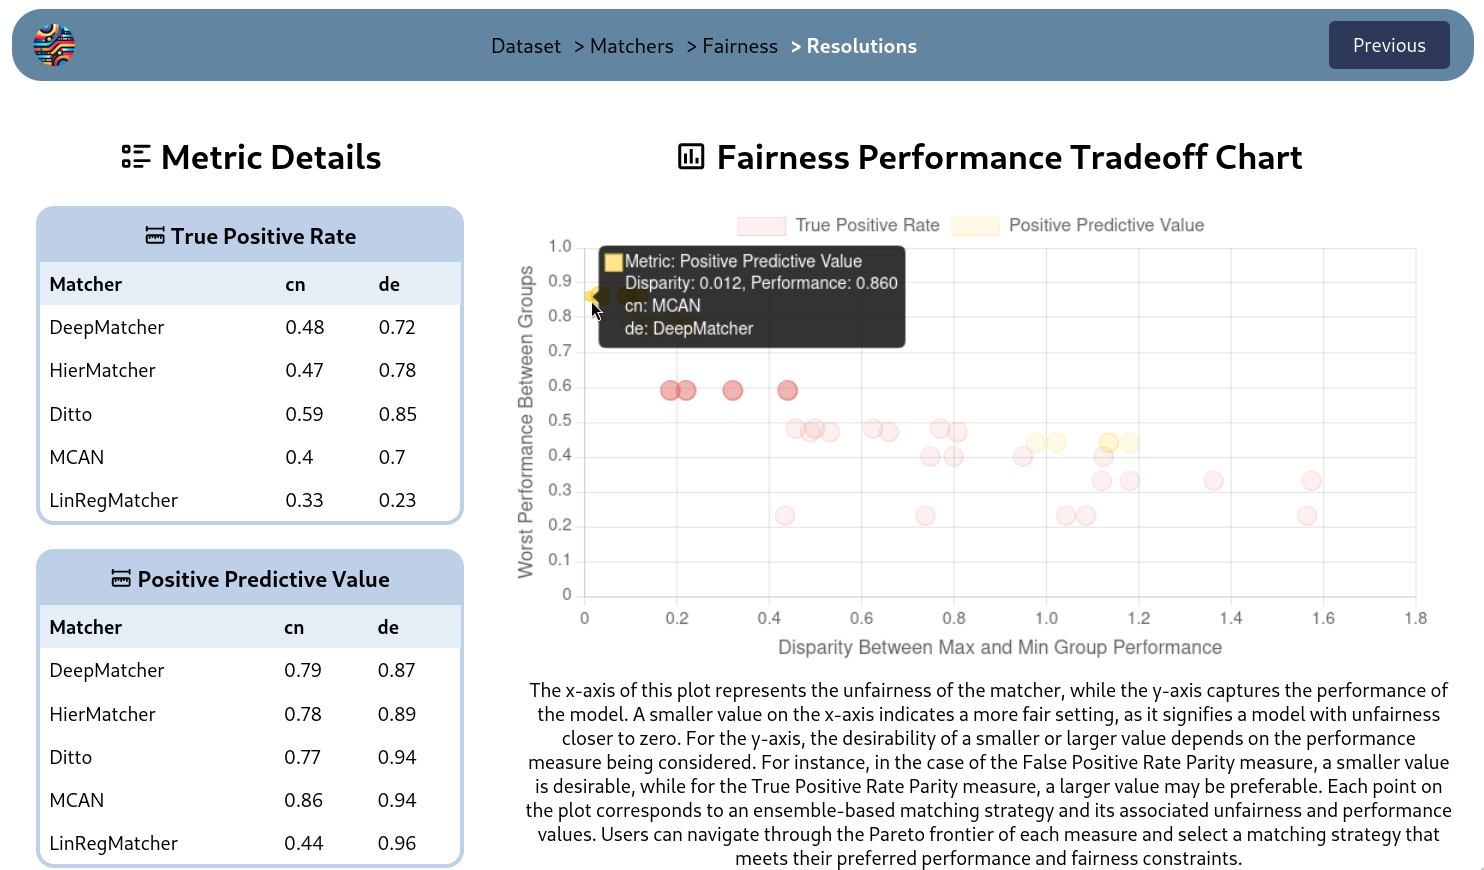
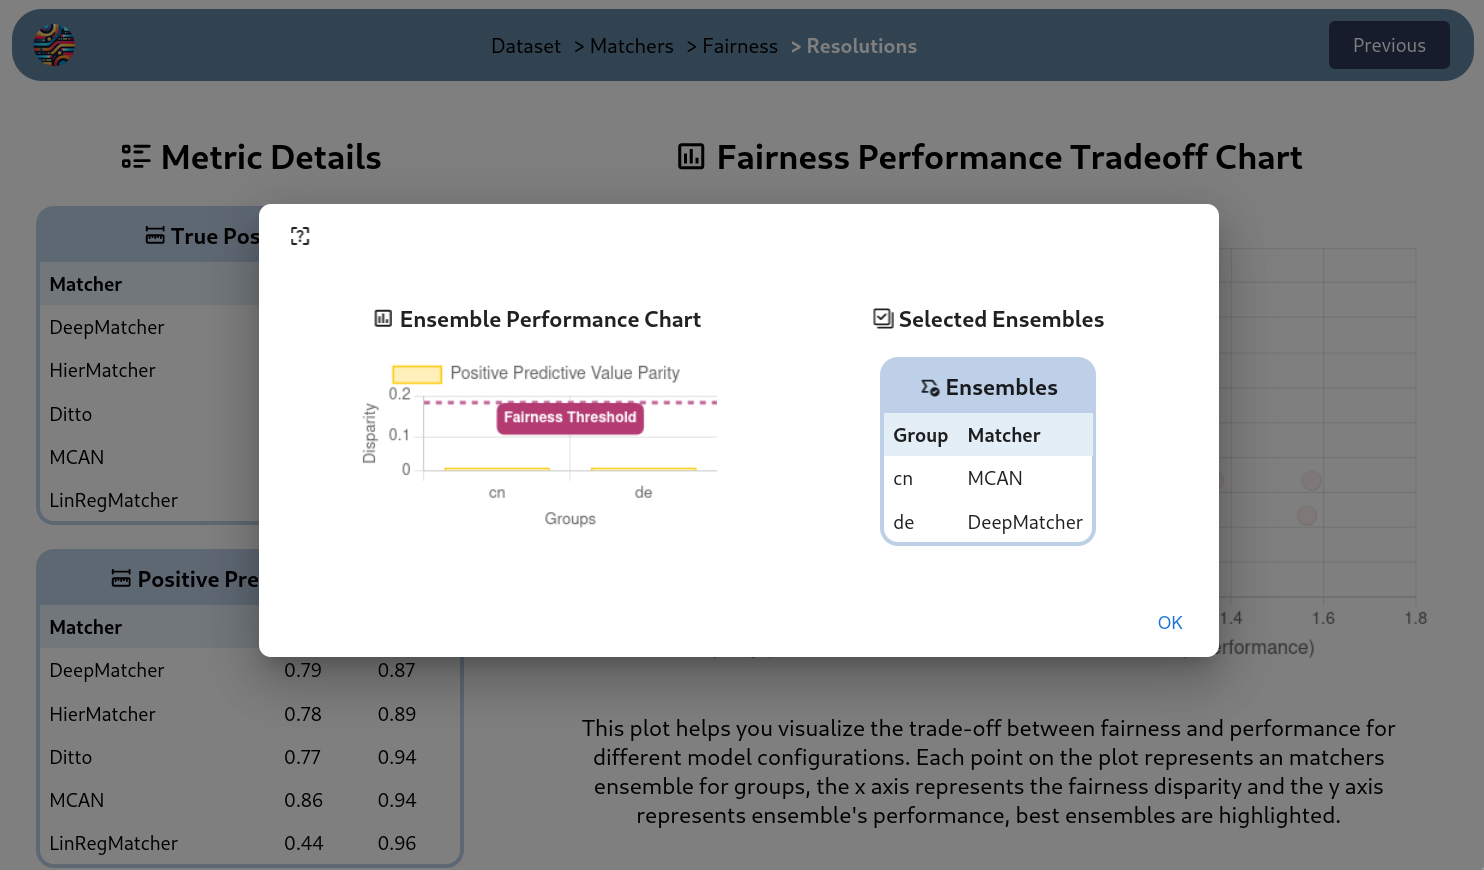
Step 4: Ensemble-based Resolution: Having observed an instance of unfairness towards a group, the next logical step is to propose a resolution. Therefore, in the final step, user specifies a group for which they want to resolve the unfairness issues. From that point, FairEM360 adopts an exploratory approach based on an ensemble of matchers. For each disadvantaged group, an alternative matcher that performs superior can be selected to carry out the matching task. However, this superiority is contingent upon the user’s preference regarding the priority of group accuracy versus fairness. User specifies an accuracy measure they want to optimize the matching task for. Next, FairEM360 presents the user with the settings that yield the best performance while simultaneously achieving fairness. However, as it may not always be feasible to find such a matcher, the user may choose whether they can accept slightly lower yet still acceptable performance while ensuring fairness, or if they prefer to prioritize a more accurate result even if it meets a less strict fairness threshold. FairEM360 facilitates this process by presenting the user fairness/performance trade-off plot highlighting the Pareto frontier. The x-axis of this plot represents the unfairness of the matcher, while the y-axis captures the performance of the model. A smaller value on the x-axis indicates a more fair setting, as it signifies a model with unfairness closer to zero. For the y-axis, the desirability of a smaller or larger value depends on the performance measure being considered. For instance, in the case of the False Positive Rate Parity measure, a smaller value is desirable, while for the True Positive Rate Parity measure, a larger value may be preferable. Each point on the plot corresponds to an ensemble-based matching strategy and its associated unfairness and performance values. Users can navigate through the Pareto frontier of each measure and select a matching strategy that meets their preferred performance and fairness constraints. Finally, by clicking on the desired point, users can view the recommended strategy from our resolution component for matching and observe the audit results for such a strategy. Figure 7 illustrates an example of the resolution step. In this scenario, the user can choose MCAN matcher, which offers a 0.926 Positive Predictive Value and a 0.056 (i.e., 5.6%) unfairness to perform the matching for the cn group. Figure 7 displays the audit results based on this matching strategy, which effectively resolves the unfairness issue.
This iterative process continues until the user is satisfied with the results, and eventually, the user is presented with the final audit results based on their decisions.
4. Conclusion
In this paper, we introduced FairEM360, a comprehensive suite designed for fairness-aware entity matching. Practitioners can use FairEM360 to conduct audits on their EM tasks, acquire insights into the root causes of unfairness exhibited by matchers, and address these fairness issues using an ensemble-based approach. We hope that this tool serves as a step towards fostering responsible data analytics practices.
References
- (1)
- Fu et al. (2021) Cheng Fu, Xianpei Han, Jiaming He, and Le Sun. 2021. Hierarchical matching network for heterogeneous entity resolution. In IJCAI. 3665–3671.
- Konda (2018) Pradap Venkatramanan Konda. 2018. Magellan: Toward building entity matching management systems. The University of Wisconsin-Madison.
- Li et al. (2020) Yuliang Li, Jinfeng Li, Yoshihiko Suhara, AnHai Doan, and Wang-Chiew Tan. 2020. Deep entity matching with pre-trained language models. PVLDB 14, 1 (2020).
- Molnar (2020) Christoph Molnar. 2020. Interpretable machine learning. Lulu. com.
- Mudgal et al. (2018) Sidharth Mudgal, Han Li, and et al. 2018. Deep learning for entity matching: A design space exploration. In SIGMOD. 19–34.
- Shahbazi et al. (2023a) Nima Shahbazi, Nikola Danevski, Fatemeh Nargesian, Abolfazl Asudeh, and Divesh Srivastava. 2023a. Through the Fairness Lens: Experimental Analysis and Evaluation of Entity Matching. PVLDB 16, 11 (2023), 3279–3292.
- Shahbazi et al. (2023b) Nima Shahbazi, Yin Lin, Abolfazl Asudeh, and HV Jagadish. 2023b. Representation bias in data: a survey on identification and resolution techniques. CSUR (2023).
- Shahbazi et al. (2024) Nima Shahbazi, Jin Wang, Zhengjie Miao, and Nikita Bhutani. 2024. Fairness-aware Data Preparation for Entity Matching. ICDE (2024).
- Zhang et al. (2020) Dongxiang Zhang, Yuyang Nie, Sai Wu, Yanyan Shen, and Kian-Lee Tan. 2020. Multi-context attention for entity matching. In TheWebConf. 2634–2640.