Spectroscopic Survey of Faint Planetary-Nebula Nuclei. IV. The Abell 35-Type Central Star of Pa 27111Based on observations obtained with the Hobby-Eberly Telescope (HET), which is a joint project of the University of Texas at Austin, the Pennsylvania State University, Ludwig-Maximillians-Universität München, and Georg-August Universität Göttingen. The HET is named in honor of its principal benefactors, William P. Hobby and Robert E. Eberly.
Abstract
We present optical spectroscopy of the 12th-mag central star of the planetary nebula (PN) Patchick 27 (Pa 27), obtained during a survey of faint PN nuclei (PNNi) with the Low-Resolution Spectrograph (LRS2) of the Hobby-Eberly Telescope. The optical spectrum of Pa 27 is that of a K0 III red giant with rotationally broadened lines. However, the star is detected in the near-ultraviolet (near-UV) with GALEX, showing that a hot binary component is also present. The spectral-energy distribution from the near-UV to the mid-infrared can be fitted with a combination of the K0 III giant and a hot PNN with an effective temperature of about 50,000 K. Photometric observations of Pa 27, both ground-based and from TESS, show a low-amplitude sinusoidal variation with a period of 7.36 days, probably due to starspots on a rotating and magnetically active cool giant. Pa 27 is a new member of the rare class of “Abell 35-type central stars,” which are binary PNNi consisting of a spotted late-type star and a hot pre-white dwarf. They are likely the result of a situation where an AGB star ejects its outer layers in a dense wind, part of which is captured by a distant companion, spinning up its rotation by accretion of material and angular momentum. We suggest several useful follow-up observations.
1 Introduction
The central stars of planetary nebulae (PNe)—planetary-nebula nuclei (PNNi)—exhibit a diverse range of spectroscopic and photometric phenomena, including unusual chemical compositions, binarity, pulsations, strong stellar winds, and rapid evolution (see review articles by Weidmann et al. 2020 and Kwitter & Henry 2022). This is the fourth in a series of papers presenting results from a spectroscopic survey of central stars of faint Galactic PNe. The survey is carried out with the second-generation Low-Resolution Spectrograph (LRS2; Chonis et al. 2016) of the 10-m Hobby-Eberly Telescope (HET; Ramsey et al. 1998; Hill et al. 2021), located at McDonald Observatory in west Texas, USA.
An overview of the survey, a description of the instrumentation and data-reduction procedures, target selection, and some initial results, were presented in our first paper (Bond et al., 2023a, hereafter Paper I). Paper II (Bond et al., 2023b) discussed the central star of the “PN mimic” Fr 2-30, and Paper III (Werner et al., 2024) presents discoveries of three new extremely hot hydrogen-deficient PNNi. About 50 central stars have been observed to date. Future papers will discuss several more individual objects of special interest, and another publication will present results on a group of nuclei with fairly normal hydrogen-rich spectra. In this fourth paper we describe our discovery of a remarkable central star, that of the PN Patchick 27 (Pa 27). It is a new member of a small group of binary nuclei composed of a rotating and spotted late-type star and a hot companion. We present some initial findings, and we encourage follow-up observations.
2 The Faint Planetary Nebula Pa 27
As explained in our previous papers, we assembled a lengthy target list of central stars for our survey, most of them belonging to faint PNe discovered in recent years by amateur astronomers, and this list was submitted to the HET observing queue (see Shetrone et al. 2007). Exposures were chosen for execution by the telescope schedulers, essentially at random, depending on sky conditions and lack of observable higher-ranked targets.
Pa 27 (PN G075.007.2) is a very low-surface-brightness PN discovered by amateur Dana Patchick,222See https://www.astrobin.com/users/DanaPatchick a member of the Deep Sky Hunters (DSH) collaboration. It was included in a list of PNe found by the DSH team that was presented in a conference poster333Available at http://www.astroscu.unam.mx/apn6/PROCEEDINGS/B3-Kronberger.pdf by Kronberger et al. (2014). The poster shows a deep narrow-band image of Pa 27, obtained with the Kitt Peak 2.1-m telescope in H and [O III] 5007 Å. Pa 27 lies just off the northern edge of the Veil Nebula supernova remnant in Cygnus,444Deep, wide-angle images of the field are available at https://www.astrobin.com/full/g3myxl/0/ (Andrzej Polkowski) and http://cosmicneighbors.net/pa27-big.jpg (Mike Keith). but is an unrelated background object. The PN is roughly circular, with a diameter of about . The Kitt Peak image shows bright filaments on its northern rim, possibly due to an interaction with the interstellar medium.555Alternatively, the filaments on the northern edge of Pa 27 could be superposed foreground features belonging to the Veil Nebula. The fact that the proper motion of the PN central star is not in a northerly direction may support this possibility. Further information about Pa 27 is given in the online Hong-Kong/AAO/Strasbourg/H Planetary Nebulae (HASH) database666http://hashpn.space/ (Parker et al., 2016; Bojičić et al., 2017), including a spectrum of the PN and direct images at several wavelengths from the ultraviolet (UV) to the mid-infrared.
3 Central Star
A conspicuous 12th-mag star lies near the center of Pa 27. An image obtained by the Galaxy Evolution Explorer (GALEX), which is shown at the HASH website, reveals that this star is bright in the near-UV, making it likely to be the ionizing source and central star of the PN. Table 1 gives information on the star, taken from Gaia Data Release 3777https://vizier.cds.unistra.fr/viz-bin/VizieR-3?-source=I/355/gaiadr3 (DR3; Gaia Collaboration et al. 2016, 2023), including its celestial and Galactic coordinates, parallax and proper motion, magnitude and color, and radial velocity and line broadening.
| Parameter | Value |
|---|---|
| RA (J2000) | 20 48 58.358 |
| Dec (J2000) | +32 18 14.73 |
| [deg] | 75.00 |
| [deg] | |
| Parallax [mas] | |
| [mas yr-1] | |
| [mas yr-1] | |
| [mag] | 12.27 |
| [mag] | |
| Radial velocity [] | |
| Line broadening [] |
A large majority of PNNi have spectra indicating very high surface temperatures, which is true of all of the objects from our survey described in our first three papers. However, the central star of Pa 27 is unusually red at optical wavelengths, with a Gaia color index of (see Table 1). Since the nucleus is also a GALEX source, the system is likely to be a binary consisting of the optical star and a UV-bright hot companion.
The reciprocal of the Gaia parallax gives a distance to the star (and to the nebula) of pc. Using a Bayesian analysis, Bailer-Jones et al. (2021) refine the estimated geometric distance to pc. At this distance, the foreground interstellar extinction, determined using the online Stilism tool888https://stilism.obspm.fr/ (Capitanio et al., 2017), is . Based on these values, and an apparent magnitude of from the APASS catalog,999https://www.aavso.org/download-apass-data we find an absolute magnitude for the central star of . Thus the optical star appears to be a late-type giant or bright subgiant.
4 HET/LRS2 Observations and Data Reduction
Our previous papers give full details of the LRS2 instrumentation used for our survey. In summary, LRS2 is composed of two integral-field-unit (IFU) spectrographs: blue (LRS2-B) and red (LRS2-R), with fields of view of . The observations discussed in this paper were made with LRS2-B, which employs a dichroic beamsplitter to send light simultaneously into two units: the “UV” channel (covering 3640–4645 Å at a resolving power of 1910), and the “Orange” channel (covering 4635–6950 Å at a resolving power of 1140). The data are initially processed using Panacea,101010https://github.com/grzeimann/Panacea which performs bias and flat-field correction, fiber extraction, and wavelength calibration. An absolute-flux calibration comes from default response curves and measures of the telescope mirror illumination, as well as the exposure throughput from guider images. We then apply LRS2Multi111111https://github.com/grzeimann/LRS2Multi to the un-sky-subtracted, flux-calibrated fiber spectra, to perform source extraction using a 2 radius aperture, and subtraction of the spectrum of the sky and nebula based on an annular aperture surrounding the target. Spectra from multiple exposures are then combined. The final spectrum, from both channels, is resampled to a common linear grid with a 0.7 Å spacing. An observation log for our LRS2-B exposures on Pa 27 is presented in Table 2.
| Date | Exposure |
|---|---|
| [YYYY-MM-DD] | [s] |
| 2020-08-06 | 90 |
| 2022-07-15 | 180 |
| 2022-08-16 | 180 |
5 Optical Spectrum
We carried out spectral classification for the central star by comparing its spectrum with those of bright stars with known spectral types. We downloaded their spectra from the MILES website121212The acronym stands for Medium-resolution Isaac Newton Telescope Library of Empirical Spectra. See http://miles.iac.es (Falcón-Barroso et al., 2011), which provides a library of observed spectra with a resolution similar to that of our HET data. Guided by the discussion in the next section, we focused on red giants with spectral types of late G to early K. A good match to the spectrum of Pa 27 was obtained with the K0 III star Cancri. The MILES site gives this star parameters of K, , and . Its absolute magnitude, based on an apparent magnitude of (Argue, 1963) and a Gaia parallax of 23.83 mas, is , very close to the value for Pa 27 (+1.2; Section 3).
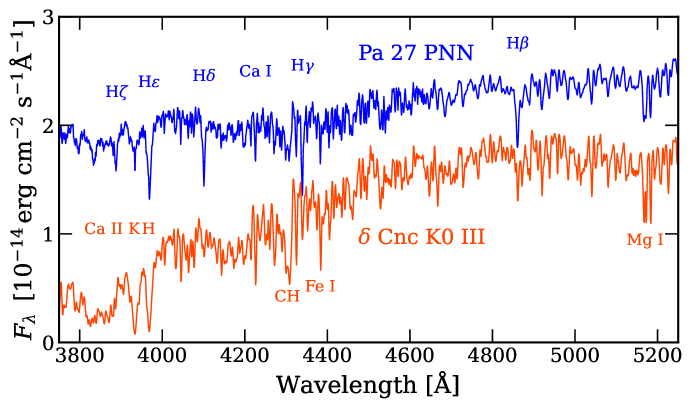
In Figure 1 we plot our HET LRS2-B spectrum of the central star of Pa 27, split into two segments: 5200–6600 Å (blue line in top panel) and 3800–5200 Å (blue line in bottom panel). Also plotted (red lines in both panels) is the spectrum of Cnc; it has been scaled to the absolute flux of Pa 27, and to match the line profiles of the HET spectrum we applied a boxcar smoothing of 3 pixels (2.7 Å).
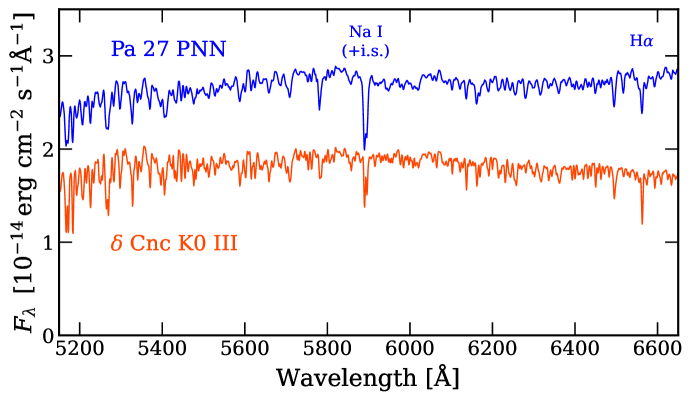
The top panel in Figure 1 shows the close similarity of the spectra at longer wavelengths, except that the Na I D lines are stronger in Pa 27, due to a component of interstellar absorption.131313One difference is that a line at 6517 Å is stronger in Pa 27 than in Cnc. We suspect that this feature is affected by an instrumental artifact, since a similar artifact is present in several of our spectra of hot central stars. See especially Figure 3 in Paper I.
However, in the bottom panel of Figure 1, differences in the spectra become more apparent as we move to shorter wavelengths. The atomic lines and CH become weaker in the central star than in Cnc, while the Balmer lines become stronger. The Ca II K absorption line of the cool star is partially filled in (but note a sharp interstellar component at its core). And the energy distribution of the nucleus becomes shallower than in the K0 III standard star. All of these spectral features indicate the presence of a hot companion of the central star, contributing an increasing amount of flux at shorter wavelengths, and diluting the contribution from the K0 component.
Our IFU frames of the central star show a stellar profile, as do images in publicly available sky surveys, so the binary pair is unresolved in ground-based data. This does not provide a tight constraint on the orbital separation; for example, a separation of would correspond to a projected physical distance as large as 700 AU.
6 Spectral-Energy Distribution
In this section we construct the spectral-energy distribution (SED) of the Pa 27 nucleus. Table 3 presents stellar magnitudes for the central star in a range of bandpasses, and the corresponding absolute fluxes. We gathered these data from the following sources: (1) A near-UV magnitude from the GALEX source catalog141414https://galex.stsci.edu/gr6/?page=mastform (unfortunately there was no GALEX observation in the far-UV). (2) Magnitudes in the , , , , and bands from the photometric catalog151515https://catalogs.mast.stsci.edu/panstarrs/ of the Panoramic Survey Telescope and Rapid Response System (Pan-STARRS or PS1; Kaiser et al. 2010). (3) Near-infrared magnitudes from the Two Micron All Sky Survey (2MASS; Skrutskie et al. 2006). (4) Mid-infrared magnitudes from the Wide-field Infrared Survey Explorer (WISE; Wright et al., 2010). The 2MASS and WISE data were obtained from the NASA/IPAC Infrared Science Archive.161616http://irsa.ipac.caltech.edu/frontpage
| Bandpass | MagnitudeaaSources for magnitudes in column 2 are given in column 3 and described in the text. Uncertainties are about 0.01 mag for GALEX, 0.01–0.02 mag for PS1, 0.02 mag for 2MASS, and 0.02–0.03 mag for WISE to . The magnitude is heavily contaminated by the surrounding PN. | SourceaaSources for magnitudes in column 2 are given in column 3 and described in the text. Uncertainties are about 0.01 mag for GALEX, 0.01–0.02 mag for PS1, 0.02 mag for 2MASS, and 0.02–0.03 mag for WISE to . The magnitude is heavily contaminated by the surrounding PN. | bbEffective wavelengths are from the following sources. GALEX NUV: https://asd.gsfc.nasa.gov/archive/galex/; PS1: Tonry et al. (2012); 2MASS: http://coolwiki.ipac.caltech.edu/index.php/Central_wavelengths_and_zero_points; WISE: Wright et al. (2010). | ccAbsolute fluxes were determined using photometric zero-points for 2MASS and WISE from the Caltech compilation cited in Footnote b. GALEX and PS1 magnitudes are on the AB scale. |
|---|---|---|---|---|
| [m] | [Å-1] | |||
| NUV | 14.467 | GALEX | 0.2267 | |
| 13.163 | PS1 | 0.481 | ||
| 12.295 | PS1 | 0.617 | ||
| 11.951 | PS1 | 0.752 | ||
| 11.762 | PS1 | 0.866 | ||
| 12.637 | PS1 | 0.962 | ||
| 10.543 | 2MASS | 1.235 | ||
| 9.918 | 2MASS | 1.662 | ||
| 9.756 | 2MASS | 2.159 | ||
| 1 | 9.633 | WISE | 3.35 | |
| 2 | 9.668 | WISE | 4.60 | |
| 3 | 9.339 | WISE | 11.56 | |
| 4 | 5.785 | WISE | 22.09 |
.
The final column in Table 3 gives absolute fluxes for the central star, converted from the magnitudes in column 2 using the zero-points referenced in the table footnotes. These fluxes are plotted against wavelength as filled circles in Figure 2, color-coded as indicated in the figure legend. We also plot our calibrated HET spectrum as an orange line.
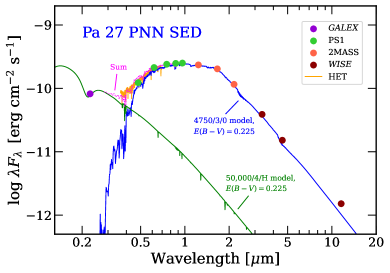
The SED clearly shows an excess in the near-UV, confirming the presence of two stars in the system. In order to estimate the parameters of the cool component, we compared the SED with synthetic model-atmosphere spectra computed using ATLAS9 (Castelli & Kurucz, 2003), which are conveniently available online at the Spanish Virtual Observatory (SVO) website.171717http://svo2.cab.inta-csic.es/theory/newov2 Based on the known absolute magnitude, we assumed . We applied a reddening of (see Section 3) to each theoretical spectrum, using the formulation of Cardelli et al. (1989), and then scaled it to the observed flux level. The best fit to the SED points longward of about 7000 Å was obtained for a model with parameters K, , and . These are consistent with the K0 III spectral type derived in the previous section. The SED of this reddened theoretical model is plotted as a blue line in Figure 2.
The 4750 K cool component provides a very good match to the SED points at the band and longward, but the hot companion contributes increasing amounts of flux at shorter wavelengths. Unfortunately, the parameters of the hot star can only be loosely constrained, since we have just the single GALEX point in the near-UV, along with a small blue excess seen at optical wavelengths. We selected several theoretical SEDs for hot stars computed with the Tübingen Model-Atmosphere Package (TMAP; Werner et al., 2003), which are available at the SVO website cited above. Given the strong Balmer lines in the optical spectrum, we considered pure-hydrogen models, and we assumed based on typical post-asymptotic-giant-branch (post-AGB) evolutionary tracks (see, e.g., Figure 7 in our Paper II). We then applied a reddening of , and scaled each TMAP SED to match the GALEX near-UV point. We obtained a reasonable match with a K model, shown as the green line in Figure 2. The magenta dotted line shows the sum of the two theoretical SEDs. This sum provides a good match to the HET spectrum and the photometric points shortward of the band, and explains the dilution of the K0 spectrum in the bottom panel of Figure 1. However, our adopted nominal temperature for the hot component must be considered as only approximate.
7 Photometric Variability
The nucleus of Pa 27 was found to be a periodic variable star by the Asteroid Terrestrial-impact Last Alert System (ATLAS; Heinze et al., 2018), designated ATO J312.2432+32.3041. It is described181818See the ATLAS variable-star catalog at https://vizier.cds.unistra.fr/viz-bin/VizieR?-source=J/AJ/156/241 as having sine-wave variability with a period of 7.365430 days and a peak-to-peak range of 0.09 mag in a “cyan” filter and 0.10 mag in an “orange” filter. Very similar results are given by the All-Sky Automated Survey for Supernovae (ASAS-SN; Shappee et al., 2014; Kochanek et al., 2017), whose catalog191919https://asas-sn.osu.edu designates the object as ASASSN-V J204858.33+321814.7. ASAS-SN classifies the star as a “rotational” variable, i.e., a rotating spotted star. The period was found to be 7.3677381 days, with a -band peak-to-peak amplitude of 0.10 mag.
We obtained aperture photometry of the central star from the Transiting Exoplanet Survey Satellite (TESS) mission, using the online TESSExtractor tool202020https://www.tessextractor.app (Serna et al., 2021). TESS monitors sky “Sectors” for continuous durations of 27 days. The location of Pa 27 has been observed by TESS during the Sector 15 run (30-minute cadence), and the Sectors 41 and 55 runs (10-minute cadences). We edited the TESSExtractor downloads to remove data affected by bright background and other instrumental effects. We determined eight times of maximum light, over an interval of 1097 days, by fitting parabolas to the light-curve peaks, and calculated a linear fit to these times. The derived ephemeris is
The TESS light curves, phased to this ephemeris, are plotted in Figure 3. The curves are nearly perfect sine waves, with peak-to-peak amplitudes averaging 0.045 mag in the broadband TESS photometric system.
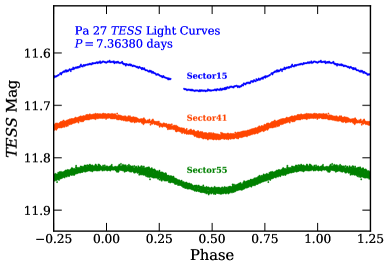
We attribute the variability of Pa 27 to dark starspots on its rotating K-type red giant. In principle, a sinusoidal light curve of the cool component could alternatively be due to a close binary with a heated hemisphere producing one light maximum per orbital period, or to ellipsoidal variations in a system with twice the period given above. However, at least two arguments support the rotational interpretation. (1) A well-established class of rotationally variable late-type PNNi, with UV-bright hot companions, exists (see next section). (2) The phases and amplitudes of variation in Pa 27 change with time. First, the times of maximum light in TESS Sector 41 are slightly earlier in phase than in the other two TESS runs. Second, the peak-to-peak amplitudes for the three individual high-precision TESS runs are slightly variable, at 0.056, 0.040, and 0.044 mag, respectively. More dramatically, the amplitudes seen at the epochs of the TESS observations are less than half that seen at earlier epochs in the orange filter of ATLAS. The orange bandpass has a similar effective wavelength to that of TESS. These time-variable behaviors would not occur due to thermal or geometric effects in a close binary, but are consistent with starspots that vary in both location on the star, and in the amount of coverage of the stellar surface.
As a check on this interpretation, we estimated the radius of the star, using an absolute magnitude of (Section 3) and an ATLAS9 bolometric correction of 0.48 mag, yielding . For a rotation period of 7.3638 days, we find an equatorial rotational velocity of . This is consistent with the Gaia line broadening measurement of from Table 1, given that the inclination angle is unknown.
8 Pa 27 as an Abell 35-type Planetary Nucleus
To summarize the above results, the central star of the PN Pa 27 is a binary system composed of a K0 III red giant, accompanied by an unresolved UV-bright hot companion with an effective temperature of roughly 50,000 K. The starspotted K star has rotationally broadened spectral lines, and is a low-amplitude variable with a photometric period of 7.36 days.
These findings show that Pa 27 belongs to a small class of PNNi for which the name “Abell 35-type central stars” was proposed by Bond et al. (1993). These objects are binary nuclei of PNe consisting of a rotating and spotted late-type star and a hot companion. Bond et al. (1993) listed the three members of the class known at that time: Abell 35, LoTr 1, and LoTr 5, along with a field star with similar properties, HD 128220.
A physical explanation for Abell 35-type nuclei was proposed by Jeffries & Stevens (1996, hereafter JS96): they arise in a situation where an AGB star ejects a dense wind, part of which is captured by a moderately distant companion star. The companion accretes material and angular momentum from the wind, spinning up its rotation. The remnant core of the AGB star is now an UV-bright hot white dwarf or pre-white dwarf. JS96 describe the spun-up cool companions as “wind-accretion induced, rapidly rotating stars (or WIRRing stars).” Their calculations suggest that the spin-ups can occur in binaries with separations as large as 100 AU.
In this picture, rotation drives magnetic surface activity on the late-type star, creating extensive starspots and hence photometric variations at the spin period. The periods of the light variations are much shorter than the orbital periods of the binaries.
The prototypical system, Abell 35 itself, was found to have a nucleus212121Several authors (e.g., Frew & Parker, 2010; Ziegler et al., 2012) have argued that the Abell 35 nebula is actually not a true PN, but is instead a “PN mimic,” created when a hot star passes through and photoionizes an overdense region of the interstellar medium. with a late-type (G8 III-IV) spectrum by Jacoby (1981). Periodic light variations due to rotation of the star were discovered by Jasniewicz & Acker (1988). UV observations reveal a hot companion (Herald & Bianchi, 2002, and references therein). To our knowledge, the orbital period of the binary remains unknown, but it is longer than at least several decades (e.g., Gatti et al., 1998).
JS96 predicted that accretion of processed material from the AGB wind could create overabundances of carbon and -process elements on the WIRRing companion. This prediction was borne out by the discovery by Bond et al. (2003) of a barium star—a cool red giant with overabundances of carbon and -process elements—at the center of the PN WeBo 1. The nucleus of WeBo 1, at optical wavelengths, is a late-type star with photometric variability at a period of 4.7 days. Its hot companion is detected in the UV (Siegel et al., 2012). Another barium-star PNN, that of Abell 70, was discovered by Miszalski et al. (2012); it too is a photometric variable, at a period of 2.06 days, with a changing amplitude (Bond & Ciardullo, 2018; Jones et al., 2022).
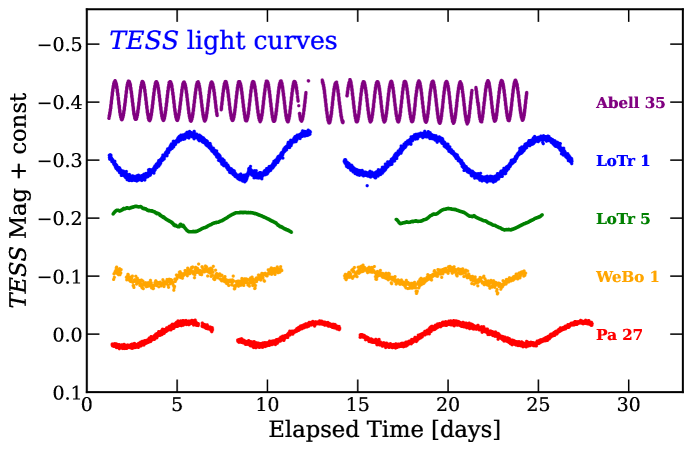
The system of LoTr 1 is remarkably similar to Pa 27, with a nearly identical absolute magnitude of . It was studied in detail by Tyndall et al. (2013), who show that its central star is a binary containing a K1 III giant and a hot companion, showing photometric variations with a period of 6.4 days. Its orbital period is as yet unknown. The central star of the PN LoTr 5 is still another case of a rapidly rotating G-type star and a UV-bright companion. It has a photometric period of 5.95 days, but in this case the orbital period of the binary has been established to be about 2700 days (Aller et al., 2018, and references therein). Lastly, the central star of the PN Hen 2-39 is a late-type barium star, again with a hot companion (Löbling et al., 2019). It is a photometric variable with a period of 5.46 days (Miszalski et al., 2013).
We used TESSExtractor to obtain TESS light curves of the relatively bright central stars of Abell 35, LoTr 1, LoTr 5, and WeBo 1.222222Unfortunately, the central stars of Abell 70 and Hen 2-39 are too faint and/or crowded for useful TESS photometry. We downloaded single sector runs for each of these targets, and they are compared with a single run on Pa 27 in Figure 4. Remarkably, all five objects show almost pure sinusoidal variations, but with a range of timescales from 0.77 days for Abell 35 to 7.36 days for Pa 27. The photometric amplitudes are similar as well.
9 Future Studies
The main purpose of this paper is to encourage further studies of the central star of Pa 27, a new member of the Abell 35 class of binary systems. Radial-velocity (RV) monitoring could establish the orbital period of the binary, which is likely to be much longer than the 7.36-day spin period of the cool component. Our three HET spectra do not provide useful information on this question. However, Gaia DR3 indicates a peak-to-peak range of in its RV, so binary motion has been detected. Unfortunately, at this writing, the individual Gaia RVs are not publicly available.
UV spectra could provide constraints on the nature of the hot pre-white-dwarf companion.
An abundance-analysis study of this relatively bright star would be of interest. We see no gross evidence for enhancements of carbon and -process elements like strontium and barium in our spectra, but a study at higher resolution and signal-to-noise would be more informative.
References
- Aller et al. (2018) Aller, A., Lillo-Box, J., Vučković, M., et al. 2018, MNRAS, 476, 1140
- Argue (1963) Argue, A. N. 1963, MNRAS, 125, 557
- Bailer-Jones et al. (2021) Bailer-Jones, C. A. L., Rybizki, J., Fouesneau, M., Demleitner, M., & Andrae, R. 2021, AJ, 161, 147
- Bojičić et al. (2017) Bojičić, I. S., Parker, Q. A., & Frew, D. J. 2017, in Planetary Nebulae: Multi-Wavelength Probes of Stellar and Galactic Evolution, ed. X. Liu, L. Stanghellini, & A. Karakas, Vol. 323, 327–328
- Bond & Ciardullo (2018) Bond, H. E., & Ciardullo, R. 2018, Research Notes of the American Astronomical Society, 2, 143
- Bond et al. (1993) Bond, H. E., Ciardullo, R., & Meakes, M. G. 1993, in Planetary Nebulae, ed. R. Weinberger & A. Acker, Vol. 155, 397
- Bond et al. (2003) Bond, H. E., Pollacco, D. L., & Webbink, R. F. 2003, AJ, 125, 260
- Bond et al. (2023a) Bond, H. E., Werner, K., Jacoby, G. H., & Zeimann, G. R. 2023a, MNRAS, 521, 668, (Paper I)
- Bond et al. (2023b) Bond, H. E., Werner, K., Zeimann, G. R., & Talbot, J. 2023b, MNRAS, 523, 3699, (Paper II)
- Capitanio et al. (2017) Capitanio, L., Lallement, R., Vergely, J. L., Elyajouri, M., & Monreal-Ibero, A. 2017, A&A, 606, A65
- Cardelli et al. (1989) Cardelli, J. A., Clayton, G. C., & Mathis, J. S. 1989, ApJ, 345, 245
- Castelli & Kurucz (2003) Castelli, F., & Kurucz, R. L. 2003, in Modelling of Stellar Atmospheres, ed. N. Piskunov, W. W. Weiss, & D. F. Gray, Vol. 210, A20
- Chonis et al. (2016) Chonis, T. S., Hill, G. J., Lee, H., et al. 2016, in Society of Photo-Optical Instrumentation Engineers (SPIE) Conference Series, Vol. 9908, Ground-based and Airborne Instrumentation for Astronomy VI, ed. C. J. Evans, L. Simard, & H. Takami, 99084C
- Falcón-Barroso et al. (2011) Falcón-Barroso, J., Sánchez-Blázquez, P., Vazdekis, A., et al. 2011, A&A, 532, A95
- Frew & Parker (2010) Frew, D. J., & Parker, Q. A. 2010, PASA, 27, 129
- Gaia Collaboration et al. (2016) Gaia Collaboration, Prusti, T., de Bruijne, J. H. J., et al. 2016, A&A, 595, A1
- Gaia Collaboration et al. (2023) Gaia Collaboration, Vallenari, A., Brown, A. G. A., et al. 2023, A&A, 674, A1
- Gatti et al. (1998) Gatti, A. A., Drew, J. E., Oudmaijer, R. D., Marsh, T. R., & Lynas-Gray, A. E. 1998, MNRAS, 301, L33
- Heinze et al. (2018) Heinze, A. N., Tonry, J. L., Denneau, L., et al. 2018, AJ, 156, 241
- Herald & Bianchi (2002) Herald, J. E., & Bianchi, L. 2002, ApJ, 580, 434
- Hill et al. (2021) Hill, G. J., Lee, H., MacQueen, P. J., et al. 2021, AJ, 162, 298
- Jacoby (1981) Jacoby, G. H. 1981, ApJ, 244, 903
- Jasniewicz & Acker (1988) Jasniewicz, G., & Acker, A. 1988, A&A, 189, L7
- Jeffries & Stevens (1996) Jeffries, R. D., & Stevens, I. R. 1996, MNRAS, 279, 180, (JS96)
- Jones et al. (2022) Jones, D., Boffin, H. M. J., Brown, A. J., et al. 2022, MNRAS, 516, 4833
- Kaiser et al. (2010) Kaiser, N., Burgett, W., Chambers, K., et al. 2010, in Society of Photo-Optical Instrumentation Engineers (SPIE) Conference Series, Vol. 7733, Ground-based and Airborne Telescopes III, ed. L. M. Stepp, R. Gilmozzi, & H. J. Hall, 77330E
- Kochanek et al. (2017) Kochanek, C. S., Shappee, B. J., Stanek, K. Z., et al. 2017, PASP, 129, 104502
- Kronberger et al. (2014) Kronberger, M., Jacoby, G. H., Acker, A., et al. 2014, in Asymmetrical Planetary Nebulae VI Conference, ed. C. Morisset, G. Delgado-Inglada, & S. Torres-Peimbert, 48
- Kwitter & Henry (2022) Kwitter, K. B., & Henry, R. B. C. 2022, PASP, 134, 022001
- Löbling et al. (2019) Löbling, L., Boffin, H. M. J., & Jones, D. 2019, A&A, 624, A1
- Miszalski et al. (2012) Miszalski, B., Boffin, H. M. J., Frew, D. J., et al. 2012, MNRAS, 419, 39
- Miszalski et al. (2013) Miszalski, B., Mikołajewska, J., & Udalski, A. 2013, MNRAS, 432, 3186
- Parker et al. (2016) Parker, Q. A., Bojičić, I. S., & Frew, D. J. 2016, in Journal of Physics Conference Series, Vol. 728, Journal of Physics Conference Series, 032008
- Ramsey et al. (1998) Ramsey, L. W., Adams, M. T., Barnes, T. G., et al. 1998, in Society of Photo-Optical Instrumentation Engineers (SPIE) Conference Series, Vol. 3352, Advanced Technology Optical/IR Telescopes VI, ed. L. M. Stepp, 34–42
- Serna et al. (2021) Serna, J., Hernandez, J., Kounkel, M., et al. 2021, ApJ, 923, 177
- Shappee et al. (2014) Shappee, B. J., Prieto, J. L., Grupe, D., et al. 2014, ApJ, 788, 48
- Shetrone et al. (2007) Shetrone, M., Cornell, M. E., Fowler, J. R., et al. 2007, PASP, 119, 556
- Siegel et al. (2012) Siegel, M. H., Hoversten, E., Bond, H. E., Stark, M., & Breeveld, A. A. 2012, AJ, 144, 65
- Skrutskie et al. (2006) Skrutskie, M. F., Cutri, R. M., Stiening, R., et al. 2006, AJ, 131, 1163
- Tonry et al. (2012) Tonry, J. L., Stubbs, C. W., Lykke, K. R., et al. 2012, ApJ, 750, 99
- Tyndall et al. (2013) Tyndall, A. A., Jones, D., Boffin, H. M. J., et al. 2013, MNRAS, 436, 2082
- Weidmann et al. (2020) Weidmann, W. A., Mari, M. B., Schmidt, E. O., et al. 2020, A&A, 640, A10
- Werner et al. (2003) Werner, K., Deetjen, J. L., Dreizler, S., et al. 2003, in Astronomical Society of the Pacific Conference Series, Vol. 288, Stellar Atmosphere Modeling, ed. I. Hubeny, D. Mihalas, & K. Werner, 31
- Werner et al. (2024) Werner, K., Todt, H., Bond, H. E., & Zeimann, G. R. 2024, arXiv e-prints, arXiv:2402.18976, (Paper III)
- Wright et al. (2010) Wright, E. L., Eisenhardt, P. R. M., Mainzer, A. K., et al. 2010, AJ, 140, 1868
- Ziegler et al. (2012) Ziegler, M., Rauch, T., Werner, K., Köppen, J., & Kruk, J. W. 2012, A&A, 548, A109