A correlation between hard X-rays and neutrinos in radio-loud and radio-quiet AGN
Abstract
The production mechanism of astrophysical high-energy neutrinos is not yet understood. A common assumption is that beamed relativistic outflows (jets) driven by accreting black holes are needed to accelerate particles to such high energies to produce high-energy neutrinos. Indeed, the first astrophysical high-energy neutrino source candidate identified by IceCube at a significance level of was a blazar—an AGN with an accreting supermassive black hole that drives a relativistic jet directed towards Earth. Recently, IceCube discovered strong evidence that Seyfert galaxies also emit neutrinos, which appears unrelated to jet activity. Here, we show that the neutrino–hard X-ray flux ratio of the blazar TXS 0506+056 is consistent with neutrino production in a -obscured region near the central supermassive black hole, with the X-ray flux corresponding to reprocessed -ray emission with flux comparable to that of neutrinos. Similar neutrino–hard X-ray flux ratios were found for three of IceCube’s Seyfert galaxies, raising the possibility of a common neutrino production mechanism that may not involve a strong jet. We examine how future observations could test the jet origin of blazar neutrinos.
1 Introduction
The IceCube Neutrino Observatory has already made a series of transformational discoveries. These include a quasi-diffuse flux of cosmic neutrinos of so-far unknown origin (Aartsen et al., 2013), as well as a growing number of individual astrophysical sites with associated neutrino emission.
The first individual neutrino source identified at significance was the blazar TXS 0506+056 (IceCube Collaboration et al., 2018). Blazars are a special class of active galactic nuclei (AGN) that are extremely luminous and drive relativistic jets that point directly towards Earth, outshining the intrinsic electromagnetic spectrum of the host galaxy. Relativistic jets can be sources of high-energy neutrinos if protons accelerated in the jet undergo or interactions (see e.g. Mannheim et al. 1992; Becker et al. 2005; Becker 2008; Becker Tjus et al. 2014). For neutrino production, external material is needed (e.g. a cloud wandering through the jet; Araudo et al., 2010) as the jet itself generally has too low particle density. Structured jets on the other hand might supply enough particles for the production of the extragalactic high-energy neutrinos ( TeV, e.g. Tavecchio & Ghisellini, 2015).
The second neutrino source identified with high confidence was the Seyfert galaxy NGC 1068 (Abbasi et al., 2022a). Seyfert galaxies are radio-quiet AGN with much weaker outflows compared to radio-loud AGNs. Hard X-rays from Seyfert galaxies are most likely produced in the corona, while in blazars their production site is not clear.
Subsequently, additional astrophysical sources have been associated with neutrino emission. These included two blazars (PKS 1502+106, Taboada & Stein 2019; PKS 142441, Kadler et al. 2016) and other two Seyfert AGN (NGC 4151, NGC 3079; Goswami, 2023; Neronov et al., 2023). Based on the likelihood analysis of eight years of IceCube data, Abbasi et al. (2022b) searched high-energy neutrinos in the cores of AGN assuming the neutrino emission is proportional to the accretion disk luminosity estimated from the soft X-ray flux. They found the high-energy neutrino signal from such sources on the top of the background at a post-trial significance level of . The observed non-blazar AGN are at least a factor of 3 fainter in -rays than their neutrino flux at the same energy. This is rather unexpected, since interacting relativistic particles produce comparable fluxes of neutrinos and -rays. This apparent underproduction of -rays is true in a similar way for the observed diffuse neutrino flux (Murase et al., 2016, 2020a) and even blazars show evidence for -ray absorption during neutrino emission (Kun et al., 2021).
This problem can only be solved if the environment in which neutrinos are produced is opaque to high-energy photons, e.g. via – interactions. However, this is typically not the case for blazars, which are observed to be bright -ray sources (Kun et al., 2021). The only high-significance multi-messenger observation was the optical flash that happened two hours after the neutrino event IC-170922A (Lipunov et al., 2020). Such an optical flash can be attributed to changes associated with the accretion disk/central black hole, possibly resulting in the temporary -opaqueness of the jet that drives neutrino emission while suppressing emission (Kun et al., 2021).
A third potential class of astrophysical sources—tidal disruption events (TDEs)—has also been hinted to be associated with high-energy neutrino production. Following up IceCube’s neutrinos as triggers, the Zwicky Transient Facility identified two TDEs spatially and temporally coincident with the neutrino signal (Stein et al., 2021; Reusch et al., 2022). Radio follow-up monitoring of one of these TDEs, AT2019dsg, did not find a clear evidence of relativistic jets launched by the TDE (Cendes et al., 2021). This could suggest that neutrino emission from (at least some) TDEs does not require the presence of relativistic outflows (Murase et al., 2020b; Winter & Lunardini, 2023; Yuan & Winter, 2023).
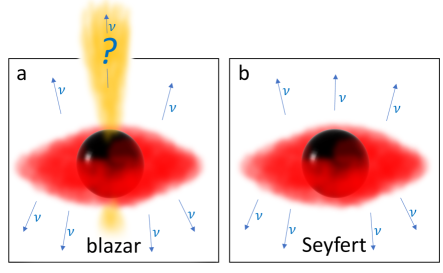
Remarkably, the two main potential classes of neutrino sources—blazars, Seyferts—are in essence similar astrophysical sites: accreting supermassive black holes (illustrated in Fig. 1). The detected Seyfert sources did not appear to drive powerful relativistic jets, suggesting that their neutrino emission is unrelated to jets. This raises the question of whether in the other source class—blazars—neutrino emission is also unrelated to jets.
-attenuation observed in the case of neutrino-emitting AGN provides a possibility to probe the neutrino production site through multi-messenger observations. High-energy proton interactions produce neutrinos and -rays with comparable flux and energy spectra. Assuming neutrino production happens near the central black hole, infrared-optical emission from the accretion disk and X-ray emission from the hot corona interact with high-energy photons and, through pair-production, convert the high-energy -ray flux to MeV photons (Murase et al., 2020a; Inoue et al., 2020; Eichmann et al., 2022; Neronov et al., 2023). Consequently, hard X-ray – (so far not observed) MeV emission produced by this reprocessing should have comparable flux to that of high-energy neutrinos. The linear scaling between the hard X-ray and neutrino fluxes for radio-quiet AGN was already suggested by Murase & Waxman (2016), who computed the typical source density based on this scaling. Also, based on this linear scaling, Murase et al. (2020a) listed the brightest neutrino source candidate AGN based on the brightest X-ray objects in the 2–10 keV band, including NGC 1068. AGNs NGC 1068, NGC 3079 ( Koss et al., 2022) and NGC 4151 were indeed suggested to have comparable intrinsic hard X-ray (15–195 keV range) and all-flavor neutrino fluxes (Neronov et al., 2023).
2 Hard X-ray and neutrino fluxes
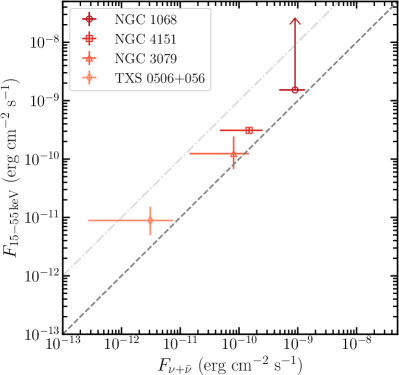
The linear scaling of the hard X-ray and neutrino fluxes (Murase & Waxman, 2016; Murase et al., 2020a), expected for -obscured sources, was suggested for three Seyfert galaxies by comparing their estimated 15 keV–195 keV intrinsic hard X-ray flux and observed 0.3 TeV–100 TeV all flavor neutrino flux (observed by IceCube; see Neronov et al. 2023 and Fig. 2). However, the hard X-ray fluxes estimated by Neronov et al. (2023) rely on an a somewhat unrealistic assumption of a power-law spectrum extending from soft X-rays up to hard X-rays with a fixed spectral index. For this reason, we re-built this correlation using reliable fluxes, and then extended this comparison to blazar TXS 0506+056 (, Paiano et al., 2018), which is the only blazar with neutrino flux identified with confidence.
Regarding the X-ray fluxes of AGN, these can be affected by several processes. In general, X-rays will travel through a diffuse medium in the host galaxy and then in the Milky Way. The column density depends on the properties of the host galaxy and the source direction. For low column densities () the only relevant interaction is photoelectric absorption, which has an energy-dependent cross-section that is higher at lower energies. Values of affect only soft X-rays ( keV), so that the emission above a few keV is not affected by photoelectric absorption. The other relevant channel of interaction is Compton scattering, that is the dominant absorption effect in the case of heavily obscured AGN cores embedded in a dusty torus (, e.g. in Marchesi et al., 2018).
We corroborate that the X-ray absorption in the Galactic interstellar medium is smaller than the intrinsic absorption of the for AGNs in the sample. For the four AGN we corroborate that its effect is significantly smaller than the intrinsic absorption, the Galactic hydrogen column density being for NGC 1068, for NGC 3079, for NGC 4151 and for TXS 0506+056 (Dickey & Lockman, 1990; Kalberla et al., 2005; HI4PI Collaboration et al., 2016)111https://heasarc.gsfc.nasa.gov/cgi-bin/Tools/w3nh/w3nh.pl.
2.1 Hard X-ray flux of the Seyferts: NGC 1068, NGC 3079 and NGC 4151
In Neronov et al. (2023), the hard X-ray flux of NGC 1068 in the 15–195 keV energy range was calculated by extrapolating its 2–10 keV flux assuming a power-law photon spectrum. However, the spectrum of NGC 1068 hardens between soft and hard X-rays (e.g Fig. 4 of Abbasi et al., 2022a). Instead, we took the 15–55 keV Nuclear Spectroscopic Telescope Array (NuSTAR, Harrison et al. (2013)) observed fluxes from Marchesi et al. (2018), who published the X-ray analysis of Compton-thick AGN using Swift, XMM-Newton, and NuSTAR observations. They found the observed hard X-ray fluxes as erg s-1 cm-2 for NGC 1068 and erg s-1 cm-2 for NGC 3079.
Near IR–radio studies based on SED modelings find the inclination of the obscuring dust torus of NGC 1068 ranging between and , where means edge-on configuration (e.g. Hönig et al., 2008; Lopez-Rodriguez et al., 2018; GRAVITY Collaboration et al., 2020). This translates in high line-of-sight column density and high Compton thickness at hard X-rays; this is supported by modeling results (Bauer et al., 2015; Marinucci et al., 2015; Marchesi et al., 2018). Marinucci et al. (2015) found the transient NuSTAR flux excess observed in 2014 can be best explained by a temporary decrease in the column density of the obscuring material along the line-of-sight from in 2012/2015 to in 2014. Since the neutrino signal is generally weak and we cannot measure it in observational windows as short as the hard X-ray observations, we use the above result for as a range for the column density of the hard X-ray absorber to accommodate possible variability throughout the neutrino observations of 10 years.
For NGC 3079, assuming an edge-on configuration, Marchesi et al. (2018) favors a value of for (along the line-of-sight), which is in agreement with the value suggested by Georgantopoulos & Akylas (2019), also relying on NuSTAR observations. We combine the two results to get the range for the column density of the observer as .
In the case of NGC 4151 (, Koss et al., 2022), the favored in-source column density is – (e.g. Pedlar et al., 1992; Zoghbi et al., 2019), or even smaller. Gianolli et al. (2023) gives the parameters for the Comptonized primary continuum of NGC 4151; we retrieved the 15–55 keV flux by loading in XSPEC the nthcomp model with their fitted parameters, obtaining an intrinsic flux of erg s-1 cm-2.
In the most simplistic scenario, the intrinsic X-ray flux can be approximated as , where is the optical depth for Compton scattering. Although at lower energies a simple exponential absorption approximation significantly deviates from the complicated absorption model adopted by e.g. the MYTorus model, at higher energies this discrepancy is well within one order of magnitude for various torus orientations, even for high column densities (see e.g. Fig. 16 of Mori et al., 2015). Using the above numbers for the observed hard X-ray fluxes and line-of-sight column densities, the intrinsic hard X-ray flux emerges as : erg s-1 cm-2 for NGC 1068, erg s-1 cm-2 for NGC 3079.
2.2 Hard X-ray flux of the blazar TXS 0506+056
| ObsID | Date | Exposure | |
|---|---|---|---|
| (ks) | ( erg s-1 cm-2) | ||
| 60502053002 | 2019-07-30 | 17.4 | |
| 60502053004 | 2019-09-29 | 25.9 | |
| 60502053006 | 2019-11-29 | 17.7 | |
| 60502053008 | 2020-01-26 | 15.1 | |
| 60502053010 | 2020-03-25 | 20.8 | |
| Exposure-weighted flux | |||
Note. — We analyzed all the available 18 NuSTAR observations to choose the above 5 observations of our interest. See §2.2 for details.
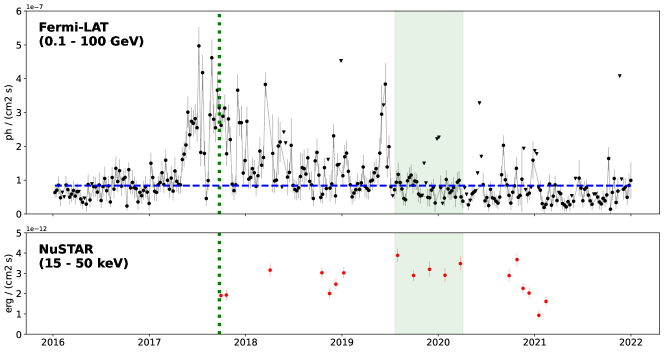
As a broadband (3–79 keV) focused (FWHM ) hard X-ray space telescope, NuSTAR has been providing unique opportunities to study extreme phenomena of AGNs in the X-ray band including TXS 0506+056. We analyzed all available NuSTAR data of TXS 0506+056, consisting of 18 observations between 2017 and 2021 with a total exposure of 371 ks. We processed the data using NuSTAR Data Analysis Software (NuSTARDAS v2.1.2) and CALDB 20230718. We generated cleaned data products using nupipeline task with saamode=strict and tentacle=yes flags. Source (background) spectra were extracted from a circular region with radius (annular region with radius ) centered at TXS 0506+056. The source is bright over the background in 3 to keV for all observations. We modeled the spectra from each observation separately with an absorbed power law (tbabs*pow) in XSPEC (Arnaud, 1996) using the Galactic hydrogen column density222https://www.swift.ac.uk/analysis/nhtot/index.php ( cm-2) and the abundance table from Wilms et al. (2000) (abund wilm). While the model provides a good fit to the spectra, the power law index varies between 1.5 – 1.9 among observations. We created a hard X-ray light curve using the 15 – 50 keV flux of each observation (Fig. 3 bottom panel). The source is variable in the hard X-ray roughly within a factor of as reported in Acciari et al. (2022).
To probe the hard X-ray emission from the -obscured region, i.e. during the low- state of the blazar TXS 0506+056, we analyzed the gamma-ray light curve in 0.1 – 100 GeV333https://fermi.gsfc.nasa.gov/ssc/data/access/lat/LightCurveRepository/ (Abdollahi et al., 2023) from the Large Area Telescope onboard the Fermi Gamma-Ray Space Telescope (Fermi-LAT, Atwood et al. (2009)). The gamma-ray light curve (Fig. 3 top panel) is compared with the hard X-ray light curve. In 2017 – 2021, TXS 0506+056 exhibited frequent gamma-ray flux increase above the average photon flux of photons s-1 cm-2 (calculated from the entire Fermi-LAT lifetime, i.e. August 2008 – March 2024). Most of the NuSTAR observations took place during those -high state except for the 5 observations within the time window marked with the shaded green region in Fig. 3. During this time window, the hard X-ray flux is much more stable than at other epochs. The gamma-ray flux remained low consistent with the overall average flux. We calculated the exposure-weighted flux and error using these five observations to compare with the neutrino flux. The average hard X-ray flux in 15–50 keV during the low- state of TXS 0506+056 yielded erg s-1 cm-2. The observations used for this calculation are listed in Table 1. The result of our analysis of the 18 available NuSTAR observations is consistent with the results reported in IceCube Collaboration et al. (2018); Acciari et al. (2022); Jin et al. (2021).
Since the column density of the central region of TXS 0506+056 should be as high as , (e.g. Liu et al., 2019), but with relatively low expected value for the Galactic column density (HI4PI Collaboration et al., 2016), we transformed the observed flux back to its intrinsic value setting . Then the intrinsic hard X-ray flux becomes erg s-1 cm-2 using the estimation of the observed flux as described above in the NuSTAR epochs.
2.3 High-energy neutrino fluxes
For the three Seyfert galaxies, we assumed the high-energy neutrino fluxes reported by Neronov et al. (2023). For TXS 0506+056, we estimated the all-flavor neutrino flux between 0.3 TeV and 100 TeV based on the 10-year time-integrated all-flavor neutrino SED in Abbasi et al. (2022a). We assumed a power-law spectral shape:
| (1) |
where is a normalization factor and is the spectral index. We derived from Fig. 5 of Abbasi et al. (2022a), that led to and . Then we calculated the neutrino flux as
| (2) |
where TeV and TeV. We estimated the relative error of the resulted flux considering the 68% confidence interval at the 100 TeV energy in Fig. 5 of Abbasi et al. (2022a). The all flavor neutrino flux of TXS 0506+056 between 0.3 TeV and 100 TeV is erg s-1 cm-2 between 0.3 TeV and 100 TeV, with lower and upper limits of erg s-1 cm-2 and erg s-1 cm-2, respectively.
2.4 -obscured neutrino sources
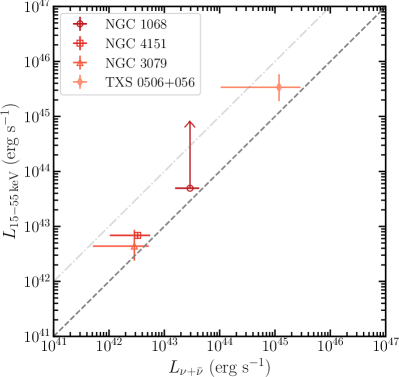
We show our results in the left side of Fig. 2, where one can see a possible correlation between the hard X-ray and neutrino fluxes of the three Seyfert galaxies and the one blazar in our AGN sample. We also show the plot in the luminosity plane with , , , in a CDM cosmology. The Pearson correlation-index between the logarithm of fluxes emerges as 0.989 (p-value 0.01). Though the small number of elements in the sample prevents deeper investigations, this correlation index can be considered as indicative of a positive correlation between the neutrino and hard X-ray fluxes.
Comparable hard X-ray and neutrino fluxes for blazar TXS 0506+056 and three Seyfert galaxies suggests that neutrino production happens in -obscured regions for each of these sources. This is expected if neutrino production happens near AGNs. Consider the case of protons accelerated near the black hole or in the accretion disk, interacting with a target photon field of characteristic size centered on the black hole. In this “corona” region, which has large densities in both X-rays and accreting matter, the opacity to accelerated protons444The opacity is actually the energy-loss length and should be replaced by whenever it is large (Halzen, 2022). is
| (3) |
which is determined by how many times the proton interacts in a target of size given its interaction length ; is inelasticity, or the fraction of the energy the proton loses with each interaction. The interaction length is determined by the density of target photons and the interaction cross section 555For the simple dimensional analysis in this section we use the following cross sections , , and ..
The opacity of the target to the photons produced along with the neutrinos is given by
| (4) |
and therefore, approximately, the two opacities are related by their cross sections
| (5) |
for 666There is an additional factor associated with the different thresholds of the two interactions; see Svensson (1987).. A target that produces neutrinos with will not be transparent to the pionic -rays, which will lose energy in the target even before propagating in the EBL.
The arguments about the high optical depth of AGN environments favoring neutrino production are valid only for relativistic sources. It has been shown by Murase (2022) that the linear scaling between and in Seyfert/low-luminosity (LL) AGN systems holds while is longer than , where is the emission radius, is the characteristic velocity, and is the speed of light in the medium (see their Eq. 5 defining the photomeson production optical depth). For non-relativistic sources such as AGN coronae, the optical depth for the photomeson production can be larger by a factor of –.
3 Common origin?
AGNs can produce neutrinos apparently without Earth-pointing relativistic jets (NGC 1068, nonetheless, does produce a jet; e.g., Fang et al. 2023). It is tempting to investigate whether the same mechanism, i.e. one that does not require a jet pointing towards Earth, could be behind neutrino emission in blazars such as TXS 0506+056. How could we tell?
One possible clue can be the MeV photon cutoff energy, and the corresponding electromagnetic energy release in hard X-rays. This naturally arises for neutrino production in the vicinity of an AGN disk due to the present photon flux there from the disk and the corona. A possible jet origin of the TXS 0506+056 neutrinos further away from the AGN disk would also need to account for this MeV energy cutoff. The observed hard X-ray flux, at least in the active phase of TXS 0506+056, can be well described by combined leptonic+hadronic emission, but with a predicted flux that increases monotonically for higher energies (Gao et al., 2019). While observations are currently not sufficiently sensitive to probe the MeV band for TXS 0506+056 that could identify the cutoff energy, the comparable hard X-ray flux to that of the neutrino flux suggests that most of the energy should be released in the sub-MeV band. More detailed analysis of the spectral features in and above the hard X-ray band, could help clarify the picture.
Second, blazars can produce detectable very high-energy (VHE) -rays. For instance, two periods of enhanced VHE -ray emission from TXS 0506+056 were detected by the MAGIC Telescopes between GeV and GeV, one on MJD 58029/58030 (2017 October 3–4), and a second one on MJD 58057 (2017 October 31). The escape of these VHE photons conflicts the apparent -obscure neutrino production that is needed by the comparable hard X-ray and neutrino fluxes.
A possible reconciliation of VHE emission by blazar jets and the jet origin of blazar neutrinos can be the temporal variability of attenuation. Indeed, the hard X-ray NuSTAR observations used in this work were obtained in a low VHE -ray emitting period, a more quiescent phase of TXS 0506+056 (Ansoldi et al., 2018). When the jet is in a VHE-active phase, the Doppler-boosted jet outshines the corona/accretion disk. The correlation between the hard X-ray and high-energy neutrino flux is only apparent in a quiescence phase of blazars. This periodic suppression in jets is also consistent with the observed dip in emission around neutrino observations reported for several blazars (Kun et al., 2021, 2022).
One additional clue may be the relative luminosities of the observed neutrino sources. TXS 0506+056 appears to be 1–2 orders of magnitude brighter than the three Seyfert galaxies considered here (both in neutrinos and hard X-rays; see Fig. 2). A common emission process between blazars and Seyfert AGNs would need to be able to account for this difference based on the properties of the respective AGNs.
Another difference of note is the neutrino spectrum. The 2014–2015 burst of TXS 0506+056 appears to produce neutrino spectrum of (Aartsen et al., 2018). This is in contrast of the steeper spectra of, e.g., NGC 1068 which has a spectrum of (Abbasi et al., 2022a). The reason is possibly that in the case of TXS 0506+056 we are observing high-energy neutrinos produced by interactions (e.g., Stecker & Salamon 1996), while somewhat lower energy neutrinos in NGC 1068 are produced via interactions (e.g., Murase et al. 2020a).
Finally, the emission’s temporal variation of multi-messenger events may help differentiate between a jet and non-jet origin. For example, neutrinos were detected from TXS 0506+056 in effectively two distinct emission episodes, in 2015 and 2017 (Aartsen et al., 2018). While the 2017 detection coincided with a several months-long flare, TXS 0506+056 had low MeV flux during the 2015 emission episode (Aartsen et al., 2018). Radio flux was roughly constant throughout of the 2014/2015 episode, suggesting that changes in the relativistic outflow by itself do not account for the varying neutrino flux. Long-term monitoring in the hard X-ray band would help better understand the underlying change.
Gopal-Krishna & Biermann (2024) pointed out that winds and jets all carry an electric current. If the jets or winds vary with time, and they all do, then the temporal variation of the electric currents produces temporary electric fields. These fields discharge, producing energetic particles with spectra between and for hadrons and and for electrons/positrons, in the Kardashev (Kardashev, 1962) loss limit. This gives a spectral range in synchrotron emission in the range between and , which is widely observed in radio filaments, both Galactic and extragalactic. This can be explained as the action of electric discharges in variable relativistic jets connected to super-massive black holes and stellar mass black holes. This is consistent with the range observed here, suggesting that the effect of variable electric currents may explain the range of spectra in both Seyfert galaxies and blazars.
4 Conclusion
We found that the observed hard X-ray and high-energy neutrino fluxes of blazar TXS 0506+056 are comparable. This is similar to the relation for Seyfert galaxies NGC 1068, NGC 4151 and NGC 3079 (see left panel in Fig. 2). This relation for Seyfert galaxies was initially found by Neronov et al. (2023), but here we recalculate it using hard X-ray flux measurements from NuSTAR observations in the literature.
Our results suggest the following:
-
1.
This comparable flux is consistent with neutrino production in -obscure regions with photons attenuated down to MeV energies.
-
2.
The same astrophysical process might be responsible for neutrino production in blazars and Seyfert AGNs. Photon attenuation to MeV is expected for neutrino production near AGN disks. In this case, neutrino production may not be dominated by jets, even in the case of blazars.
-
3.
Hard X-rays are very promising targets for multi-messenger modeling of AGN in respect of neutrino-source searches.
We caution nonetheless that the comparable X-ray and neutrino fluxes we found are both subject to uncertainties due to, e.g., emission’s spectral uncertainty and possible temporal variations. Challenges include the generally weak and not well time-constrained neutrino signal versus X-ray observation window, the more sophisticated determination of the intrinsic hard X-ray flux, sample size. It will be particularly interesting to determine whether a similar relation holds for other identified sources of high-energy neutrinos, and whether multi-messenger emission and spectral features can be used to distinguish between the disk/corona and jet origins of neutrinos. We encourage deep hard X-ray / soft--ray observations of these sources.
References
- Aartsen et al. (2013) Aartsen, M. G., Abbasi, R., Abdou, Y., et al. 2013, Phys. Rev. Lett., 111, 021103, doi: 10.1103/PhysRevLett.111.021103
- Aartsen et al. (2018) Aartsen, M. G., Ackermann, M., Adams, J., et al. 2018, Science, 361, 147, doi: 10.1126/science.aat2890
- Abbasi et al. (2022a) Abbasi, R., Ackermann, M., Adams, J., et al. 2022a, Science, 378, 538, doi: 10.1126/science.abg3395
- Abbasi et al. (2022b) —. 2022b, Phys. Rev. D, 106, 022005, doi: 10.1103/PhysRevD.106.022005
- Abdollahi et al. (2023) Abdollahi, S., Ajello, M., Baldini, L., et al. 2023, ApJS, 265, 31, doi: 10.3847/1538-4365/acbb6a
- Acciari et al. (2022) Acciari, V. A., Aniello, T., Ansoldi, S., et al. 2022, ApJ, 927, 197, doi: 10.3847/1538-4357/ac531d
- Ansoldi et al. (2018) Ansoldi, S., Antonelli, L. A., Arcaro, C., et al. 2018, ApJ, 863, L10, doi: 10.3847/2041-8213/aad083
- Araudo et al. (2010) Araudo, A. T., Bosch-Ramon, V., & Romero, G. E. 2010, A&A, 522, A97, doi: 10.1051/0004-6361/201014660
- Arnaud (1996) Arnaud, K. A. 1996, in Astronomical Society of the Pacific Conference Series, Vol. 101, Astronomical Data Analysis Software and Systems V, ed. G. H. Jacoby & J. Barnes, 17
- Astropy Collaboration et al. (2013) Astropy Collaboration, Robitaille, T. P., Tollerud, E. J., et al. 2013, A&A, 558, A33, doi: 10.1051/0004-6361/201322068
- Astropy Collaboration et al. (2022) Astropy Collaboration, Price-Whelan, A. M., Lim, P. L., et al. 2022, ApJ, 935, 167, doi: 10.3847/1538-4357/ac7c74
- Atwood et al. (2009) Atwood, W. B., Abdo, A. A., Ackermann, M., et al. 2009, ApJ, 697, 1071, doi: 10.1088/0004-637X/697/2/1071
- Bauer et al. (2015) Bauer, F. E., Arévalo, P., Walton, D. J., et al. 2015, ApJ, 812, 116, doi: 10.1088/0004-637X/812/2/116
- Becker (2008) Becker, J. K. 2008, Phys. Rep., 458, 173, doi: 10.1016/j.physrep.2007.10.006
- Becker et al. (2005) Becker, J. K., Biermann, P. L., & Rhode, W. 2005, Astroparticle Physics, 23, 355, doi: 10.1016/j.astropartphys.2005.02.003
- Becker Tjus et al. (2014) Becker Tjus, J., Eichmann, B., Halzen, F., Kheirandish, A., & Saba, S. M. 2014, Phys. Rev. D, 89, 123005, doi: 10.1103/PhysRevD.89.123005
- Cendes et al. (2021) Cendes, Y., Alexander, K. D., Berger, E., et al. 2021, ApJ, 919, 127, doi: 10.3847/1538-4357/ac110a
- Dickey & Lockman (1990) Dickey, J. M., & Lockman, F. J. 1990, ARA&A, 28, 215, doi: 10.1146/annurev.aa.28.090190.001243
- Eichmann et al. (2022) Eichmann, B., Oikonomou, F., Salvatore, S., Dettmar, R.-J., & Becker Tjus, J. 2022, ApJ, 939, 43, doi: 10.3847/1538-4357/ac9588
- Fang et al. (2023) Fang, K., Lopez Rodriguez, E., Halzen, F., & Gallagher, J. S. 2023, ApJ, 956, 8, doi: 10.3847/1538-4357/acee70
- Gao et al. (2019) Gao, S., Fedynitch, A., Winter, W., & Pohl, M. 2019, Nature Astronomy, 3, 88, doi: 10.1038/s41550-018-0610-1
- Georgantopoulos & Akylas (2019) Georgantopoulos, I., & Akylas, A. 2019, A&A, 621, A28, doi: 10.1051/0004-6361/201833038
- Gianolli et al. (2023) Gianolli, V. E., Kim, D. E., Bianchi, S., et al. 2023, MNRAS, 523, 4468, doi: 10.1093/mnras/stad1697
- Gopal-Krishna & Biermann (2024) Gopal-Krishna, & Biermann, P. L. 2024, MNRAS, 529, L135, doi: 10.1093/mnrasl/slad191
- Goswami (2023) Goswami, S. 2023, arXiv e-prints, arXiv:2307.15349, doi: 10.48550/arXiv.2307.15349
- GRAVITY Collaboration et al. (2020) GRAVITY Collaboration, Pfuhl, O., Davies, R., et al. 2020, A&A, 634, A1, doi: 10.1051/0004-6361/201936255
- Halzen (2022) Halzen, F. 2022, International Journal of Modern Physics D, 31, 2230003, doi: 10.1142/S0218271822300038
- Harrison et al. (2013) Harrison, F. A., Craig, W. W., Christensen, F. E., et al. 2013, ApJ, 770, 103, doi: 10.1088/0004-637X/770/2/103
- HI4PI Collaboration et al. (2016) HI4PI Collaboration, Ben Bekhti, N., Flöer, L., et al. 2016, A&A, 594, A116, doi: 10.1051/0004-6361/201629178
- Hönig et al. (2008) Hönig, S. F., Prieto, M. A., & Beckert, T. 2008, A&A, 485, 33, doi: 10.1051/0004-6361:200809606
- IceCube Collaboration et al. (2018) IceCube Collaboration, Fermi-LAT, MAGIC, et al. 2018, Science, 361, 147, doi: 10.1126/science.aat1378
- Inoue et al. (2020) Inoue, Y., Khangulyan, D., & Doi, A. 2020, ApJ, 891, L33, doi: 10.3847/2041-8213/ab7661
- Jin et al. (2021) Jin, W., Sharpe, R., Capasso, M., et al. 2021, in Proceedings of 37th International Cosmic Ray Conference — PoS(ICRC2021), ICRC2021 (Sissa Medialab), doi: 10.22323/1.395.0945
- Kadler et al. (2016) Kadler, M., Krauß, F., Mannheim, K., et al. 2016, Nature Physics, 12, 807, doi: 10.1038/nphys3715
- Kalberla et al. (2005) Kalberla, P. M. W., Burton, W. B., Hartmann, D., et al. 2005, A&A, 440, 775, doi: 10.1051/0004-6361:20041864
- Kardashev (1962) Kardashev, N. S. 1962, Soviet Ast., 6, 317
- Koss et al. (2022) Koss, M. J., Trakhtenbrot, B., Ricci, C., et al. 2022, ApJS, 261, 6, doi: 10.3847/1538-4365/ac650b
- Kun et al. (2022) Kun, E., Bartos, I., Becker Tjus, J., et al. 2022, ApJ, 934, 180, doi: 10.3847/1538-4357/ac7f3a
- Kun et al. (2021) —. 2021, ApJ, 911, L18, doi: 10.3847/2041-8213/abf1ec
- Lipunov et al. (2020) Lipunov, V. M., et al. 2020, Astrophys. J. Lett., 896, L19, doi: 10.3847/2041-8213/ab96ba
- Liu et al. (2019) Liu, R.-Y., Wang, K., Xue, R., et al. 2019, Phys. Rev. D, 99, 063008, doi: 10.1103/PhysRevD.99.063008
- Lopez-Rodriguez et al. (2018) Lopez-Rodriguez, E., Fuller, L., Alonso-Herrero, A., et al. 2018, ApJ, 859, 99, doi: 10.3847/1538-4357/aabd7b
- Mannheim et al. (1992) Mannheim, K., Stanev, T., & Biermann, P. L. 1992, A&A, 260, L1
- Marchesi et al. (2018) Marchesi, S., Ajello, M., Marcotulli, L., et al. 2018, ApJ, 854, 49, doi: 10.3847/1538-4357/aaa410
- Marinucci et al. (2015) Marinucci, A., Bianchi, S., Matt, G., et al. 2015, MNRAS, 456, L94, doi: 10.1093/mnrasl/slv178
- Mori et al. (2015) Mori, K., Hailey, C. J., Krivonos, R., et al. 2015, The Astrophysical Journal, 814, 94, doi: 10.1088/0004-637X/814/2/94
- Murase (2022) Murase, K. 2022, ApJ, 941, L17, doi: 10.3847/2041-8213/aca53c
- Murase et al. (2016) Murase, K., Guetta, D., & Ahlers, M. 2016, Phys. Rev. Lett., 116, 071101, doi: 10.1103/PhysRevLett.116.071101
- Murase et al. (2020a) Murase, K., Kimura, S. S., & Mészáros, P. 2020a, Phys. Rev. Lett., 125, 011101, doi: 10.1103/PhysRevLett.125.011101
- Murase et al. (2020b) Murase, K., Kimura, S. S., Zhang, B. T., Oikonomou, F., & Petropoulou, M. 2020b, ApJ, 902, 108, doi: 10.3847/1538-4357/abb3c0
- Murase & Waxman (2016) Murase, K., & Waxman, E. 2016, Phys. Rev. D, 94, 103006, doi: 10.1103/PhysRevD.94.103006
- Neronov et al. (2023) Neronov, A., Savchenko, D., & Semikoz, D. V. 2023, arXiv e-prints, arXiv:2306.09018, doi: 10.48550/arXiv.2306.09018
- Paiano et al. (2018) Paiano, S., Falomo, R., Treves, A., & Scarpa, R. 2018, ApJ, 854, L32, doi: 10.3847/2041-8213/aaad5e
- Pedlar et al. (1992) Pedlar, A., Howley, P., Axon, D. J., & Unger, S. W. 1992, MNRAS, 259, 369, doi: 10.1093/mnras/259.2.369
- Reusch et al. (2022) Reusch, S., Stein, R., Kowalski, M., et al. 2022, Phys. Rev. Lett., 128, 221101, doi: 10.1103/PhysRevLett.128.221101
- Stecker & Salamon (1996) Stecker, F. W., & Salamon, M. H. 1996, in TeV Gamma-ray Astrophysics. Theory and Observations, ed. H. J. Voelk & F. A. Aharonian, 341–355
- Stein et al. (2021) Stein, R., van Velzen, S., Kowalski, M., et al. 2021, Nature Astronomy, 5, 510, doi: 10.1038/s41550-020-01295-8
- Svensson (1987) Svensson, R. 1987, MNRAS, 227, 403, doi: 10.1093/mnras/227.2.403
- Taboada & Stein (2019) Taboada, I., & Stein, R. 2019, The Astronomer’s Telegram, 12967, 1
- Tavecchio & Ghisellini (2015) Tavecchio, F., & Ghisellini, G. 2015, MNRAS, 451, 1502, doi: 10.1093/mnras/stv1023
- Wilms et al. (2000) Wilms, J., Allen, A., & McCray, R. 2000, ApJ, 542, 914, doi: 10.1086/317016
- Winter & Lunardini (2023) Winter, W., & Lunardini, C. 2023, ApJ, 948, 42, doi: 10.3847/1538-4357/acbe9e
- Yuan & Winter (2023) Yuan, C., & Winter, W. 2023, ApJ, 956, 30, doi: 10.3847/1538-4357/acf615
- Zoghbi et al. (2019) Zoghbi, A., Miller, J. M., & Cackett, E. 2019, ApJ, 884, 26, doi: 10.3847/1538-4357/ab3e31